

Double Tops and Double Bottoms
In mastering technical analysis, one of the key pattern formations is the double top and double bottom, and it is essential that you understand what this is, and that you develop your skills for identifying it, and implementing it in your trading because these patterns will recur time after time. It will provide you with invaluable information when it comes to trading around it.
Double tops and double bottoms will enhance your trading by showing you where potential reversals in price action may occur, whether or not they form the basis of technical support and resistance levels.
Example A
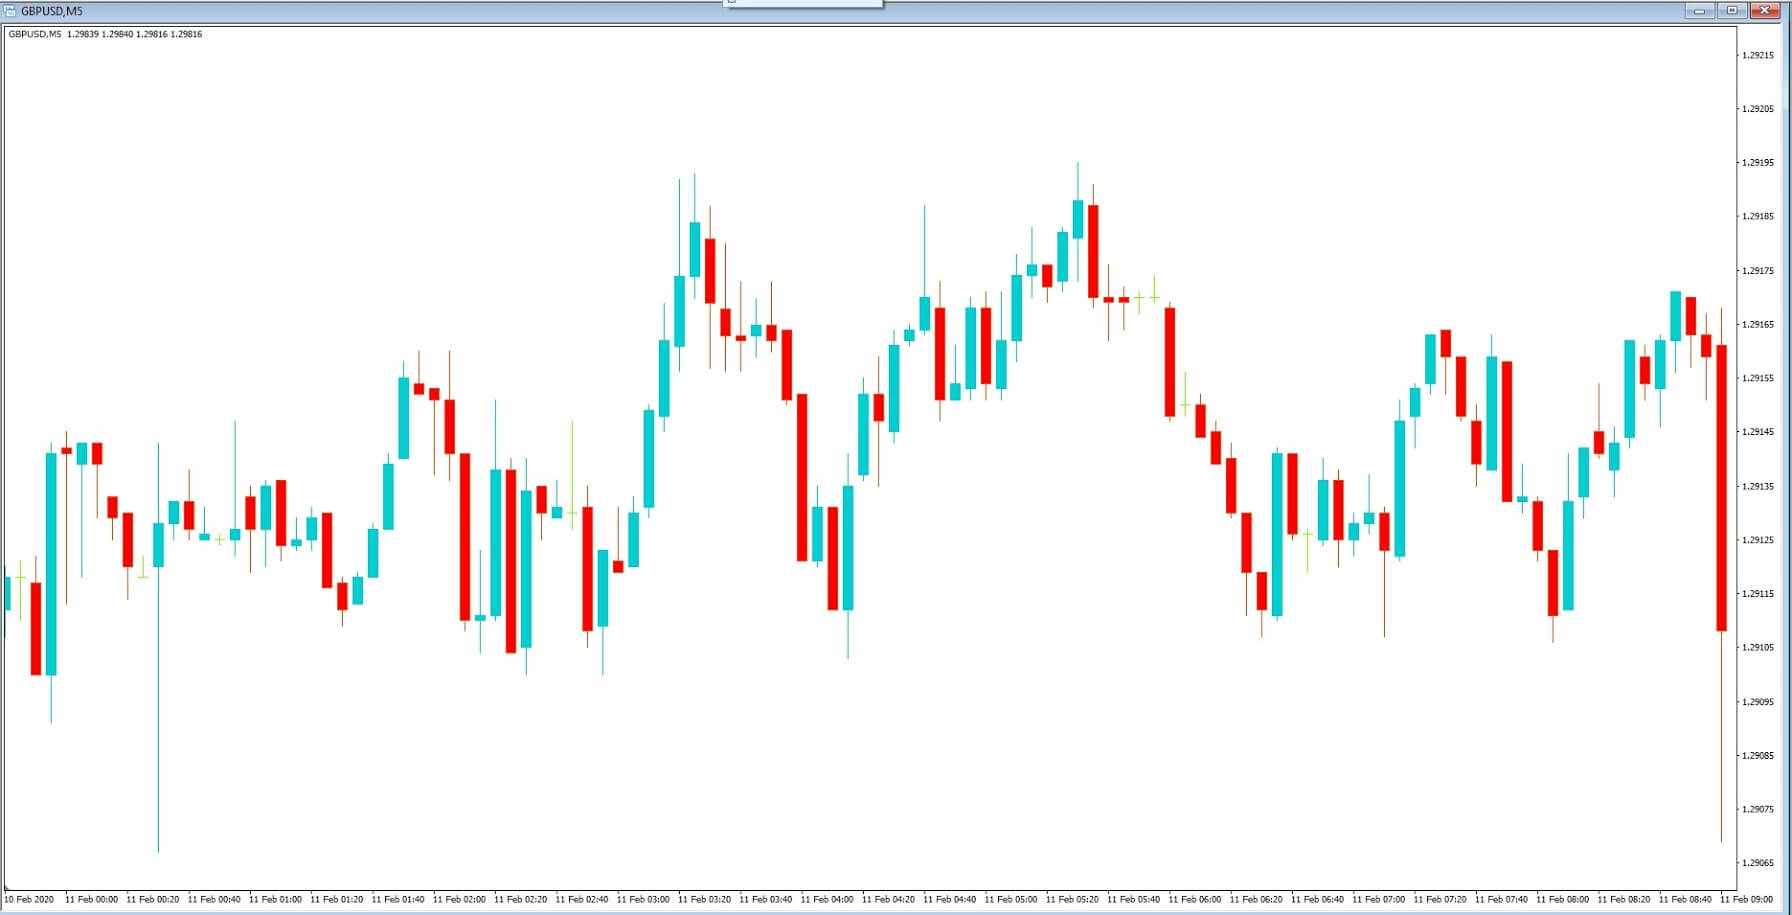
So what exactly is a double top? Let’s take a look at example A, which is a 5-minute chart of the GBPUSD and where only price action is shown on the chart.
Example B
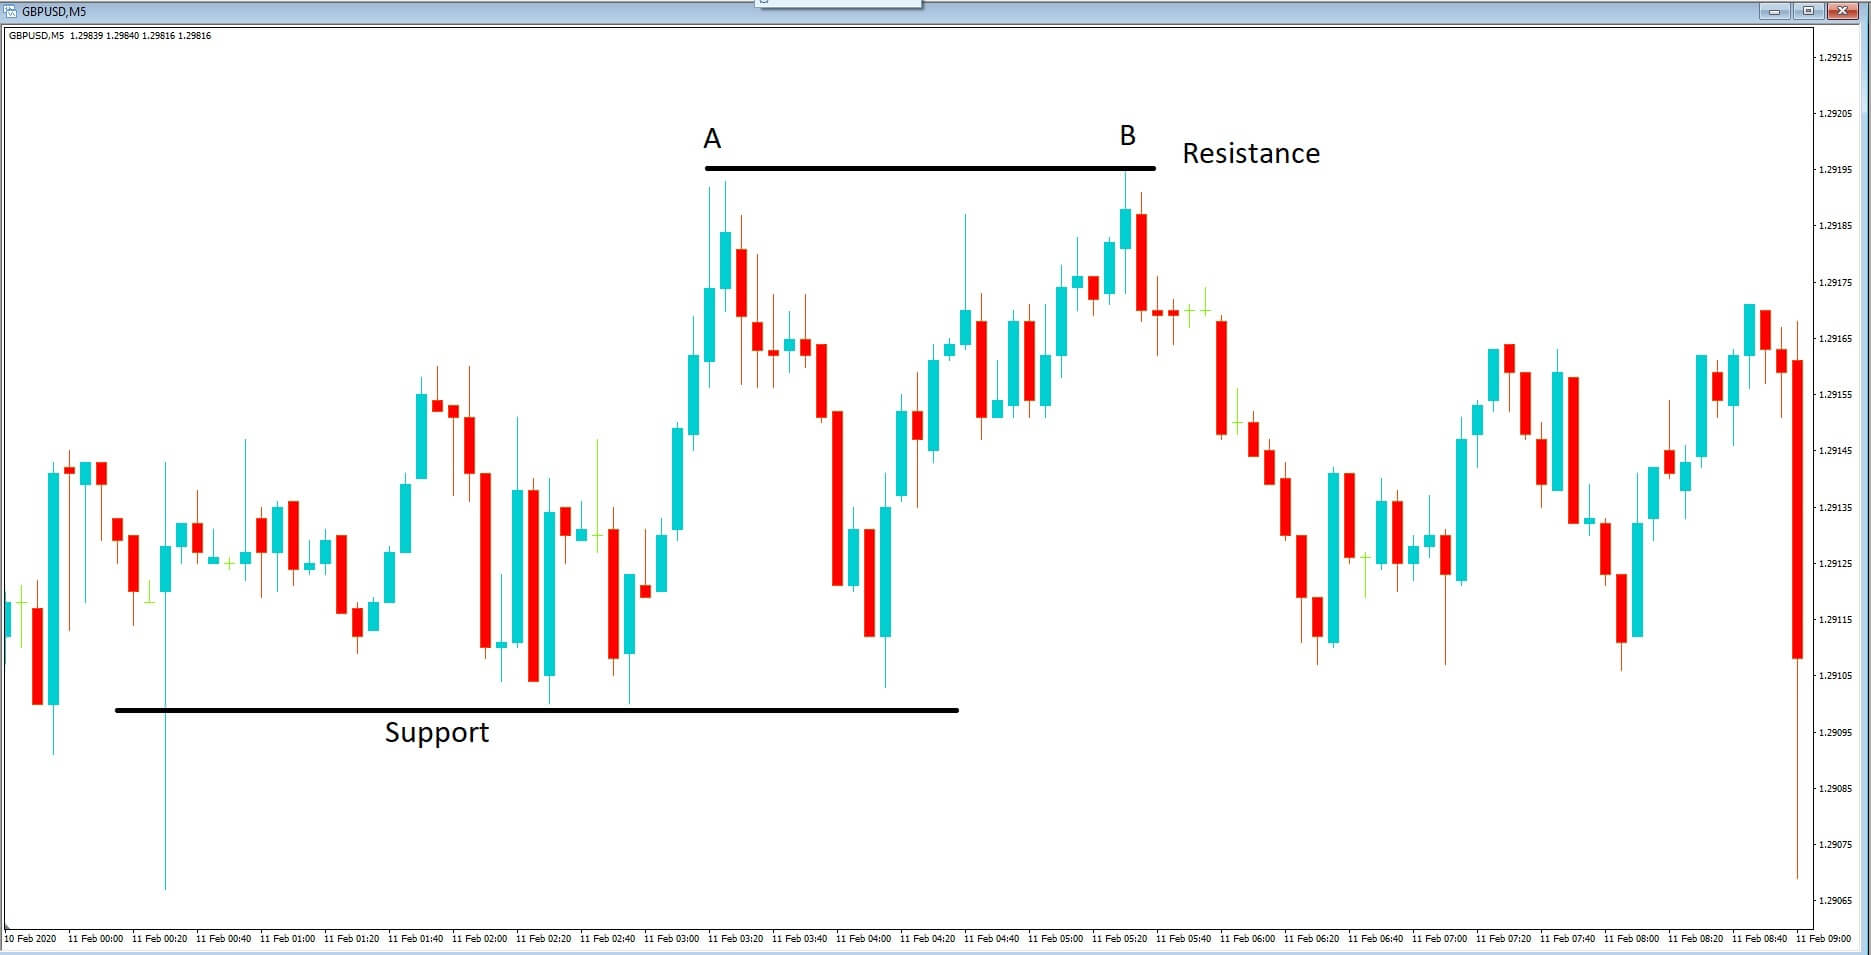
Now, let’s drill down a little further on this chart as per example B, pair and where we have a high at position A and where we have had a pullback, followed by another push higher at position B, and where the price action stopped at the same level as position A, before selling off again.
So what is the rationale behind this double top? Traders read their charts from left to right, because they tell a story of how price action is unfolding as time goes on. Firstly we have the area of support which has seen price action fails to go lower on at least two occasions, which will have been observed by traders, and where price action moved higher from this line, and then ran out of steam at position A, before retreating, and whereby traders would again keenly observes the area of support and therefore started to close out their short positions when price failed to breach the support line while expecting a reversal. This does indeed happen and where we see price action move up to position B, and where traders would have noted the reversal at position A, and used that as a possible area of resistance, and therefore exited their long trades when price failed to move higher than position A, and thus leaving a double top formation.
Example C
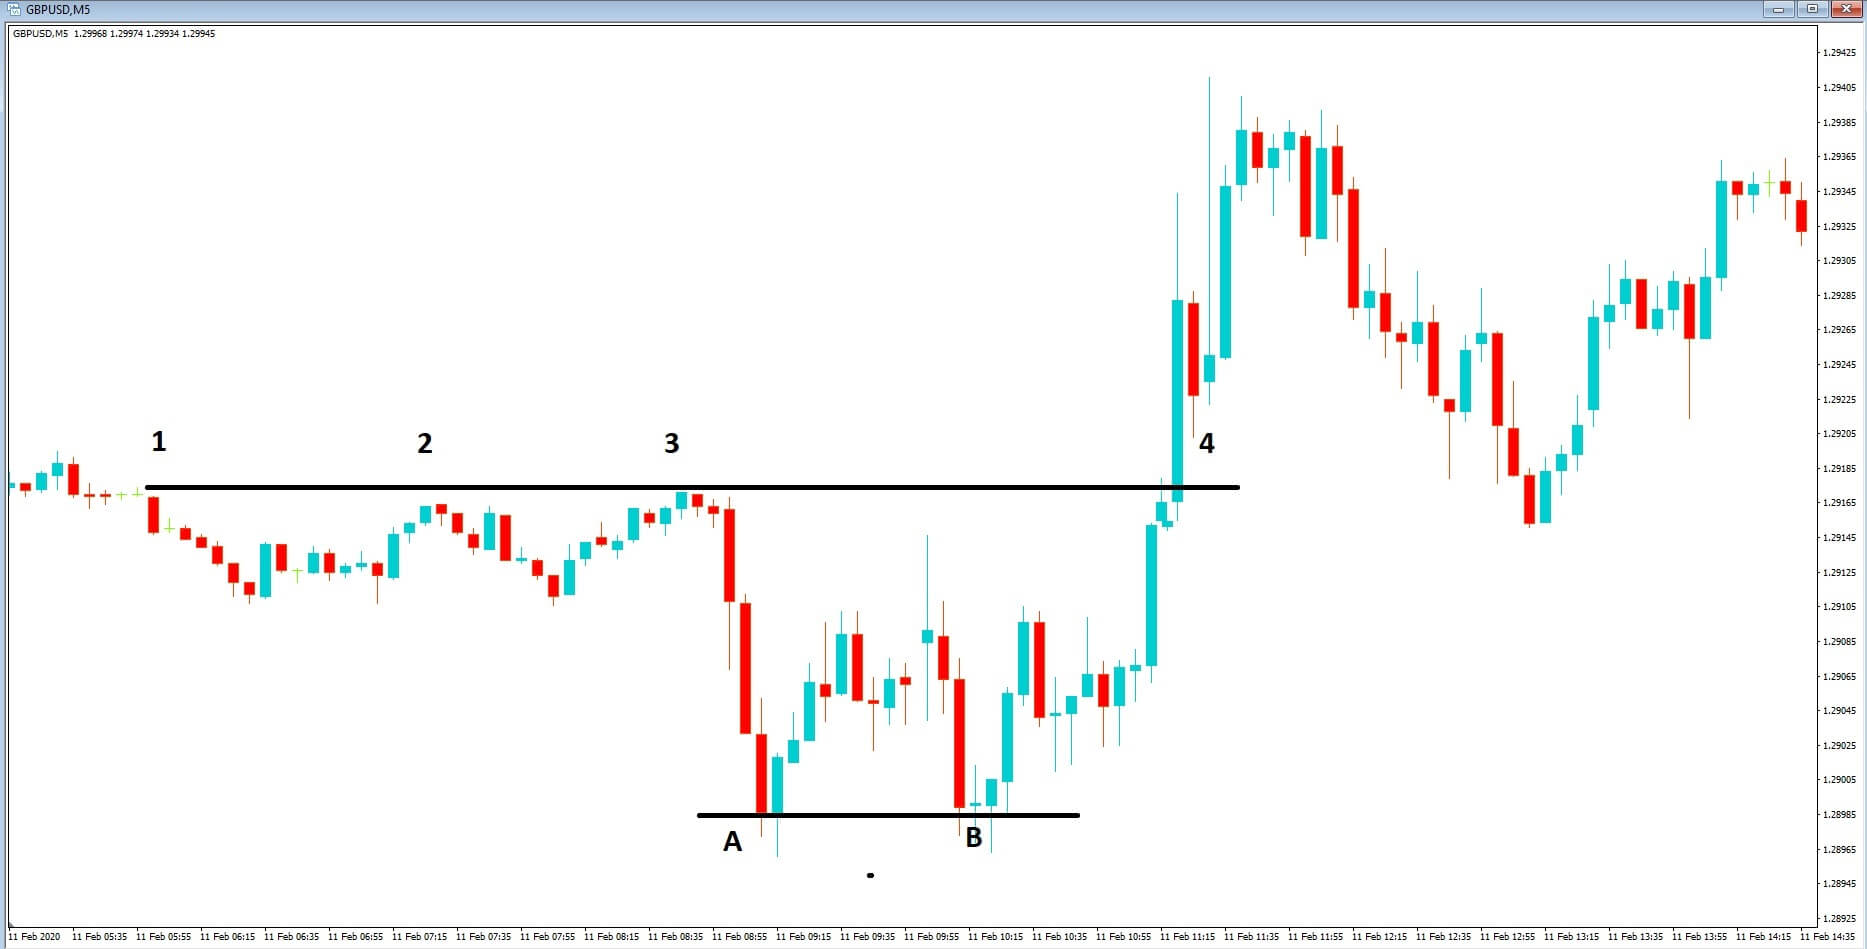
In example C, we have the reverse, which is a double bottom formation, where we can see that price has failed to breach the resistance line at positions 1 2 and 3, before moving lower to position A, and where price action failed to move any lower and where it reversed before failing to reach the resistance line, and then has a second attempt to move lower to the support line at position B. Thus forming a double bottom formation.
Incidentally, we can see that eventually, price action does move higher and breaches the line of resistance at position 4, which then becomes a line of support for future price action.