Introduction
There are some patterns in the market that are widely used by traders across the world, and the Double Top is one of them. It is a simple and straightforward method of identifying the potential selling trades in any given Forex pair. Most of the novice traders who trade this pattern tend to face problems as they do not know how to use it correctly. Hence, for those types of traders, we are putting this piece together. By the time you finish reading this article, you will exactly know to identify and maximize gains using the Double Top chart pattern.
Double Top Pattern
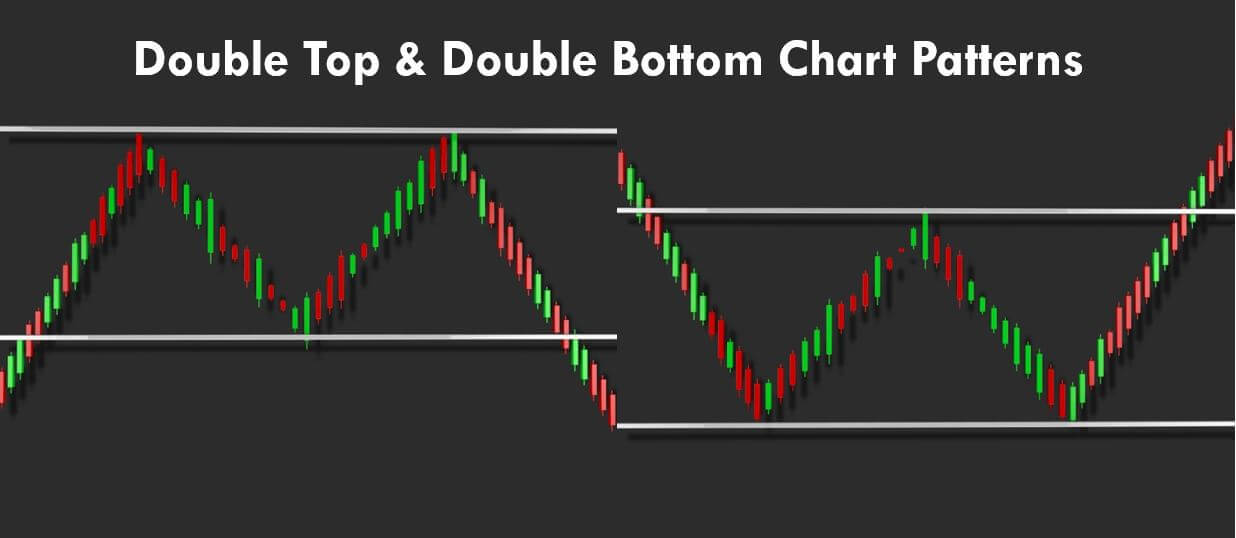
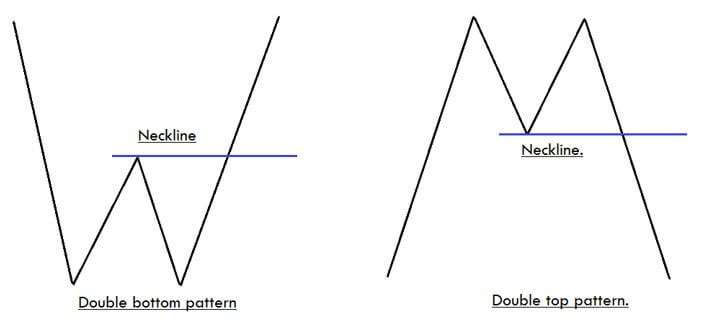
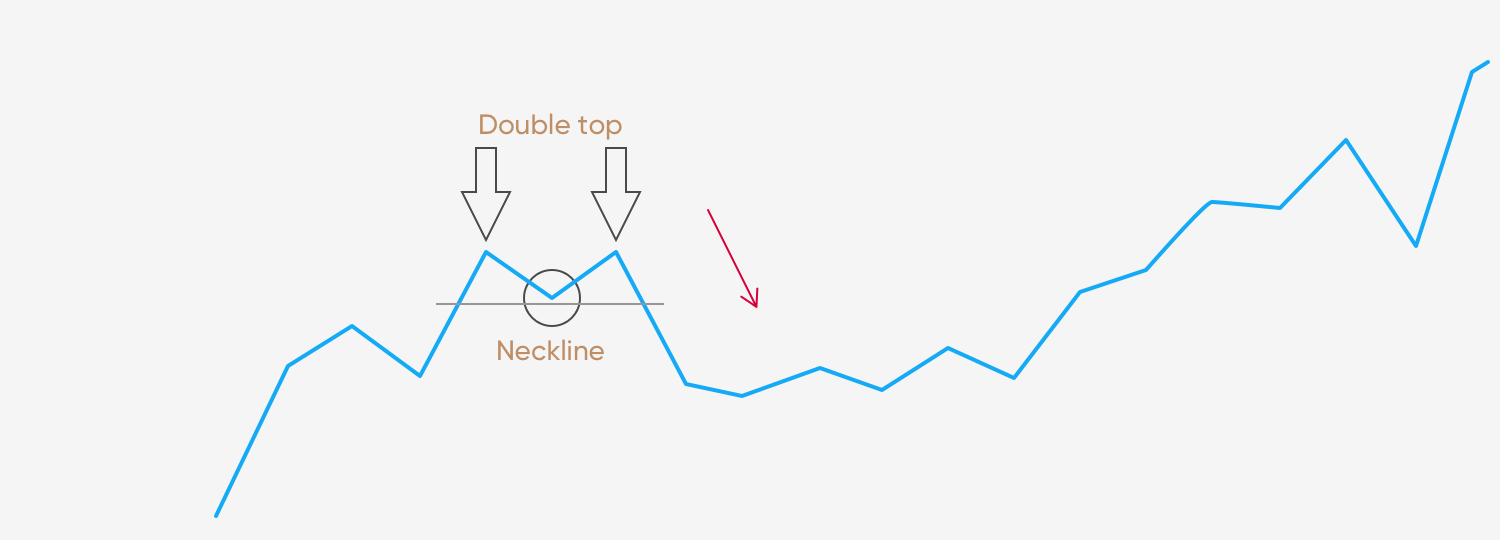
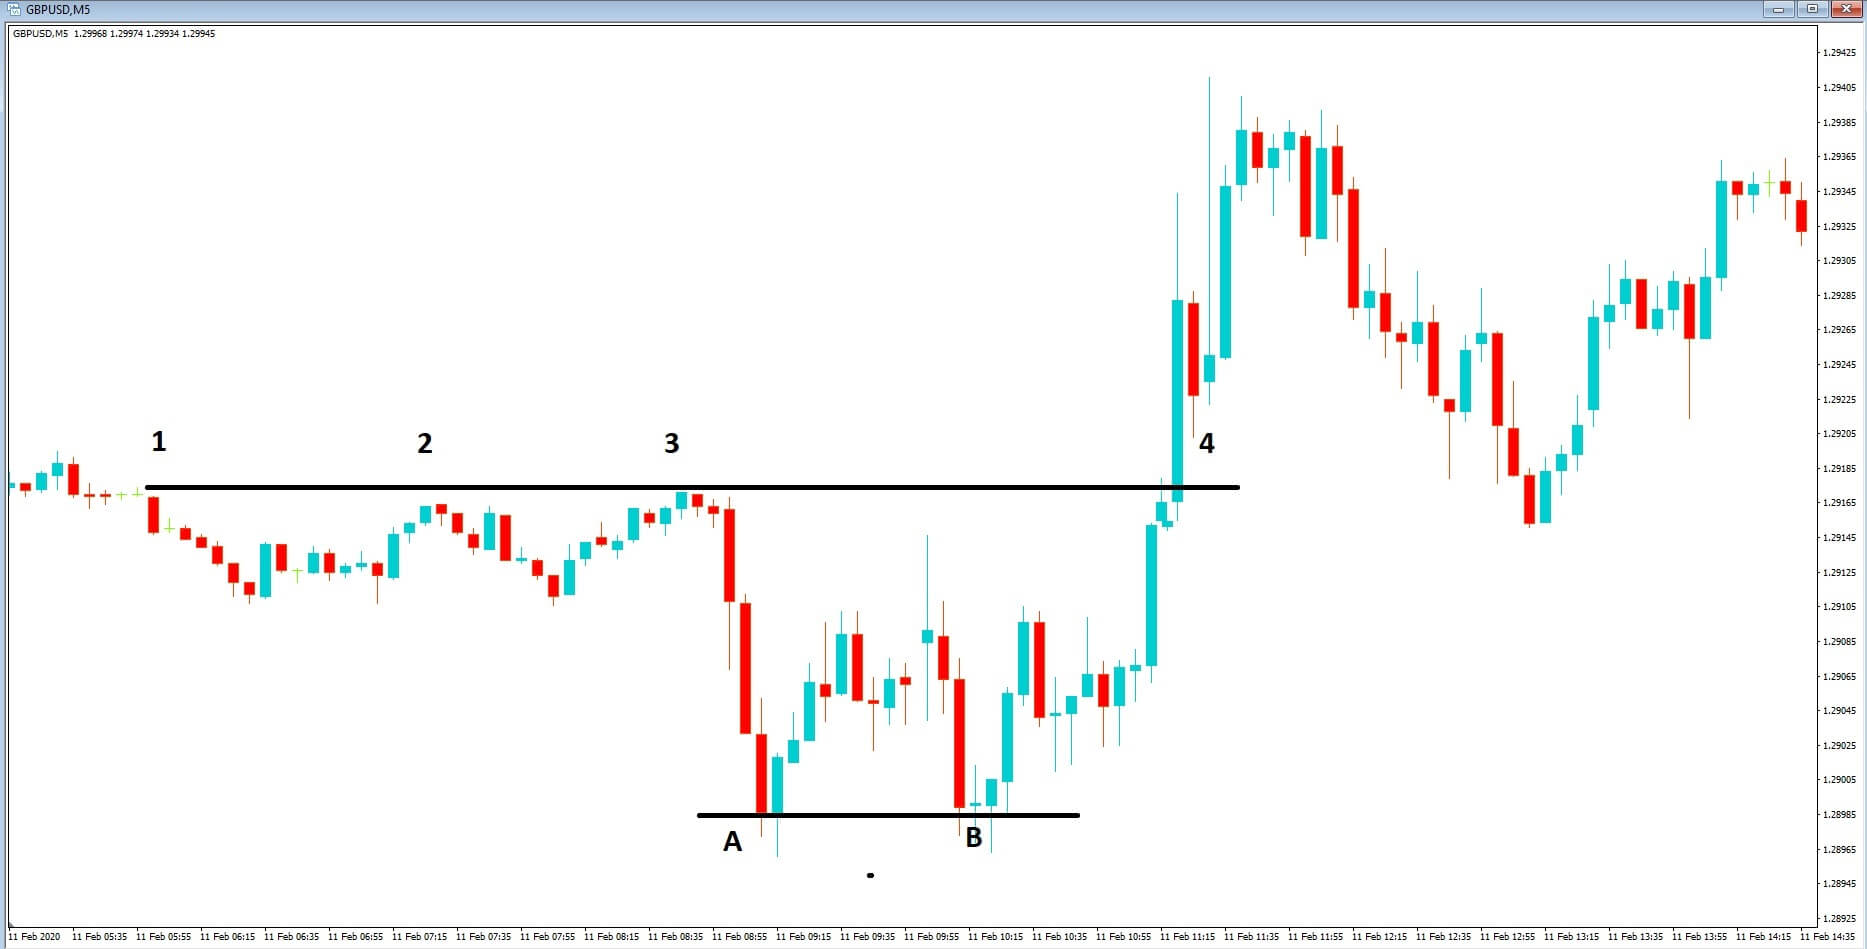
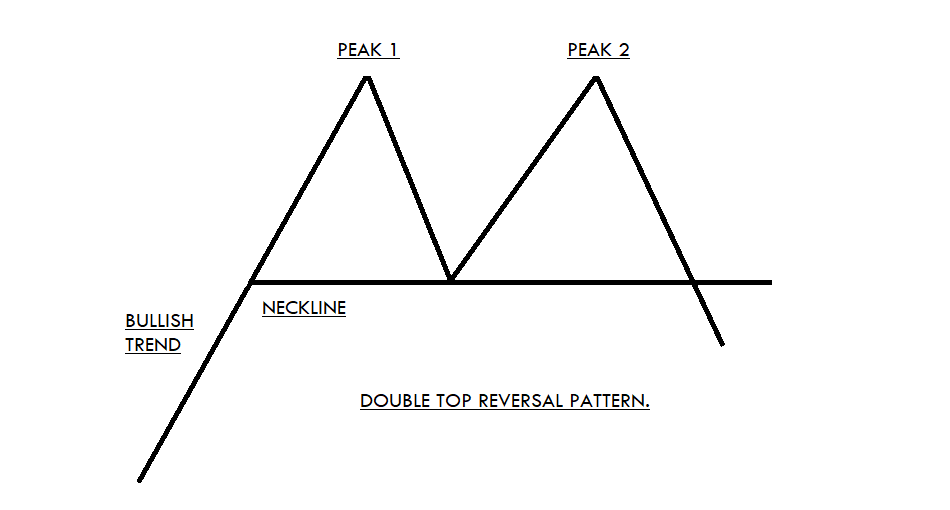
The Double Top is a bearish reversal pattern that is usually formed at the end of a bullish trend. The two consecutive rounding tops complete this pattern with approximately the same highs. The first rounding top should be formed at a significant resistance area. Most of the time, the momentum of the second round top is quite weak, and this indicates the buyers are getting exhausted.
This eventually means that the sellers are now going to take control. Both the round tops retrace at a significant support area, which we call the neckline. The identification of this pattern can be comprehended as the professional traders and investors trying to obtain the profits from the bullish trend. And now, the markets are ready to publish a new selling trend.
Psychology Behind The Double Top Pattern
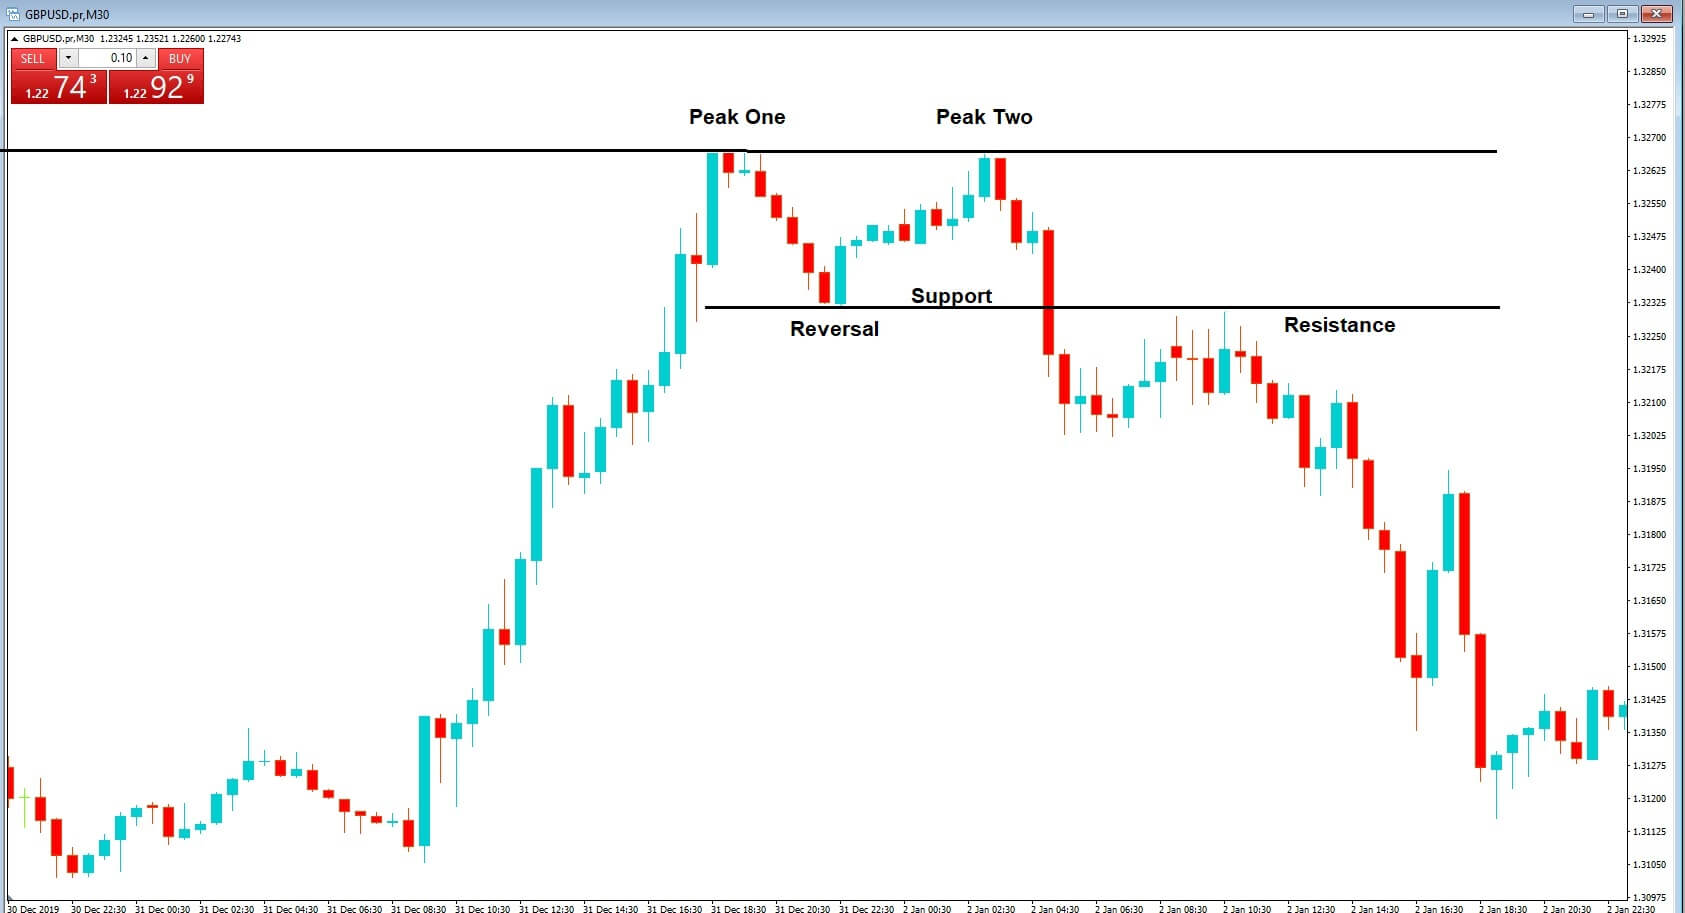
We know that the Double Top pattern occurs at the major resistance area. This pattern indicates when the price action reaches a significant resistance area, the buyers are now afraid to buy because of resistance. On the other hand, the sellers are hitting the sell orders at the same resistance area.
At this point, when the price action is pulled back to a significant support area, which we called the neckline, it shows that the buyers are now buying again at major support areas to print brand new higher high. However, when the price action reaches the resistance area again, buyers fail to print a brand new higher high. As a result, they start to book the orders, and now the sellers are gaining control. Hence the price action tends to move in the opposite direction.
Double Top Pattern – Trading Strategies
There are several ways to trade the Double Top chart pattern. But the strategies we are going to share here are well-proven methods. Also, we have backtested these strategies time and again to make sure they are accurate.
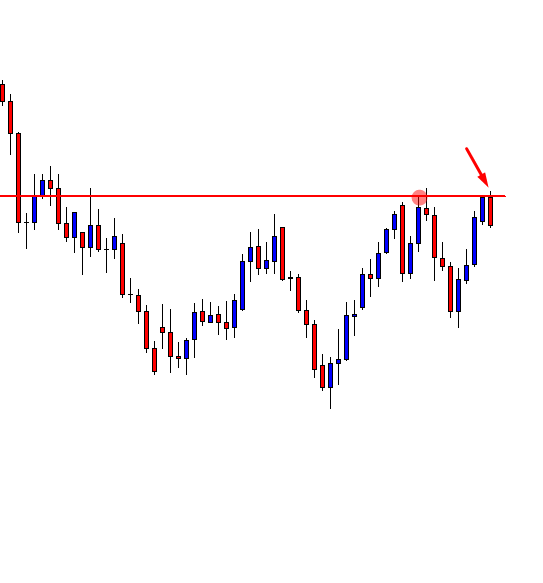
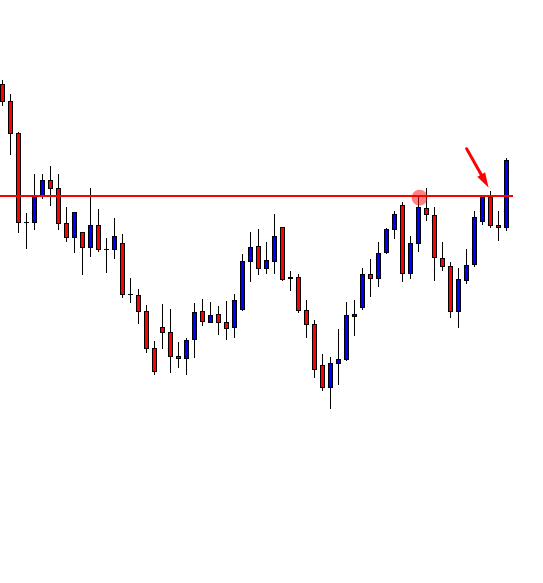
Double Top Pattern + Bearish Candlestick Patterns
There are various bearish candlestick patterns that are widely used by the traders in the market. For this strategy, you can use any of the bearish candlestick patterns. Some of the most commonly used bearish candlestick patterns are Bearish Engulfing, Evening Star, Shooting Star, Hanging Man, Three Black Crows, etc.
The idea is to identify any of the above mentioned bearish candlestick patterns near the second peak. If you find any of these patterns, you can go short. Make sure to place the stop-loss above the resistance line. We can place two or more TP orders. First, take-profit must be at the neckline, whereas the second one can be placed two times above the size of the pattern formed.
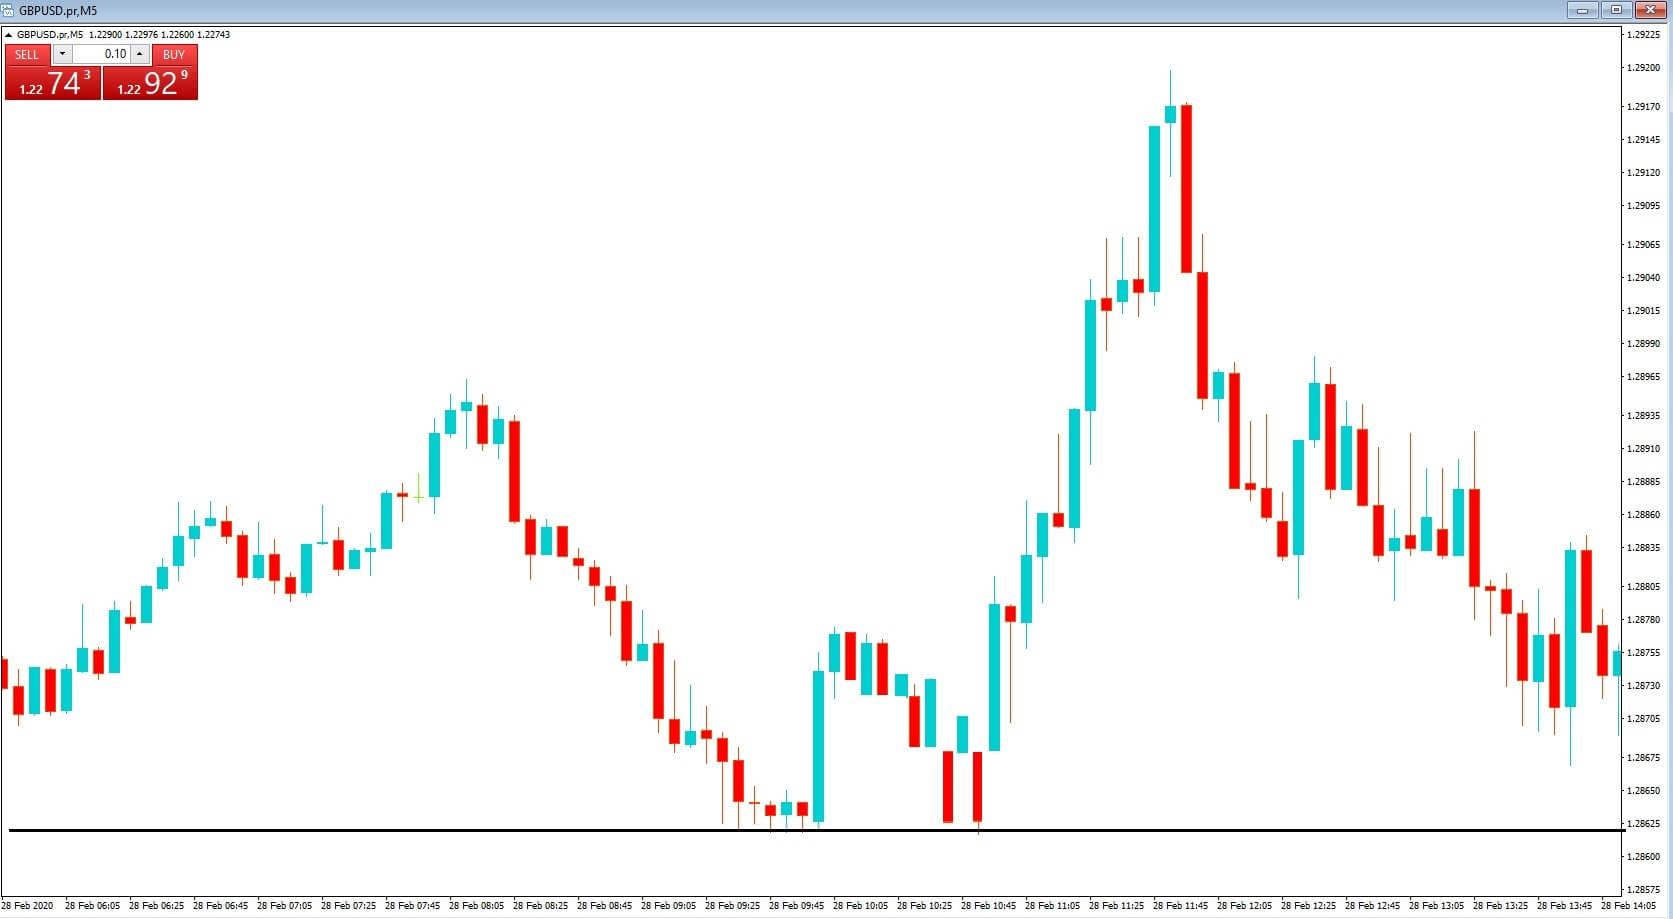
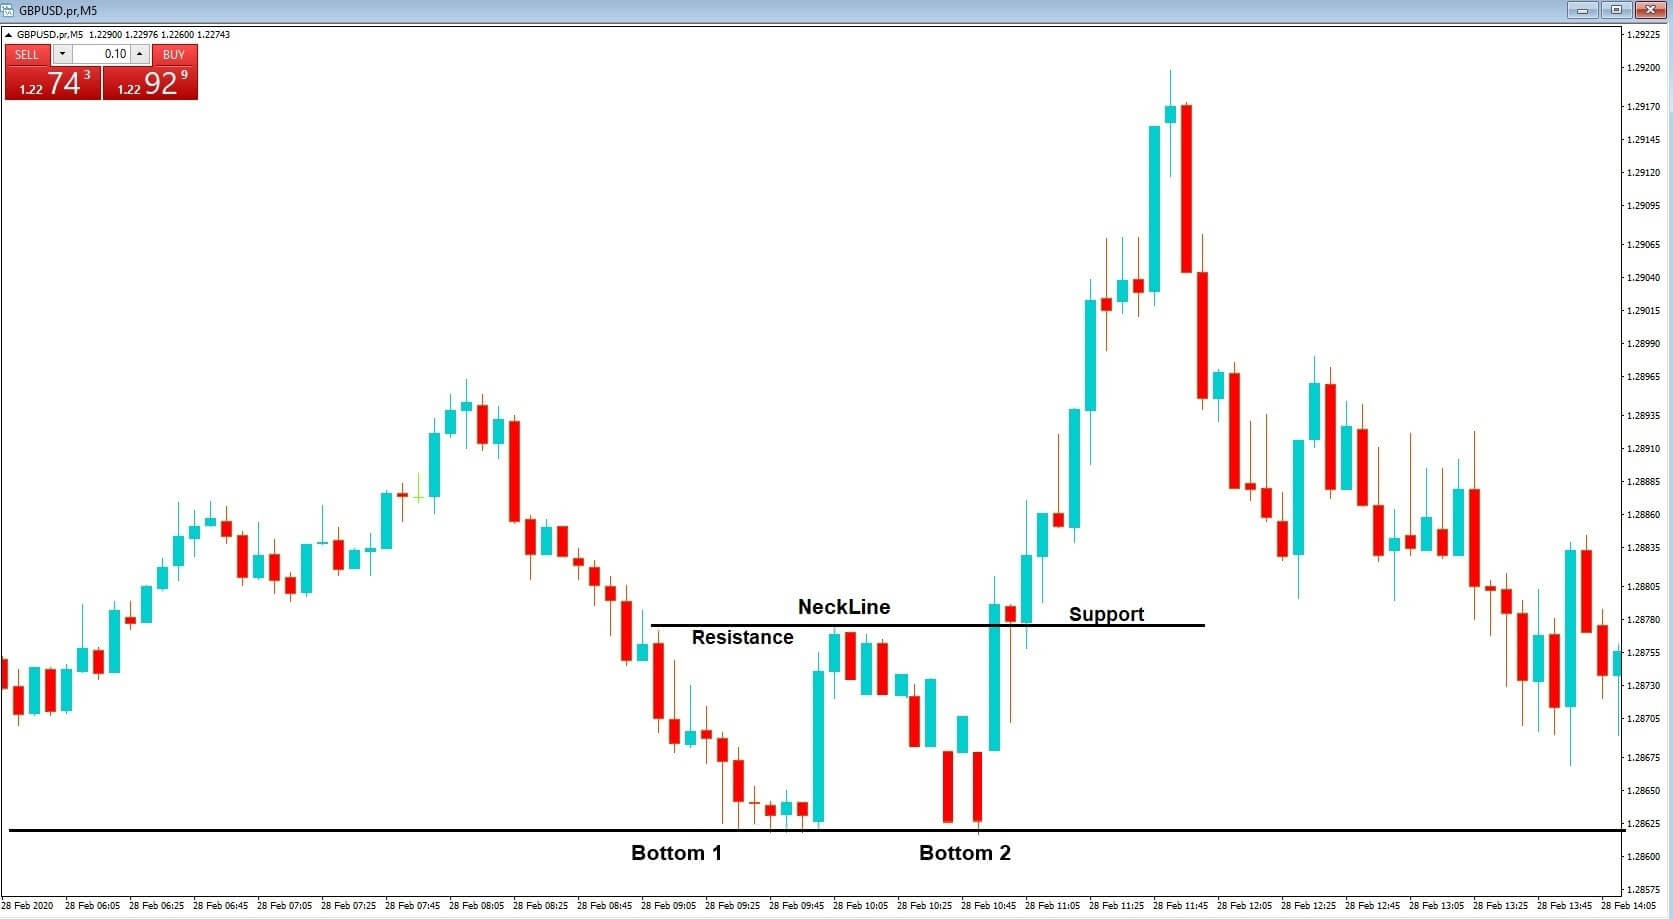
Identifying the Pattern
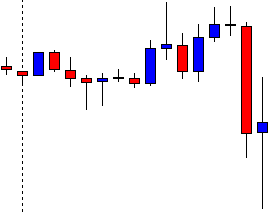
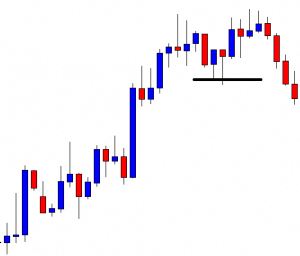
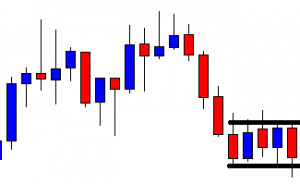
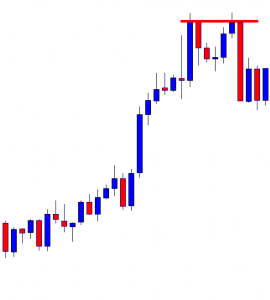
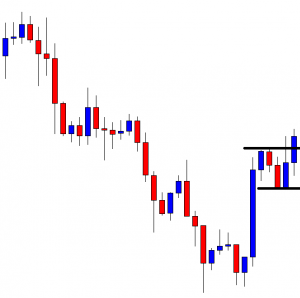
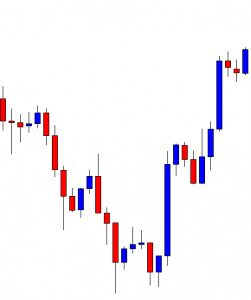
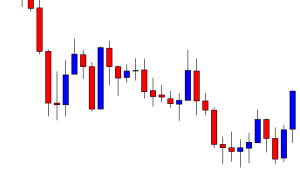
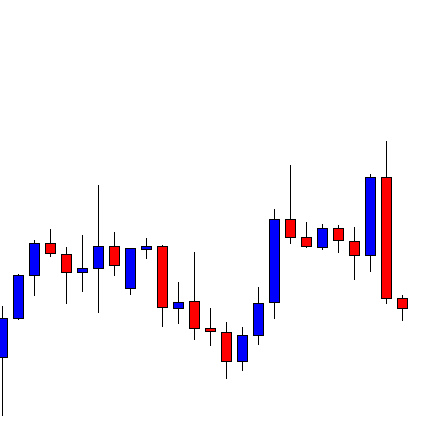
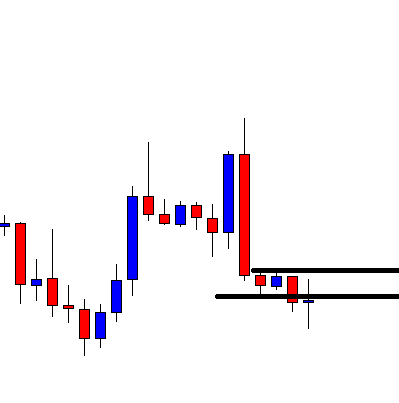
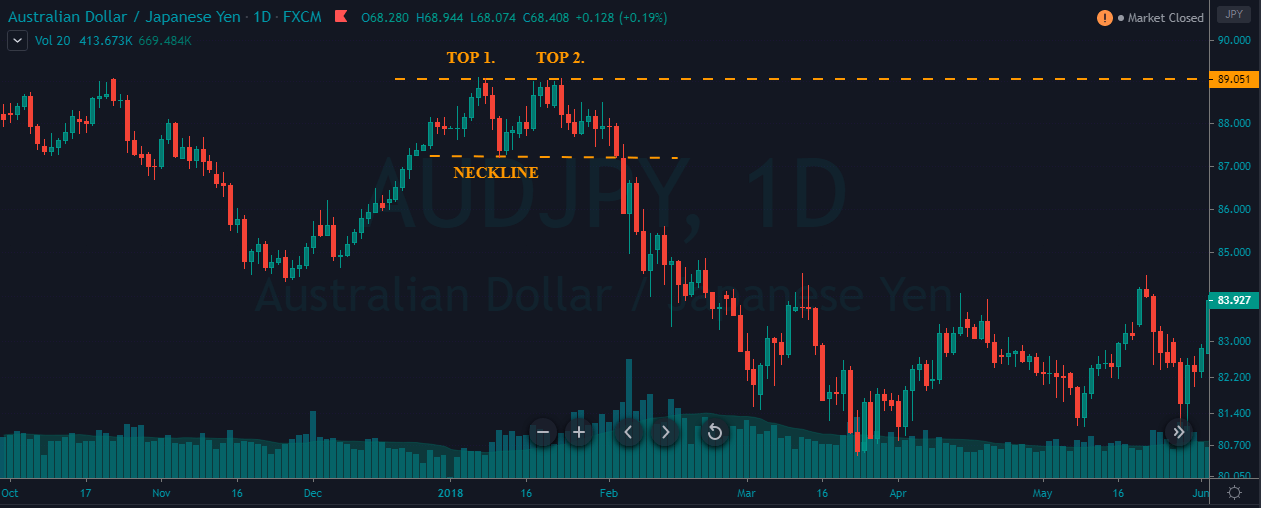
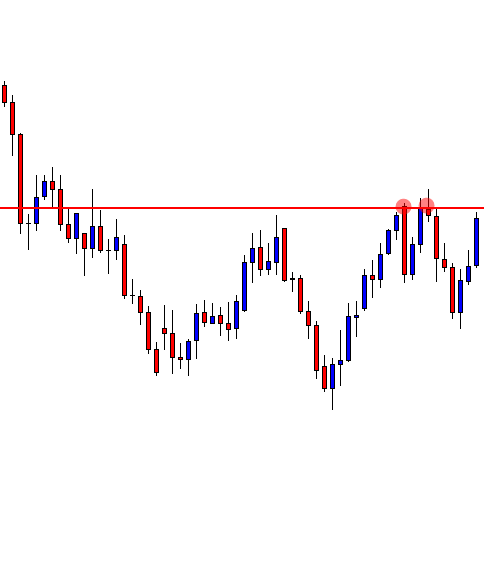
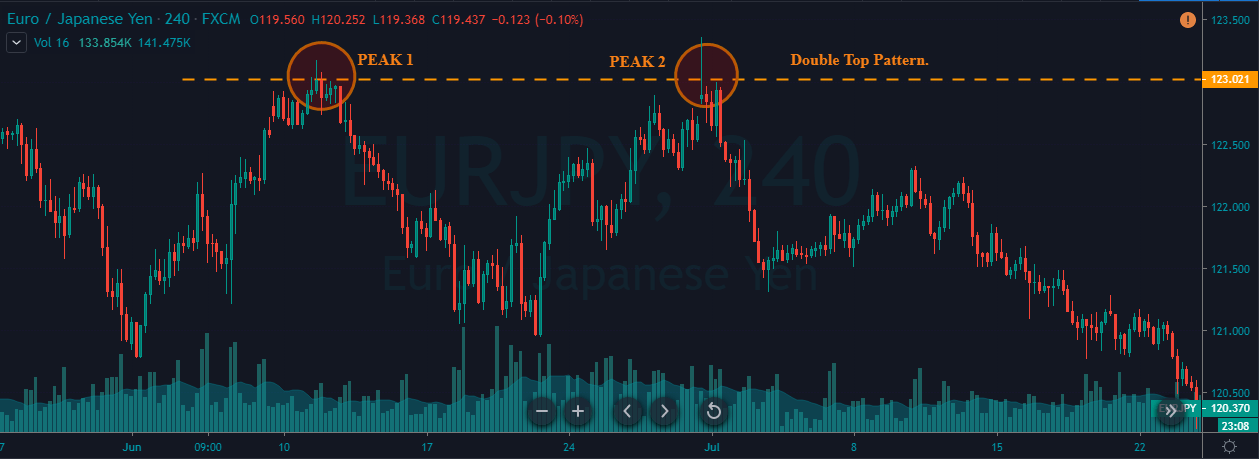
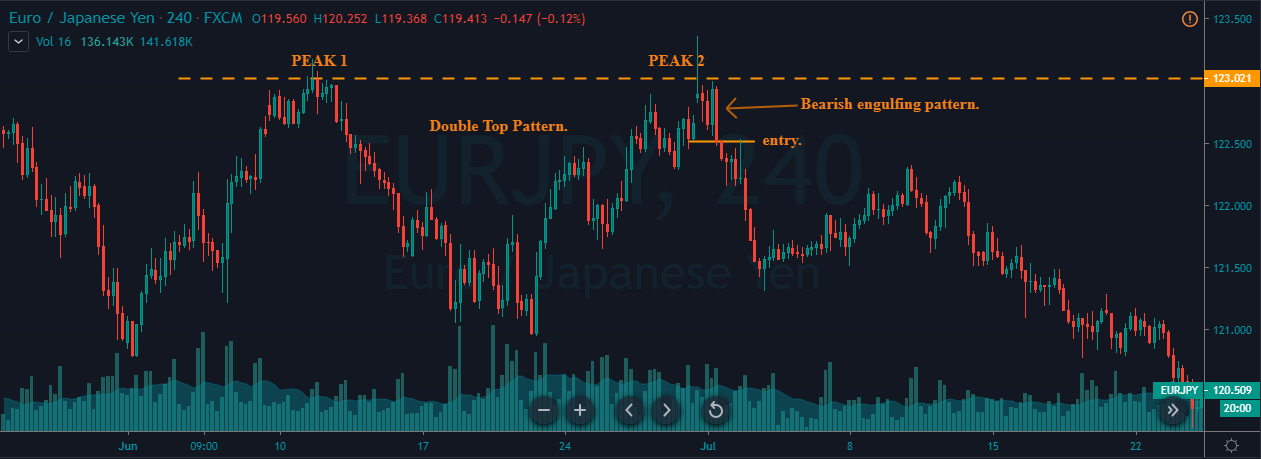
In the below EUR/JPY chart, we have identified the formation of a Double Top pattern.
Entry
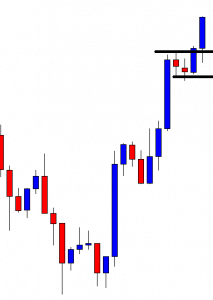
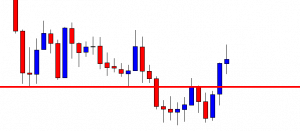
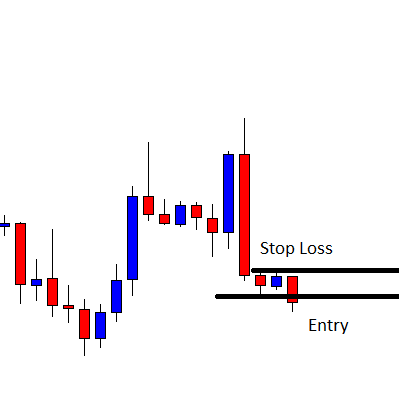
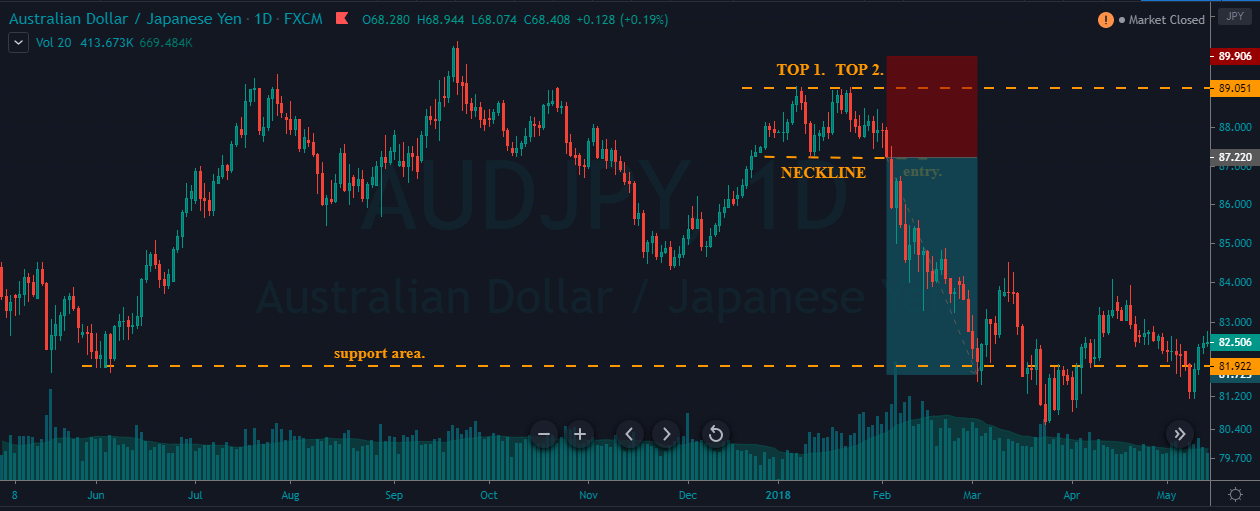
As we can see in the below chart, the price action prints a Bearish Engulfing candlestick pattern right after the second top. This indicates that the sellers have completely absorbed the buyers, and now it’s time to go short in this pair. We took a sell entry at the close of the Bearish Engulfing candle.
Stop-Loss & Take-Profit Placements
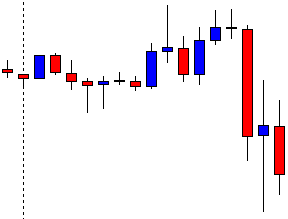
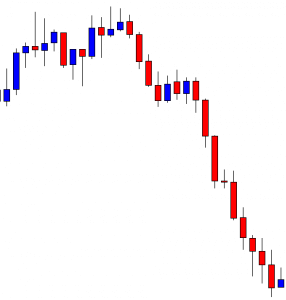
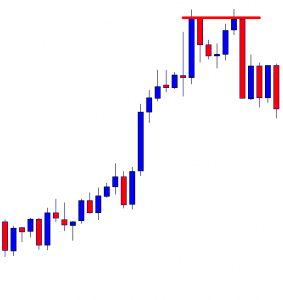
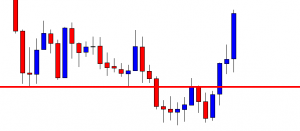
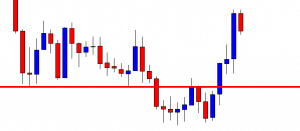
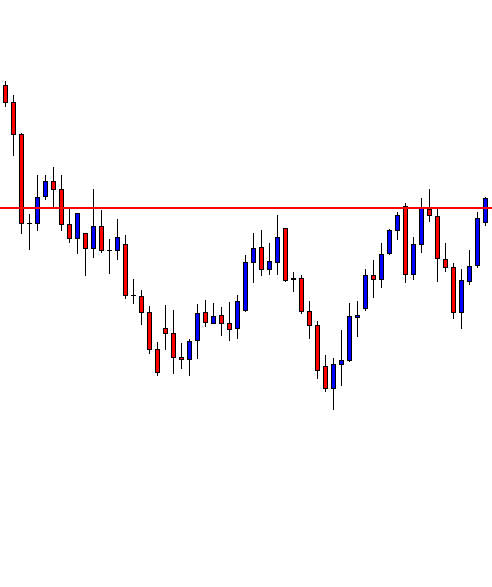
As we can see, we have entered the market at the closing of the Bearish Engulfing candle and placed the stop-loss just above the resistance line. This pattern has the highest odds of working in our favor; hence we can go with smaller stop-loss. Because, whenever this set-up is found, the price action has a very little chance to spike.
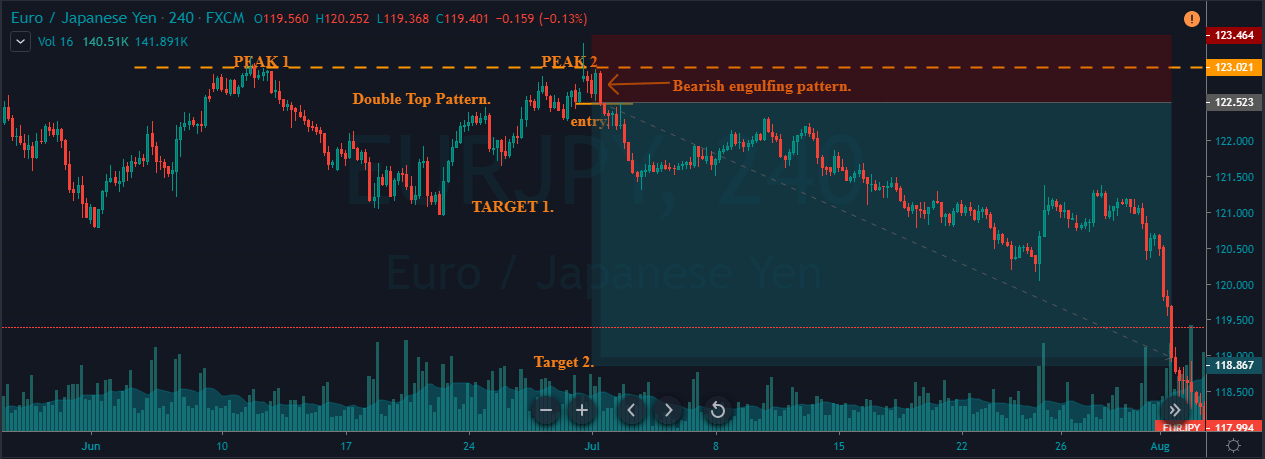
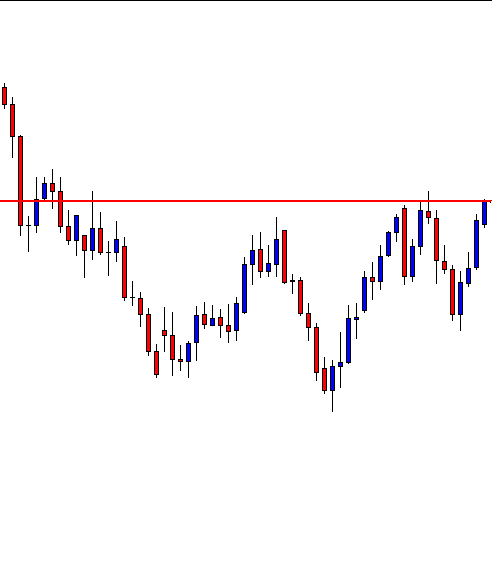
As discussed, the first take-profit was placed at the neckline of the pattern, and the second take-profit was placed double the size of the complete pattern. But, please decide the placement of TP according to your trading style. Remember that you can close your position wherever you want.
Double Top Pattern + RSI
In this strategy, we have paired the Double Top pattern with the RSI indicator to identify accurate shorting signals. As you might have probably known, RSI stands for the Relative Strength Index. It is a momentum indicator developed by the J. Welles Wilder Jr. in 1978. This indicator oscillates between the traditional levels of 70 and 30. When this indicator reaches the 70 level, it indicates that the market is in an overbought condition, and it indicates the market is oversold when the indicator reaches the 30 level.
Here, the strategy is simple. When the price action hits the second peak and starts to struggle, see if is the RSI is at the overbought market conditions. If it is, then it can be considered a potential sell signal.
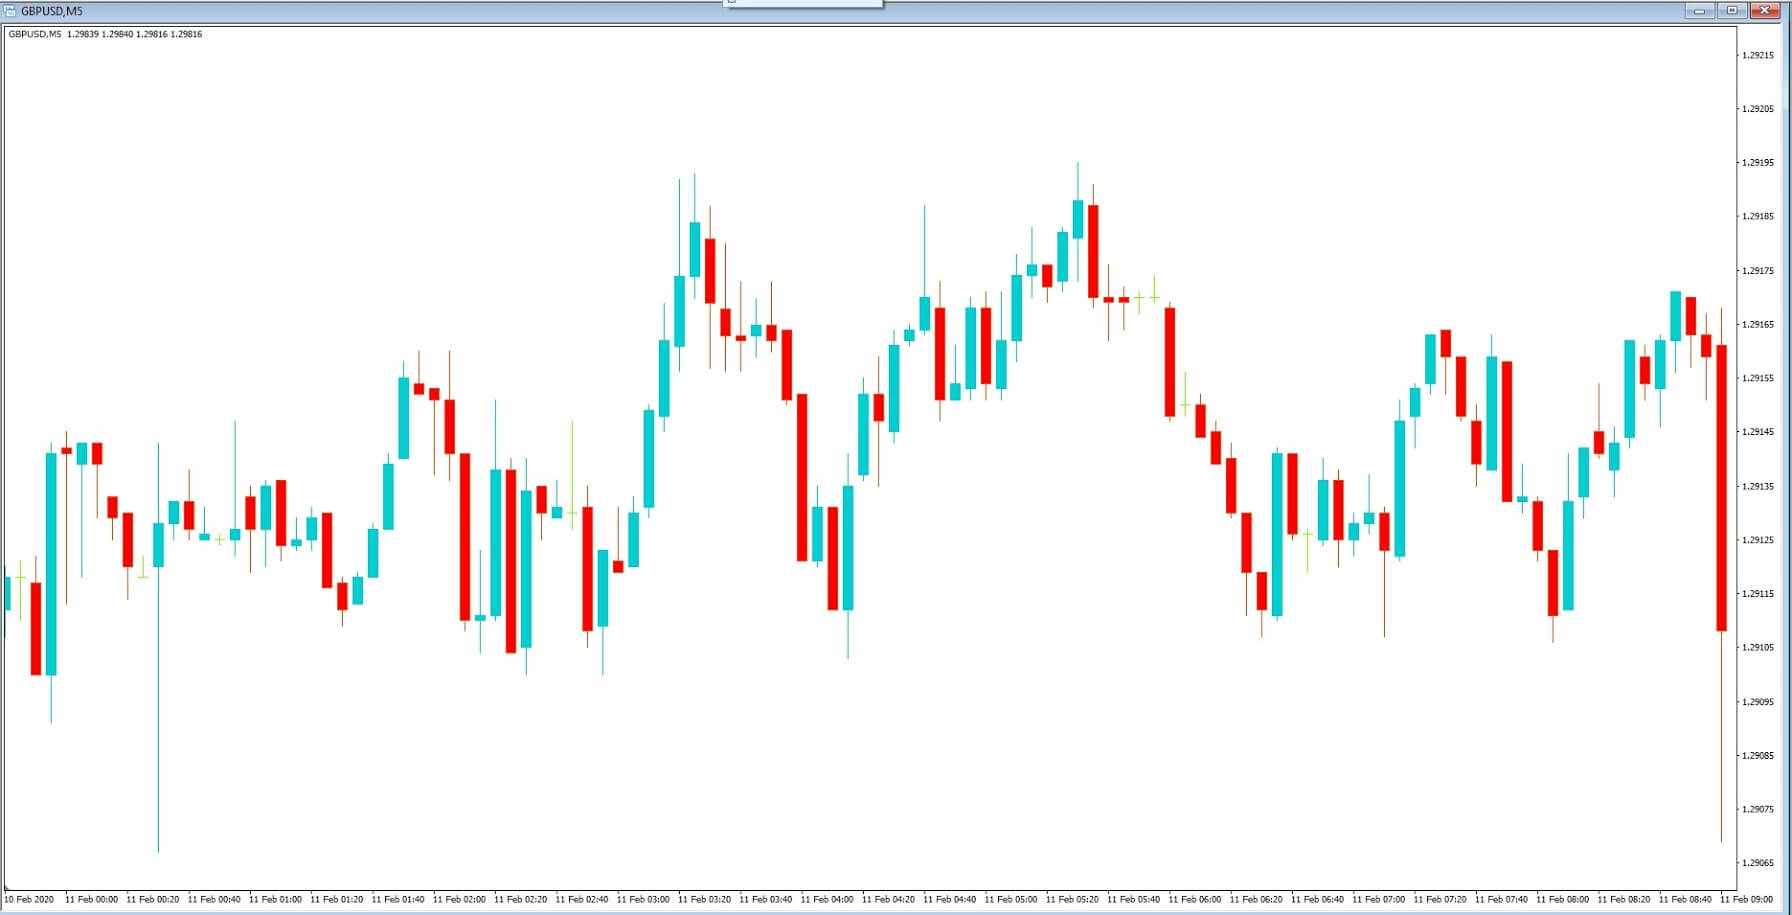
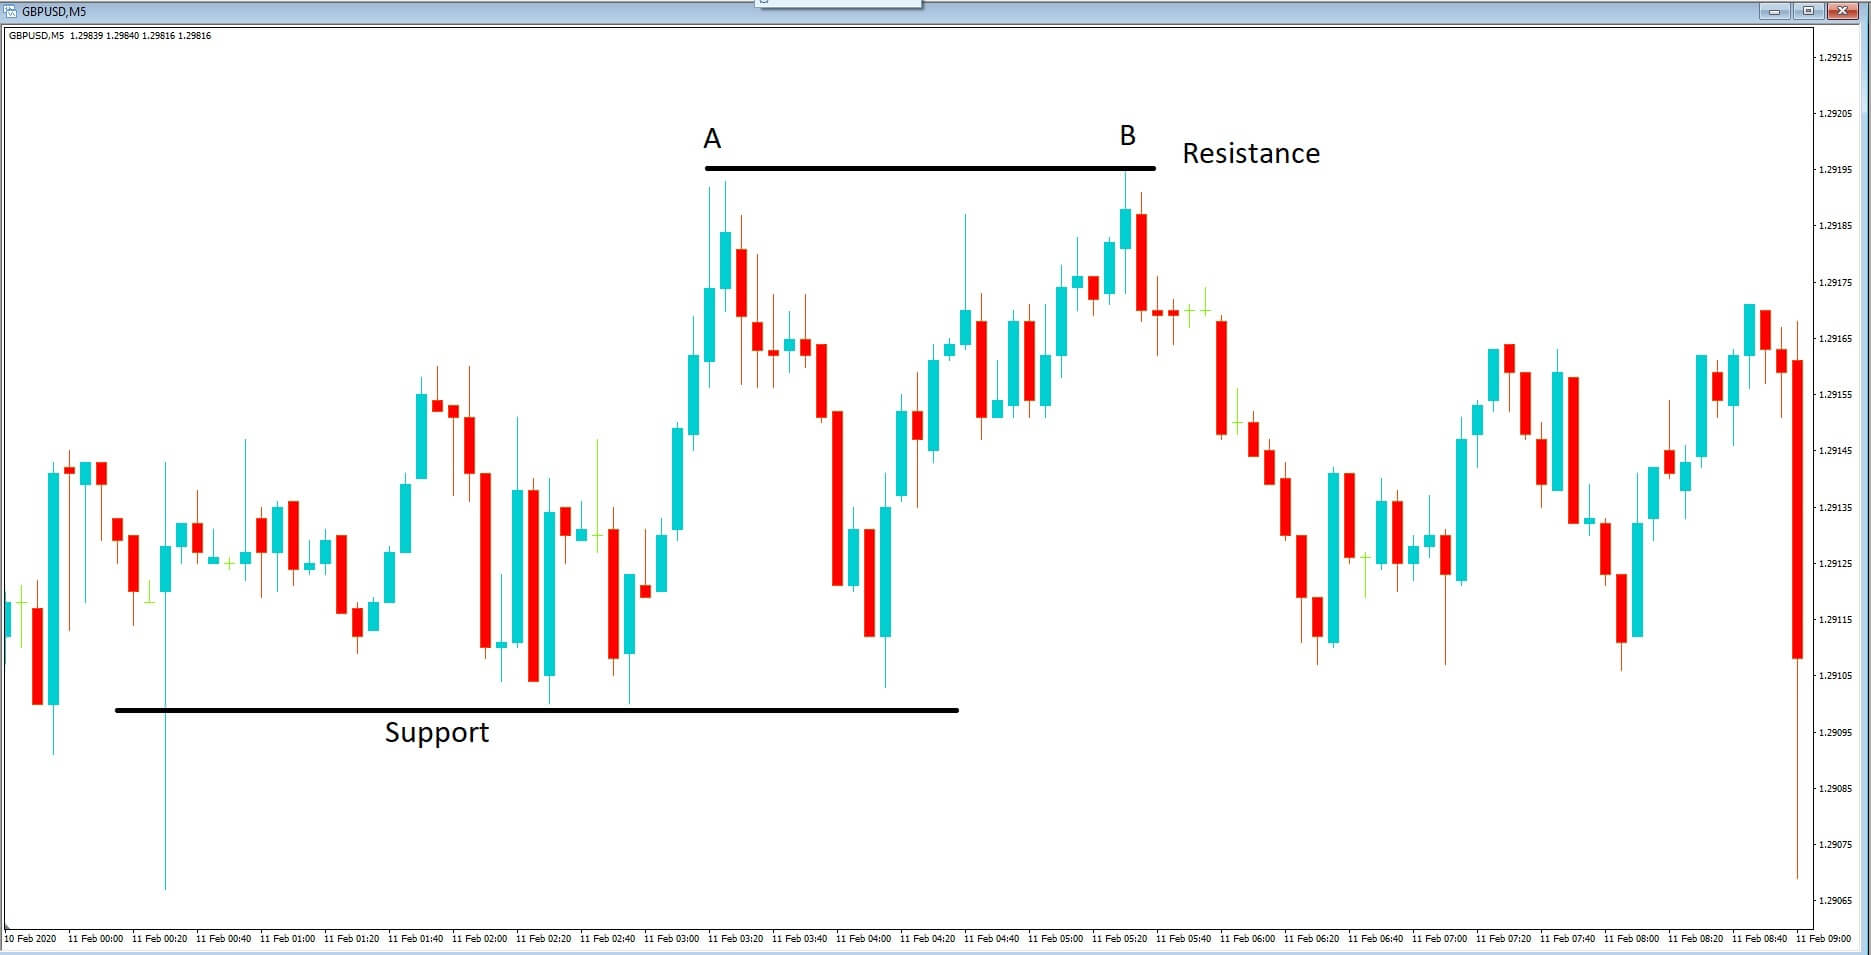
Identifying the Pattern
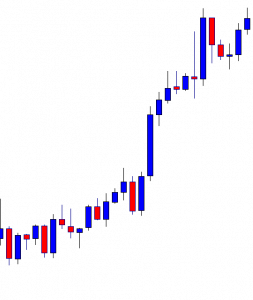
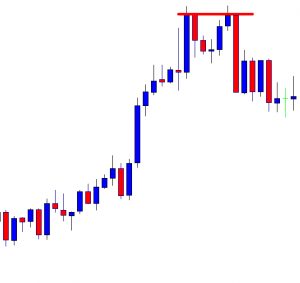
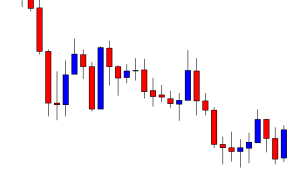
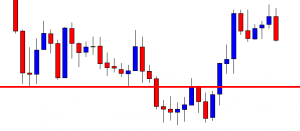
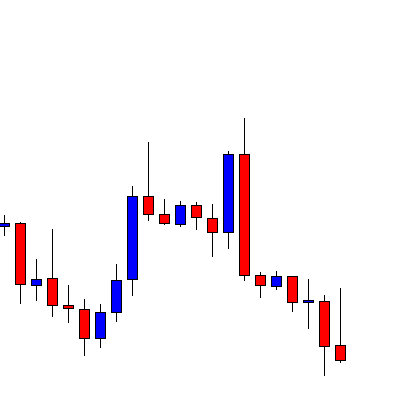
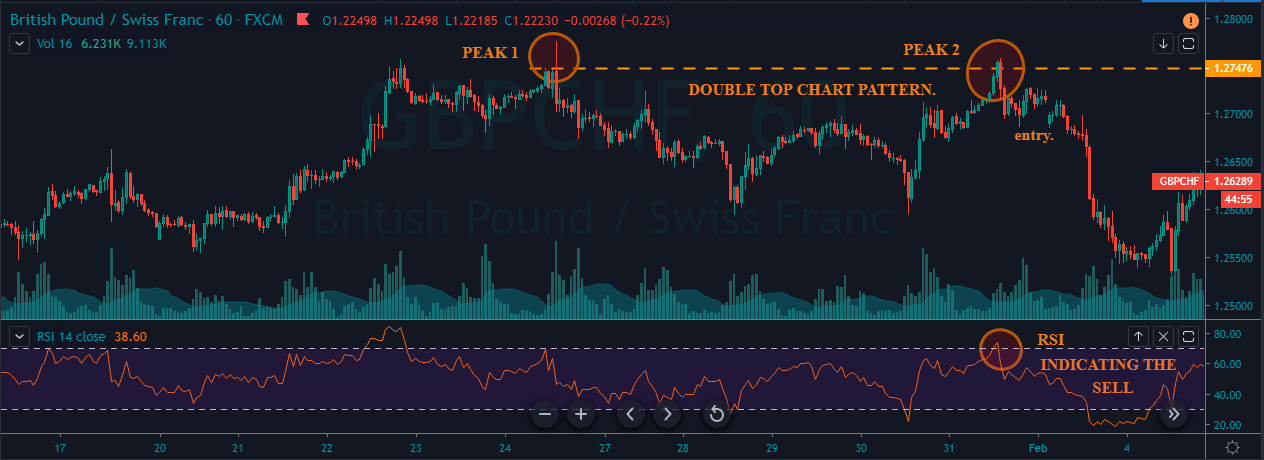
We have identified a Double Top chart pattern in the below GBP/CHF Forex pair.

Entry
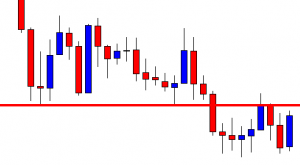
In the below chart, we can see the first peak and second peak of the pattern being quite strong. When the price action approached the second peak, it dropped immediately. This shows that the buyers are exhausted, and sellers took over the show. At the same time, we can also see the RSI giving a sharp reversal in the overbought area. Hence we can confidently go short in this pair.
Stop-Loss & Take-Profit
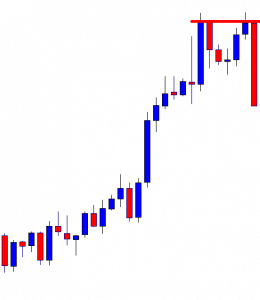
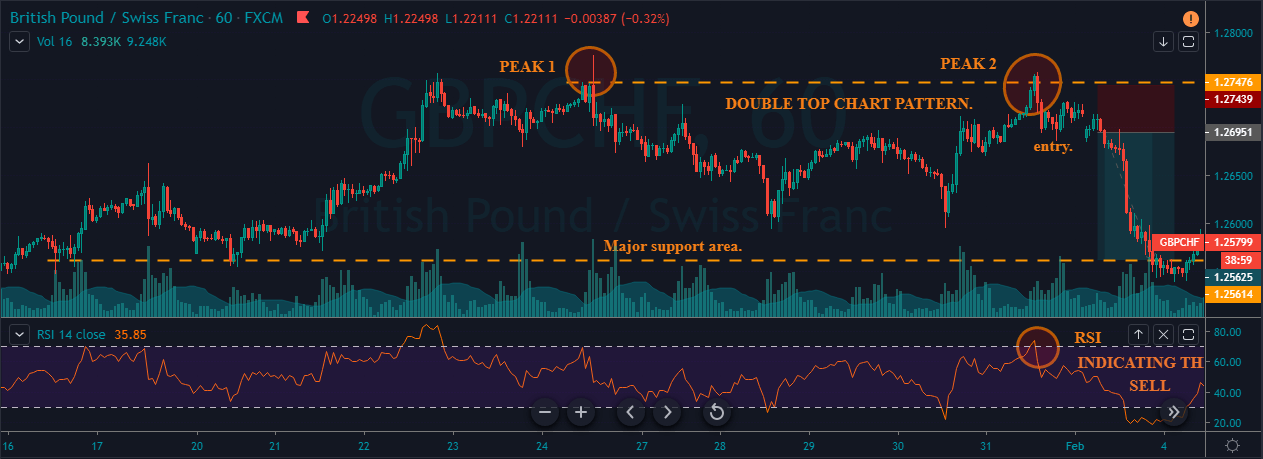
We went short when the criteria are fulfilled and placed the stop-loss just above the entry. Take-profit was placed at the higher timeframe’s support area. Overall, it was a 100+ pip trade. If there is no significant support area for you to exit your positions, you can close them when the RSI reaches the oversold area.
Conclusion
Pattern trading is the easiest way to make more profits in the market. Some patterns provide a great risk to reward trades, and some do not. The Double Top is one such pattern that offers some of the best risk-reward entries. This pattern works well on all the trading timeframes. Make sure to know the logic behind this pattern before trading so that any potential mistakes can be avoided. All the very best!