Categories
Forex Daily Topic Forex Price Action

Intraday Trading: Watch Out for Highest High/Lowest Low

In today’s lesson, we are going to demonstrate an intraday chart that ends up offering an entry. Intraday trading can be prolific if it is done in the right way. In today’s example, the price heads towards the North by making a good bullish move. It seems that the bull is in control. However, the price gets bearish later and ends up offering entry to the sellers. Let us find out how that happens.

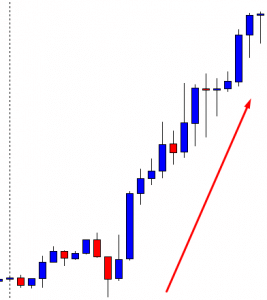
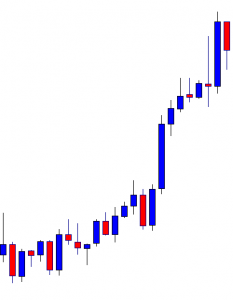
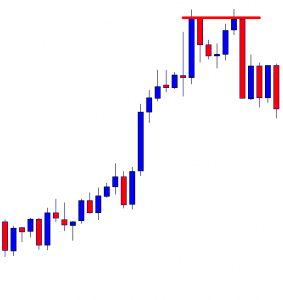
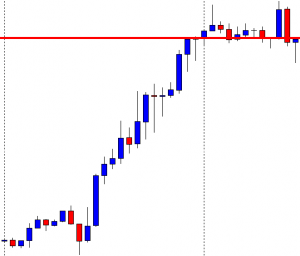
It is an H1 chart. The chart shows that the price makes a good bullish move. The last candle comes out as a hanging man. The price does not make any bearish correction, so the daily candle closes without having an upper shadow. It suggests that the bull may dominate in the pair the next day.

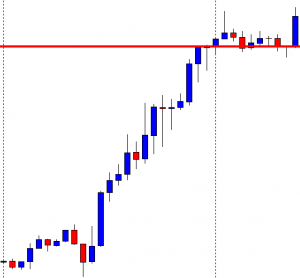
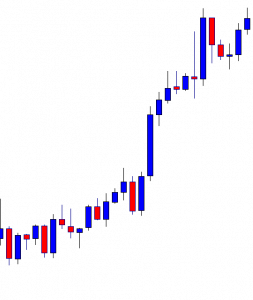
The next day, the price makes a bullish breakout at the last day’s highest high. The pair is trading above the level. Ideally, the price above the last day’s highest high means the bull is in control. However, in this chart, the price does not make any bearish correction before making the breakout. Thus, the buyers are to wait for the price to consolidate and produce a bullish reversal candle to go long in the pair.

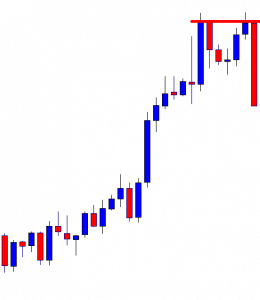
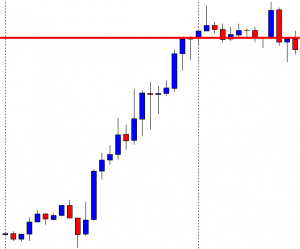
The next candle comes out as a bearish engulfing candle. The candle closes below the breakout level. If the level works as a level of resistance, the sellers may come into play and go short in the pair. Let us find out what happens next.

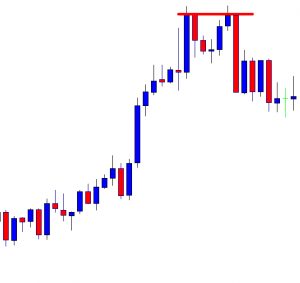
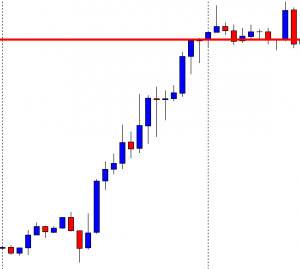
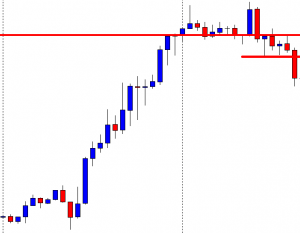
The next candle comes out as a hammer closing within the breakout level. It looks good for the sellers. The sellers may wait for the price to produce a bearish reversal candle and go short below the hammer’s lowest low.

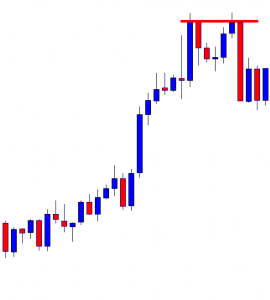
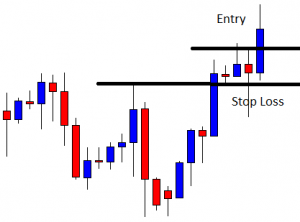
The chart produces a bearish engulfing candle closing below the hammer’s body. The sellers may trigger a short entry below the hammer’s lower shadow. The last day’s lowest low offers the price to travel towards the North with a good reward.

One of the candles comes out as a bearish Marubozu candle closing well below the hammer’s lowest low. The entry may be triggered earlier just by using price breakout. Some traders may wait for a 15M breakout to trigger the entry, and some even wait for an H1 breakout. Ideally, a 15M breakout is good enough to trigger such entry. Traders may set their stop loss above the breakout level since it is the new resistance and Take profit with 2R. If they set the stop loss above the trend’s highest high, they may set take profit at the previous day’s lowest low. Let us find out how the entry goes.

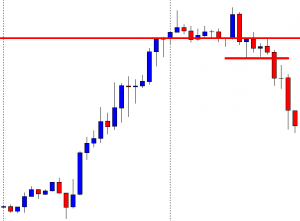
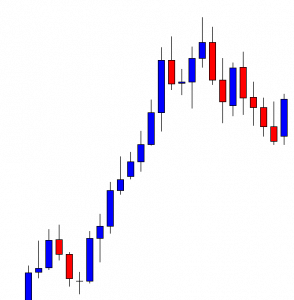
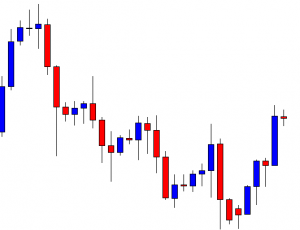
The price heads towards the South with good bearish momentum. It hits 2R in a hurry. The way it has been going, it may hit the previous day’s lowest low soon as well.

To do intraday trading, pay attention to the last day’s highest high and lowest low, breakout, breakout confirmation, and reversal candle. Do some backtesting and then try live trading with a tiny lot at the beginning. Once you have mastered this, it can make your hand full.

Categories
Forex Daily Topic Forex Price Action

To Hold It or Not?

In today’s lesson, we are going to demonstrate an example of an H4 chart offering entry after consolidation. The price does not head towards the breakout direction after triggering the entry as expected. It is Friday and the market is going to close. The question is whether we hold the position during the weekend or close the position. Let us find this out.

This is an H4 chart. The chart shows that the price heads towards the North with good bullish momentum. The last candle comes out as a bearish inside bar. The chart belongs to the buyers. The price may make a bearish reversal from here. The sellers must wait to get a strong bearish reversal pattern to go short in the pair.

The chart produces another bearish candle followed by a doji candle. The buyers may wait for the price to make a breakout at the wave’s highest high to go long in the pair.

The price heads towards the North but does not make a bullish breakout. If the chart produces a bearish reversal candle around the level, it may get bearish. On the other hand, the buyers may still be hopeful that they get a bullish breakout to push the price towards the North further.

The chart produces a bearish engulfing candle right at the double top resistance. It makes a breakout at the neckline as well. Thus, the sellers may keep their eyes on the chart to go short and drive the price towards the South.

The price consolidates for a while. It produces a bearish reversal candle, but it does not make a bearish breakout to offer a short entry. The last candle comes out as a bullish candle. Both the buyers and the sellers must wait and let the price decide to give them a direction.

The chart produces a bearish engulfing candle closing well below consolidation support. The sellers may trigger a short entry right after the last candle closes by setting take profit with 1R. Let us proceed to the next chart to find out how the trade goes.

The price consolidates again. The chart upon producing a bearish engulfing candle at a double top resistance and getting consolidation, it does not move towards the trend’s direction. The sellers do not expect that. However, this is how the market goes. The market is going to close within three hours. Do the sellers close the position?

It is an H4 chart. If it were other intraday charts such as the H1, 15 M, 5M, we may close the position. In this case, the reversal candle is an engulfing candle; the reversal pattern is a double top; the price consolidates accordingly, and the signal candle comes out as a bearish engulfing candle as well. Thus, considering these factors the sellers may hold the position.


Categories
Forex Price Action

Traders are to be Artists

In today’s lesson, we are going to demonstrate an example of the daily-H4 chart combination trading. The H4 chart offers a long entry. The chart’s breakout and level of support are to be spotted with some calculation. We try to learn those from today’s lesson.

This is the daily chart. The chart shows that the price makes a very strong bullish move. It then makes a bearish correction. At the correction, it produces a bullish engulfing candle once but continues its journey towards the South. The daily-H4 chart combination traders may have flipped over to the H4 chart upon having that bullish engulfing candle. Anyway, look at the last candle. It is a strong bullish reversal candle. The buyers may flip over to the H4 chart to go long in the pair.

This is how the H4 chart looks. The last candle comes out as a doji candle. The buyers are to wait for the price to consolidate and produce a bullish candle to trigger a long entry.

The chart shows that the price consolidates and produces a bullish engulfing candle. Let’s focus on those two drawn levels. We may not count the lower spike of that spinning top to draw the support line. We try to draw the line by using a flipped level that holds some candle’s wicks and bodies of all the candles. To draw the level of resistance, we count the spike of the spinning top (the last rejection) but skip some part of the upper shadow of a candle. Yes, it is not a bad idea to draw a breakout level by using spikes to some extent. In most cases, however, significant rejection, along with candles’ bodies, matters a lot. Let us assume that we trigger a long entry in this chart.

The price heads towards the North with good bullish momentum. The last candle does not hit the target of 1R, but the price is almost there. It seems that the buyers may not have to wait too long to achieve their target.

The last candle comes out as a bearish candle with a long upper shadow (the body is relatively thicker though). However, the upper shadow shows that the price hits the target. However, it is a bearish reversal candle because the body closes within the last bullish candle, suggesting that the price may continue its bullish move.

If we look back and study with the flipped H4 chart, we find that the buyers are to count some factors to draw consolidation support and resistance. They are to count some spikes and to skip some of those. As we know, trading is not science; it is an art. Thus, traders are to be artists. To be an artist (successful trader), one needs a lot of practice and experience.