Categories
Forex Daily Topic Forex Price Action

Fibonacci Extension: How It Helps Traders

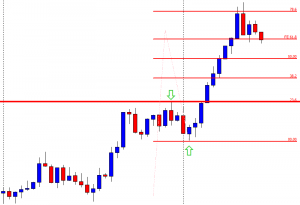
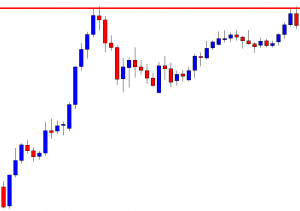
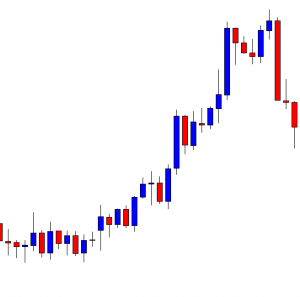
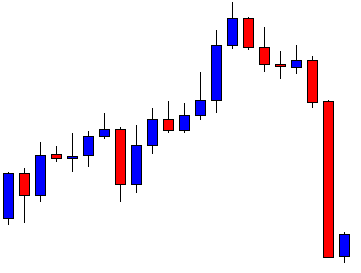
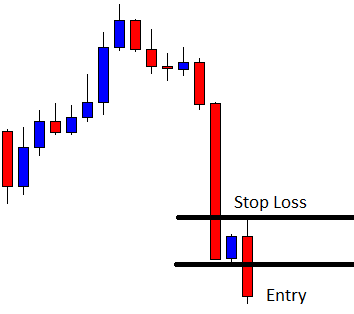
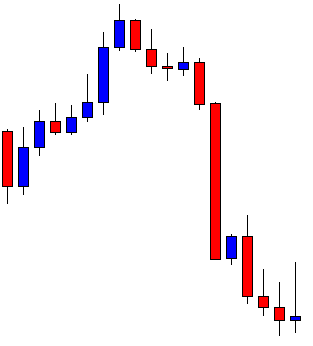
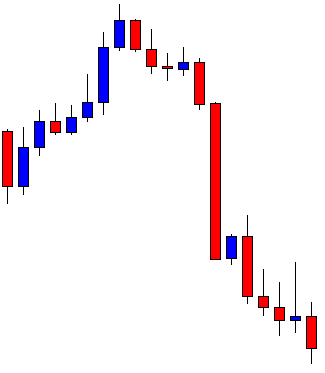
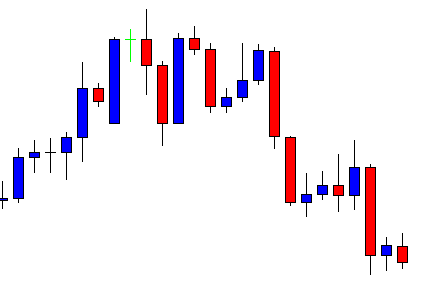
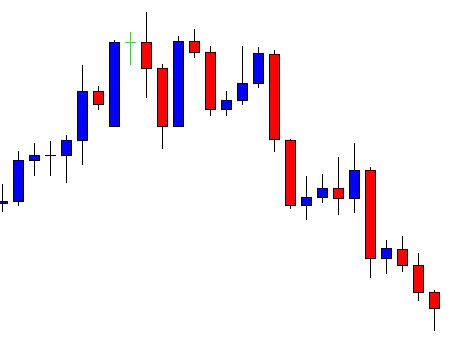
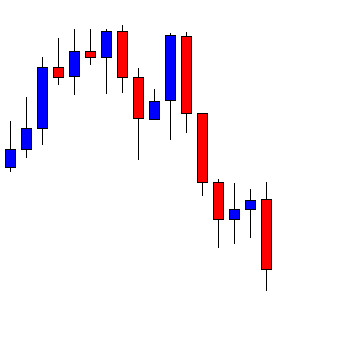
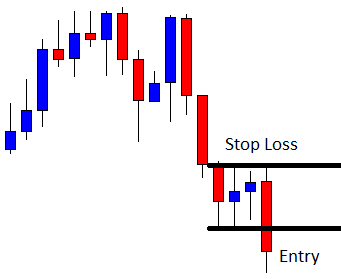
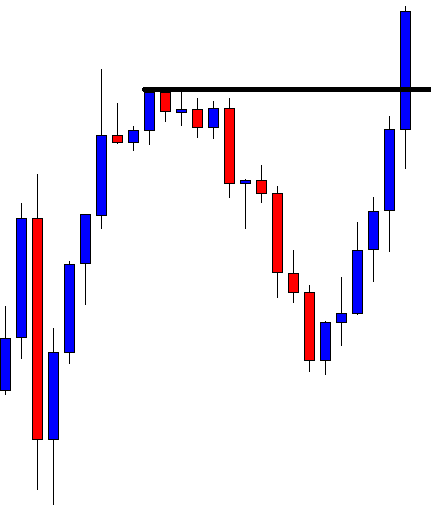
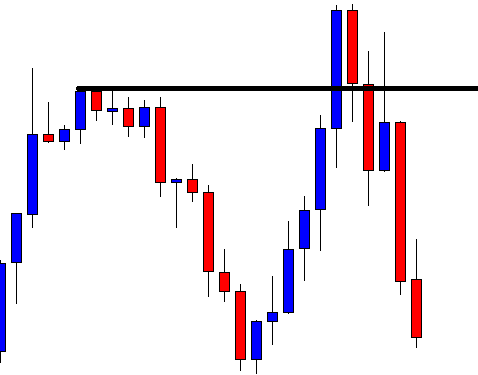
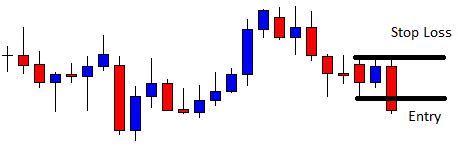
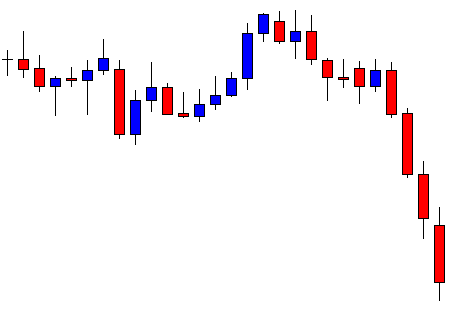
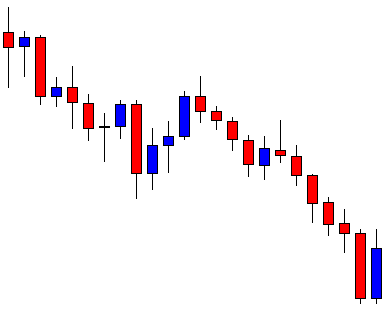
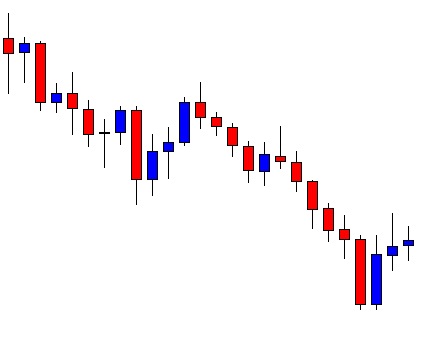
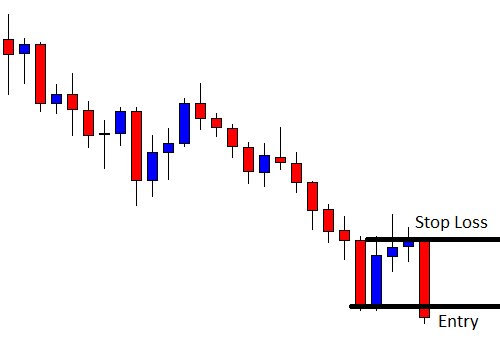
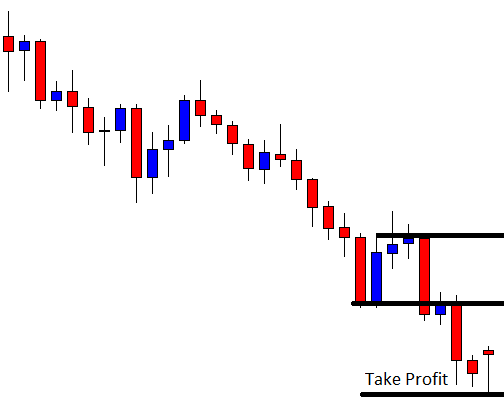
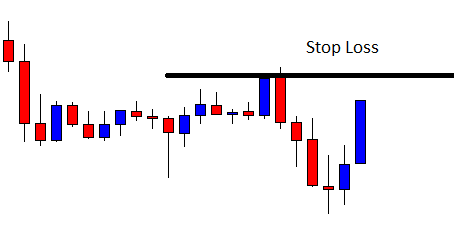
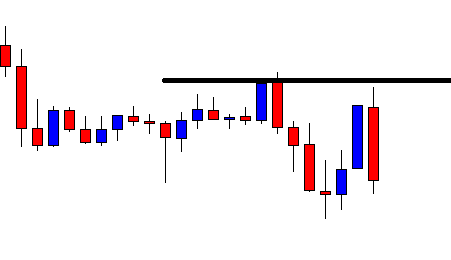
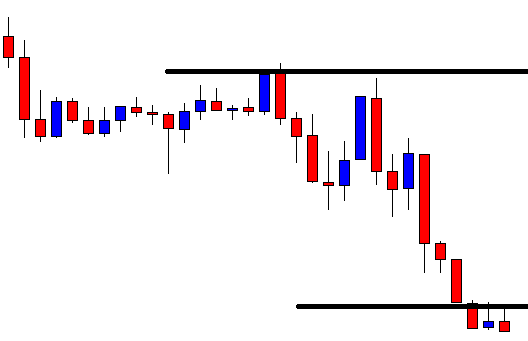
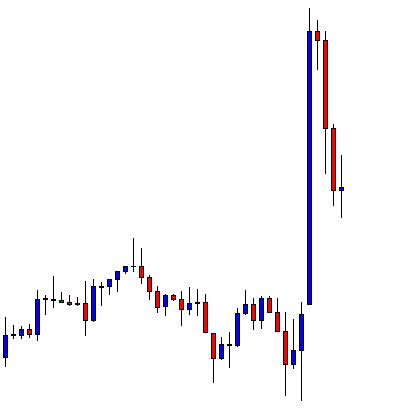
In today’s lesson, we will demonstrate an example of an H4 chart that makes a breakout heading towards the North. However, the chart does not offer entry. We try to find out the reason behind it.

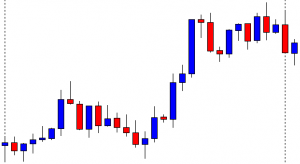
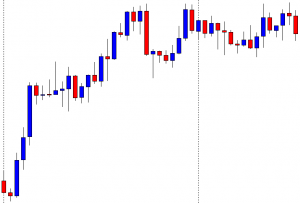
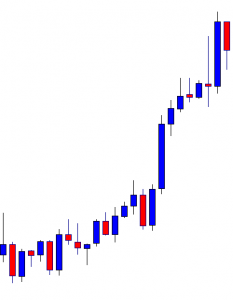
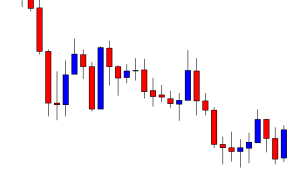
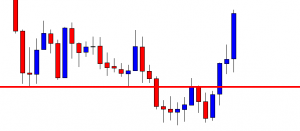
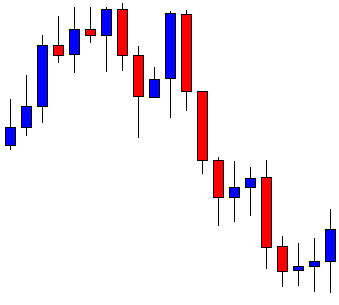
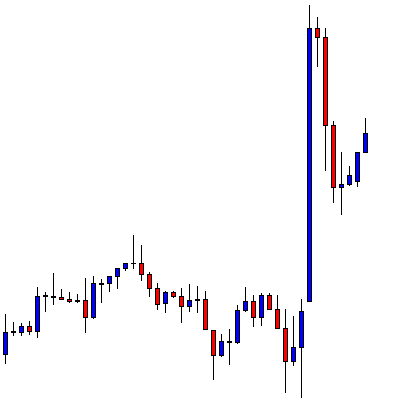
It is an H4 chart. The chart shows that the price makes a good bullish move. Thus, the weekly candle ends up being a bullish candle. Let us proceed to the next chart to see how the price starts next week.

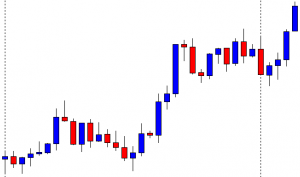
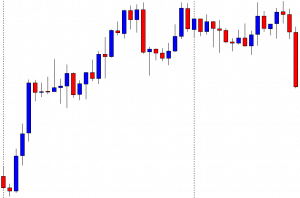
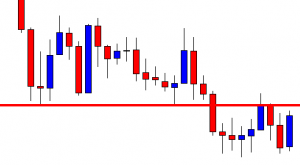
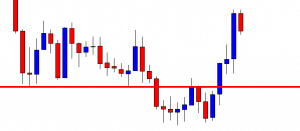
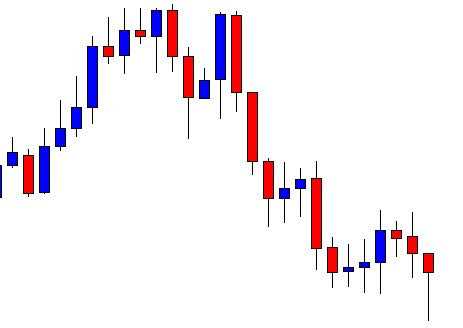
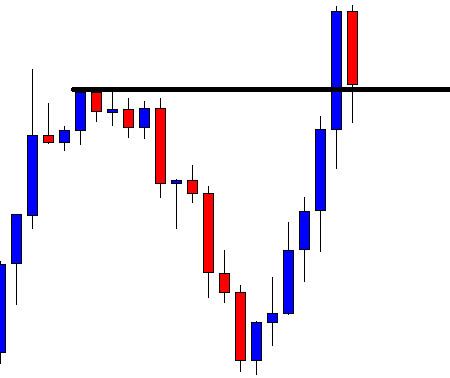
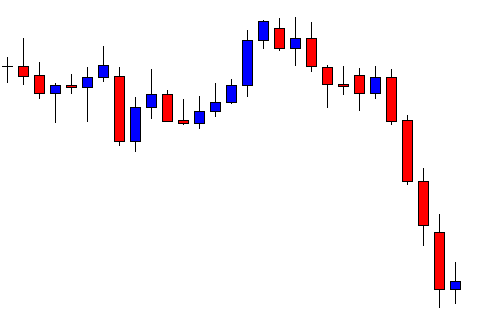
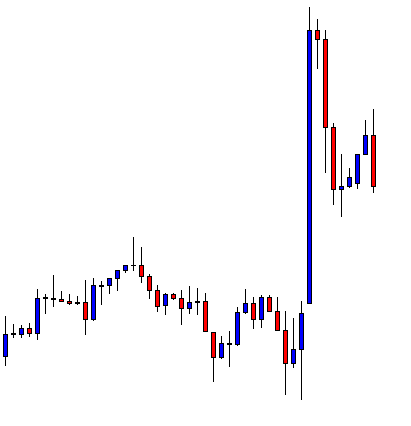
The first candle comes out as a bearish engulfing candle. However, the support level where the price had a bounce and headed towards the North is intact. The buyers may eye on the chart for the price to have a bounce and make a bullish breakout at the weekly high.

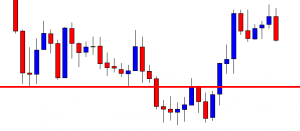
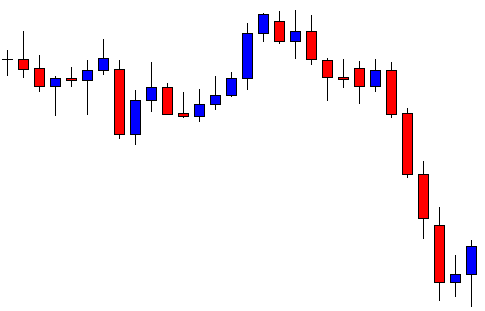
The chart produces a bullish inside bar. The candle is produced right at the level of support. It is not a strong bullish reversal candle, but things look good for the buyers.

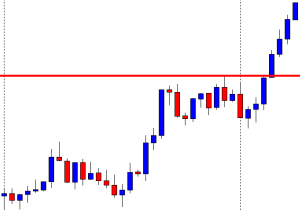
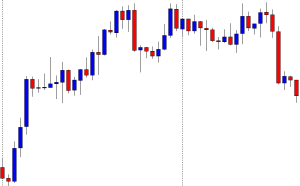
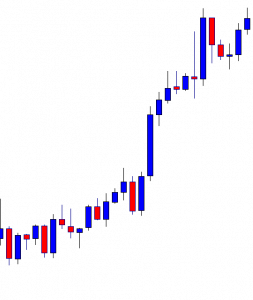
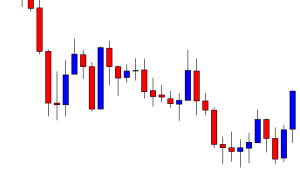
The chart produces three more bullish candles breaching the level of resistance. The buyers are to wait for the price to consolidate and produce a bullish reversal candle to offer them a long entry.

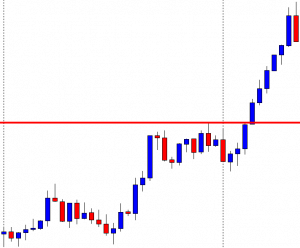
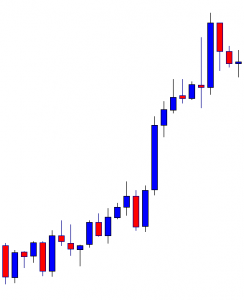
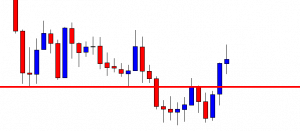
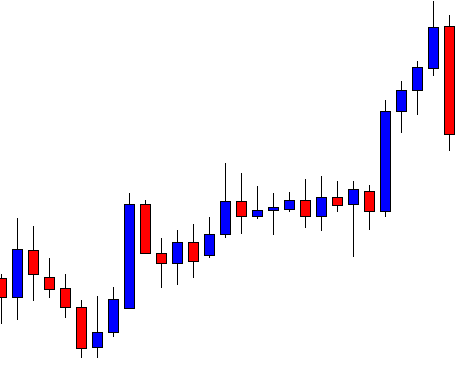
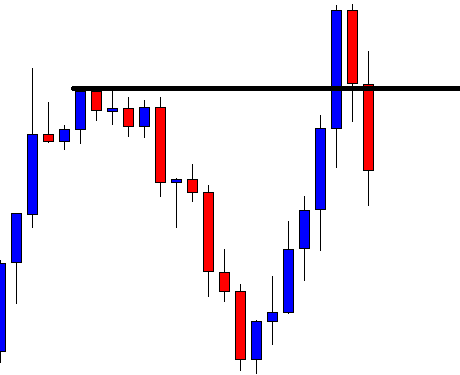
The price keeps heading towards the North without having consolidation. In naked eyes, it seems that the price has traveled a long way. If it consolidates now, should the buyers go long?

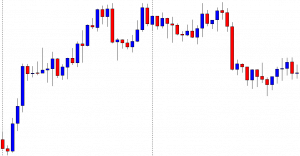
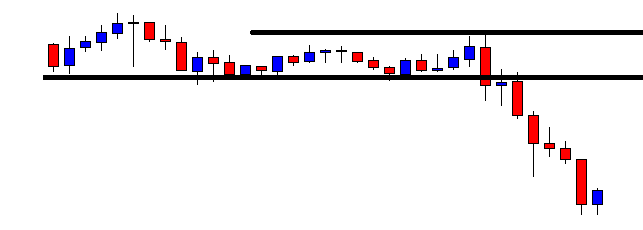
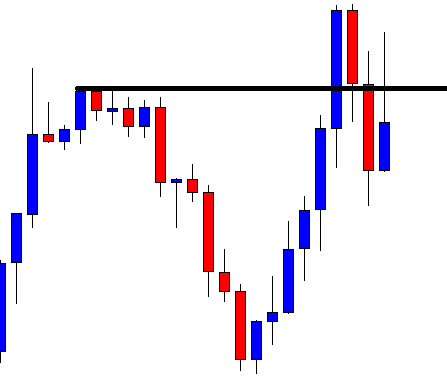
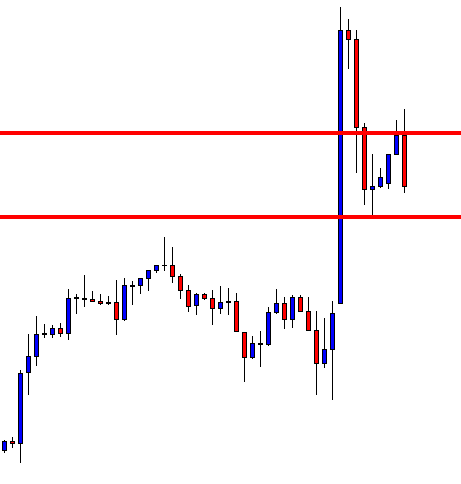
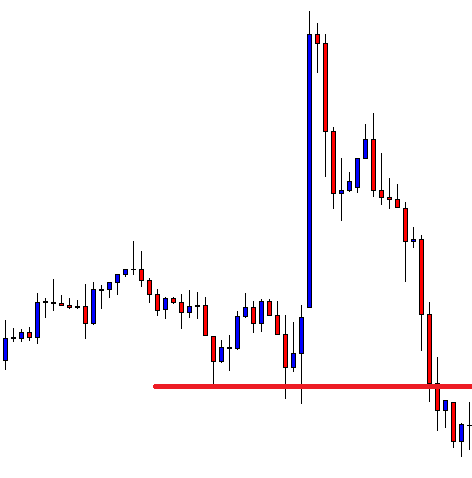
The chart produces a bearish candle. It means the price may consolidate now. The breakout level is far away. If the price makes a bearish correction up to the breakout level, it will come out as a long bearish wave. This often changes the trend or makes the price get choppy, at least. Let us draw a Fibonacci Extension and explain it with the Fibonacci levels.

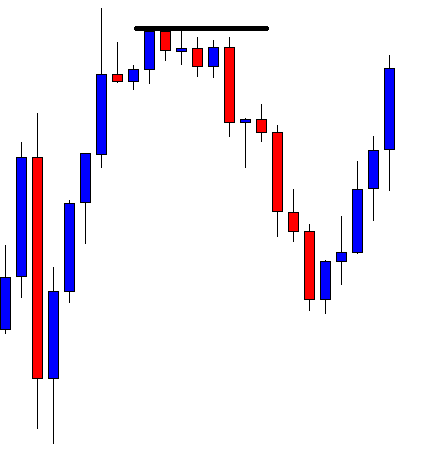
We know when the price makes a breakout; Fibonacci Extension can be used to determine the wave’s length. The breakout length is measured at 23.6%. The best level for the price to consolidate within 23.6% to 38.2% or 38.2% to 50.0%. Over here, the price consolidates within 61.8% to 78.6%. It means the price does not have much space to travel. Thus, the buyers may skip taking entry on this chart as far as the risk-reward ratio is concerned. The price may go up to the level of 100.0%, but it often ends up being choppy or makes a reversal in such cases. This is when Fibonacci Extension comes out as a handy tool with what traders can determine the trend’s potential length and calculate whether they should take an entry or not.

Categories
Forex Price Action

Do Not Be Biased, Take Decisions According to the Chart

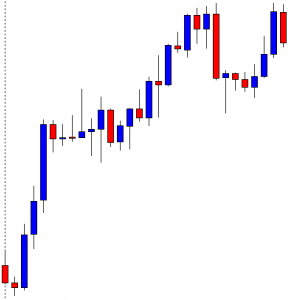
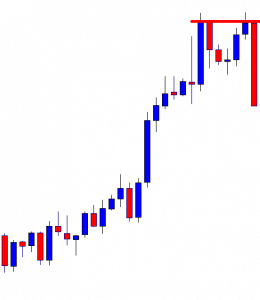
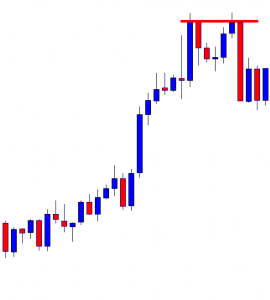
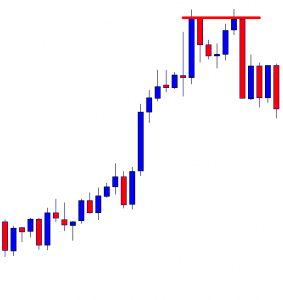
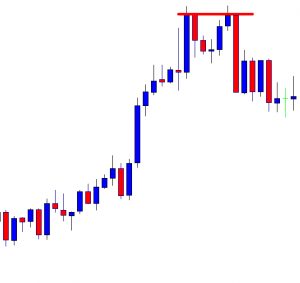
In today’s lesson, we are going to demonstrate an example of a chart that makes a good bullish move but ends up having a rejection at a double top resistance. The price then shows the potential to make a bullish breakout. However, it has another rejection around the last week’s high and makes a bearish breakout. It looks good for the sellers at the time. We find out what happens afterward.

This is the H4 chart. The price makes a long bullish move. It ranges for a while and then continues its bullish journey again. Look at the last candle on the chart. It comes out as a bearish inside bar. Do not miss the point that the candle is produced right at the resistance, where the price has had a rejection.

The chart produces a bullish candle to start the next week. It then ranges for a while and produces two bullish candles. It seems that the price may head towards the North and makes a bullish breakout at the last weekly high.

It does not. It rather finds its resistance around the same level. Moreover, it produces a bearish engulfing candle. To be more precise, the chart produces an evening star. It is a strong bearish reversal candle. Let us wait and see what the price does next.

The chart produces a long bearish candle breaching the last swing low. The breakout is significant since the price trends from the last weekly low. The sellers may keep their eyes in the pair to go short. Before going short on this chart, the sellers shall wait for the price to make a bullish retracement since the price is within the last weekly range. Keep that in mind that the price is to make a bullish correction to offer a short entry.

The price does not make a bullish correction. It rather consolidates and produces a bearish reversal candle. Since the price is within the last weekly range, so it is not a short signal.

Here it goes. The price gets choppy. This chart becomes a risky chart to trade. Thus, traders might as well skip eyeing on the chart to trade at. At first, it looks good for the buyers. Then, it shows potential for the Bear to dominate since the price has several rejections at the same level. However, it ends up being an extremely choppy chart.  Thus, do not be biased with your initial assumption. Wait for the breakout, confirmation, and then trade.

Categories
Forex Price Action

The Beauty of Horizontal Channel Trading

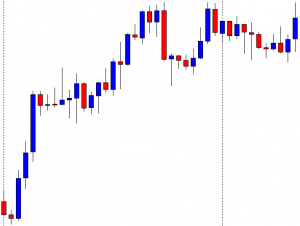
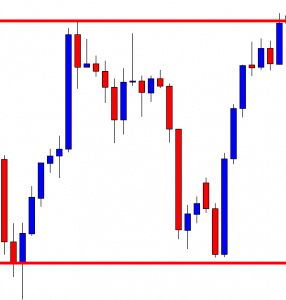
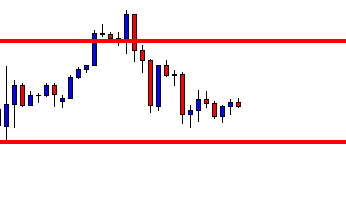
In today’s lesson, we are going to demonstrate an example of a chart where the price gets caught within a horizontal channel. We’ll try to learn how we can trade and make the most of it. Let us get started.

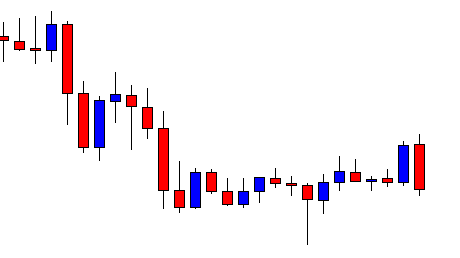
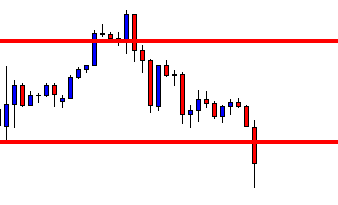
The chart shows that, after being bearish, the price bounces at the drawn level. It produces a bullish engulfing candle and heads towards the North. The chart is bullish-biased. Thus, price-action traders are to look for long entries. Let us see what happens.

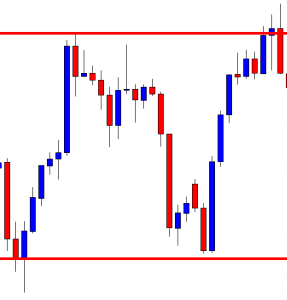
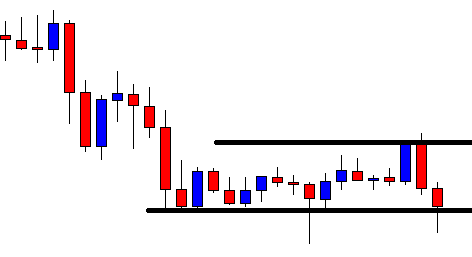
The price finds its resistance instead. It produces a bearish inside bar, but it does not make a new higher high. Thus, the buyers do not get an opportunity to go long at the top. The price heads towards the South towards the level of support. Since the level has been working as a level of support, the buyers may wait for the price to produce a bullish reversal candle to go long in the pair.

The chart shows that the price produces a bullish engulfing candle at the support zone. The buyers may trigger a long entry by setting stop loss below the candle’s lowest low and by setting take profit at the level of resistance. The risk-reward looks good.

The price heads towards the North with good bullish momentum. It hits the target in a hurry too. At the moment, the price is right at the level of resistance. Can you guess what traders should do now? Look at the next chart.

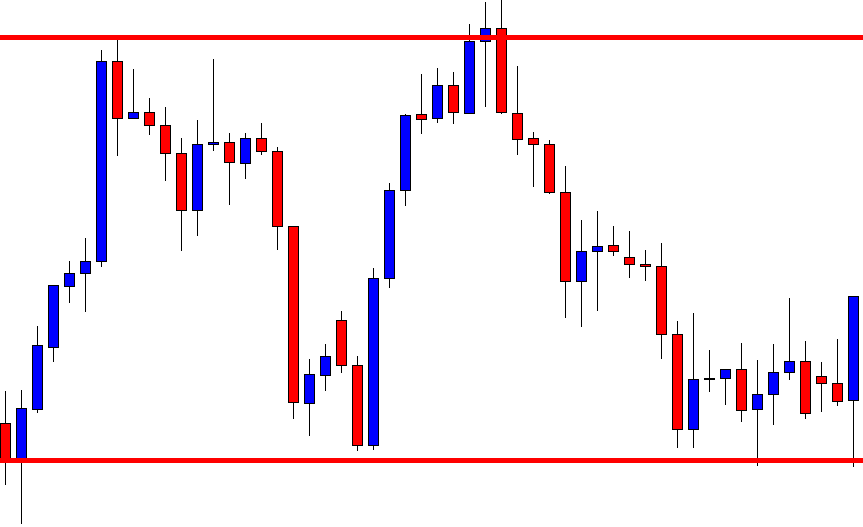
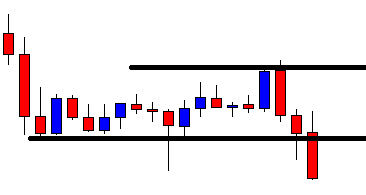
The chart shows that the price produces a bearish engulfing candle at the resistance zone. A point is to be noticed here that the chart produces a bullish spinning top. However, it cannot be considered a breakout. It rather produces a bearish engulfing candle. Thus, the traders may go short in the pair by setting take profit at the support zone and by setting stop-loss above the last candle’s highest high.

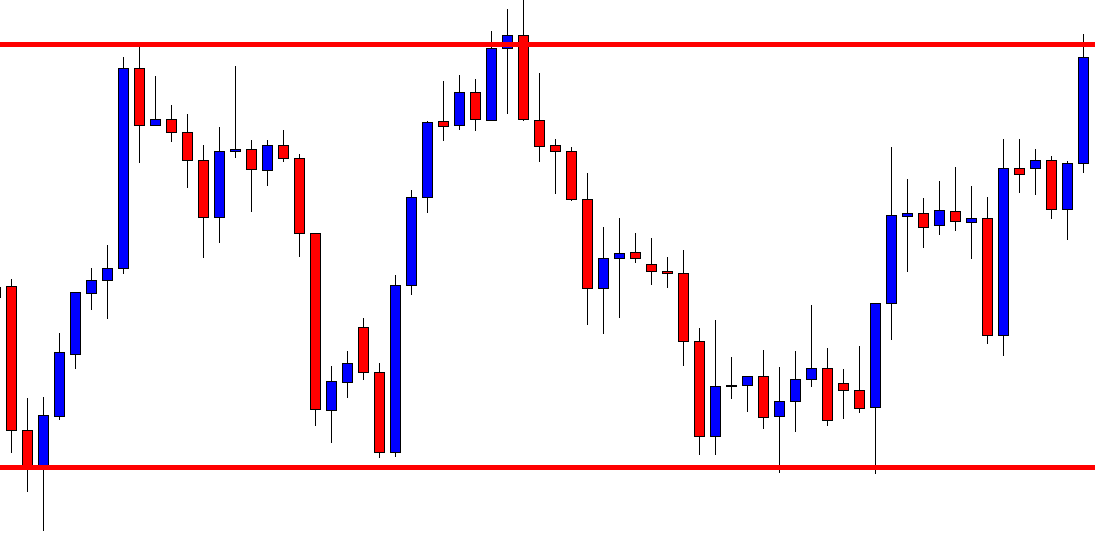
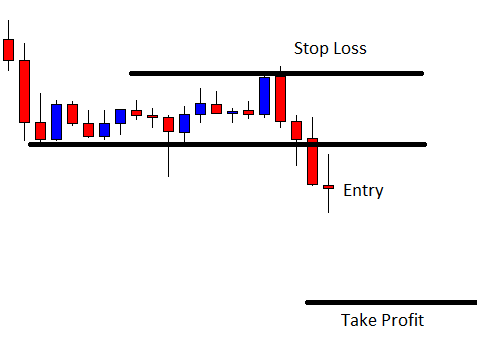
The price heads towards the South with an average pace. It consolidates for a while and resumes its bearish journey. The price has been roaming around the level of support for quite a while. It means the support gets even stronger. Look at the last candle. It comes out as a bullish engulfing candle. The buyers may trigger another long entry here. Let us find out what happens next.

The price hits the target. The price makes a long bearish correction and tests the buyers’ patience, though. However, in the end, the buyers come out with their pips. Trading is beautiful when the price moves like this, isn’t it?

Categories
Forex Price Action

Equidistant Channel: An Excellent Price Action Trading Tool

In today’s lesson, we are going to demonstrate a trade setup with Equidistant Channel. Price action traders rely on Equidistant Channel a lot. It is one of the best price action trading tools. However, Forex traders’ life is not as easy as it seems. Like other trading tools, Equidistant Channel needs adjustment. To be able to do that traders need enough knowledge and experience. Let us now proceed to find out what a trader may need to do to make it work for him.

To draw the equidistant channel, we need to find out at least four points. Two swing highs and two swing lows are the best combinations. It works with three swing highs and one swing low or vice versa. In the chart above, we have two swing highs and two swing lows. In naked eyes, it seems that we will be able to draw an equidistant channel here.

We have drawn an equidistant channel. The price is now at the resistance. Some traders go long from here. Ideally, to get a good risk-reward, traders should wait for the price to go at the level of resistance and produce a bearish reversal candle to go short in the pair. Let us find out what happens next.

The chart does not produce a bearish reversal candle. It breaches the level instead. It means this is not a valid equidistant channel anymore. The sellers must be disappointed. What do you think is there any twist in the tail?

The chart makes the new lowest low. It gives three swing highs and one swing low. It means we can draw another equidistant channel. Look at the above chart where the price getting a bounce at the level of support. The price again heads towards the North. Traders may wait for the price to get a rejection at the level of resistance and produce a bearish reversal candle to go short in the pair again.

Here it comes. The level of resistance produces a bearish engulfing candle right at the level of resistance. Traders may trigger a short entry right after the last candle closes. To set take profit, they may use the level of equidistant support. The price often keeps going down with a down-trending equidistant channel. However, the best practice is closing down the trade at the first bounce in case of down-trending equidistant channel trading. Let us find out how the trade goes.

The price hits take profit level like a rocket. Some may regret that they should hold the position and close it manually. Do not forget the rule of sticking with the rule in forex trading. We have seen that the chart does not produce a signal on the first occasion. It rather breaches and lets traders draw another equidistant channel. Yes, it does offer an excellent entry for the sellers too.

Categories
Forex Daily Topic Forex Price Action

It Often Makes You Wait Longer Than You Want

In today’s lesson, we are going to demonstrate an example of a daily-H4 chart combination entry. The daily char produces a bearish engulfing candle at a significant level of resistance. It makes the daily-H4 chart combination traders flip over to the H4 chart to look for a potential entry. The H4 chart shows that the chart creates a double top. Simply, an ideal combination for the traders to go short on that chart. However, things do not go as smoothly as traders expect it to go in the Forex market. Let us find out what happens.

This is the daily chart. The chart shows that the price, after being bullish, has a rejection at the level of resistance marked with the red line. The price comes down and makes a bullish move again. If it makes a breakout, the buyers may push the price further up. On the other hand, sellers are to wait for the price to produce a bearish reversal candle to consider short opportunities. Let us find out what happens next.

The chart produces a bearish engulfing candle. Since it shows in the daily chart, the combination traders may flip over to the H4 chart to look for a short opportunity. A double top resistance and a bearish engulfing candle suggest the sellers may jump in here to drive the price towards the South further.

It is the H4 chart. The chart produces a double top and makes a breakout at the neckline. The combination traders are to wait for the price to consolidate and produce a bearish reversal candle to go short below consolidation support. The price consolidates here. However, considering consolidation length, it is better to skip such entry.

The price heads towards the South with extreme bearish pressure. It travels a long way to produce a bullish reversal candle. The sellers would love to get the reversal candle earlier though. Anyway, it is better late than never.

The chart produces a bearish engulfing candle closing well below consolidation support. The sellers may trigger a short entry right after the last candle closes by setting stop-loss above consolidation resistance with 1R.

The price heads towards the South with good bearish momentum and hits the target. It seems that the price may travel towards the South further. The point to be noticed here is that the chart consolidates after traveling a long way. It would give a better reward if it consolidated and produced the signal candle earlier. It makes the sellers wait for more as well. In the end, the sellers make a profit out of it but think how hard they are to concentrate on it to make it work for them.Traders’ life is not as easy as some people may think.

Categories
Forex Daily Topic Forex Price Action

To Hold It or Not?

In today’s lesson, we are going to demonstrate an example of an H4 chart offering entry after consolidation. The price does not head towards the breakout direction after triggering the entry as expected. It is Friday and the market is going to close. The question is whether we hold the position during the weekend or close the position. Let us find this out.

This is an H4 chart. The chart shows that the price heads towards the North with good bullish momentum. The last candle comes out as a bearish inside bar. The chart belongs to the buyers. The price may make a bearish reversal from here. The sellers must wait to get a strong bearish reversal pattern to go short in the pair.

The chart produces another bearish candle followed by a doji candle. The buyers may wait for the price to make a breakout at the wave’s highest high to go long in the pair.

The price heads towards the North but does not make a bullish breakout. If the chart produces a bearish reversal candle around the level, it may get bearish. On the other hand, the buyers may still be hopeful that they get a bullish breakout to push the price towards the North further.

The chart produces a bearish engulfing candle right at the double top resistance. It makes a breakout at the neckline as well. Thus, the sellers may keep their eyes on the chart to go short and drive the price towards the South.

The price consolidates for a while. It produces a bearish reversal candle, but it does not make a bearish breakout to offer a short entry. The last candle comes out as a bullish candle. Both the buyers and the sellers must wait and let the price decide to give them a direction.

The chart produces a bearish engulfing candle closing well below consolidation support. The sellers may trigger a short entry right after the last candle closes by setting take profit with 1R. Let us proceed to the next chart to find out how the trade goes.

The price consolidates again. The chart upon producing a bearish engulfing candle at a double top resistance and getting consolidation, it does not move towards the trend’s direction. The sellers do not expect that. However, this is how the market goes. The market is going to close within three hours. Do the sellers close the position?

It is an H4 chart. If it were other intraday charts such as the H1, 15 M, 5M, we may close the position. In this case, the reversal candle is an engulfing candle; the reversal pattern is a double top; the price consolidates accordingly, and the signal candle comes out as a bearish engulfing candle as well. Thus, considering these factors the sellers may hold the position.


Categories
Forex Price Action

One Minute Down, Next Minute Up

The Double Bottom is one of the strongest bullish reversal patterns. When the price gets its second bounce at the same level and makes a breakout at the last swing high, the pattern it produces is called the double bottom. In today’s lesson, we are going to demonstrate an example of a double bottom in the H1 chart. At the end of the wave, an interesting thing happens. Let us proceed and find out how the double bottom offers entry and what that interesting thing is.

This is an H1 chart. The chart shows that the price has its second bounce and produces a bullish engulfing candle. Since the same level of support produces a bullish engulfing candle at the second bounce, it is going to have a strong impact on the market if it makes a breakout at the last swing high.

Here is the level of resistance, which the buyers are going to wait for a breakout to go long in the pair upon breakout confirmation. The price reacted at the drawn level earlier as well. Thus, this has been a significant level. The last rejection signifies it more.

Look at the next candle. The candle comes out as a bullish Marubozu candle. The candle closes well above the level where the price had a rejection earlier. Some buyers may want to trigger a long entry right after the last candle closes. Some buyers may wait for the breakout confirmation to go long in the pair.

The next candle comes out as a spinning top with a tiny bullish body. The price closes above the last candle’s highest high. It confirms the breakout. The buyers may trigger a long entry right after the last candle closes since they have the breakout confirmation.

See how the price heads towards the North with good bullish momentum. The price hits 1R within one candle. The last candle suggests that the price may continue its move towards the North. Let us see what happens next.

The chart produces a bearish inside bar. It suggests that the price is still bullish. If the next candle comes out as a bullish engulfing candle, the price may resume its journey towards the North with good bullish momentum. However, many buyers may come out with their profit and wait for the next bullish reversal candle to go long.

The price gets choppy within two horizontal levels. The last candle comes out as a bearish engulfing candle. Do you notice anything interesting here? Yes, the chart produces a Double Top this time, and it produces a bearish engulfing candle at the second rejection. The sellers may want to go short if the price makes a breakout at the last lowest low. This is how things change in the Forex market. It is interesting, is not it?

Categories
Forex Price Action

Make Full Use of a Strong Reversal Candle

An engulfing candle makes a strong statement about the price reversal. The longer the body, the stronger the statement is. In today’s article, we are going to demonstrate an example of the daily-H4 chart combination trading, where the daily chart produces a bearish engulfing candle with a long bearish body. We find out what it has to offer to the sellers in the end.

The chart shows that the price produces a bearish engulfing candle having a tiny lower spike. The body of the candle is a long one closing well below the last bullish candle. This is one good-looking bearish engulfing candle. Since it is the daily chart, the daily-H4 chart combination traders may flip over to the H4 chart to look for short entries.

The above figure shows the H4 chart. We can see that the last candle comes out as a bullish inside bar. It means the price in the H4 chart may consolidate. The sellers are going to wait to get a bearish reversal candle to go short in the pair.

The last candle comes out as a bearish engulfing candle closing well below consolidation support. The sellers may trigger a short entry right after the last candle closes by setting stop-loss above consolidation resistance and by setting take profit with 1R. Let us now find out how the entry goes.

The next two candles come out as bearish candles. However, the price does not head towards the South as expected. Moreover, the last candle comes out as a doji candle having a long upper shadow. The sellers are to wait for the price to hit the target. The last candle does not convey a good message to the sellers.

Here it comes. The last candle hits the target of 1R. The reversal candle in the daily chart is a very strong one. Do the sellers get anything extra out of it? Let us proceed to the next chart to see what the price does in the chart.

The price makes a long bearish move. It heads towards the South upon having consolidation. The sellers can make a handful of pips by eying in the chart. One of the reasons may be the bearish reversal candle in the daily chart. As far as a candlestick pattern is concerned, an engulfing candle is the most reliable reversal pattern. When you get an engulfing candle like the one we have seen here, it does have a lot to offer. Okay, here is a question. What do you see in the H4 chart here? Yes, the last candle comes out as a strong bullish engulfing candle. This has a lot to offer to the H4-H1 chart combination traders. Therefore, if you are an H4-H1 combination trader, flip over to the H1 chart and make full use of it.

Categories
Forex Price Action

The H4-Daily Combination Strategy: Do not Get Carried Away

In today’s lesson, we are going to demonstrate an example of an H4-daily chart combination trading. The lesson has an important message to remember for the H4-Daily combination traders. Let us get started.

The chart shows that the price produces a double top and heads towards the South with good bearish momentum. The daily candle closes as a bearish Marubozu candle having no lower shadow at all. The next trading day starts with a Spinning Top. It seems that the H4 chart starts having consolidation. The last H4 candle comes out as a bullish engulfing candle. This looks good for the sellers that the price is having consolidation after making a good bearish move. However, the H4-Daily combination traders must not forget one thing that the signal is to be produced within the next two candles. Otherwise, it becomes daily support.

The fifth H4 candle of the day comes out as a bearish engulfing candle. The candle closes well below consolidation support. The sellers may trigger a short entry right after the last candle closes by setting stop-loss above consolidation resistance and by setting take profit with 1R.

The next candle comes out as a bullish inside bar after triggering the entry. The sellers would love to get a long bearish candle here. However, a bullish inside bar suggests that the bear still holds the key. Let us proceed to the next chart.

The next candle comes out as a bearish engulfing candle. This looks extremely good for the sellers now. The price finds another resistance. This attracts sellers to add more short positions. Anyway, the H4-Daily combination traders are to wait for the price to hit their 1R take profit.

The price takes two more candles to hit the target. I would say that the price hits the target at a moderate pace here. Anyway, the H4-Daily combination strategy offers entry, and the trade setup works well for the sellers.

The message this lesson has is that we must not get carried away with bullish or bearish move followed by consolidation. The H4 chart is to produce a trade signal within the next day. If it does not, that chart does not belong to the H4-Daily combination trading strategy.  If it does, then the H4-Daily combination traders may trigger an entry.

Categories
Forex Daily Topic Forex Price Action

Double Top-Engulfing Combination and Trade Management

In today’s lesson, we are going to demonstrate an example of daily-H4-combination trading. The trade setup starts with a double top, and the trend-initiating candle comes out as a bearish engulfing candle. The price consolidates and produces another bearish engulfing candle closing below consolidation support. We find out what happens next and how we may manage the trade to get the best result out of it.

This is an H4 chart. The chart shows that the price produces a double top. At the second rejection, the reversal candle comes out as a bearish engulfing candle and drives the price towards the South with good bearish momentum. Upon finding its support, it consolidates for a while and produces another bearish engulfing candle. We know what the daily-H4 combination traders are to do here.

The daily-H4 combination traders may trigger a short entry right after the last candle closes by setting stop-loss above consolidation resistance and by setting take profit with 1R. Let us proceed to the next chart to find out what the price does after triggering the entry.

The next candle comes out as a bearish candle as well. It looks good for the sellers. It seems the price may not take too long to hit the target of 1R. Let us proceed to the next chart.

It does not look good for the sellers now. The last candle comes out as a bullish engulfing candle. It suggests that the price may get bullish and hit the stop loss. Since this is an H4 chart, traders are to manage their trades according to the candlestick. The entry is carrying a loss now. Traders have three options here.

  1. They may close the whole entry
  2. They may let the whole trade run
  3. They may close 50% of the entry

It depends on an individual trader how he likes to manage his trades. Some traders may want to keep the whole trade, and some may want to close the whole trade. There is a saying that cut your losses short and let your profit run. Thus, we may manage the trade by closing half of it and let the rest of it run. This is how we earn or lose 50% of the initial target. Let us see how it goes now.

The chart produces a spinning top and heads towards the downside. The last candle comes out a hammer, but it hits the target of 1R. This means the trade setup brings profit for the sellers. It may have gone another way round. Thus, in such a situation, taking out half of the trade offers us less profit but less loss as well in the end. It does not always happen. However, when it does, we may consider managing the trade by doing it so.

Categories
Forex Price-Action Strategies

The Longer It Ranges, The Harder It Breaks

Price action traders usually look for entries on the chart that has a clear trend. However, even a choppy chart end up providing good entry to the traders. In today’s lesson, we are going to show how a choppy chart ends up producing a good entry. Let us get started.

The chart shows that the price has been choppy. It bounces at a level of support three times. As far as resistance is concerned, the price has a rejection at a level once and comes back down. Then, it heads towards the upside and finds its resistance getting rejection twice. The level of support seems stronger than the resistance here.

The price finds its resistance, and at the second rejection, it makes a breakout. As mentioned, the price bounces three times at the level of support. Thus, the breakout is strong as well. The sellers are to wait for the price to be held by the breakout level and a bearish reversal candle to go short in the pair.

The next candle comes out as a doji candle closing within the breakout level. The breakout comes out as a valid breakout. The sellers are to wait for the level to create a bearish reversal candle to trigger a short entry.

Here it comes. The last candle on the chart comes out as a bearish engulfing candle closing well below the last swing low. The sellers may trigger a short entry right after the candle closes by setting stop loss above the resistance and by setting take profit with 1R. Let us proceed to the next chart to find out how the entry goes.

The price heads towards the South with good bearish momentum. The price hits the take profit (1R). The last candle suggests that the price may head towards the South further. Some traders may take partial profits and let the rest of the trade run to make more pips.

The chart produces a bullish inside bar. The chart still favors the Bear. However, it may be time for the sellers to give it a second thought to close the whole trade. If we look at the chart, the price heads towards the downside and hits the target without producing any bullish candle in between. This is how it usually goes if the price makes a breakout within a long choppy market. Thus, traders may keep their eyes on the choppy charts to see whether the price makes a breakout to offer them an entry. A breakout in a choppy market is often very rewarding.

Categories
Forex Basic Strategies Forex Daily Topic

Significance of Breakout Confirmation or Reversal at Pullback

Breakout trading is one of the most widely used trading strategies in the Forex market. Breakout confirmation is equally important. Without breakout confirmation, a breakout may not work in favor of the traders in many cases. Thus, if we want to have a tremendous rate of winning, we may wait for breakout confirmation or reversal at pullback before taking entry. In today’s lesson, we are going to demonstrate an example of this.

The price after being rejected at a resistance level heads towards the South. It produces a bullish inside bar and heads towards the North again. The momentum suggests that the price may make a breakout at the level of resistance. Breakout traders are to keep an eye on the pair to get a breakout followed by breakout confirmation or reversal candle at the pullback to go long on the pair.

The last candle breaches through the level of resistance. Candle’s attributes suggest that this is an ideal breakout candle. The candle barley has the upper shadow. The breakout traders are to wait for either for the next candle to close above the breakout candle or the price to come back at the breakout level to consolidate and produce a bullish reversal candle to offer them a long entry.

The price does not head towards the North. It comes back at the breakout level closing within the breakout level. The breakout is still valid. However, the buyers must wait to get a bullish engulfing candle to close above consolidation resistance to trigger a long entry by setting stop loss below the breakout level. Let us proceed to the next chart to find out what happens next.

The price breaches the level of support and closes well below the breakout level. The sellers may take control soon in the pair. Traders taking a long entry right after the breakout candle closing are to have a loss here. If they set stop loss below the lowest low, the risk-reward would not be lucrative. When the price breaches a breakout level, it usually generates more momentum and changes its trend. Let us see what happens here.

The price goes back to the breakout level. This time it makes a bullish correction. The equation changes completely another way round. If the chart produces a bearish engulfing candle closing below consolidation support, the sellers may go short and drive the price towards the lowest low.

The chart produces a bearish engulfing candle followed by another strong bearish candle. It looks like a different ball game completely now. It is now the sellers’ territory.

In the bullish market, the chart does not produce a bullish reversal candle; thus, the price gets bearish. In the bearish market, it produces a bearish reversal candle (engulfing) and offers entry to the sellers. By taking entry upon breakout confirmation, we may not find as many entries as we would like, but it gets us more consistency in winning trades.

Categories
Forex Daily Topic Forex Price-Action Strategies

Price Action Trading: Support/Resistance and Breakout

Support and Resistance are the two most important things as far as price action trading is concerned. We often see that too many support levels/resistance levels are nearby being too close to each other. It may confuse us to be sure whether a breakout takes place or not. In today’s lesson, we try to find an answer to that. Let us get started.

This is a daily chart. The chart shows that the price heads towards the South after producing a bearish engulfing candle. Look at the last candle, which comes out as a bullish corrective candle. If the next candle comes out as a bearish engulfing candle closing below consolidation support, the sellers may trigger a short entry.

The last candle comes out as a bearish engulfing candle closing below consolidation support. The question is whether the sellers may trigger the entry or not. Look at those two drawn levels. The price reacts to those levels. Usually, price action traders count such levels to determine risk-reward or to set take profit level. Let us assume a trader takes the entry.

Typically, he should trigger the entry right after the last candle closes with 1R. Do not forget this is a daily chart. The daily chart usually offers more than 1R. Let us proceed to the next chart.

The price heads towards the South with extreme bearish pressure. As mentioned, it gets him more than 1R. It seems it may continue its bearish journey. At least the seller may hold his position until it produces a bullish reversal candle.

Here it comes. It produces a bullish inside bar. This is not a strong bullish reversal candle. However, some traders may consider come out with their profit or at least some part of it. Some sellers may still hold it until it produces a strong bullish reversal candle.

The last candle comes out as a bullish engulfing candle. This time the sellers are to think twice whether they should hold the entry. Many price action traders close their entry here. The trade setup works excellently well here. However, do you remember those two more support levels? The price does not seem to react to those levels at all. You may notice this next time. When support/resistance levels stand too close to each other, the last level and the last breakout gets the priority (in 80% cases). However, if they have enough space in between, then they must be counted by the traders to calculate risk-reward or to set take profit.

Categories
Forex Price Action

Never Know What is around the Corner

In today’s lesson, we are going to demonstrate an example of trend riding along with the H4 breakout trading strategy. We often see that the market is in a strong direction, but it does not offer many entries. It is frustrating, but we must take it easy. We must not be impatient but keep our eyes on the chart. We never know what is around the corner.

This is an H4 chart. The chart shows that the price has been heading towards the South with strong bearish momentum. However, it has not offered any A+ entry yet. It produces some strong bearish engulfing candle breaching through consolidation support. However, consolidations have been shallow. Thus, the sellers on this chart have not been able to make the most of it. Look at the last candle. It comes out as a strong bearish candle as well. It suggests that the bearish trend is strong enough, and it may drive the price towards the South further. Let us proceed to the next chart.

The chart produces a bullish inside bar. This time it looks better since the inside bar candle is a long one. This means if the chart produces a bearish engulfing candle again, it would be after a deep consolidation. The deeper consolidation, the better it is as far as reward is concerned.

The chart produces two more bullish candles. It looks like it has been searching for its support. Deeper consolidation/correction is good, but if it goes too far by making a bullish breakout, equation changes. Let us proceed to the next chart.

Here it comes. An A+ bearish engulfing signal candle this is. The sellers may trigger a short entry right after the candle closes by setting stop-loss above the candle’s high. Take profit may be set with 1:1 risk-reward.

The chart produces another bullish corrective candle after such a nice-looking bearish reversal candle. However, it heads towards the South and hits the target. We learn two lessons here.

  1. A chart may not offer as many entries as we anticipate, even it is on a strong trend.
  2. We never know what is around the corner in the Forex market.

At one point, it seems that the chart may not offer any short entry for the H4 sellers. The price keeps heading towards the North. Deep consolidation is about to get into too deep. At last, the signal candle comes and offers an excellent short entry. While trading, we are always to be on our toes since we do not know what is around the corner in the Forex market.


Categories
Forex Daily Topic Forex Price-Action Strategies

A Weak Breakout Candle Makes Things Different

In H1 breakout trading, the signal candle’s attributes are as important as the breakout candle. We know that a breakout candle means a lot. So is the breakout confirmation or signal candle. In today’s article, we are going to demonstrate an example of this. Let us get started.

The price after being bearish gets caught within a horizontal channel. However, the last candle comes out as a bearish engulfing candle. It seems that the sellers may take control soon. It all depends on the breakout at the level of support followed by breakout confirmation.

The next candle comes out as a bearish candle as well closing within the level of support. The sellers are to wait longer. On the other hand, the buyers would love to get a bullish reversal right here. The battle is on.

The bear wins. The last candle comes out as a bearish engulfing candle closing well below the level of support. This is what H1 breakout traders want. If the next candle closes well below the breakout candle, the sellers may trigger a short entry.

The next candle comes out as a bearish doji candle. It closes below the breakout candle. The sellers may trigger a short entry. However, this is not an ideal candle showing strong bearish momentum. If a candle like this confirms a breakout, the price may not go towards the take profit level that we would love to see.

After triggering the entry, the chart produces two bullish candles. It looks extremely ominous. Most probably, the entry is going to get us a loss. Taking a loss is a usual thing in the Forex trading. However, the last two candles may be produced because of the fragile confirmation candle. This is where H1 breakout traders shall be a bit careful. If the confirmation candle does not come out as a strong candle, the price may go another way round. Let us find out from the next chart what the price does here.

Oh! It is about to hit the stop loss. It produces a bearish engulfing candle again. The price may head towards the downside and hit take profit level. It is still 50-50 since the price is trading within the level of last swing low. Let us find out how it ends.

Yes, it hits the target at last. However, this is what the price does not usually do when the H1 chart makes a breakout and confirms it. As mentioned, it often happens when the breakout and confirmation candle come out as weak candles. Thus, we may consider this when trading H1 breakout strategy next time.

Categories
Candlestick patterns Forex Candlesticks

Candlestick Reversal Patterns: Refresh your Knowledge

After our last articles on candlestick reversal patterns, test your knowledge.

If you need to give a second read, these are the links:


Let’s begin


[wp_quiz id=”59882″]


Reference:

The Candlestick Course: Steve Nison


Categories
Forex Basic Strategies

Trading The Most Profitable Candlestick Pattern With Stochastic Indicator

Introduction

Throughout the years, many professional traders and chartists spent thousands of hours in front of their screens and have invented hundreds of candlestick patterns that show in the market. Some of these patterns work very well, and some failed miserably. A lot of traders believe that pattern trading doesn’t work. But it is just a myth. Pattern trading does work if we use it in conjunction with other credible trading tools.

Most of the novice traders make the mistake of treating A candlestick pattern as a trading signal. They need to understand that the patterns alone do not hold enough power to reverse the trend of the market. Most of the candlestick patterns are defined by using the last three to four candlesticks alone. Also, most importantly, they ignore the price action context.

This is the reason why we always urge our readers to combines candlestick patterns with other trading tools like credible indicators or oscillators. In this article, we will be sharing one of the most profitable trading strategies that we have ever come across. It involves a candlestick pattern and a technical indicator.

Engulfing Pattern + Stochastic Indicator

After extensive research and backtesting, we found that the Engulfing Pattern is the most profitable Pattern when confirmed and traded with the Stochastic Indicator. Before going right into the strategy, let’s talk about the Stochastic Indicator and Engulfing Pattern in the interest of novice traders who have never heard of these things before.

Stochastic Indicator

George Lane developed the Stochastic Indicator in the Late 1950s. It is one of the most prominent indicators in the industry, and it has been identifying credible signals consistently in all the types of markets from the past 60+ years. The Stochastic is an oscillator, and it changes its direction even before the price action. It measures the relationship between the underlying asset’s closing price and its price range over a specific period of time. Just like other indicators, stochastic doesn’t follow the volume and price. Instead, it follows the momentum and speed of the price to identify the overbought and oversold areas.

Engulfing Pattern

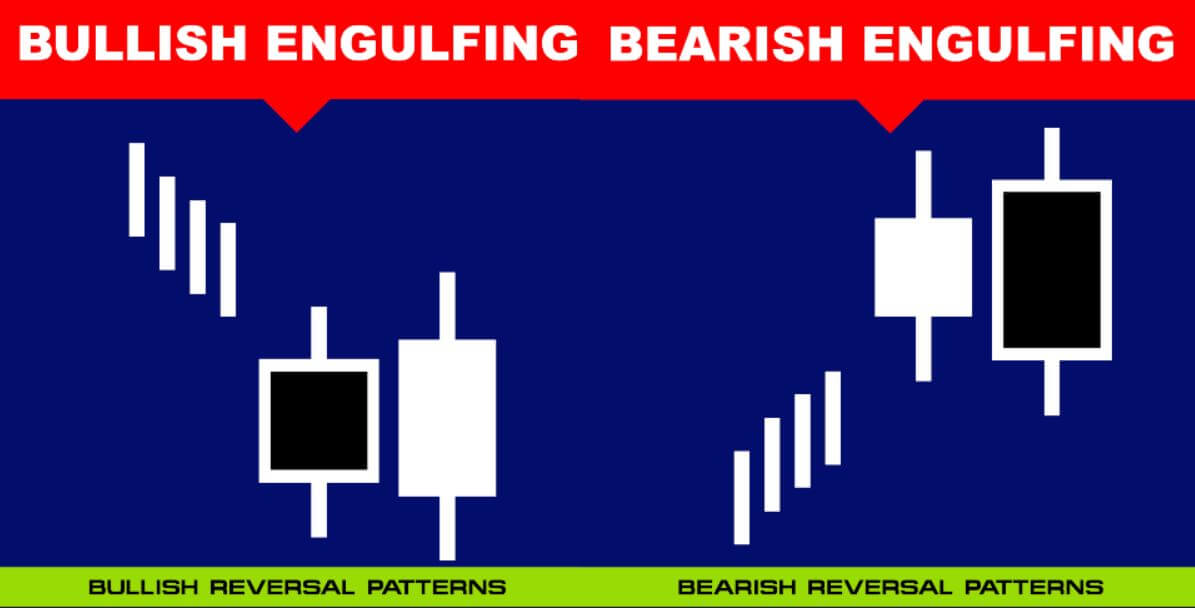
Engulfing is one of the most prominent candlestick patterns in the market. This Pattern frequently appears in the Forex market than the stock or futures market. There are two types of Engulfing Patterns in the market – Bullish Engulfing Pattern & Bearish Engulfing Pattern. Engulfing is either a bullish or bearish reversal pattern, and it prints at the end of any prevailing trend.

Bullish and Bearish Engulfing Patterns

The Bullish Engulfing Pattern always appears in a downtrend. It is a three candle pattern. The first candle is Red; the color of the second candle doesn’t matter. Most of the time, the second candle is a Doji candle. The third candle is super important as it must be Green in color for the pattern confirmation. Also, it must close above the first Red candle.

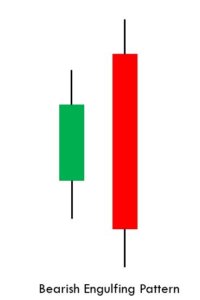
Conversely, the Bearish Engulfing Pattern appears in an uptrend, and it indicates the bearish reversal. The first candle is Green in color, and that suggests the uptrend is still ongoing. The second candle is Doji, and the color doesn’t matter much. The third one is the decision making candle, which must be Red in color. This indicates the buyers not having enough power to lead the market.

Trading Strategy

Buy Example

This strategy works very well in all the timeframes. So irrespective of you being an intraday trader, swing trader, or an investor, you can still use this strategy. If you are a 60-minute trader, only trade with the current timeframe trend. Adding additional timeframes to this strategy often creates confusion, and as a result, it leads to wrong decision making. The strategy is as follows:

  • The very first step is to find a downtrend in any underlying security.
  • With a bullish view, look for a Bullish Engulfing Pattern.
  • Then apply the Stochastic Indicator on to the charts
  • To take a trade, the Stochastic must be in the oversold area. If the Stochastic is at the overbought area and you see a Bullish Engulfing Pattern, do not take the trade.

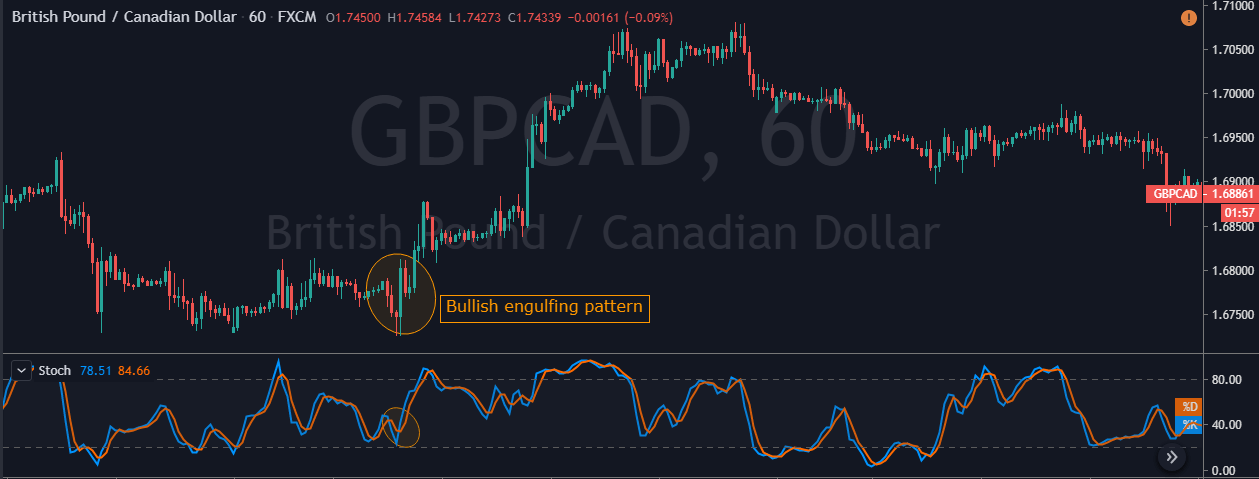
In the below GBP/CAD Forex chart the bottom panel shows the Stochastic Indicator. We can see the market was in an overall downtrend. At the end of the downtrend, we can notice the market printing the Bullish Engulfing Pattern. We can also see the crossover of the stochastic indicator at the same time.

This shows that the sellers are exhausted and buyers gaining control in this pair. If at all you are trade the Engulfing patterns alone, make sure to wait for two to three confirmation candles after the Pattern to enter the trade. Here, in our case, there is no need to wait for the next two-three candles as Stochastic confirms the Bullish Engulfing Pattern’s signal. Also, if we would have placed the Take Profit accurately, the winning pips in this trade would be huge. Hence we call this the most profitable candlestick pattern.
Sell Example

  • Firstly, check if the market is in an uptrend.
  • With a bearish view, look for the Bearish Engulfing Pattern.
  • The third step is that the Stochastic must be in the overbought area.
  • If the Stochastic is at the oversold area and market prints a Bearish Engulfing pattern do not take the trade.

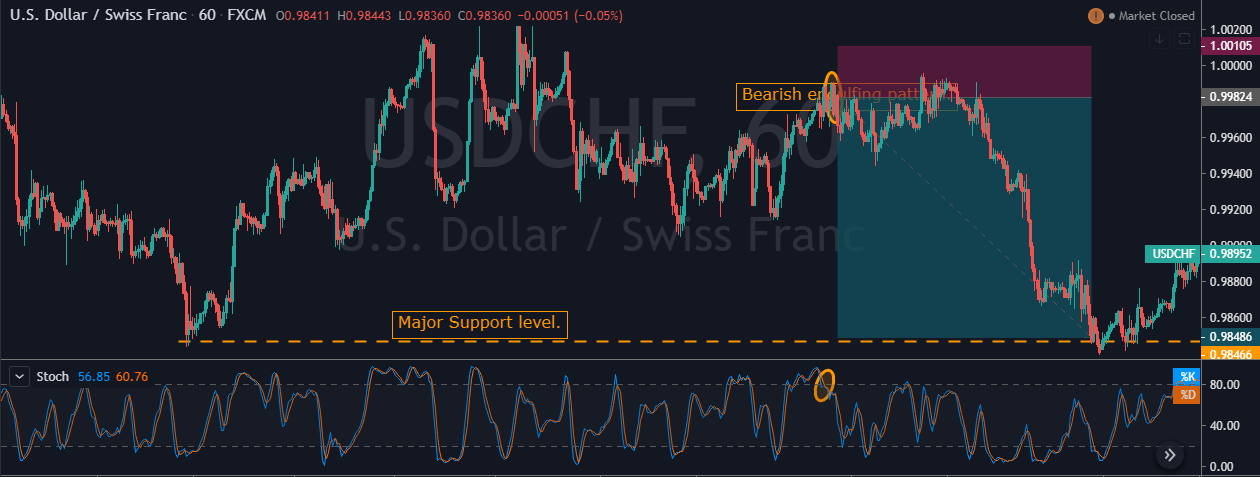
In the below USD/CHF Forex pair, the overall market was in an uptrend. When the market turned sideways, it has printed the Bearish Engulfing Pattern. We can also see the Stochastic Indicator in the overbought area. Hence this is a clear indication of Sell trade in this pair. After the signal, price action turned sideways for a longer period. Here, a lot of amateur traders exit their positions if the price takes too long to respond.
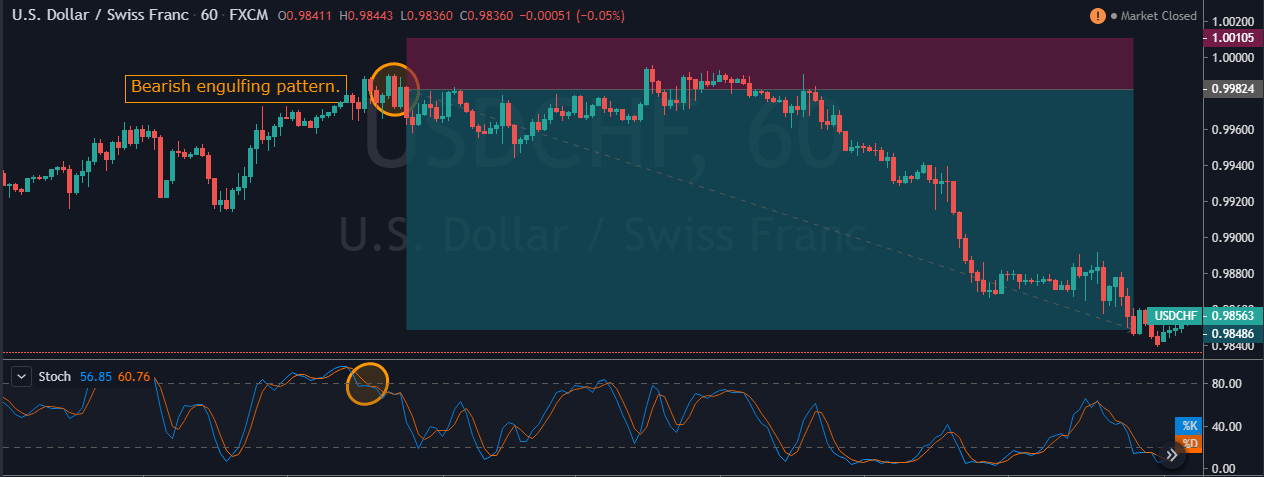
But we suggest you have faith and only exit your trades when it hits the stop loss. In our case, we can see the price action holding for sometimes, and when it rolls over, it gave stronger moves. In the below image, we can see that after holding sideways, price action dropped very hard, and we booked full positions at the major support area.
Bottom line

Engulfing Pattern is quite popular, and one of the most profitable patterns that exist in the industry. It often provides good risk-reward ratio trades. When we master the combination of Engulfing Patterns and the Stochastic Indicator, we can easily take our trading to a whole next level. Combining these two technical tools is a sound approach, as they quickly help us in filtering low probability trades. This strategy works well in both ranging market conditions and trending/dying market conditions.

We hope you find this information useful. Test this strategy in a demo account before applying it to the live markets. Cheers!
Categories
Forex Daily Topic Forex Price-Action Strategies

Consolidation and Breakout: The Two Key Movements in Price Action Trading

Price action trading mainly relies on consolidation, trend, and breakout. Reversal candle is another feature that traders keep an eye at. Typically, double top/bottom, morning star/evening star, and engulfing candle are considered the strongest reversal signal. However, even an inside bar may create an excellent bullish/bearish momentum if the price consolidates and makes a perfect breakout. In today’s lesson, we are going to demonstrate an example of this.

We are looking at an H4 chart. It shows that the price heads towards the North with extreme bullish momentum. A bearish inside bar followed by another bearish candle makes a reversal. The price after being bearish may have found its support. The buyers are to wait for the price to make a bullish breakout at the level of resistance. The sellers are to wait for consolidation and a bearish breakout at the level of support.

The price starts having a correction. If it keeps going towards the North further, it may get choppy. If it finds its resistance nearby, the sellers may find an opportunity to go short on the pair.

The chart produces a bearish engulfing candle. It means the price finds its resistance. If it makes an H1 breakout at the level of support, the sellers may want to trigger a short entry. Let us now have a look at the same chart with those two levels.

The equation gets much simpler with those two levels. Since this is an H4 chart, the sellers are to flip over to the H1 chart to get a breakout and trigger a short entry. The reversal candle looks strong enough to make the sellers keep an eye on the pair to take a short entry upon a breakout.

This is how the H1 chart looks. The price seems to have found two levels of support here. However, the H4 chart looks very bearish, which may keep driving the price to make a breakout at the level of red marked support.

Here comes the breakout. The candle closes well below the level of support. It has a long lower shadow, but it has a thick bearish body as well. The sellers may trigger a short entry right after the candle closes by setting stop loss above the resistance. Take profit may be set at the last swing low on the H4 chart. Let us proceed to the next chart to find out how the entry goes.

The price heads towards the South with good bearish momentum. It makes another bearish breakout at the last swing low as well. Concisely, the sellers grab some green pips from the entry.

If we concentrate on the first candle of the trend, we see that the candle is a bearish inside bar. An inside bar is considered the weakest reversal signal. However, it produces an excellent short signal here because of perfect consolidation and the breakout. The above example signifies the importance of consolidation and breakout in price action trading.

Categories
Forex Basic Strategies Forex Trading Strategies

How To Trade The Engulfing Candlestick Pattern Using Support/Resistance

Introduction

Engulfing is one of those candlestick patterns in the forex market that provides a useful way for traders to anticipate a possible reversal in the trend. There are two types of engulfing patterns – Bullish Engulfing and Bearish Engulfing. The engulfing candle’s bearish or bullishness is wholly based on its position in relation to the existing trend of an underlying asset.

Understanding The Types

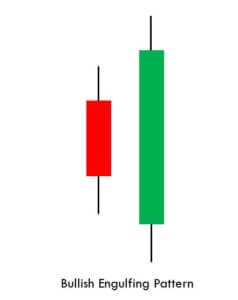
A bullish engulfing pattern can appear anywhere in the trend. But it holds more significance if it appears in a downtrend. This pattern indicates the surge in buying pressure as it shows that more buyers are entering the market, driving the price action further up. This pattern consists of a bearish red candle and the second bullish candle completely engulfs the body of the previous red candle.

Interpretation – Always look for the bullish engulfing pattern in a clear downtrend. For entering a trade, traders must combine this pattern with support resistance levels or with any reliable technical indicator for additional confirmation of the trend reversal.

Bearish engulfing pattern is just the opposite of the bullish engulfing pattern. Instead of appearing at the bottom of the trend, this pattern appears at the top of the trend. We can say that more accurate and reliable signals can be generated when this pattern appears at the top of an uptrend. The bearish engulfing pattern consists of two candles. The first one being the green candle. This one is, next, engulfed by the subsequent red candle. The pattern triggers a reversal in an existing trend. It indicates the buyers are no longer able to push the price higher, and the bears took control of the market.

Interpretation – Always look for the bearish engulfing pattern in a clear uptrend. The second red candle must engulf the green candle ultimately, showing that bears are piling into the market aggressively. For entering a trade, traders must look for additional confirmation, such as support resistance levels or by using any reliable technical indicator.

Pairing the Engulfing pattern with Support/Resistance

Every trader has a unique way of trading the market. Some traders like to go with the trend while some traders only trade counter-trend moves. In this strategy, we have paired the engulfing pattern with support & resistance to show you how to trade the reversals correctly.

Confirm the downtrend first on your trading timeframe 

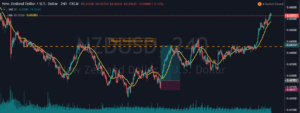
The first step of this trading strategy is to confirm the trend of any underlying asset. Let’s trade the bullish engulfing pattern. So as discussed, we should be finding the downtrend on the price chart. As you can see in the below NZD/USD currency pair was in an overall downtrend.

Find out the Bullish Engulfing pattern on your trading timeframe

The key to successful trading is to follow all the rules of the trading strategy. The engulfing pattern can be seen all over the price chart, but obviously, we can’t trade all of these patterns. We should be trading only those engulfing patterns that appear in the major support area.

In the below image, the NZD/USD was in an overall downtrend, and price action respects the major support area. Market prints the engulfing pattern at the support zone, which indicates that the buyers are more likely to lead the price.

Entry, Take Profit & Stop loss

Enter the trade right after you see the bullish engulfing pattern at the S&R area. Take-profit targets depend on your trading style. If you are a swing trader or full-time trader, hold your positions for more extended targets. If you are an intraday trader, close your position at the nearest resistance area.

You can also book partial profits at a significant resistance area and close your full position when the market prints the bearish engulfing pattern. In this strategy, we took the buy at a significant support zone, so it’s a healthy practice to put stop loss just below the support area.

Look at the below image; you can see that price action goes above the significant resistance area. But we made sure to close our positions at the resistance area as we don’t want our money to be blocked in a single trade for a long time. Overall it was good 4R trade.

Bottom Line

There are so many different ways to take trades to use the engulfing pattern. Statistically, the engulfing pattern works better when traded at the bottom or top of the trend. So make sure to check their location before placing the trades. One other possible way to trade am Engulfing Pattern is when it is combined with Moving Averages. But even that way, make sure to trade the engulfing pattern at the significant support and resistance areas. Some traders use reliable indicators like MACD to confirm the trend reversals by using the overbought and oversold levels. That’s about the Engulfing pattern strategy. Make sure to find these patterns and trade them in your upcoming trading activities. Let us know if you have any questions in the comments below. Cheers!