Although the currency market is the largest market in the world, there are still many traders who have no idea how it works. So, the reality is that there’s a fair amount of prejudice against currency trading. Some traders even fear the market. If you’re one of those traders, be sure to read this article carefully.
In it, we will present to you the most important basic concepts of the currency market or Forex trading and show you the possibilities it offers. But even for readers with a lot of experience in this market, this article will be an interesting read, in which they will still be able to learn a little more.
Anyone who has made the decision to prove himself in the supreme discipline of traders must become intensely familiar with the currency market. If you know how the market works and what tools are available, you can optimally plan your operations and succeed.
Which players are represented in the market, how should risk and money be managed, what are the possibilities of analysis, and what are the most proven strategies? In this article, we want to work step by step on the most important points so that you can finally start successfully in the currency market (Forex).
What is Forex?
In the Forex market (currencies), currencies (currencies) are traded on the OTC market (over the counter). In other words, there is no central market but only OTC operations. The foreign exchange market is made up of banks, large companies, central banks, funds, intermediaries, and private investors. The Forex market gives the trader a chance to actively trade in the currencies of different countries, with private traders who can only actively trade in the foreign exchange market since the mid-1990s.
Previously, it was available only to institutions. The special feature of this currency market is that it is open on Sunday afternoons and remains active until Friday evening. During this time, it is open 24 hours a day, with a daily trading volume of around $6,000 billion, much more than any other market. Of course, it has its advantages. For example, you can trade when you have time currency pairs that are actively trading.
For example, suppose you live in Germany and have a window of opportunity from 08:00 to 10:00 when European stock exchanges open. In this case, for example, the currency pairs GBP/USD and EUR/USD could be very interesting. In general, the Forex market is very flexible and is able to create a timeline based on individual criteria.
What Moves the Market?
Economic data, in particular, has a significant impact on the Forex market, especially if a particular message deviates significantly from analysts’ and investors’ expectations. In some cases, however, a central bank could take a completely unexpected step at a certain point, leading to a dramatic price change in the currency market. Therefore, a position that is opened immediately before the central bank meeting is not advisable.
As with any trade, you should always remember to limit your losses through a limit on the Forex market, and consider what can happen when you post a specific message that moves the price directly to your loss limit. The amount lost due to a certain position is the question that must be asked again and again.
Entering the Currency Market
Currency pair trading can be done in different ways. Private investors, by choosing a suitable intermediary, gain access to various products with which they can directly or indirectly implement their trading ideas in the Forex market. In the case of cash trading, the two partners trade foreign currencies among themselves. For example, if Bank A with Bank B exchanges EUR 10 million/USD at an exchange rate of 1.30, Bank A will have to transfer USD 13 million. The A will receive 10 million euros from Bank B. The classic currency transaction is also available in a slightly modified form in private Forex trades under the name Spot Business.
Some brokers also offer trading with Forwards. Both methods are usually transactions based on a margin deposit; that is, with leverage. However, compared to cash trading in the interbank market, the foreign currency is not delivered but is “transferred” until the position is closed with an opposite order.
Costs Incurred
Since the foreign exchange market is an interbank market and therefore does not incur additional fees to the stock exchange services, its trading is relatively cheap. Therefore, depending on the broker model, the trader only has to pay the differential or a combination of fork and commission. The tighter the hairpin, the better for the trader.
Since the currency market is very liquid, the odds of tight ranges are usually quite good. At the same time, dispersion is an important criterion when selecting the broker (in combination with commissions). However, traders need to know if the hairpin is fixed or flexible. In turbulent times, it can be a significant disadvantage when it suddenly reaches an expansion.
In addition, there may also be large differences between individual intermediaries in terms of corporate policy. Therefore, make sure that your broker guarantees the execution of the order and the setting of your loss limit. You should also make sure to include redundant systems to protect your hardware and software so that your commands always run, even if the server fails you during an operation. It should be noted that even in the less regulated currency market there are regulators who supervise many intermediaries, for example, the NFA (National Futures Association) in the U.S. The U.S. and the FCA (Financial Conduct Authority) in England.
On their websites, investors receive full information about private currency trading. Operators should be careful if the agent is in a peripheral country.
Trading Practice – Fundamental Analysis
The fundamental analysis analyses the causes that influence supply and demand in a given currency and thus determine the exchange rate. In assessing supply and demand, they consider, inter alia, the economic situation, and developments in the two currency areas included in each currency pair.
The development of factors such as interest rates, inflation, politics, and society, as well as economic growth plays an important role. Using models, it is possible to assess in a long-term context how a change in certain influencing factors affecting a given currency would affect and whether the current exchange rate seems justified. The exchange rate, which results from the models, is however only a theoretical guide.
In fact, prices may deviate from this, as particularly difficult future expectations to measure are included in price formation. Basically, however, it applies to the analysis: if the current price is below the value of the model, there is talk of an undervaluation, in the opposite case of an overvaluation.
Interest Rate Parity
The simplest model is interest rate parity. It requires traders to invest where they can achieve the highest return. Investment opportunities should have a similar level of liquidity and comparable risk. Capital flows between the two countries are based on the interest rate spread between the two currency areas, according to the interest rate parity model. If the interest rate is higher abroad, traders transfer their money there at the current exchange rate.
Later, the money is transferred back to the source at the current exchange rate. Depending on how the exchange rate develops during the investment period, it will have a positive or negative impact on profitability. If there were no exchange rate movements, the return would simply correspond to the foreign interest rate. Then, later, each investor would keep their money in the currency offering the highest interest rates.
Balance of Payments
In contrast to interest parity theory, the balance of payments attempts to explain exchange rates with a holistic approach. The focus is not on the return efforts of investors, but on the flow of goods and capital flows between the respective economies of a currency pair. The balance of payments is a systematic record of economic transactions between private and public households, as well as businesses and banks at home and abroad. It consists mainly of the current account and the capital account. The current account records all transactions in the goods market.
The current account balance is often defined as the “external contribution”. In other words, it’s about the difference between exports and imports of goods and services. If a country has a positive external contribution, domestic capital increases as a result of net capital inflows. If, on the other hand, imports exceed exports, money flows out of the country and domestic assets diminish. The capital account records accounts receivable and household liabilities vis-à-vis other countries. Here, a distinction is made between capital imports and exports.
The difference is also called the net export of capital. If the performance and financial balance are not the same, an imbalance between the supply and demand of a currency is created. The resulting movement of the exchange rate returns the relation to the equilibrium point. Fixed exchange rate systems may also have long-term imbalances in the balance of payments.
Purchasing Power Parity Theory
The third model, the absolute theory of purchasing power parity (also known as purchasing power parity, PPP), compares the purchasing power of 2 currencies. The key message of the theory is that one currency that has been changed to another in the corresponding country will have the same purchasing power and therefore the same real value.
The external price level after conversion of the exchange rate should correspond to the domestic price level. If the exchange rate deviates significantly from this equilibrium, there should be a tendency to return to equilibrium according to this model, since in principle there is a possibility of a gain.
If, for example, a computer in the U.S. (In Euros) costs less than in the Eurozone, it would be worth buying it in the U.S. and reselling it in Europe. It’s worth it. The difference between the purchase price (converted to euros) and the sale price continues to provide a profit.
However, to purchase a computer in the United States, you will need dollars. The supply of the euro and the demand for the dollar will subsequently lead to an appreciation of the dollar, with the result that purchasing power in both monetary areas is adjusted. A popular example of this model is the so-called Big Mac index. This is a simple-built index of people’s buying power published regularly by The Economist.
The basis for calculating purchasing power is a comprehensive description of the prices of a standardized and readily available product: the Big Mac at a McDonald’s restaurant. For example, if a Big Mac in the U.S. costs $ 5.28 on average, while the price in Germany is $ 3.95, the theoretical exchange rate is $ 5.28 / € 3.95 = 1.34. If the current exchange rate deviates significantly from the theoretically determined value, it would be adjusted to this long-term value according to purchasing power parity. In reality, the purchasing power parity theory considers not only a good but a complete shopping cart. Moreover, not all price differences generate an opportunity for profit, as taxes, transport costs and customs duties must be considered.
Many goods cannot be marketed worldwide, especially services or haircuts which are not transferable. Therefore, the shopping cart should only contain marketable products worldwide.
Technical Analysis
A general topic of controversy is whether the technical analysis in the currency market makes sense. On the one hand, there are so many price adjustments that many patterns can arise. On the other hand, the market is so inefficient that these patterns (theoretically) cannot function sustainably. However, most of the tools provided by Technical Analysis (TA) are well used in foreign exchange trading.
Classic graphics formations, such as trend channels or resistance and support lines, can be used, as well as the most advanced techniques of trend recognition, indicators, and oscillators, as well as candle formations. Due to the trend behaviour of the currencies, a relatively unknown type of graph is offered for the correct exchange rate analysis: the so-called “Graph of points and figures” (P&F – Point and Figure). This is a variant of alternative representation to the bars and candles graphics that are widely used.
In the foreground of the P&F table is no longer the movement of price in temporal terms, but the development of movement. Times when only small price changes (i.e., lateral movements) occur are filtered out of the table. A variant of similar representation, but more visually understandable, are the so-called Renko graphics. Both types of charts work with trend lines, indicators, and formations. When using it, you should always keep in mind that the time axis, unlike the “normal” graphics, is variable. Therefore, it may happen that the chart does not change over a longer period of time, if price fluctuations were too low or if a significant movement has not developed.
Various Time Levels
The methodology of integrating several time windows into the analysis and the resulting trading decisions are mentioned in the trader jargon as multiple time frame analysis. Due to the speed of the Forex market, this technique is particularly suitable. The concept derives mainly from 2 approaches. First, many operators check the situation in the main time window (for example, small time window: minutes chart, main time window: time chart) before entering a new position.
Only when the hourly chart does not have the resistance or support at the same level as the minutes chart and the exchange rate does not move in an opposite trend, will it enter the market. Second, many traders use this approach to enter into a long-term trend.
The smaller window often allows for a better entry time. However, once the entry is made, the operation will be managed in the longer-term chart. However, the danger of over-operation will be threatened. Instead of focusing on the long-term vision, many operators observe the position in the subordinated time frame, even after starting, and take unnecessary risks. If you consider support and resistance, you should start at the highest available time window and advance to the smallest primary unit in time.
Intermarket Analysis
The dollar, of course, is the most important currency in the world’s financial system. Consequently, the dollar index is excellent for analytical purposes. Just look at the index to read the strength or weakness of the dollar against the main currencies: if the index rises, the dollar shows strength against the other currencies. If the dollar index falls, this indicates a weakness against the other major currencies. To measure even how a known currency is developed one compares its value with a basket of 6 coins. Specifically, this is the weighted geometric average of the US currency in euros, Japanese yen, British pounds, Canadian dollars, Swedish krona, and Swiss francs.
Market observers, who are interested in the interactions of different asset classes, know that the United States dollar plays an important role in cross-market analysis. From the historical development of the price, it can be clearly deduced that the global currency has a long-term negative correlation with the commodity market.
You can see how commodities entered a massive bearish trend, as the dollar index had a brilliant rally in mid-2014. For this reason, the United States dollar or the associated concept of the United States dollar index plays an important role in cross-market analysis, which examines the interactions between markets.
Appropriate Strategies – Long-Term
Now that we have learned a lot about currency market theory, we also want to deal with its practical application. To this end, we present two strategies that are interchangeable, on the one hand, in the long term and, on the other hand, in the short term. The carry trade is well known in exchange operations. Behind it is a simple system: funds are generated in a low-interest currency and invested in a high-yield currency. The difference between interest rates and the change in price is most important.
If the exchange rate does not change during the investment period, the return on the carry trade equals the interest rate spread. Also, a rise in the price of high-interest rates versus low-interest rates will lead to a further increase in revenue. In this case, the return on the interest rate advantage is further increased by the favourable development of the exchange rate. On the contrary, a devaluation of the currency in which it is invested leads to a reduction in yield.
If the percentage devaluation is above the interest rate spread, the trader loses money. If there are significant fluctuations in exchange rates to the detriment of the investment currency, the strategy could incur correspondingly high losses.
Carry trade is a popular strategy for hedge funds, as they are suitable for large sums of investment. Fund managers seek to identify macroeconomic developments at an early stage and make cost-effective use of appropriate strategies. In the same context, there is often debate about leveraged carry trades. Only part of the negotiated sum is deposited as collateral, taking advantage of existing capital. A Deutsche Bundesbank study in 2005 based on carry trade in euros against the dollar shows an average yield of 15 %, a multiple of the interest rate spread. A maximum of 71% profit would be possible.
However, annualized yields can vary widely and be markedly negative from month to month. Although carry trade is a long-term currency strategy it represents an interesting trading approach in the past and today. However, due to the high potential for detractions, the risk should not be underestimated. Rapid market movements can wipe out accumulated earnings in months or even years.
Appropriate Strategies – Short-Term
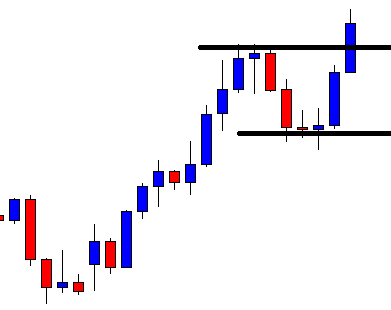
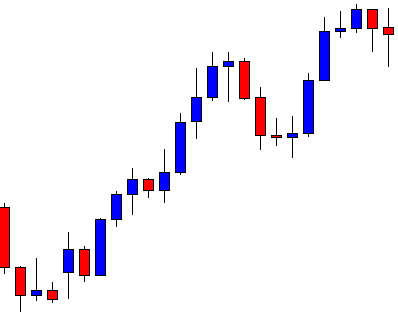
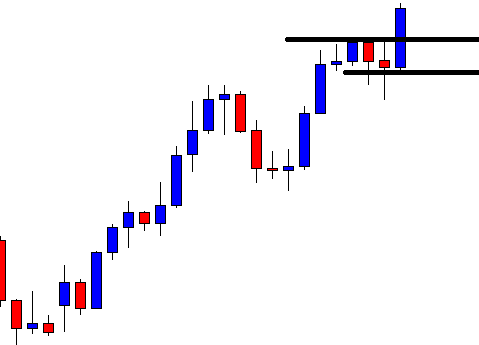
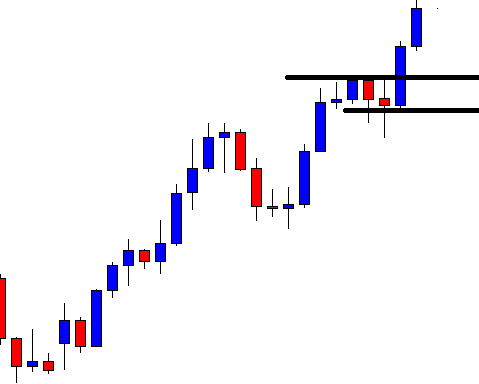
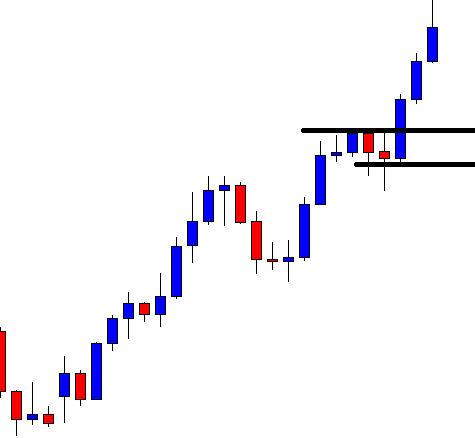
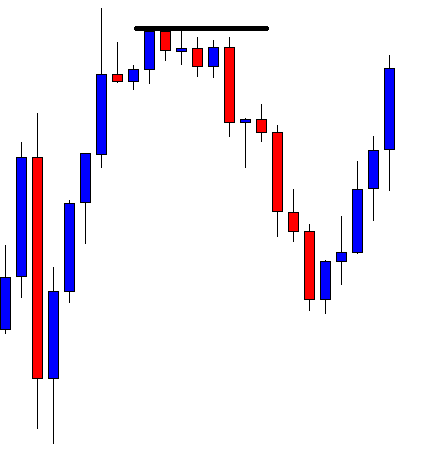
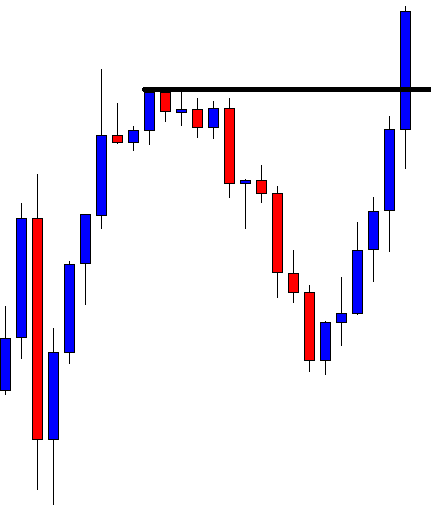
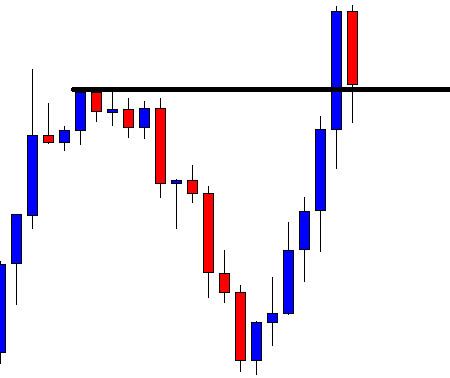
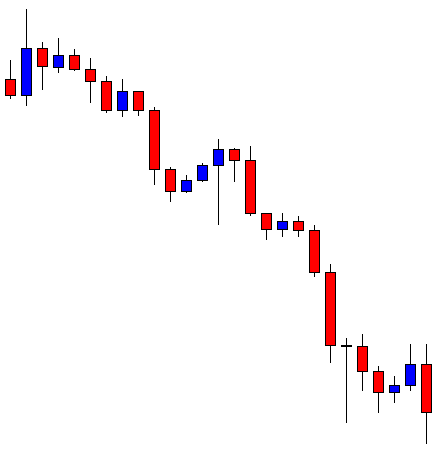
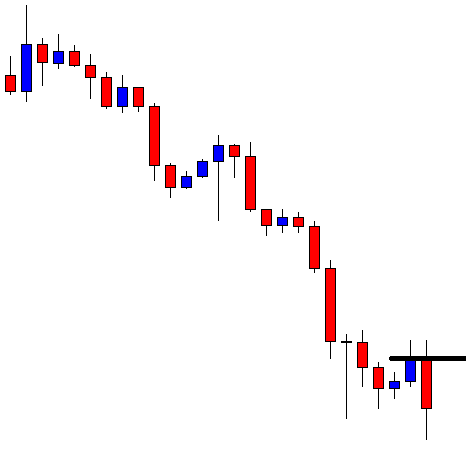
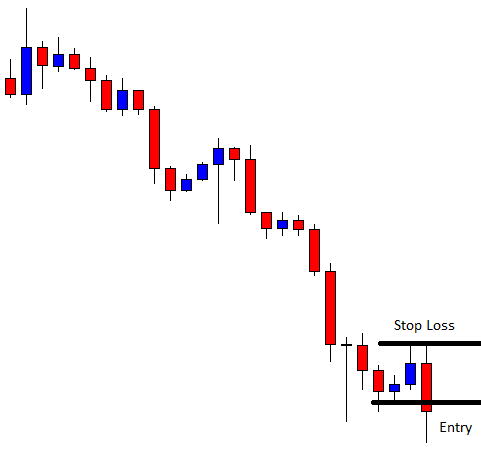
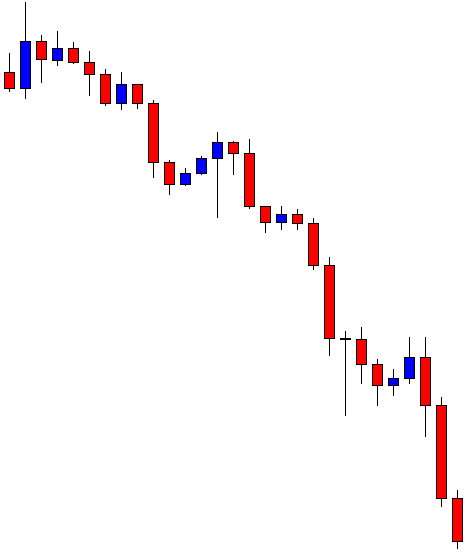
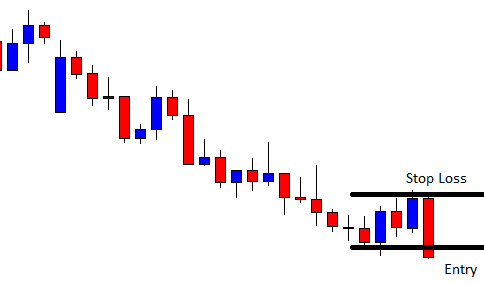
For short-term traders who want to generate profits in the volatile phases of the market, there is the breakup strategy of Maite Krausse. Breakage trading is a strategy used by many professional traders that offer satisfactory results in both swing and intraday trading. The best results are achieved in the volatile market phases or in strong trends, with uncertainty between market participants and continuous sidesteps minimizing the likelihood of successful entries. First, the range is displayed from 24:00 to 08:00 Central European Time (CET) on the 15-minute chart.
At this time, the maxima and minima are determined. Highs up to 8:00 a.m are considered the upper limit or resistance range, and lower prices represent a support level. If the price is now above the minimum marked or below the minimum, a purchase order is placed between 2 and 5 pips above the maximum, a sales order of 2 to 5 pips below the minimum.
This range is only valid during the respective day, after which it must be redefined and is therefore ideal for intraday traders. Orders are still valid until around 21:00. Thereafter, all pending orders are removed and redefined the next day. Once a purchase/sale order is activated, the transaction is carried out throughout the day, with a risk/probability ratio (CRV) of around 2:1 on mostly quiet days and a CRV of 4:1 on economically important days, given that the interest rate is a country’s decision.
For example, the loss limit (SL) can be set between 20 to 30 points. Profit-taking (TP) ranges from 40 to 100 pips, depending on market fluctuations. Therefore, a smaller TP will be chosen in the quiet phases of the market, and a higher estimated TP in days of interest rate decisions and global political events. Trading management is simple and must be set with an automatic limit of approximately 15 to 25 pips. In addition, in the 1-hour chart, you should pay attention to the areas of resistance or support in the area of the alleged inputs.
Therefore, a purchase order above the resistance, and a sale order below the support will be established. The most likely to benefit from this strategy lies mainly in the evolution of macro-influenced prices. Then, it is very useful to have a look at the daily economic calendar, as the greatest fluctuations are accompanied by surprises and new knowledge about the economic situation of a country and, therefore, the respective currency.
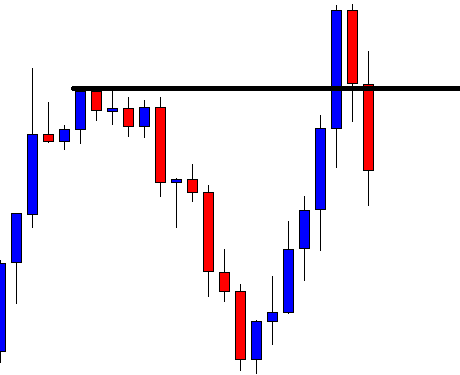
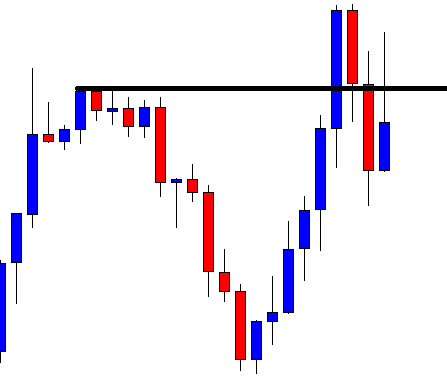
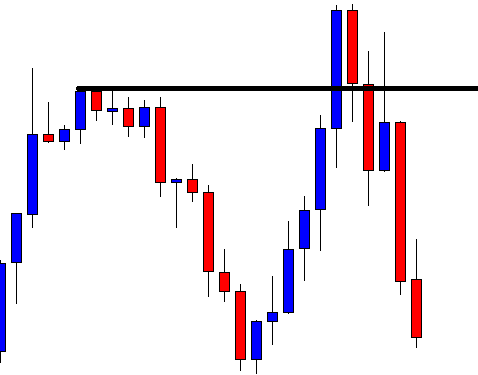
Particularly interesting are central bank decisions or protocols that provide directional indications. In those days, sometimes the profit can be generous around 100 or more pips. Inputs can be further improved by including breakdowns of price patterns such as upward and downward triangles, double floor/roof, and head and shoulders formations.
If the price has formed as a pattern, you should be careful and tune your inputs, because the buds of these patterns are often traded and are volatile. Another way to identify good break opportunities is through certain candle patterns that have formed on the daily chart. For example, the inner bar candle (also known as Harami bassist/bassist), can predict an imminent break, both in trend and in reverse, which is often used.
There is an inner bar formation when the next daily sail is of a different colour (day 2) and has its maximum and minimum price within the previous day’s sail (day 1). The entry is set on day 3 above/below the maximum/minimum sail of the second day.
Conclusion
The Forex market offers interesting trading opportunities that allow private traders to benefit from exchange rate changes. Whether it’s in the area of classic day-to-day operations, as well as to protect against price fluctuations or as a mix of separate strategies in the custody account. The advantages lie in the high liquidity and flexibility of the market and its 24-hour operation.
Moreover, foreign exchange markets always offer clear short-term trends. With trading margin and leverage, Forex is especially interesting for low capitalization traders. Operators also have the opportunity to choose between a more flexible interbank market, on the one hand, and standardised products, on the other. An investor will be able to choose from numerous trading instruments and strategies and combine them if necessary.



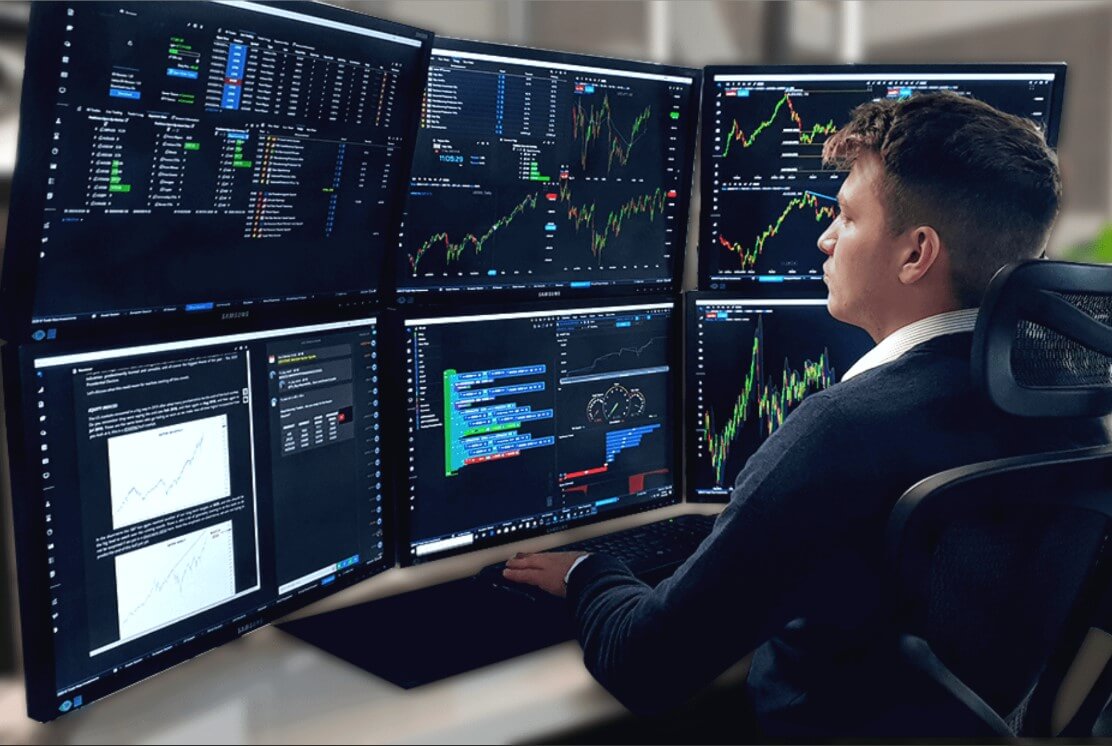



 Here we are going to try to pull back the curtain a little bit on a lifestyle of someone who trades daily, and who is close to understanding and anticipating the landscape of forex trading. We’ve been listening to all the time about different daily routines. About waking up early, trading, drinking coffee, going to the gym, taking our vitamins, reading news, trading again, and that’s it. That doesn’t tell us a lot, to be frank. What we can expect from this lifestyle and what it is? For all of you flashy people who think that lives of traders are super glamorous, if you think that every day is going to be a P. Diddy video, hot girls wearing bikinis, drinking cocktails, riding around the pool on roller skates, you better think twice. There are a bunch of traders around wearing Rolex watches, driving Bugatti cars, having the latest gadgets, and owning multi-million dollar houses, but we need to be reasonable and put those commodities on aside for a bit.
