Categories
Forex Daily Topic Forex Price Action

To Hold It or Not?

In today’s lesson, we are going to demonstrate an example of an H4 chart offering entry after consolidation. The price does not head towards the breakout direction after triggering the entry as expected. It is Friday and the market is going to close. The question is whether we hold the position during the weekend or close the position. Let us find this out.

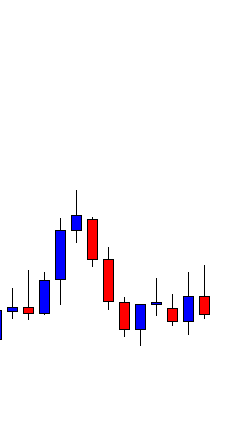
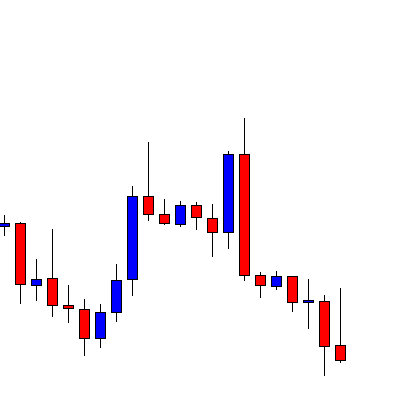
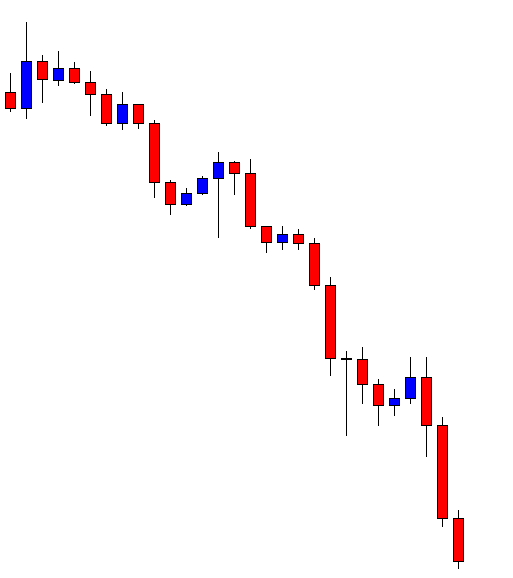
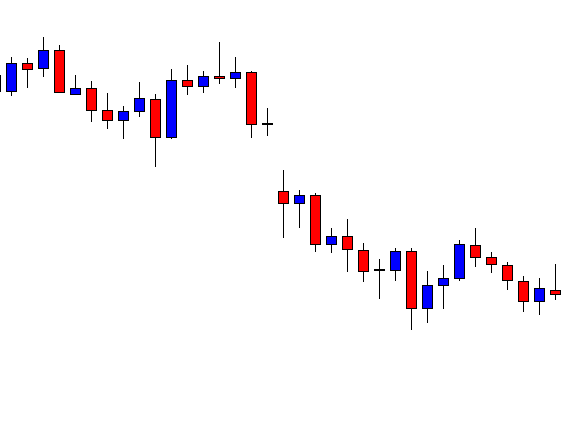
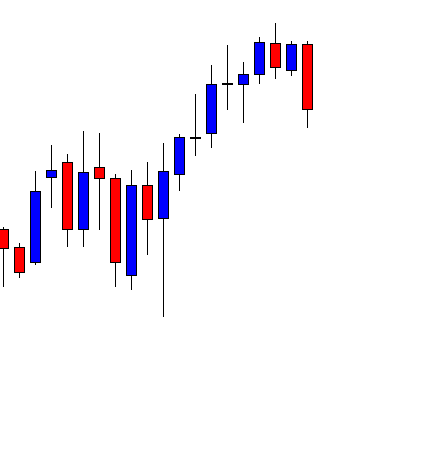
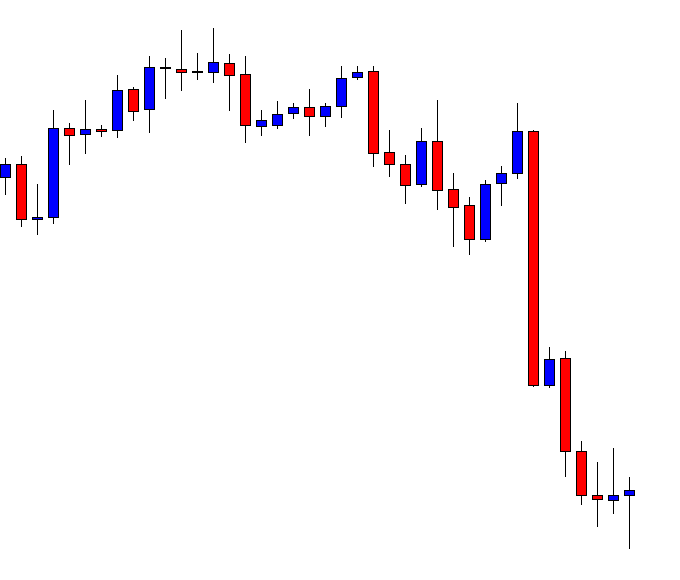
This is an H4 chart. The chart shows that the price heads towards the North with good bullish momentum. The last candle comes out as a bearish inside bar. The chart belongs to the buyers. The price may make a bearish reversal from here. The sellers must wait to get a strong bearish reversal pattern to go short in the pair.

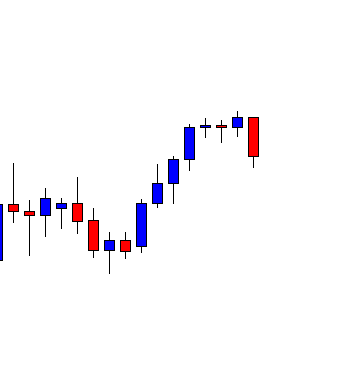
The chart produces another bearish candle followed by a doji candle. The buyers may wait for the price to make a breakout at the wave’s highest high to go long in the pair.

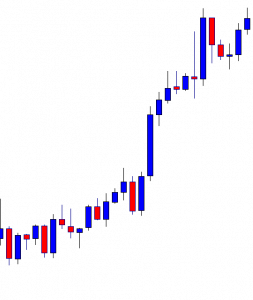
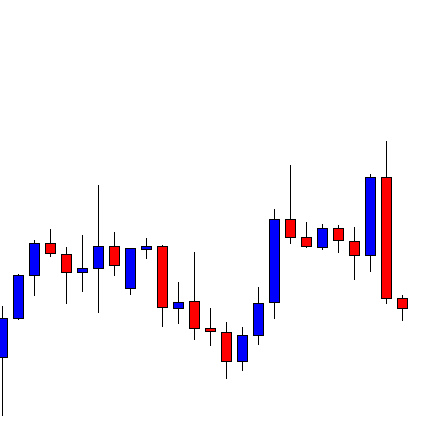
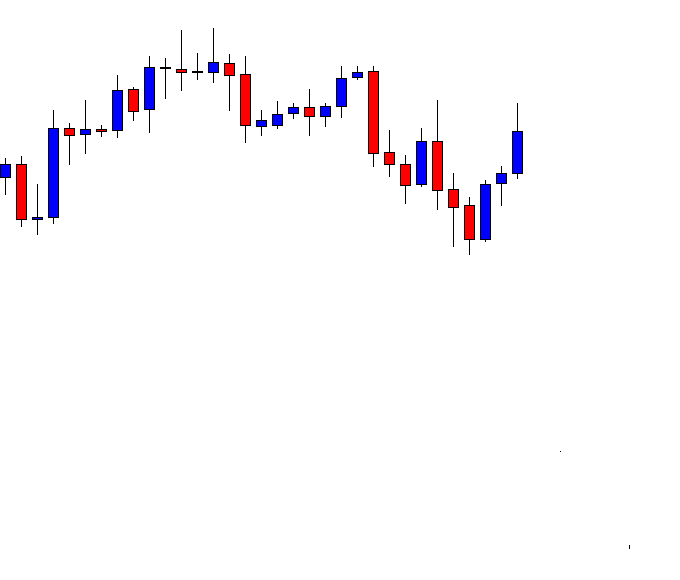
The price heads towards the North but does not make a bullish breakout. If the chart produces a bearish reversal candle around the level, it may get bearish. On the other hand, the buyers may still be hopeful that they get a bullish breakout to push the price towards the North further.

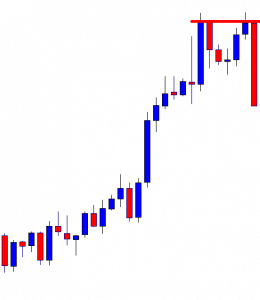
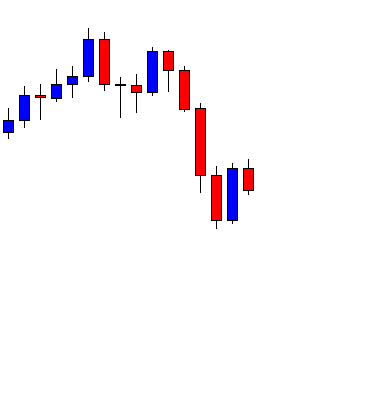
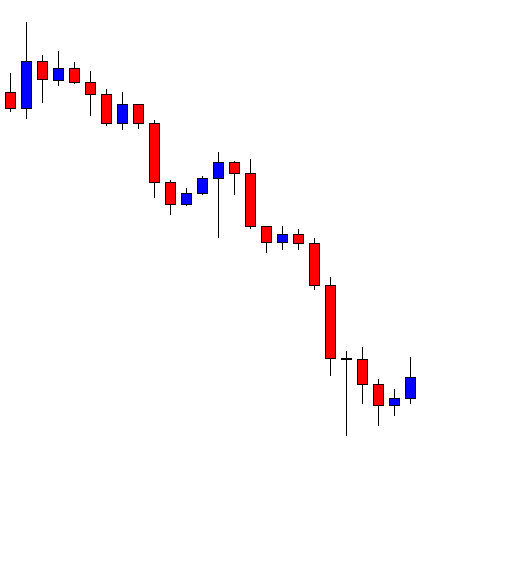
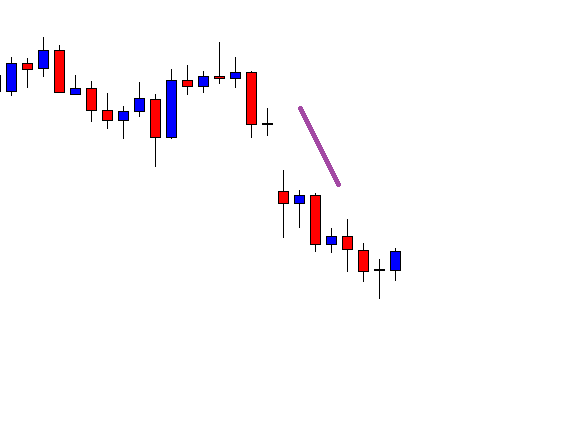
The chart produces a bearish engulfing candle right at the double top resistance. It makes a breakout at the neckline as well. Thus, the sellers may keep their eyes on the chart to go short and drive the price towards the South.

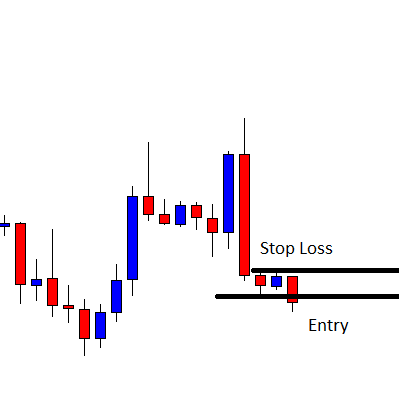
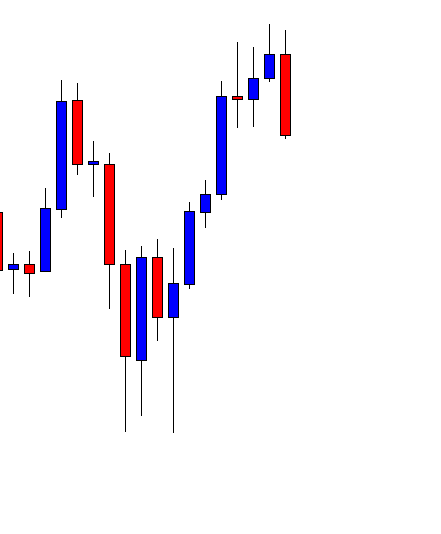
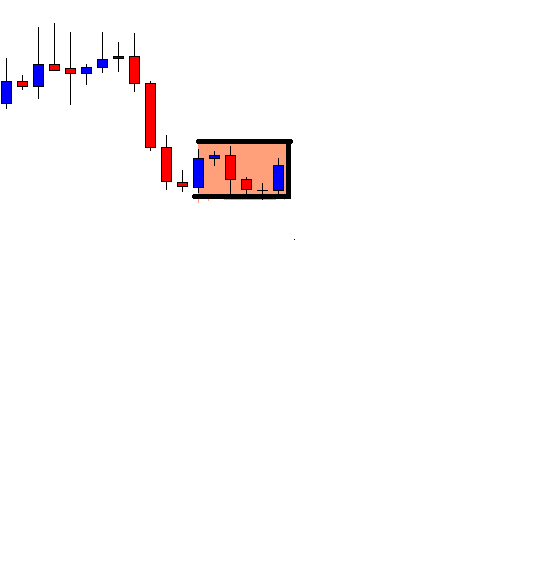
The price consolidates for a while. It produces a bearish reversal candle, but it does not make a bearish breakout to offer a short entry. The last candle comes out as a bullish candle. Both the buyers and the sellers must wait and let the price decide to give them a direction.

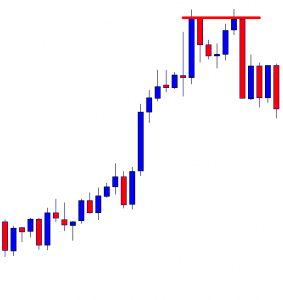
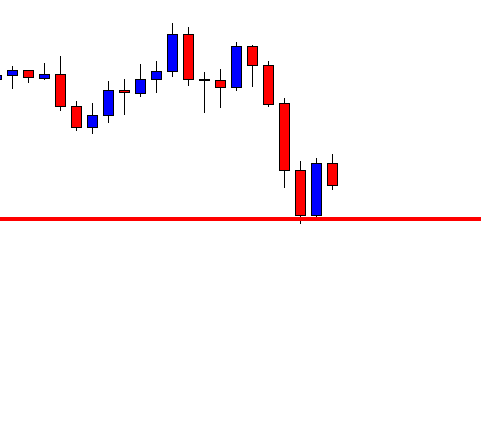
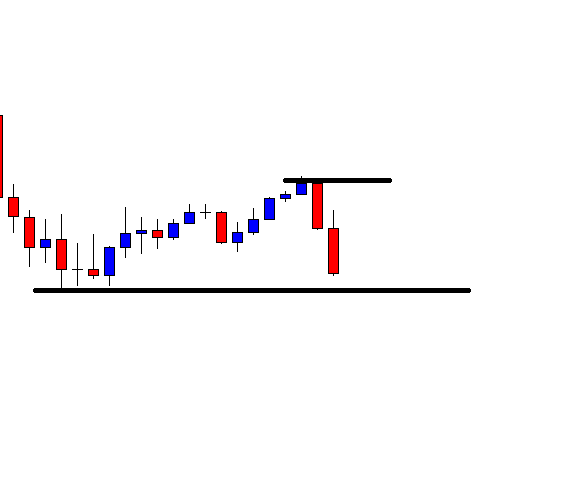
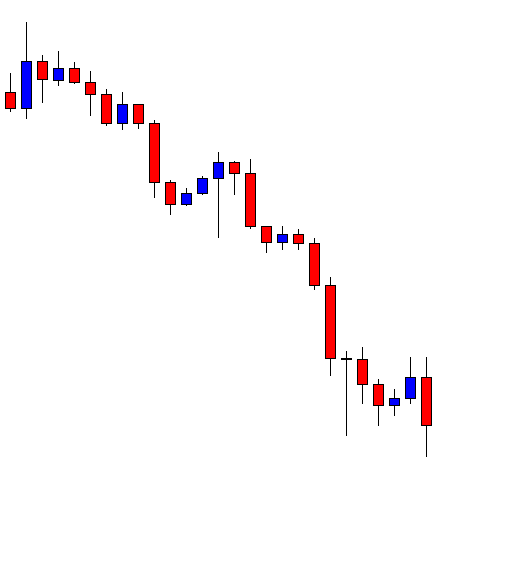
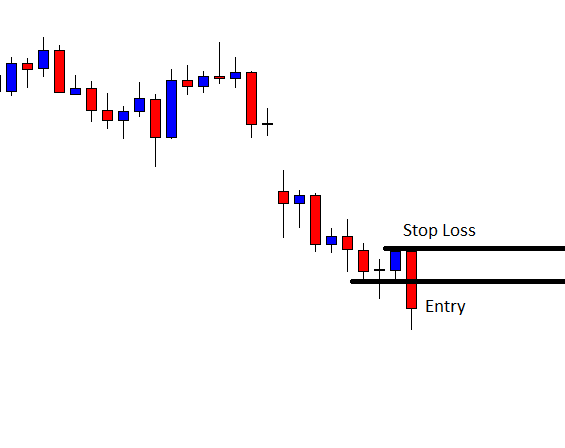
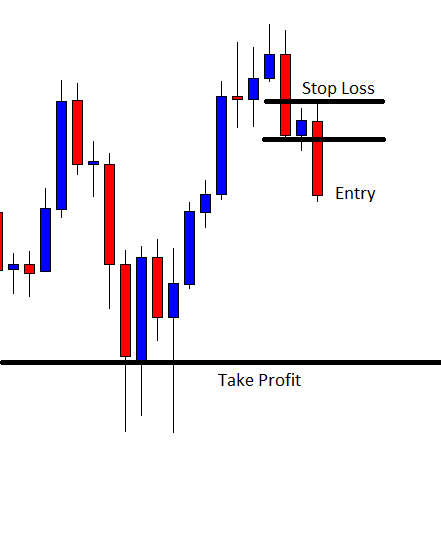
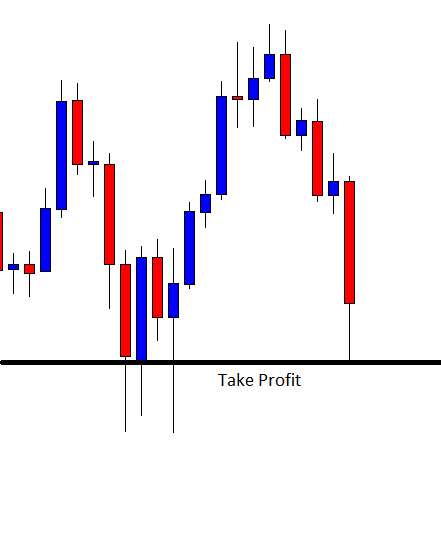
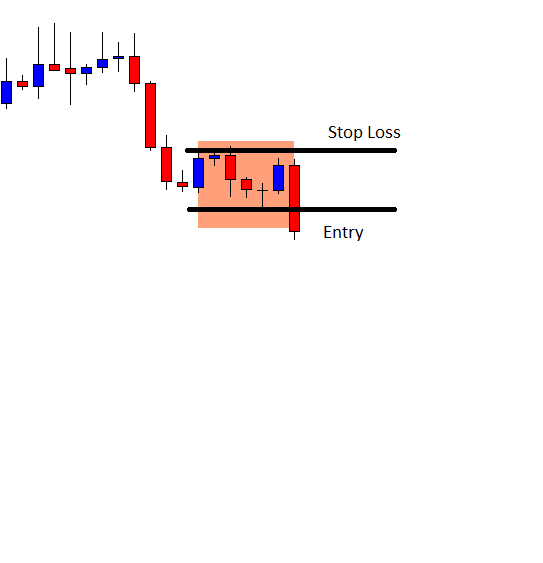
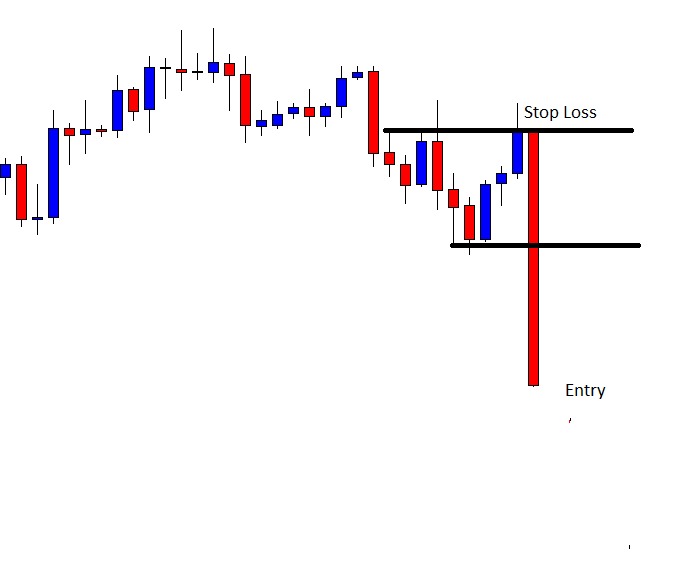
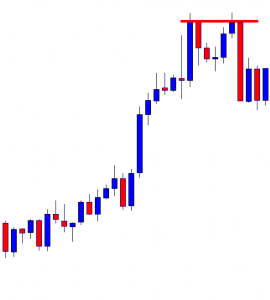
The chart produces a bearish engulfing candle closing well below consolidation support. The sellers may trigger a short entry right after the last candle closes by setting take profit with 1R. Let us proceed to the next chart to find out how the trade goes.

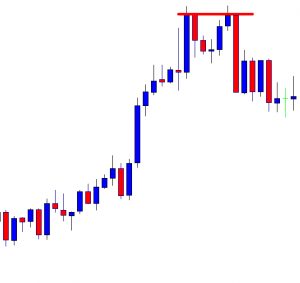
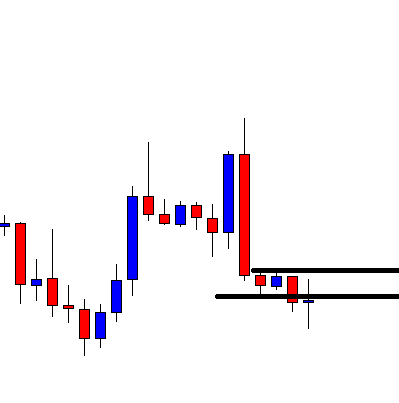
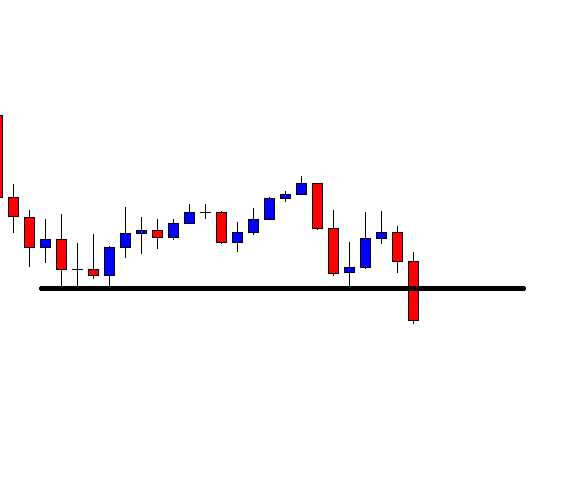
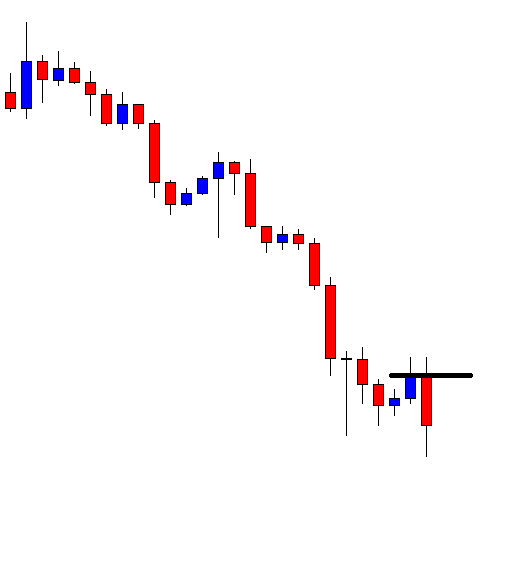
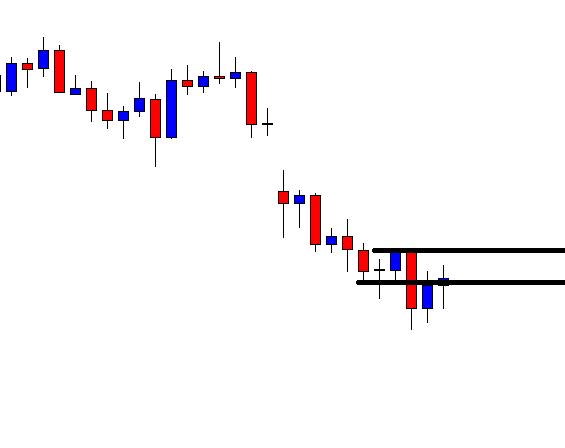
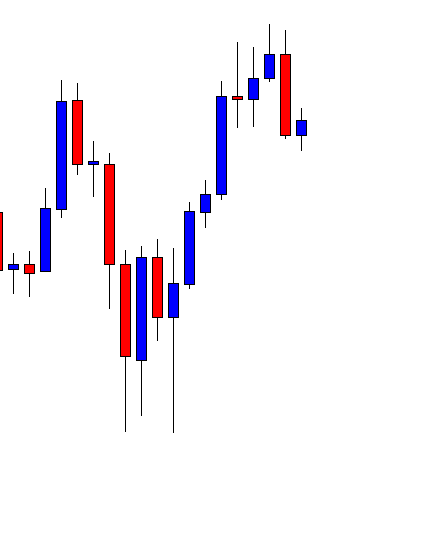
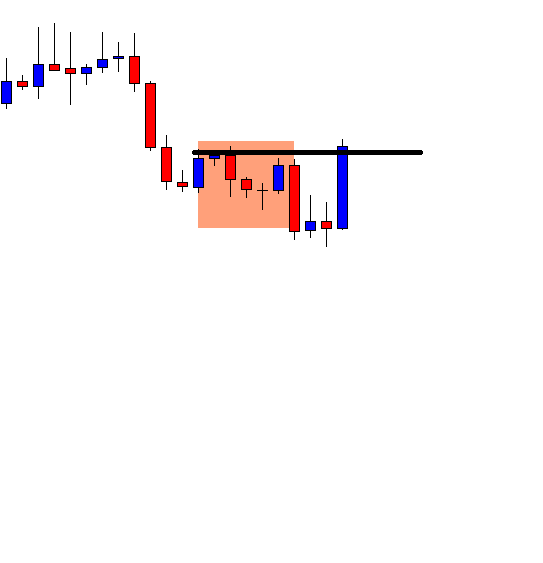
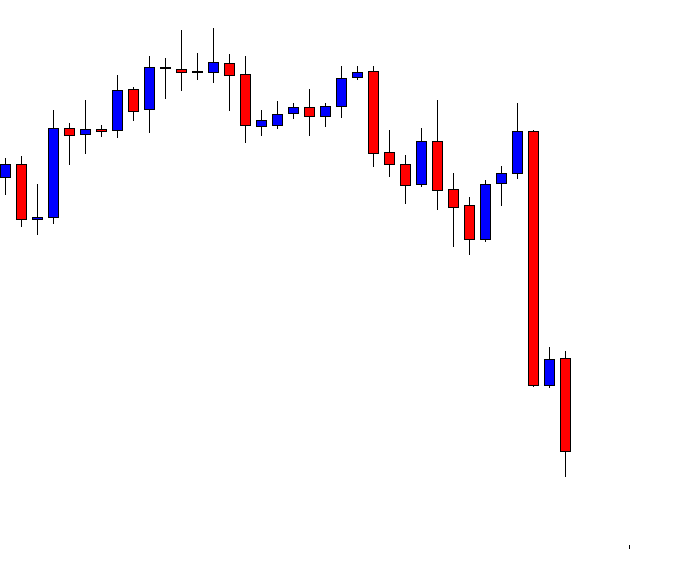
The price consolidates again. The chart upon producing a bearish engulfing candle at a double top resistance and getting consolidation, it does not move towards the trend’s direction. The sellers do not expect that. However, this is how the market goes. The market is going to close within three hours. Do the sellers close the position?

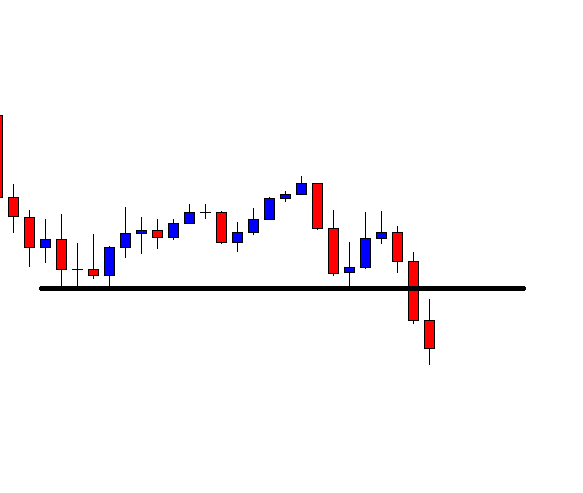
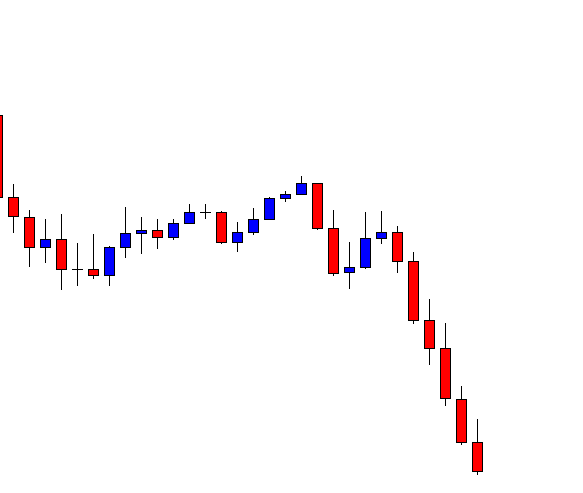
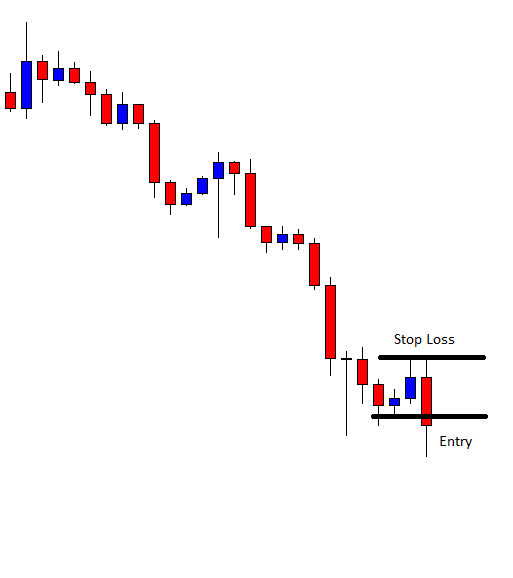
It is an H4 chart. If it were other intraday charts such as the H1, 15 M, 5M, we may close the position. In this case, the reversal candle is an engulfing candle; the reversal pattern is a double top; the price consolidates accordingly, and the signal candle comes out as a bearish engulfing candle as well. Thus, considering these factors the sellers may hold the position.


Categories
Forex Daily Topic Forex Price Action

When a Double Top and an Engulfing Candle Comes Together

In today’s lesson, we are going to demonstrate an example of a chart where the price heads towards the downside upon making a double top. At the second rejection, the chart produces a bearish engulfing candle. Usually, a combination of these two does not usually go wrong. The price does not make a deep consolidation afterward. However, it still heads towards the South with good bearish momentum. Let us have a look at how it happens.

This is a daily chart. The chart shows that the last candle comes out as a Shooting Star. The daily –H4 combination traders may consider it as a bearish reversal candle and flip over to the H4 chart.

The H4 chart shows that the price produces a double top. At the second bounce, the reversal candle comes out as a bearish engulfing candle. This combination may attract the sellers to look for short entries upon consolidation and getting bearish reversal candle.

The chart produces a bullish candle. It finds its resistance and produces a bearish engulfing candle closing below consolidation support. The sellers may trigger a short entry right after the last candle closes by setting stop-loss above consolidation resistance and take profit with 1R. Here is an equation that we may think about that. The price does not make a deep consolidation. Since the price is bearish upon a double top and an engulfing candle, most probably, it will make a strong bearish move. However, if you are in doubt, leave it out. Let us proceed to the next chart to find out what happens.

The next candle comes out as a doji candle. The price heads towards the Stop Loss, but it does not hit, though. It looks good for the sellers since the candle closes below the breakout level. Let us proceed to the next chart to find out what the price does.

The chart produces a long bearish candle and hits the target of 1R. Shallow consolidation may hold the price back a little to hit the target in a hurry. However, in the end, the sellers make some green pips with a combination of a Double Top and an Engulfing candle.

This trade setup does not meet all the requirements for combination breakout trading. The trend starts from a Double top resistance along with a bearish engulfing candle; it continues its bearish journey with more candles even after a shallow consolidation. This is what a combination of a Double Top/Bottom along with an engulfing candle can do. Thus, be keen on a chart if a trend starts with a combination of these two.

Categories
Forex Chart Basics Forex Daily Topic

Chart Combination Traders: Do Not Forget to Calculate This

In today’s lesson, we are going to demonstrate an example of the Daily-H4 chart combination, which may end up producing a trading signal. We find out soon whether it produces a trading signal or not in the end. Let us get started.

This is the daily chart. The chart shows that the price makes a strong bullish move. It seems that the price has found its resistance. The last candle comes out as a bearish engulfing candle. This suggests that the sellers in the intraday charts may get themselves engaged to look for short opportunities in the pair. Let us flip over to one of the major intraday major charts, the H4 chart.

The chart shows that the price makes a strong bearish move and produces a bullish engulfing candle followed by a bearish inside bar. However, the daily candle ends up being a bearish engulfing candle, thus the H4 sellers have an upper hand than the buyers.  Let us proceed to the next chart with some drawings in it.

The price bounces off at the red marked level. The sellers are to wait for the price to make a breakout at the level of support to go short in the pair. The last candle in this chart comes out as a bearish inside bar. The price may head towards the level of support and make the breakout. However, the sellers may have to wait since an inside bar is not a strong reversal candle. Let us find out what happens next.

The price heads towards the South and bounces off several times at the level of support. It does not make the breakout though. The last candle comes out as a bullish engulfing candle too. A bullish engulfing candle at the level of support indicates that the buyers may get themselves engaged in buying soon. Moreover, there are six H4 candles after that bearish engulfing daily candle (A trading day contains six H4 candles). The level of support has become daily support now. Thus, the H4 sellers must wait for the daily chart to produce another bearish candle before going short in the pair.

It is often seen that if an H4 candle breaks a daily support/resistance, the price does not head towards the breakout direction in a hurry. It often consolidates around the level, which sometimes makes traders lose money. The same thing shall be maintained in the H4-H1 chart combination as well. If an H1 candle does not make a breakout (after an H4 reversal candle) within next four H1 candles, the support resistance becomes H4 support/resistance. Traders shall wait for upcoming H4 candles to give them the price direction and trade.

Categories
Forex Price-Action Strategies

If Price finds New Level of Support/Resistance

To measure risk-reward, price action traders must identify the level of support/resistance accordingly. It gets tricky sometimes. In today’s lesson, we are going to demonstrate an example of that.

This is an H1 chart. The chart shows that the price has a bounce at a level. Upon producing a bullish engulfing candle, it heads towards the North. It finds its resistance and produces a bearish engulfing candle followed by another bearish one. If it makes a breakout and confirms the breakout, the sellers may trigger short entry by setting stop-loss above the level of resistance and take profit with 1R.

The price does not make a breakout, but it heads towards the North. The sellers must wait to find out what happens next. It may go back to the level of resistance, have a rejection at double top, and make a breakout.

It may even make a breakout from here. Let us find out from the next chart what happens.

The price finds its resistance at a new level. It produces a bearish engulfing candle again. If it makes a breakout at the level of support and confirms it, it would be a short signal.

The chart produces a bearish candle, which breaches the level of support. If the next candle closes below the last candle, the sellers may trigger a short entry.

The next candle confirms the breakout. The sellers may trigger a short entry right after the candle closes. Question is where do they set their stop loss and take profit? Do they use the new level of resistance to set stop loss and take profit or use the old one? We find out the answer in a minute.

The price heads towards the South with good bearish momentum. Trade setup works as well as it usually does in breakout trading strategy. The price keeps making lower lows, and it seems it may go further down. However, since the price makes an upward correction before making the breakout, we may consider the second level to set our stop loss. We may set our take profit with 1R by measuring the same number of pips from the entry point to stop loss as well. This provides fewer pips as a reward, but to be safe with an entry like this, we may do this. The price often makes a consolidation, or it makes a correction (once it hits 1 R from the new resistance/support) after such breakout. A correction/consolidation sometimes leads towards a trend reversal as well. Thus, there is no point in taking a loss for hunting some extra pips. Always remember ‘safety first.’

Categories
Forex Basics

Some Spikes are Not to Be Ignored

Forex traders often struggle with spikes on their trading charts. The Line chart does not show spikes, but Candlestick Chart does. Price action traders usually use candlestick charts as one of their weapons to trade effectively. Thus, they face this problem every now and then. There is no sure method confirming which spikes are to be ignored, and which are not to be ignored. We have to be sensible about that. In today’s lesson, we find out a kind of spikes that are not to be ignored. Let us get started.

The price heads towards the South with good bearish momentum. It finds its support and produces a bullish reversal candle. The last candle comes out as a bullish candle as well. The sellers are to wait for a bearish reversal candle to go short in this chart.

Here comes the bearish reversal candle that the sellers wait in such price action. We have not drawn any resistance line. If we closely observe, we find that the last two candles’ bodies suggest a line of resistance. Candles’ bodies play a significant role in determining the support/resistance line. Let us draw a line of resistance here.

Here it is. The combination of the last two candles and their bodies suggests that we may draw a line right above their bodies. In most cases, we are to do this. However, the last two spikes have something more to think about. If we closely look, we find that the last two spikes are lined up. They have had their rejection at the same level. This means that the line is significant, which must not be ignored. Thus, if we want to take entry here, we may count the line above as the level of resistance. Let us have a look at the chart below with more drawn lines.

Look at the Stop Loss level. To be safe, we may not ignore such levels, where the price gets rejected multiple times. The candles may end up having spikes, but these spikes shall be counted to determine our stop loss, take profit, and breakout level. Let us not proceed to find out how the entry goes.

The trade setup works well for the traders. The price heads towards the South with more bearish pressure. It gets 1R to the sellers in a hurry. Now many of us may say the price never goes back to the level. In 80% of cases, the price does not go back near to the resistance. In the rest of the 20% cases, it may go. That is when we are to take an unnecessary loss. As they say, it is better to be safe than sorry. Let us be safe with spikes like these.

Categories
Forex Daily Topic Forex Price-Action Strategies

Mind the Gap Price Action Traders

In the Forex market, most pairs start trading with a gap after weekends. Most of them are not visible on charts such as the H1, H4, or the daily. Some pairs begin with a big gap, which is visible even on the major charts. It gets difficult for price action traders to trade and make a profit when a pair starts with an evident gap. In today’s article, we are going to demonstrate an example of this.

The trend starts with a bearish engulfing candle, which is a strong indication that the trend may sustain for a long time. The sellers are to wait for the price to consolidate and strong bearish reversal candle to go short on this chart. However, do not miss that the chart has a gap followed by trend continuation. It finds its support since it produces a doji candle followed by a bullish engulfing one.

The price finds its resistance as well. Look at the last candle on the chart. It is a bearish engulfing candle closing well below the level of support. Usually, the sellers may trigger a short entry right after the last candle closes in such price action. It is not a usual chart since it has a gap. Let us assume we have triggered a short entry here.

The next candle comes out as an inside bar bullish candle. The last candle comes out as a doji candle closing right at the breakout level. The bear still has control.

The last candle on this chart breaches through the level of stop loss. The trade does not go according to the sellers’ plan. The trend initiating and the breakout candle gets a 10 on 10. However, it gets us a loss. Do not forget this could happen any time with any trade setup. With this chart, something works against price action traders in both buying and selling. Can you guess what that is? Yes, it is the ‘Gap.’ Let us proceed to the next chart. It may create more drama.

It produces a spinning top. The buyers may think that they have a chance to take control next if it produces the next candle as a bullish engulfing candle.

It does not. It continues heading towards the South again at a slower pace. A chart with a big gap may act weird like this. Thus, it is best to avoid taking entry on a chart with a big gap.

Categories
Forex Daily Topic Forex Price-Action Strategies

Trading on the Daily Chart More Rewarding Than It Looks

Trading on the daily chart is very rewarding as well as hassle-free comparing to intraday trading. Trade management is different since it allows enough time for the traders to make a decision about their positions. This often allows the traders to earn more pips. In today’s article, we are going to demonstrate an example of price action trading on the daily chart, which allows the traders to hunt some extra pips. We find out how traders do it.

This is a daily chart. It shows that after being bullish for seven trading days, it produces a bearish engulfing candle. The Bearish engulfing pattern is one of the strongest bearish reversal patterns. The sellers are to wait for the price to consolidate and give them a level of resistance where they set Stop Loss above to ensure better risk-reward.

This is what the sellers want to see. The chart produces a bullish inside bar, which states that the sellers may take over the control upon getting another bearish engulfing candle closing below the level of support.

Look at the last candle. It comes out as a bearish engulfing candle closing below the level of consolidation support. The sellers may trigger a short entry right after the candle closes by setting the stop loss above the highest high of the signal candle. To set take profit, some traders may close the trade manually upon getting a bullish reversal candle; some may set at 1:1 risk-reward; some may set at the last significant lowest low. It depends on traders’ psychology and with the strategy (in terms of taking profit) they feel comfortable with.

The price consolidates with one more candle after triggering the entry. However, the price hits the target, which is set at the level of the significant lowest low. As mentioned, some traders may keep holding the position since the price is still with the bear. Let us proceed to the next chart and find out what the price does in the next candle.

It makes a breakout as well. The sellers holding the position may dream big. It seems the price may keep heading towards the South further. This is the good thing about trading on the daily chart. Traders get enough time to decide about their positions. They get 1:1 risk-reward in almost every trade. If they understand daily price action well and get well acquainted with daily trading, it usually gets them very lucrative risk-reward. Imagine, if traders want to manage trade like this on the H4 or the H1 chart, how painful it could be. Moreover, the H4 or the H1 chart is not as consistent as the daily chart. In our fore coming articles, we will demonstrate more examples of how we can maximize our profit by trading on the daily chart. Stay tuned.

Categories
Forex Price-Action Strategies

The Right Strategy with the Wrong Chart Creates a Losing Trade

In today’s lesson, we are going to demonstrate an example of the daily-H4 chart combination trading, which has everything to offer a good entry. However, the outcome is not what we would love to get. Let us dig into it and find out what may go wrong with the setup sometimes and where we have to be careful.

This is a daily chart. Look at the last candle. This is an A+ bearish engulfing candle, which the price action traders crave for. The sellers are to flip over to the H4 chart for the price to consolidate and make a bearish breakout to offer them a short entry. Let us flip over to the H4 chart.

The price consolidates for six H4 candles (remember the number six). However, it has not made any breakout. Let us assume that we keep an eye on the pair. Let us proceed to the next chart.

The chart produces a breakout candle. If we are to give it a grade, it would get A+ as well. It means everything looks good. We may trigger a short entry right after the breakout candle closes.

The price does not head towards the South according to the sellers’ expectations. It goes another way and hits the stop loss. The daily reversal candle and the H4 breakout candle both have all the attributes to attract the sellers to go short on the pair. Is there anything wrong with the entry?

First, it may happen. It does not matter how good a trade setup looks. It may get us loss. It is a game of probability after all.

Now concentrate here. This entry looks good in naked eyes but it is not. Do you remember how many candles it consolidated with? It consolidated with six H4 candles and makes the breakout by the 7th candle. It means the H4 support becomes daily support. Thus, an H4 breakout is not enough to attract the sellers to go short on the pair. To have a clearer view, have a look at the daily chart again.

The last candle comes out as a bullish inside bar. It means the pair is still bearish biased but it is for the daily traders. If the daily chart produces a bearish engulfing candle closing below the level of support, the daily sellers may go short. Meanwhile, it produces a false signal on the H4 chart and makes some sellers lose money.

Trading at the right chart with the right strategy is an important aspect to be successful in trading. It does not matter how good an angler you are. If you do not choose the right place and the right hook, you are going to come back home empty-handed.

Categories
Forex Daily Topic Forex Price-Action Strategies

Taking Partial Profits: an Alternative if You are Too Defensive

In today’s article, we are going to demonstrate an example of the daily-H4 chart-combination price-action trading. The signal candle comes out as a strong bearish candle, which attributes have a lot to offer to the sellers. Let us find out how it ends.

This is a daily chart. The last candle comes out as a bearish engulfing candle. The daily-H4 combination traders are to flip over to the H4 chart for the price to consolidate and produce a bearish reversal candle to offer them a short entry below the consolidation level of support.

This is the H4 chart. The price consolidated earlier before producing that daily bearish reversal candle. Traders must wait for consolidation and a bearish candle from now. It produces two bearish candles consecutively. It may consolidate soon.

It produces one more bearish candle and starts having a correction instead of consolidation. It is less likely that the chart presents a bearish engulfing candle breaching the level of support. We shall never be certain, though, since it is the Forex market. Let us see what happens next.

Would you believe it? What a good-looking bearish engulfing candle that is! The sellers may trigger a short entry right after the candle closes by setting stop-loss above the level where it has a rejection. Such price action offers 1:1 risk-reward easily. Considering the signal candle, the price may go towards the South further and get more reward to the sellers.

The chart produces a bullish inside bar and heads towards the South again. The last candle comes out as a bearish Marubozu candle. The sellers must hold the trade to make a handful of pips.

The price heads towards the South for one more candle. However, it produces three consecutive bullish reversal candles. The last one comes out as a bullish pin bar. The price is still to cover a lot of space to get us 1:1 risk-reward. By looking at the price action for the last three candles, it seems that the price may have an upside correction before making the next bearish move. It may even change its trend as well. It is best to have a belief in our positions and hold it as long as we can. In other words, we shall remember the rule ‘set and forget.’ However, if the price produces too many reversal candles and strong reversal candle such as pinbar, truck rail, or engulfing candle, we may consider taking a partial profit.

In such cases, taking a partial profit comes handy. We may take out at least 50% profit and let the rest of it run. Even if the trend changes, we do not lose money. On the other hand, if it goes towards our desired direction, it gets us more profit.