In today’s lesson, we are going to demonstrate an example of the daily-H4 chart combination trading, which has everything to offer a good entry. However, the outcome is not what we would love to get. Let us dig into it and find out what may go wrong with the setup sometimes and where we have to be careful.
This is a daily chart. Look at the last candle. This is an A+ bearish engulfing candle, which the price action traders crave for. The sellers are to flip over to the H4 chart for the price to consolidate and make a bearish breakout to offer them a short entry. Let us flip over to the H4 chart.
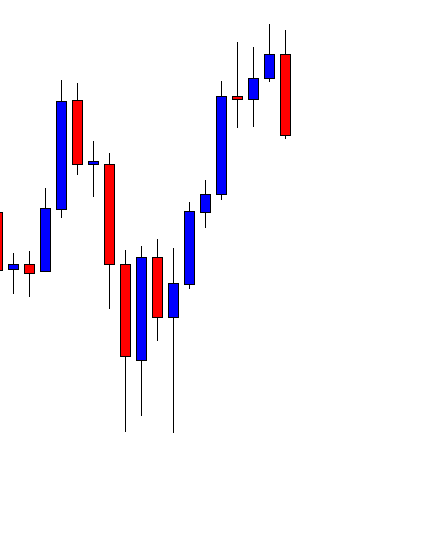
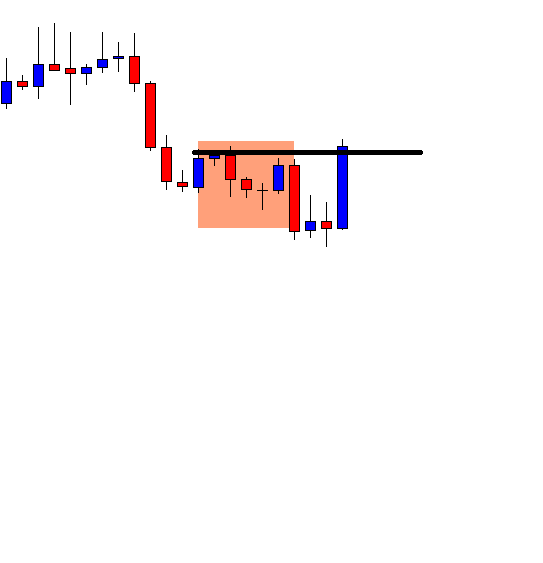
The price consolidates for six H4 candles (remember the number six). However, it has not made any breakout. Let us assume that we keep an eye on the pair. Let us proceed to the next chart.
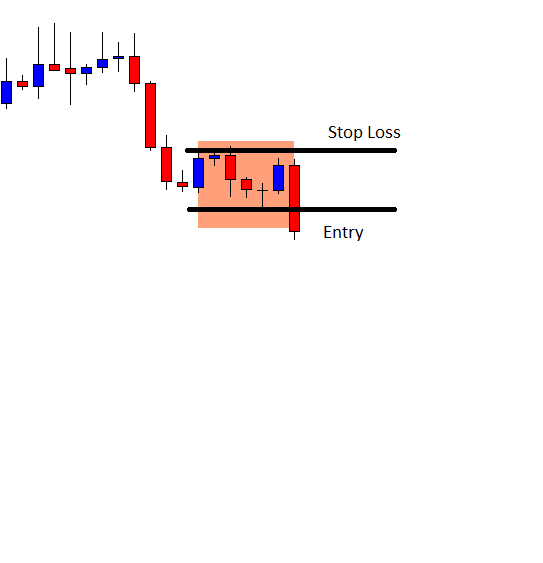
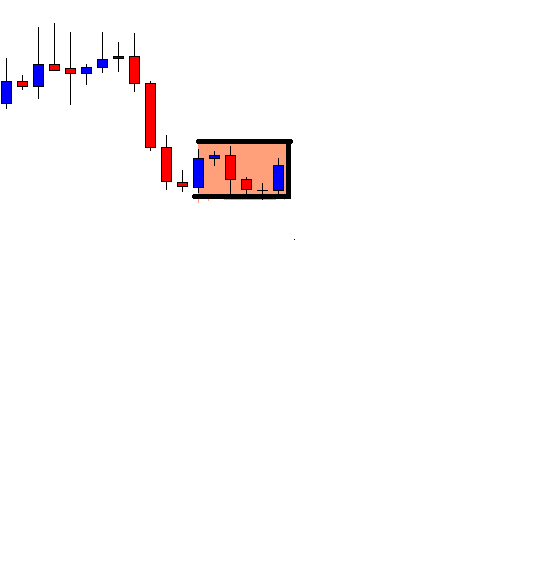
The chart produces a breakout candle. If we are to give it a grade, it would get A+ as well. It means everything looks good. We may trigger a short entry right after the breakout candle closes.
The price does not head towards the South according to the sellers’ expectations. It goes another way and hits the stop loss. The daily reversal candle and the H4 breakout candle both have all the attributes to attract the sellers to go short on the pair. Is there anything wrong with the entry?
First, it may happen. It does not matter how good a trade setup looks. It may get us loss. It is a game of probability after all.
Now concentrate here. This entry looks good in naked eyes but it is not. Do you remember how many candles it consolidated with? It consolidated with six H4 candles and makes the breakout by the 7th candle. It means the H4 support becomes daily support. Thus, an H4 breakout is not enough to attract the sellers to go short on the pair. To have a clearer view, have a look at the daily chart again.

The last candle comes out as a bullish inside bar. It means the pair is still bearish biased but it is for the daily traders. If the daily chart produces a bearish engulfing candle closing below the level of support, the daily sellers may go short. Meanwhile, it produces a false signal on the H4 chart and makes some sellers lose money.
Trading at the right chart with the right strategy is an important aspect to be successful in trading. It does not matter how good an angler you are. If you do not choose the right place and the right hook, you are going to come back home empty-handed.