Categories
Forex Daily Topic Forex Price Action

Breakout at Weekly High/Low, Wait for Consolidation

In today’s lesson, we are going to demonstrate an example of an H4 breakout at the weekly low. The chart produces a strong bearish candle to make the breakout. The Bear looks good to make a strong move towards the South. However, the price does not head towards the downside. It rather gets choppy. Let us find out the reason behind it.

It is an H4 chart. The chart shows that the price makes a strong bearish move. It has a bounce at a level of support twice. If the price makes a breakout at the neckline, the buyers may look to go long in the pair upon bearish correction. On the other hand, the sellers may wait for the price to make a breakout at the week’s low to go short upon consolidation and getting a bearish reversal candle.

The chart produces a strong bearish candle breaching through the last week’s low. The breakout length is good as well. It means that the sellers may wait for the price to consolidate and to get a bearish reversal candle to go short in the pair. It seems that the sellers may dominate in the pair in this week as well.

The chart produces another bearish candle followed by a bullish engulfing candle. Producing a bullish engulfing candle to consolidate is not a good sign for the sellers. However, if the next candle comes out as a bearish engulfing candle closing below consolidation support, the sellers will be right on the track.

The chart does not produce a bearish engulfing candle. It rather produces another bullish candle. It seems that the price is having a bullish correction. When the H4 chart makes a breakout at the weekly low/high, the price is supposed to consolidate and produce a reversal candle to offer entry. If it makes a long bullish/bearish correction, it is assumed that the traders are not confident to take the price towards the trend. The chart shows that the price is obeying the level of support, where it has its first bounce.

The choppy price action continues. The H4 traders may wait for the price to make a breakout in the next week. The level of support becomes daily support now. Thus, weekly-H4 traders must wait to find the next direction.

We must remember when a pair trades within last week’s high and low, the price usually makes a correction. When it makes a breakout, it consolidates. If it takes too long or too many candles to make a breakout, traders may skip taking entry on that chart.

Categories
Forex Price Action

Some to Take and Some to Skip

In today’s lesson, we are going to demonstrate an example of an H4 chart, which seems to be offering several entries. However, a trader has to be very calculative before taking an entry. Some entries are there to be taken, and some are there not to be taken. We would try to find out why we shall skip taking some entries. Let us get started.

This is an H4 chart. The chart shows that the price makes a strong bullish move and consolidates for a long time. The last candle comes out as a bullish candle breaching consolidation resistance. It usually a scenario of taking a long entry. Before taking an entry, we must calculate whether the price consolidates for more than a day or not. Over here, the price consolidates more than a day. It means the level of resistance becomes daily resistance. The breakout is not for the H4-daily combination traders to trigger a long entry.

The chart shows that the price heads towards the North. The buyers may wait for the price to consolidate and get a bullish reversal candle to go long in the pair. They must keep their eyes on the pair.

The chart produces a bearish inside bar. It may consolidate more and make a deeper consolidation. This is what the buyers are to hope for. Let us find out what the price does here.

The chart shows that the price consolidates for five candles altogether. The last bullish candle is the last H4 candle of that day. It means if the chart produces the next candle as a bullish engulfing candle, the buyers will have an opportunity to go long in the pair. Otherwise, they are to wait longer.

The last candle comes out as a bullish engulfing candle breaching consolidation resistance. The buyers may trigger a long entry right after the last candle closes by setting stop loss below consolidation support and by setting take profit with 1R.

The price consolidates again and produces a bullish engulfing candle. It seems the bull is going to dominate in the pair for a long time since it finds another level of support. When price trends like that, traders add more positions, and the price keeps trending relatively for a longer time.

Here it is. The price hits the target of 1R. They buyers grab some green pips. Yes, they wait for the price to hit the target. Some traders may take a partial profit out of it and let the rest of the trade run to grab more pips.

In this lesson, we have demonstrated that traders may take the second entry and skip the first one because of the daily resistance factor. Traders must calculate these things before taking entry.

Categories
Forex Price Action

The H4-Daily Combination Strategy: Do not Get Carried Away

In today’s lesson, we are going to demonstrate an example of an H4-daily chart combination trading. The lesson has an important message to remember for the H4-Daily combination traders. Let us get started.

The chart shows that the price produces a double top and heads towards the South with good bearish momentum. The daily candle closes as a bearish Marubozu candle having no lower shadow at all. The next trading day starts with a Spinning Top. It seems that the H4 chart starts having consolidation. The last H4 candle comes out as a bullish engulfing candle. This looks good for the sellers that the price is having consolidation after making a good bearish move. However, the H4-Daily combination traders must not forget one thing that the signal is to be produced within the next two candles. Otherwise, it becomes daily support.

The fifth H4 candle of the day comes out as a bearish engulfing candle. The candle closes well below consolidation support. The sellers may trigger a short entry right after the last candle closes by setting stop-loss above consolidation resistance and by setting take profit with 1R.

The next candle comes out as a bullish inside bar after triggering the entry. The sellers would love to get a long bearish candle here. However, a bullish inside bar suggests that the bear still holds the key. Let us proceed to the next chart.

The next candle comes out as a bearish engulfing candle. This looks extremely good for the sellers now. The price finds another resistance. This attracts sellers to add more short positions. Anyway, the H4-Daily combination traders are to wait for the price to hit their 1R take profit.

The price takes two more candles to hit the target. I would say that the price hits the target at a moderate pace here. Anyway, the H4-Daily combination strategy offers entry, and the trade setup works well for the sellers.

The message this lesson has is that we must not get carried away with bullish or bearish move followed by consolidation. The H4 chart is to produce a trade signal within the next day. If it does not, that chart does not belong to the H4-Daily combination trading strategy.  If it does, then the H4-Daily combination traders may trigger an entry.

Categories
Forex Fibonacci

Fibonacci Trading: Be sure whether the Level is Held or Breached

Breakout plays a very vital role in the Forex market. Traders use breakout, breakout levels to make a trading decision. Fibonacci traders are to make sure whether a particular level is breached or it holds the price to make a better trading decision. In today’s lesson, we are going to demonstrate an example where Fibonacci traders may need to concentrate more to be sure about the Fibonacci level from where the price trends. Let us get started.

This is an H1 chart. The chart shows that the price makes a strong bearish move. It makes an upside correction followed by a strong bearish move again. The price has been having an upside correction again. Fibonacci traders are to draw the Fibonacci levels in the chart to find out where the price makes a bearish reversal and how far it may go up to.

Here are the levels. The chart shows that the price produces a bearish engulfing candle and heads towards the South with good bearish momentum. The question is whether the price trends from 78.6% or 61.8%. It is a vital issue since the price heads towards either 138.2% or 161.8% based on these two levels. If we concentrate on the chart, we see one of the bullish candles closes above the 78.6% level. However, the price comes back within the 78.6% level with the next candle. This means the H1 chart does not make a bullish breakout at 78.6%. The sellers may plan their entries to go short up to 138.2% in this chart. Let us proceed to the next chart to find out what price does.

The price breaches the 100.0 level and trades below for several candles. The sellers may wait for a bearish reversal candle and go short in the pair as long as they are satisfied with the risk-reward factor. Usually, it is best if the price goes back to the 100.0 level and produces a bearish reversal candle around the level as far as the risk-reward ratio is concerned. However, it may be produced anywhere between 100.0% to 123.6%. The sellers with different strategies may set their stop loss at different levels, but their last take profit level is to be set at 138.2 %. Let us proceed to the next chart to find out what the price does next.

The chart shows that the price hits 138.2%. As expected, it has been roaming around the level. It seems that the price may have found its support around 138.2% level, and it may make a bullish reversal. The sellers with Fibonacci levels have completed their mission with perfection.

Categories
Forex Daily Topic Forex Price Action

Spot the Chart Accordingly before Triggering for an Entry

In today’s lesson, we are going to demonstrate an example of a chart, which may entice traders to take entry more than once. Some traders may get themselves engaged in taking entry. We find out why we price action traders skip taking those entries. Let us get started.

This is an H4 chart. The price makes a strong bearish move by producing three consecutive Marubozu bearish candles. The last candle comes out as a doji candle. The price may consolidate now. The sellers are to wait for a strong bearish reversal candle upon consolidation to go short in the pair. Let us proceed to the next chart.

The chart produces a bearish Marubozu candle again. As a reversal candle, it is a strong one. However, the price has not consolidated well. It has produced the bearish reversal candle upon having a shallow consolidation. Moreover, the last candle does not close below the level of support. Thus, the sellers may skip taking the entry but wait for the right time to come. The chart still looks good for the sellers.

The chart produces a bullish engulfing candle. The price may make a deeper consolidation this time. The sellers may keep their eyes on the chart again to go short in the pair. Let us proceed to the next chart to find out what happens next.

The price makes a deeper consolidation. Upon finding its resistance, it makes a bearish move. It seems that the price may make a breakout here. A question may be raised here whether the sellers on the H4 chart shall take the entry or not? We find out the answer in a minute. Meanwhile, let us proceed to the next chart.

The next H4 candle closes well below the level of support. The pair trades below the breakout level for one more candle as well. However, the sellers on the H4 chart may skip taking the entry. The reason behind that is the chart takes more than six candles (a day) to make the breakout. This level of support is a daily level of support now. Thus, the sellers may take the trading decision as far as the daily chart is concerned. If they take their trading decision by observing the H4 chart, it may not be that fruitful. The risk-reward may not be a good one. It may not end up being a daily breakout, but the price may come back in. Or, the daily chart may produce a bullish corrective candle next day, which makes the price hit the H4 sellers stop loss. Thus, in such cases, they might have to take losses only because the pair belongs to the daily chart. Thus, for better trading, traders shall take a closer look before taking entry on a chart to determine whether it favors their trading chart.

Categories
Forex Price-Action Strategies

Forex Price Action: Do Not Be Over Confident

Engulfing candle is the strongest reversal candle. In a bearish market, the buyers wait for a bullish engulfing candle and flip over to the minor chart to take entry. It does not usually go wrong. However, from time to time, things may not go according to traders’ expectations, even with engulfing candle. In today’s lesson, we are going to demonstrate an example of that. Let us proceed.

This is a daily chart. The chart shows that the price makes a bearish move and finds its support. It produces a bullish engulfing candle. Thus, the H4 breakout traders may flip over to the H4 chart and wait for the price to consolidate and to create a bullish engulfing candle to go long in the pair. Let us flip over to the H4 chart.

The H4 chart also looks very bullish. The price starts having consolidation. Then, it produces a hammer. It seems the chart may not take too long to produce a bullish engulfing candle breaching consolidation resistance.

The chart produces another bullish candle closing within consolidation resistance. The price heads towards the South to search for its support. It has been taking longer than the buyers’ expectations. They must not be impatient but keep their eyes on the chart.

The price finds its support and produces a bullish engulfing candle. The candle closes well above consolidation resistance. The buyers may trigger a long entry right after the last candle closes by setting stop loss below the level of support and by setting take profit with 1R. The signal candle suggests that the buyers find a good deal here. Let us proceed to the next chart to find out what the price does.

I do not think that the buyers are ready for this. The last candle comes out as a bearish inside bar, but it closes within consolidation resistance and support. It does not hit stop loss yet. The buyers still have a chance to win this. This looks ominous for them, though.

The price hits stop loss now. The last candle comes out as a bearish candle closing below consolidation support this time. All of a sudden, it becomes the sellers’ territory. The H4 buyers must avoid this chart for a while.

The lesson we get from today’s example is a chart, which looks only for the buyers’ turns into opposite within two candles. Things get changed anytime in the Forex market. Thus, traders should not be overconfident with their analysis, strategy at any point in their trading life.

Categories
Forex Daily Topic Forex Price-Action Strategies

Forex Price Action: A Losing Trade

Forex trading is considered one of the riskiest businesses. The market is volatile and it gets unpredictable from time to time. There is no trading strategy, which can guarantee one hundred per cent success. Thus, Forex traders must be mentally prepared to take losses. In today’s lesson, we are going to demonstrate an example of a losing trade.

The chart shows that the price upon finding its resistance heads towards the South with good bearish momentum. The first candle comes out as a bearish engulfing candle followed by two bearish candles. These suggest that the bear takes control. The sellers are to wait for the price to consolidate and a bearish engulfing candle to go short in the pair. Let us proceed to the next chart to find out what the price does.

The price finds its support. It produces a bullish inside bar followed by two doji candles. It seems that the price has been searching for its resistance. The sellers are to keep their eyes on this chart.

The price finds its resistance. It produces a bearish engulfing candle closing below consolidation resistance. Without any doubt, this is an A+ breakout candle. The sellers may trigger a short entry right after the candle closes by setting stop loss above consolidation resistance and by setting take profit with 1R. Let us find out how the trade goes.

It looks fantastic for the sellers. The next candle comes out as a bearish candle as well. Consecutive two bearish candles suggest that the bear is in a hurry to hit the take profit. The sellers may not have to wait too long to achieve their target as far as the price action in this chart is concerned.

Would you believe it? The next candle comes out as an inverted hammer. The upper shadow hits the stop loss. The sellers are out with their entry with a loss. That was beyond their imagination some might say. However, it happens a lot in the Forex market. Thus, traders must not be overconfident with any entry. Discipline and money management are to be maintained with every single trade.

Some traders, especially at the beginning can’t take losses easily. It bugs them up. Losing money may make them think something is wrong with their strategy. There is nothing wrong if traders want to try to develop new strategies. However, they should not just lose the belief and abandon a long proven strategy all of a sudden.

Categories
Forex Basic Strategies Forex Daily Topic

Significance of Breakout Confirmation or Reversal at Pullback

Breakout trading is one of the most widely used trading strategies in the Forex market. Breakout confirmation is equally important. Without breakout confirmation, a breakout may not work in favor of the traders in many cases. Thus, if we want to have a tremendous rate of winning, we may wait for breakout confirmation or reversal at pullback before taking entry. In today’s lesson, we are going to demonstrate an example of this.

The price after being rejected at a resistance level heads towards the South. It produces a bullish inside bar and heads towards the North again. The momentum suggests that the price may make a breakout at the level of resistance. Breakout traders are to keep an eye on the pair to get a breakout followed by breakout confirmation or reversal candle at the pullback to go long on the pair.

The last candle breaches through the level of resistance. Candle’s attributes suggest that this is an ideal breakout candle. The candle barley has the upper shadow. The breakout traders are to wait for either for the next candle to close above the breakout candle or the price to come back at the breakout level to consolidate and produce a bullish reversal candle to offer them a long entry.

The price does not head towards the North. It comes back at the breakout level closing within the breakout level. The breakout is still valid. However, the buyers must wait to get a bullish engulfing candle to close above consolidation resistance to trigger a long entry by setting stop loss below the breakout level. Let us proceed to the next chart to find out what happens next.

The price breaches the level of support and closes well below the breakout level. The sellers may take control soon in the pair. Traders taking a long entry right after the breakout candle closing are to have a loss here. If they set stop loss below the lowest low, the risk-reward would not be lucrative. When the price breaches a breakout level, it usually generates more momentum and changes its trend. Let us see what happens here.

The price goes back to the breakout level. This time it makes a bullish correction. The equation changes completely another way round. If the chart produces a bearish engulfing candle closing below consolidation support, the sellers may go short and drive the price towards the lowest low.

The chart produces a bearish engulfing candle followed by another strong bearish candle. It looks like a different ball game completely now. It is now the sellers’ territory.

In the bullish market, the chart does not produce a bullish reversal candle; thus, the price gets bearish. In the bearish market, it produces a bearish reversal candle (engulfing) and offers entry to the sellers. By taking entry upon breakout confirmation, we may not find as many entries as we would like, but it gets us more consistency in winning trades.

Categories
Forex Daily Topic Forex Price-Action Strategies

Price Action Trading: Entries to Take and Entries to Skip

In today’s price action trading lesson, we are going to demonstrate an example of a chart that offers multiple entries. We try to spot out entry/entries that we may skip and the entry/entries we may take. We try to find out the reasons behind that as well. Let us get started.

The price after being bullish for a long time produces a bearish reversal candle and heads towards the South. Look at the last candle. It comes out as a bullish inside bar. Price action traders start eyeing on such a chart to go short. However, the sellers would love to see the price have deeper consolidation.

The chart does not make a deep consolidation. It produces a bearish engulfing candle closing well below consolidation support. The trend and the reversal candle get 10 on 10, but the consolidation is not deep enough. It is not an A+ entry. It is best if we restrain ourselves from taking such entry. Let us proceed to the next chart.

Many of us may think an opportunity missed. Here is one added lesson on ‘ do not cry over spilled milk.’ Forex traders must obey this. Let us concentrate on the chart again. The last candle comes out as a very strong bearish candle. The pair may offer more short entries.

The chart produces a bullish inside bar again. The equation is simple for the sellers based on price action. The chart is to produce a bearish engulfing candle closing well below consolidation support. Let us proceed to the next chart.

Here it comes. This is one good-looking bearish engulfing candle closing well below consolidation support. The trend, consolidation length, and the bearish reversal candle all get 10 on 10. As far as price action breakout trading strategy is concerned, this is an A+ entry. Let us now find out how the entry goes.

It does not go according to our expectations. It rather produces a bullish inside bar again. It is an inside bar. Thus the sellers still hold the key here. The fact remains at the first consolidation, despite having shallow consolidation, the price heads towards the South with extreme bearish momentum. On the contrary, despite being an A+ entry, the price does not move according to the sellers’ expectations. It may even go towards the North and hits the stop loss. Then again, we must stick with our trading rules and be extremely disciplined. Let us proceed to the next chart to find out what happens next.

Ah! What a move this is! The sellers make some green pips here. The chart makes them wait, but it pays them back. As mentioned, it could go another way. That does not mean we start thinking to change our strategies or start taking random entries. We must make sure we only take entries that get A+ after considering all the segments.

Categories
Forex Daily Topic Forex Price-Action Strategies

Price Action Trading: Let it go

The Engulfing Candle is considered one of the most influential candles to indicate a trend reversal. Price action trading is closely related to identifying trend reversal for which price action traders give value to engulfing candles a lot. In today’s lesson, we are going to demonstrate an example of an engulfing candle, which does not work in favor of the traders. We try to find out the reason behind that.

The chart shows that the price heads towards the South with good bearish momentum. On its way, it makes a breakout and trades below the level for one more candle. The sellers are to keep an eye on this pair for the price to consolidate and produce a bearish engulfing candle closing below consolidation support. Do not miss the point ‘closing below consolidation support’.

The price does not consolidate. It instead produces another bearish candle. It may consolidate now. A candle like this attracts more sellers to go short on the pair. Let us proceed to the next chart.

The chart produces a bullish inside bar. This means the chart is still bearish biased. The signal candle may come out at any time. The waiting game gets intense. The sellers are to keep checking the chart since the next candle may be the signal candle.

The chart makes them wait further. It produces a bearish inside bar followed by a bullish engulfing candle. The chart is still bearish biased, but the chart may get choppy as well if the next candle comes out as a bullish candle. Let us wait and find out how the next candle comes out.

The next candle comes out as a bearish engulfing candle. Is this what the sellers want? Here is a question for you. Would you trigger a short entry?

If the answer is no, you are right. The reason behind that is this is an engulfing candle, but it does not close below consolidation support. Look at the line below. This is where both candles get rejection. Thus, we may consider this one as consolidation support. Even if we consider only their bodies (not the best way), the candle closes within that level as well. The equation is an engulfing candle does not make a breakout. Thus, traders may skip taking this entry. We need to make sure these four things are there before taking entry based on this setup.

  1. Clear trend
  2. Consolidation
  3. Engulfing candle
  4. Breakout

If a trade setup misses any one of these, be patient. Let it go.


Categories
Forex Basic Strategies Forex Daily Topic Forex Price Action

Support, Resistance and Trade Management

-Support and Resistance are the two most important concepts in the financial market. Forex traders strongly rely on support and resistance, as well. Price action traders’ main weapon is support and resistance. In today’s article, we are going to demonstrate an example of how the price reacts to a major level of support and resistance. Let us get started.

Look at the chart. The price consolidates around the red-marked level, it finds its resistance there and makes a bearish move. After having a correction, it makes the new lowest low. This is now the sellers’ territory. Let us assume that there is no significant level, which may hold the price as support. Thus, we are not able to mark any level as support. The sellers are to wait for the price to consolidate and produce a bearish reversal candle to offer them short entry in this chart.

The price makes new lowest lows and heads towards the South with good bearish momentum. However, it seems that it may have found its support. It consolidates for a while around the red-marked level and produces a bullish engulfing candle. The buyers on the minor chart may get them engaged to keep an eye on the chart to go long above the highest high of the last candle. Let us find out what happens next.

The price heads towards the North. It consolidates and produces another bullish engulfing candle. It means the chart is now the buyers’ territory. This is where the game of support and resistance begins. You may have noticed that we have red-marked the level. This is the most significant level in this chart for the buyers. The price may consolidate and find its resistance in this chart before it reaches the red-marked level. However, this is where traders may make a decision concerning their long position. They may either close their whole trade or take partial profit.

The price keeps heading towards the North. It buyers are having a party here. They must not forget the red-marked level, though. Let us proceed to the next chart.

Look at the chart carefully. Do you notice that the price consolidates around the red-marked level, which is the swing high in this chart? It produces a bearish engulfing candle followed by another bearish one. The last candle on this chart comes out as a bullish inside bar. If the next candle comes out as a bearish engulfing candle, the sellers may drive the price towards the South. I am sure now you know where the sellers are to be careful with their trade management. Yes, they must take the red-marked support (swing low in this chart) into account to manage their short entries.

Categories
Forex Daily Topic Forex Price Action

A Business of Glorious Uncertainty

Trading on the daily-H4 chart combination often brings more reward than our initial expectation. Typically, traders aim to earn 1R. However, it may even bring up to 5R. In today’s lesson, we are going to show an example of this.

This is a daily chart. The price heads down with good bearish momentum. The last candle is a spinning top. In a strong bearish daily trend, a spinning top does not suggest that the trend may change. However, the H4-daily traders’ strategy is different. They are to flip over to the H4 chart and wait for consolidation followed by a bullish breakout, to go long on the pair. Let us flip over to the H4 chart.

The H4 chart looks good. The chart produces two bearish candles consecutively. The buyers are to wait for a bullish engulfing candle closing above consolidation resistance to go long. The chart suggests that the buyers shall stick with the chart.

It consolidates more and produces a bullish engulfing candle. However, the candle closes within consolidation resistance. They are to wait for more. Look at the last candle. It seems like it is going to have a deep consolidation again.

This time the chart produces a bullish engulfing candle closing well above consolidation resistance. The buyers could trigger a long entry right after the candle closes and set the stop loss below the signal candle’s lowest low.

The trade does not go as per buyers’ expectations. It takes time to hit the target. However, the candle breaches through the take-profit level, closing as a strong bullish candle. The buyers may consider taking a partial profit and let the rest of the trade run. Let us find out what happens next.

This time the price heads towards the North with extreme bullish pressure. It travels about five times the distance of the buyers’ initial target. Assume, by taking partial profit, how much more a trader can earn. This is the beauty of trading on the daily-H4 combination. Since the daily chart is involved here, the price often heads towards daily support/resistance. This brings traders more profit if they deal with their trade accordingly. Another interesting point here to be noticed, despite producing an excellent bullish engulfing candle, the price does not head towards the North with good bullish momentum. On the other hand, once it hits the target level by producing another bullish Marubozu candle, it keeps going towards the North with extreme bullish momentum. This is why trading may be called a business of glorious uncertainty.


Categories
Forex Price-Action Strategies

Patience Required Even with H1 Breakout Trade Setup

In today’s lesson, we are going to demonstrate an example of an H1 breakout strategy. Usually, the price heads towards the trend’s direction with good momentum on the H1 breakout trade setup. In today’s example, the price does not behave as it usually does. Let us get started.

The price after being bullish, it has been on consolidation. Look at the last two candles. The price heads towards the consolidation resistance. The buyers eagerly wait for a bullish breakout at the level of resistance on such price action. Let us proceed to the next chart.

Here comes the breakout candle. The buyers love to get a breakout with such a candle. Now, they must wait for the next candle to close above the breakout candle. If that happens, traders may trigger a long entry.

The next candle comes out as a bullish candle closing well above the breakout candle. The buyers may trigger a long entry right after the last candle closes. The stop loss is to be set below the trend-initiating candle, and the take profit is to be placed with 1:1 risk-reward. Six out of ten times, the price goes towards the take-profit level with ease in a hurry. Let us proceed to the next chart and see how this one goes.

The price does not head towards the North with good bullish momentum. The way it has been going for the last five candles, it looks ominous. A question may be raised here, “shall we close the entry?” The price still has a lot of space to hit take profit level. The market is not about to close down for the weekend or holiday. Thus, we must be patient and hold the entry. In other words, we shall apply the rule “set and forget.” The set and forget rule is tailor-made for intraday trading, such as the H1 chart to the 5M chart. Let us wait and find out what happens.

After a long while, the price makes a move towards the North again. It seems the trade is going to get the buyers some green pips. They must wait and let the price to hit the target.

It loses its momentum again a bit, but it hits the target. We often head that patience is required more when traders trade on major charts such as the H4, the daily or the weekly. The reality is patience is required for traders of all kinds. Today’s example has proved this again.

Categories
Forex Daily Topic Forex Price-Action Strategies

Look for Such Price Action to Trade on the ABC Pattern

In today’s lesson, we are going to demonstrate an example of the ABC pattern trading. The trend-initiating candle comes out as a bullish engulfing candle followed by a bullish breakout. The price then makes a bearish correction and makes a bullish move upon producing a bullish reversal candle at a flipped support. Let us demonstrate with the charts how it happens.

The price has been bearish, but it has produced a bullish engulfing candle at the support zone. The buyers are to wait for the price to head towards the North and make a bullish breakout at the last swing high. Let us proceed to the next chart.

The price makes a breakout at the nearest swing high. The buyers are to wait for consolidation or correction and a bullish breakout. The last candle comes out as a strong bullish candle as well. It may keep going towards the North. Let us wait and find out what it does next.

It starts having a correction. Then, it produces a bearish inside bar followed by two more bearish candles. The price is at the flipped support. The buyers are to keep their eyes on this chart very closely.

Here it comes. The chart produces a bullish reversal candle. Do not miss the point that the level is the breakout level when the price heads towards the North. Such level is very significant as far as the ABC pattern trading is concerned.

The price makes a bullish breakout again and produces a new higher high. Traders may trigger a long entry right after the last candle closes by setting stop loss below the level of flipped support. It usually provides at least 1:1 risk-reward, which is the safest option. Let us proceed to the next chart to find out how it goes.

The price heads towards the North as expected. It hits the target (1R) with ease. The chart suggests that it may go towards the North further. Anyway, the ABC pattern traders shall enjoy their profit and hunt for the next one somewhere else.

In this example, we have seen that four aspects of the ABC pattern trading such trend initiating candle, breakout, reversal candle at the breakout level, and the signal candle get 10 on 10. Consequently, the price heads towards the desired direction with good momentum. If any of them fails to get 10 on 10, the trade may not go, exactly we would love to see it go. To keep excellent trading consistency, try your best to trade the ABC pattern on such price action that we have demonstrated today.

Categories
Forex Price-Action Strategies

The Right Strategy with the Wrong Chart Creates a Losing Trade

In today’s lesson, we are going to demonstrate an example of the daily-H4 chart combination trading, which has everything to offer a good entry. However, the outcome is not what we would love to get. Let us dig into it and find out what may go wrong with the setup sometimes and where we have to be careful.

This is a daily chart. Look at the last candle. This is an A+ bearish engulfing candle, which the price action traders crave for. The sellers are to flip over to the H4 chart for the price to consolidate and make a bearish breakout to offer them a short entry. Let us flip over to the H4 chart.

The price consolidates for six H4 candles (remember the number six). However, it has not made any breakout. Let us assume that we keep an eye on the pair. Let us proceed to the next chart.

The chart produces a breakout candle. If we are to give it a grade, it would get A+ as well. It means everything looks good. We may trigger a short entry right after the breakout candle closes.

The price does not head towards the South according to the sellers’ expectations. It goes another way and hits the stop loss. The daily reversal candle and the H4 breakout candle both have all the attributes to attract the sellers to go short on the pair. Is there anything wrong with the entry?

First, it may happen. It does not matter how good a trade setup looks. It may get us loss. It is a game of probability after all.

Now concentrate here. This entry looks good in naked eyes but it is not. Do you remember how many candles it consolidated with? It consolidated with six H4 candles and makes the breakout by the 7th candle. It means the H4 support becomes daily support. Thus, an H4 breakout is not enough to attract the sellers to go short on the pair. To have a clearer view, have a look at the daily chart again.

The last candle comes out as a bullish inside bar. It means the pair is still bearish biased but it is for the daily traders. If the daily chart produces a bearish engulfing candle closing below the level of support, the daily sellers may go short. Meanwhile, it produces a false signal on the H4 chart and makes some sellers lose money.

Trading at the right chart with the right strategy is an important aspect to be successful in trading. It does not matter how good an angler you are. If you do not choose the right place and the right hook, you are going to come back home empty-handed.

Categories
Forex Daily Topic Forex Price-Action Strategies

Taking Partial Profits: an Alternative if You are Too Defensive

In today’s article, we are going to demonstrate an example of the daily-H4 chart-combination price-action trading. The signal candle comes out as a strong bearish candle, which attributes have a lot to offer to the sellers. Let us find out how it ends.

This is a daily chart. The last candle comes out as a bearish engulfing candle. The daily-H4 combination traders are to flip over to the H4 chart for the price to consolidate and produce a bearish reversal candle to offer them a short entry below the consolidation level of support.

This is the H4 chart. The price consolidated earlier before producing that daily bearish reversal candle. Traders must wait for consolidation and a bearish candle from now. It produces two bearish candles consecutively. It may consolidate soon.

It produces one more bearish candle and starts having a correction instead of consolidation. It is less likely that the chart presents a bearish engulfing candle breaching the level of support. We shall never be certain, though, since it is the Forex market. Let us see what happens next.

Would you believe it? What a good-looking bearish engulfing candle that is! The sellers may trigger a short entry right after the candle closes by setting stop-loss above the level where it has a rejection. Such price action offers 1:1 risk-reward easily. Considering the signal candle, the price may go towards the South further and get more reward to the sellers.

The chart produces a bullish inside bar and heads towards the South again. The last candle comes out as a bearish Marubozu candle. The sellers must hold the trade to make a handful of pips.

The price heads towards the South for one more candle. However, it produces three consecutive bullish reversal candles. The last one comes out as a bullish pin bar. The price is still to cover a lot of space to get us 1:1 risk-reward. By looking at the price action for the last three candles, it seems that the price may have an upside correction before making the next bearish move. It may even change its trend as well. It is best to have a belief in our positions and hold it as long as we can. In other words, we shall remember the rule ‘set and forget.’ However, if the price produces too many reversal candles and strong reversal candle such as pinbar, truck rail, or engulfing candle, we may consider taking a partial profit.

In such cases, taking a partial profit comes handy. We may take out at least 50% profit and let the rest of it run. Even if the trend changes, we do not lose money. On the other hand, if it goes towards our desired direction, it gets us more profit.

Categories
Forex Daily Topic Forex Price-Action Strategies

High Impact News Events and Risk Management

In today’s lesson, we are going to demonstrate an example of price action trading on the daily chart. The lesson has a message if a high impact news event comes in between, what daily traders should do?. Let us get started.

This is EURJPY daily chart. The chart produces a bullish engulfing candle, which suggests that the buyers may dominate in the pair. Traders on different time frames may get themselves ready to go long on the pair. Traders who trade on the daily chart, they are to wait for the price to consolidate and produce a bullish reversal candle to go long on the pair. Let us proceed to the next chart.

The pair produces another bullish candle before creating the corrective candle. It means the buyers on the H4, H1, or 15M may have found some entries and drove the price towards the North last day. Anyway, the daily traders may keep an eye on the pair to go long upon a bullish engulfing candle closing above the last candle’s highest high.

Here it comes. A bullish engulfing candle closes above the daily resistance. The buyers may trigger a long entry right after the candle closes by setting stop loss below the candle’s lowest low. The nearest significant swing high is quite far away. It offers a tremendous reward considering the risk.

The price heads towards the North for one more candle. However, it does not get as bullish as expected. The good thing is it is a bullish candle. The buyers must hold the trade at least up to the level, which offers 1:1 risk-reward.

The pair produces a doji candle. The price hits the level, which offers 1:1 risk-reward. Then, it ends up producing a candle, which neither a bullish nor a bearish candle. Technically, the buyers shall take out at least 50% profit and let the rest of it run. As far as the price action is concerned, the price still may go towards the North further. I may give you information that this is the Wednesday market dated 11/09/2019. Here I have something interesting to show you before we start Thursday trading.

Source: Forex Factory

The pair we are dealing with here is EURJPY. Look at those news events with the EURO. The EURO pairs are to ride on a roller coaster on such news days. Let us not guess, but have a look at the daily chart to find out how it looks.

The price goes towards the trend’s direction. Do not miss the lower spike. You can see that it hits the stop loss. It is painful, but this is how the Forex market is. Thus, traders must take extra care of their positions before such high-impact news event. Otherwise, they may lose their hard-earned profit by getting hit such high impact news events.


Categories
Forex Daily Topic Forex Price-Action Strategies

Remember the Rule ‘Set and Forget’

In today’s lesson, we are going to demonstrate an example of H1 breakout trading. Usually, in this strategy, the price goes towards the direction with good momentum if things go accordingly. In this example, the breakout candle, breakout confirmation candle are immaculate, but it takes a long pause before it hits the target. It has a lesson to give us. Let us dig into this.

The price after being bearish finds its support. It consolidates for a while and produces a bearish pin bar followed by a bearish engulfing candle. Traders are to wait for a breakout at the level of support to get them prepared to go short on the pair.

The last candle breaches the level of support and closes well below the level. The candle is having a tiny lower spike. Ideally, H1 breakout strategy traders wait for such a breakout candle.  They are to wait for the next H1 candle to close below the breakout candle. If that happens, the game is on. Let us proceed to the following chart.

As expected, the next candle closes below the breakout candle. The candle looks very bearish, being an ideal candle to confirm the breakout. The sellers may trigger a short entry right after the last candle closes. Let us have a look at the same chart with some calculations in it.

The sellers may set the level of stop-loss above the level where the trend is initiated. They may set the take-profit level with 1:1 risk-reward. It means

Entry- Stop Loss= Take Profit-Entry.

The price consolidates after the signal candle. It bounces at the level, where it bounced some hours earlier. This is the first sign of a double bottom. It looks the buyers may take over the control, which may make the price hit the stop loss. You may remember, in one of our lessons, it has been recommended that a trader may have to close his entry manually. It was an example of the Friday market. Today’s market is not the Friday market. Thus, we must not close it manually, as it may get us a loss, but we must let it run. Let us wait and see how it ends.

It looks much better now. The price heads towards the South with good bearish momentum. It may not take much time to hit the target.

It does not go according to your calculation. It takes much longer than our expectations. However, it hits the target at last. The lesson that we have learned here is we must let a trade run to do its bit. Once we take entry after measuring the risk-reward, we must be patient. In a word, we must remember the rule ‘set and forget.’

Categories
Forex Daily Topic Forex Price-Action Strategies

Friday Trading May Need More Attention

The Forex market is open from Monday to Friday. Since Friday is the last day of the week, traders may need to look after their trade more. To be precise, they may need to close their intraday trades manually. In today’s lesson, we are going to demonstrate an example of this.

This is an H1 chart. The price after being bearish has been trapped within a rectangle. It could make a breakout either side. However, the last candle suggests that the price is bearish biased. It closes within the level of previous swing low. If the price makes a bearish breakout, the sellers may trigger a short entry upon the breakout confirmation. Let us proceed to the next chart.

The price action produces an inside bar. As we know, an inside bar is a relatively weak reversal candle. It may push the price towards the North; however, if a bearish candle breaches the level of support, the sellers may get ready to go short on the pair.

The last candle breaches the level of support. It is not an explicit breakout. Nevertheless, the candle closes below the level. If the next candle closes well below the breakout candle, the sellers may trigger a short entry by setting the Stop Loss above the trend-initiating candle.

Yes, the next candle closes well below the breakout candle. The sellers may trigger a short entry right after the last candle closes. Usually, the take profit level is to be set with a 1:1 risk-reward ratio on the H1 breakout strategy. Do not forget that it is Friday. It is an essential factor to remember while trading in the H1 breakout trading strategy.

The last candle gets us some green pips. It looks good now. Most probably, it is going to get us the reward, which it usually does. We must wait and hold the position.

We have been waiting for long. The price has been on strong consolidation. It is still to travel more to hit the Take Profit. As mentioned, it is Friday. The market is about to close (within 2 hours). Usually, most of the pairs get sluggish before the market closes on Friday. On Monday, many pairs start trading with a gap. There is no point holding H1 breakout positions during the weekend. Thus, we may close the trade manually and be happy with half the profit of our expectations.

Categories
Forex Price-Action Strategies

It is Better to be Safe than Sorry.

Using Stop Loss is an essential component of trade management. The Forex market gets volatile from time to time. Taking an entry without using Stop Loss may make an account empty. Thus, under no circumstances, we shall take any entry without using Stop Loss. We need to make sure that we set our Stop Loss accordingly, which is neither too tight nor too saggy. In today’s lesson, we are going to demonstrate an example of that.

The above chart is a daily chart. We see that the price finds its support and produces a bullish engulfing candle. The candle closes within the last swing high. The daily-H4 combination traders are to flip over to the H4 chart to take a long entry upon consolidation and bullish breakout. Let us have a look at the H4 chart.

The H4 chart looks extremely bullish. The chart produces a morning star right at the support zone and heads towards the North for one more candle. Traders are to keep an eye on the chart for the price consolidation.

The chart produces one more bullish candle. It then consolidates and creates a bullish engulfing candle breaching the last highest high on the chart. This is an ideal price action opportunity to trigger a long entry right after the last candle closes. Traders shall set the stop loss below the level of support, where the engulfing candle bounces.

The next candle comes out as a bearish candle approaching the Stop Loss level. However, if we set the Stop Loss below the support level, we would be safe here. Things do not look as good as we expected. Let us proceed to the next chart.

The next candle comes out as a bullish engulfing candle. Things look much better now. However, we must not miss the fact that the bullish engulfing candle has a bounce right at the Stop Loss level. If we set too tight Stop Loss, we would have to encounter a losing trade here. Instead of making the profit, we would lose money.

It is a debatable issue how far we shall set our Stop Loss. It is not recommended that we should set our Stop Loss too far. However, we shall set our Stop Loss below the level of support/resistance and add some extra pips. For intraday trading on the 5M, 15M, 30M, H1, and H4 chart, to measure the number of extra pips, we may use the spread of that particular pair. Let us assume we are taking a long entry on EURUSD. If the spread is three pips, we may add three extra pips to set our Stop Loss. We must do a lot of back-testing with our favorite pairs to find out the perfect measure for this to be safe with our entries. As they say, “it is better to be safe than sorry.”


Categories
Forex Daily Topic Forex Price-Action Strategies

An Entry Derived From an Unusual Consolidation

Price action traders love to see the price consolidates and makes a breakout towards the trend direction. Consolidation offers better risk-reward as well as a better chance of winning a trade. In today’s lesson, we are going to demonstrate an example of a consolidation, which is rather unusual. Let us proceed.

This is a daily chart. The chart shows that the price produces a bullish engulfing candle at a flipped level of support. The daily-H4 chart combination traders may flip over to the H4 chart for the price to consolidate and a bullish breakout to go long on the pair. Let us flip over to the H4 chart.

The H4 chart shows that the price heads towards the North by producing bullish candles consecutively. The buyers shall wait for the price to find its support, consolidates, and makes a bullish breakout. Let us proceed to the next chart.

The chart produces another candle, which has a bullish body. In naked eyes, it is a bullish candle, but it is not. It is an Inside bar, which closes within the level of resistance. Let us have a look at the next chart.

The next candle has a little bullish body as well. Many traders may think that the price is still with the bull. Do not get trapped here. The candle closes within the level of resistance again. The price has not found its support yet. However, it has been on a tricky consolidation.

Look at the last candle, which closes above the level of resistance. The price bounces at the level where the first candle (Inside Bar) bounced. Since a bullish engulfing candle breaks the level of resistance, technically traders may trigger a long entry right after the candle closes. Let us proceed to the next chart to find out how the trade goes.

The price keeps heading towards the North for two more candles. As it seems, it may go towards the North further. An unusual consolidation and an explicit breakout seem to work wonderfully well for the buyers here. We usually see that price consolidates by producing bearish candles on a bullish market and vice versa. In this example, we have seen that the price may consolidate by producing inside bars as well. An Inside bar/s may confuse us. It may make us think the price is not on consolidation. Now we know consolidation sometimes may look different. However, it works as well as usual consolidation.

Categories
Forex Daily Topic Forex Price-Action Strategies

Daily-H4 Combination – Rather Mechanical than Emotional


In today’s article, we are going to demonstrate an example of a daily chart, which after having a bounce at Double Bottom support heads towards the North. However, the question is whether the daily-H4 chart combination traders find an entry or not. Let us find this out.

The chart shows that the price has had several bounces at the level of support. Without any doubt, it is a strong level of support, in which buyers would love to keep an eye on the price action around this level. A bullish reversal candle around this level, like the last one, would make them flip over to the H4 chart to go long upon breakout. We are not flipping over to the H4 chart right now. You find out the reason in a minute.

The price on the H4 chart may have consolidated but never made any breakout on the following day. The candle is called Bearish Harami. Usually, it attracts buyers. However, the daily resistance is not too far, so the buyers may not be interested in buying the pair on the daily chart.

As expected, intraday sellers pushed the price down. Then, a bullish engulfing candle forms right at the level of support. The daily-H4 combination traders are to flip over to the H4 chart. Let us flip over to the H4 chart and find out how it looks.

The chart looks bullish, but the momentum is not there. The level of resistance is far enough, which suggests that there are still some pips for the buyers to grab. The buyers are to wait for consolidation and an upside breakout to go long on the pair.

The next candle comes out as a bullish candle too. The price has covered some distance. This means the price is offering less number of pips. However, if it consolidates from right there, the buyers would still be offered a good risk-reward. Let us proceed to the next chart.

The price keeps heading towards the North. It does not offer an entry. Moreover, it even makes a breakout at the level of resistance. This means the level of support has been working with command. Matter of regret, the daily-H4 chart combination traders have not been able to take an entry in such a strong bullish market.

When things go like this, it annoys us. This is obvious. After all, we are the human being, not a machine. The thing is we often have to deal with things like a machine in the Forex market. It is hard and needs someone to be mentally strong. Whatever it is, we must work towards it.


Categories
Forex Price-Action Strategies

Never give Up: Chase it All the Way

Trading is a game of probability, which requires patience and amazing mental strength. A trader has to have ‘never give up’ mindset. In today’s trading lesson, we are going to demonstrate an example of the importance of having ‘never give up’ attitude.

The price heads towards the North by making new higher highs. The last candle comes out as a bearish candle. However, the overall trend is still biased with the bull. Thus, traders shall look for long opportunities here until it makes a breakout at the last swing low.

The last candle makes a breakout at the last swing low. The bear seems to have taken control. Traders are to go short on this chart upon upside correction. The last candle closes within the level, where the price reacted heavily earlier. Thus, the price may consolidate hard here.

It does not. It rather makes a breakout straightway. Moreover, it produces another bearish candle and approaches towards a significant level of support. Usually, after making such big movements without having consolidation, the price gets tired and choppy.

It is not tired on this occasion though. It consolidates and produces a bearish engulfing candle closing below the last support. A short entry may be triggered right after the candle closes by setting Stop Loss above the consolidation resistance.

Off she goes. The price heads towards the downside with extreme bearish pressure. Two consecutive bearish candles and there is still no sign of a reversal. The sellers may keep holding their position to make more pips. The movement justifies the statement that the market can be very tricky from time to time. It can do things (market move) that we may not even imagine on that particular occasion.

After making the first breakout, the price makes an abrupt move. Usually, in most cases, the price does not continue its journey towards the trend. Either it consolidates for a long time or it makes a reversal. Many price action traders may not want to keep their eyes on the chart. They may think it is a waste of time. However, the above example shows us that it is not waste. Experienced price action traders must have made full use of that bearish move. If a trader wants to survive in this market, he is to be patient, perseverant, and hard working. With these three qualities, he must have ‘never give up’ mind setup.

Categories
Forex Basic Strategies

No Breakout Confirmation or No Consolidation Means No Entry

Price Action traders crave for the breakout. Breakout is one of the most important components of price action trading. However, there is another equally important thing, which is breakout confirmation. Since the Forex market is very action-packed, it is often found that the price does not come up to the breakout level to confirm the breakout. It consolidates and produces a reversal candle to offer entry. The question is, does it always consolidate and offer an entry.

Let us find out.

The price headed towards the South and seems to have found its support. It has been heading towards the North now. The price is at the last swing high. Thus, the buyers are to wait for an upside breakout and breakout confirmation to take a long entry.

The price makes a breakout, but at the time of confirmation, it comes back in. Thus, the breakout is void. It goes towards the upside again. This time it gets rejected from the last swing high. Thus, the price does not make any breakout here.

This time it does. A huge bullish engulfing candle breaches the last swing high. That is a Double Top resistance as well. The buyers are to wait for the price to come back at the breakout level and get a bullish reversal candle right there. Alternatively, it may consolidate somewhere in between the highest high and the breakout level.

It keeps going up. Let us not give up but keep eyeing on the pair. It has gone too far up. It may not come back at the breakout level. It may rather consolidate. Let us find out what it does.

It keeps going towards the North. There is no sign of consolidation yet. A swing high on the chart is evident, which is nearby. As things stand, risk-reward is getting less lucrative.

As expected, the price has found its resistance before the level of the last swing high. The price action gets choppy. Traders are to wait for the price to give them the next direction. In a word, price action traders do not keep this kind of chart on their watch list.

The Bottom Line

A chart looked extremely good and was about to give us an entry ended up being a choppy chart. What more frustrating is it went towards the desired direction, but it did not offer us entry. Some traders may think it would be good if an entry is taken. At least some pips can be achieved. Please note, do not even think about it. After breakout, the price must confirm the breakout or consolidate. To sum up the whole equation, no confirmation or no consolidation means no entry.

Categories
Forex Basics Forex Daily Topic

A Breakout Brings More Momentum than any Other Trading Factor

A Breakout Brings More Momentum than any Other Trading Factor

A bearish engulfing candle at a Double Top or consolidation resistance is an excellent signal to go short. However, if a bearish engulfing candle closes right within the support level, it sometimes may create an upside momentum on the minor charts. In today’s article, we are going to demonstrate an example of that.

The price heads towards the North with strong bullish momentum. Ideally, traders are to look for opportunities to go long here upon consolidation, followed by upside breakout. The last candle comes out as a bearish candle. It may consolidate and make an upside breakout as things look. Let us go to the next chart to find out what happens next.

The pair produces a bearish engulfing candle. Several rejections and a bearish engulfing candle suggest that traders may want to go short on the pair. If they’re going to go short from here, they are to flip over to the H1 chart since it is an H4 chart. For a reason, I am not showing the H1 chart since the H4 chart itself tells the story that I want to share. Let us look at the H4 chart with another equation.

The candle closes right at a level where the price has bounced earlier. This is an explicit support level, which may play an essential part in the minor charts. Soon we find out how the pair reacts from here.

Look at the last candle. The candle comes out as a bearish engulfing candle. However, look at the upper shadow. It goes up to the consolidation resistance. With some brokers, because of the high spread factor, some traders’ Stop Loss may be swept away. The last candle, after having a strong rejection at around the resistance level, closes below the support. The sellers are to flip over to the H1 chart, wait for consolidation and bearish breakout to go short on the pair.

Again, I am presenting the H4 chart to show the next price movement.

The price does not look back this time. It heads towards the South with strong bearish momentum. The H1 chart may have offered some entries, as well. What lesson do we get from these examples?

  1. In an H4-H1 combination, after an H4 reversal candle, traders are to flip over to the H1 chart to take an entry.
  2. The last swing high or swing low on the H4 chart is to be counted.
  3. If the reversal candle closes right within the last swing high or swing low, it may push the price towards another direction, produce spike and sweep away our Stop Losses.
Categories
Forex Psychology

What Wastage of Time!

The H4-H1 combination is one of the best combinations to trade for intraday traders. The H4 chart is the most consistent intraday chart in the Forex market. The H1 chart integration with the H4 chart offers many reliable entries. However, it is often seen that the H4 chart doest its part, but the signal never comes on the H1 chart. In today’s lesson, we are going to demonstrate an example of an H4-H1 chart combination, which is about to give us entry, but it ends up not producing a trading signal. Let us find out how the story goes.

The price after being bullish on the H4 chart, it has several rejections at a level. The last bearish candle gets rejected at a Double Top resistance. The sellers are to flip over the H1 chart and wait for the H1 consolidation and H1 bearish breakout to go short. However, it is an Inside Bar. It may not attract the sellers that much. Let us proceed to the next chart.

This is the H4 chart, as well. The price does not head towards the South on the H1 chart. It rather produces an H4 bullish candle followed by an H4 bearish engulfing candle. This time it may attract more sellers to be keen on selling opportunities. They are to flip over to the H1 chart again. Let us have a look at how the H1 chart looks.

This is the H1 chart. The last candle comes out as a bearish engulfing candle. The sellers are to stick with the chart to wait for consolidation and to get a breakout to go short. The waiting game starts.

The price keeps going towards the South without having any consolidation. Since the sellers do not find new resistance, thus there is no entry for them yet. Let us not give up but wait for consolidation.

The consolidation starts, but it does not make any H1 breakout to make the new lowest low. It rather finds a level of support where it has several bounces. It is a ‘Double Bottom’ support. The way things look now, it may head towards the North if the price breaches the neckline. All anticipations and hopes have gone in vain. Some traders may think, “what wastage of time.”

If you think it is a wastage of time, you are far away from being a professional trader. 70% of your trade setup like this may end up not offering an entry. Never think it is a waste of time. Take it easy. Each potential setup does not offer an entry. Concentrate and find out more setups in other pairs. It must be round the corner.

Categories
Forex Market

Finding The Optimal Risk % In Forex Trading

Introduction

Calculating risk is one of the most important parts of Money Mangement. Many novice traders or traders with limited experience won’t be aware of the amount of risk they can tolerate. In this article, we shall focus on determining the appropriate risk % that fits your trading style. The goal of risk management is to gain control over three things:

  • Emotions
  • Leverage
  • Sustenance

Furthermore, by limiting the loss per trade, a trader can ensure that his/her trading capital is not wiped out in one single trade. Having this discipline systematically reduces the loss per trade and provides an opportunity for the trader to re-look at the situation.

Calculating the risk

One can determine the risk based on the following factors:

Win rate

Win rate refers to how often a trader takes profitable trades relative to the trades that result in a loss. Win rate is determined by using the risk-to-reward ratio (RRR) and is calculated by the following formula.

Win rate = 1/(1+RRR)

The above-given formula is also referred to as the Minimum win rate. If any trader is trading with an RRR of 1, then his/her minimum win rate will be 50%. So out of 100 trades, we require a minimum of 50 trades to end as winners to compensate for the losing trades.

This will help a trader in deciding their maximum risk based on the win rate. This formula can also determine if a trade can be taken or not. For example, if someone has a win rate of 25%, he/she will not be able to take trades that have a risk-to-reward ratio of less than 3.

Nature of the market

Depending on the market situation, the risk can vary substantially. In a trending market, like the one in the below chart, risk should be reduced as much as possible by using a stop-loss order. We are recommending this idea as you would most probably be trend trading, and there is no point in risking more than the usual (can be lesser).

Trending Market

In a market that is trapped in a range (below image), the risk is always higher. This means anyone who trades the consolidation market is essentially increasing their risk. This would mean increasing the stop-loss, thereby reducing the risk-to-reward ratio (RRR) of the trade.

Ranging Market

Maintaining a risk of 1% constantly, regardless of the market conditions, will help the traders to sustain the loses and stay in the game even after a series of losing trades. This is a conservative method that reaps fewer rewards, but the risk is certain.

Conclusion

The aim is to achieve some level of consistency in trading by allowing yourself and your trading strategy to fight the evil forces of the market. We would say in all circumstances, a max risk of 1% appears to be the winner if you are a conservative trader. When the risk increases, it is said to impact not only the capital of the trading account but also the psychology of a trader. Hence it is better to keep risk at a bare minimum in times of uncertainty.

Categories
Forex Basic Strategies

The H4-H1, an Action-Packed Combination

In today’s lesson, we are going to demonstrate an example of the H4 and the H1 chart combination for taking entries. Both are intraday charts. A large number of traders do the job using those two charts. Thus, it is an excellent combination to trade in the Forex market.

Let us get started.

This is an H4 chart. The chart shows that the price heads towards the North. On its way, it made an upside breakout, which may play a vital role in pushing the price towards the North further. Despite having a long lower shadow, the last candle comes out as an Engulfing candle. The price may start its correction this time.

As expected, the price comes down to the flipped support and produces a bullish engulfing candle. The last swing high is far enough to offer a 1:1 risk-reward. However, we do not take an entry right after the candle H4 closes. We rather switch over to the H1 chart.

This is how the H1 chart looks. It shows that the price starts having correction by producing a Doji candle. An engulfing bullish candle closing above the Doji candle is the signal to go long here. Let us wait for a Marubozu bullish candle.

This is one good-looking Marubozu bullish candle. However, it closes right at the resistance zone. Risk-reward is 100:0 here. We must wait for an H1 consolidation and breakout towards the upside to take a long entry.

Here they come. The price consolidates and produces an H1 bullish candle, which closes above the resistance. Traders may trigger a long entry right after the candle closes by setting stop loss below the last support. The H1 chart does not show any resistance nearby. Thus, the price may head towards the North with good bullish momentum. It may get us 1:2 risk-reward or even more. Usually, the price reverses once 1:1 risk-reward is achieved. Let us find out what happens here.

The price consolidates much earlier than our expectations. Our reward is not achieved. Thus, we keep holding our position. We are risking a loss here. However, we must keep our patience.

The price makes another upside breakout and heads towards the North. The wave gets us our expected reward and starts having a pullback. If we have not set our take profit, we may manually close it; or we may use a trailing stop loss. We will demonstrate some examples of using trailing stop loss in this combination in upcoming lessons.

The Bottom Line

The H4-H1 combination is an eventful combination. A Trader needs to have skill, expertise, experience, and patience to handle it. Once he learns it well, it may have his hands full in making money by trading.

Categories
Forex Videos

Assessing Forex Price Consolidation Like A Pro

Price Consolidation


In any market, but specifically, the Forex market, when we talk about price consolidation, we are referring to the price action, or the up and down movements, of exchange rates of a particular currency pair that occurs between defined levels of support and resistance.
These areas of consolidation are typically seen after, or during trend cycles, either to the upside or downside or during time zone crossovers. At these times, price action will usually become slightly muted and whereby volume in terms of liquidity dries up.

Some people refer to these areas of price consolidation as the markets taking a breather, or times of indecision. At these times, traders will look at what has been happening on a currency pair after a defined trend in either direction, due to technical or fundamental analysis. At which point traders will be wondering if the trend will continue or if there will be a reversal. And therefore, liquidity is taken out of the market until such time as traders pile into the next move.
Therefore, price consolidation can only be identified via technical analysis.

Example A


And so let’s look at the example ‘A,’ which is a fairly typical example of what you can expect in the Forex market on an all too regular basis. This is a 15-minute time frame of the EURUSD pair. We are using Japanese candlesticks and some trend lines which we have drawn it onto our chats.
We always read our chats left to right, because they tell a story of where the pair has been moving too and from. We can see that from position ‘A’ there was a bearish trend which is clearly defined by our red candlesticks. Traders pushed the pair lower by 55 pips during this move, before price action pulled back slightly due to indecision by traders.

Position ‘B’ then becomes an area of support, and price action consolidates between this support level and a clearly defined area of resistance, where price action fails to go any higher than position ‘C.’ We then have a period of sideways movement or price consolidation, and where the overall movements between these two lines is restricted to a very small 15 pip range. In the middle of this section we can see that some of the candlesticks are very small, and during some of those 15-minute time frames, price action moves no more than a couple of pips. This is a clear sign that price action is in a consolidation mode, and where traders will be looking for the next breakout from this narrow range.


Example B

Let’s go back to that chart as per example ‘B,’ which is a few time frames later than the previous. Here we have added a secondary support level. This level was not breached during the midsection of this consolidation period. However, as price action begins to fade to the downside of the consolidation period and breaches the secondary support level and also breaches the original support level briefly before moving up to the secondary support level, which then becomes an area of resistance at position ‘E.’ Price action then falls back to our original support level. We can see that the size of the candlesticks has become larger, and during this later stage where the sellers’ candlesticks engulf those of the final two bullish candlesticks in the series. This indicates to traders that buyers are starting to stay on the sidelines and where sellers believe that they will see a continuation of the trend lower and which originally started at position ‘A.’ Therefore, the activity around positions ‘D’ and ‘E’ become selling opportunities and where a secondary trends lower has been established from this period of consolidation. The longer the period of consolidation, the more likely the market will react with an explosive breakout. Remember, at some stage, the market simply must move on.

Example C

So how do we know if support and resistance is applicable to our chart? Have a look at the example ‘C.’


The best way to determine if support and resistance is happening is to establish at least two positions on our chats where the market fails to go lower, and this will be the support or floor, and two positions on our chats where price fails to go higher, and this an area of resistance, or a ceiling. As we can see in our diagram, price action fails at position B’s bearish trend, and we have now called this position 1, Traders try to push the pair lower again and failed at position 2. The move action pushes higher to position 3. A subsequent move fails to go higher at position 4. Therefore this could be considered to be acceptable areas of support and resistance.
We can now use these levels of support and resistance in our risk management strategy, should we wish to take on a trade in either direction with this pair. If we believe the market is likely to break out to the downside eventually, then we should place our stop loss a couple of pips above the highest candlestick formation adjacent to our resistance line.

On the flip side, if we believe the market will reverse the original trend lower, and move to the upside, we would simply need to place our stop loss a couple of pips under the lowest candlestick adjacent to our support line. This is typically how professional traders place this stop losses when trading out from areas of consolidation.

Categories
Forex Basic Strategies

A Twist in the Tale

The Forex market can be very unpredictable. It is a game of probability. With more experience and knowledge, a trader increases the chance to be right in making a trading decision. Having immaculate risk management is another aspect that keeps a trader safe with his investment. In today’s lesson, we are going to talk about the unpredictability of the market.

Let us start with a daily chart of a Forex pair.

The price makes a bullish move and finds its resistance. After four daily candles, the daily chart produces a bullish engulfing daily candle. This is a powerful bullish reversal candle, which forms right at a flipped support. Have a look at the chart below.

The chart above shows that the bullish engulfing candle forms at the flipped support. This means buyers on this chart are to go long on a chart pattern called ‘ABC’ or ‘123’. This is a lucrative and consistent chart pattern, which price action traders love to trade. Let us find out what happens next.

The price stalls and has a rejection at the same level. The buyers would love to get a breakout here to go long and grab some green pips. However, the chart produces a bearish engulfing candle instead. What do you think a trader should do here?

He shall start looking for short opportunities. This is the daily chart. Thus, he shall flip over to the H4 chart to find out a short opportunity.

This is how the H4 chart looks. A very strong bearish candle followed by a little Inside Bar. The trader (the seller) is to wait for consolidation and a bearish reversal candle to go short.

The price consolidates more. It produces a good-looking bullish candle. Let us find out how the next candle comes out. Do not forget that the sellers are waiting to get a bearish reversal candle breaching the lowest low.

This is it. A bearish engulfing candle closes below the level of support. The sellers have been waiting to get a signal candle like this. A short entry may be triggered right after the last candle closes. Let us find out what happens next.

As expected, the price heads towards the South with good bearish momentum. We see the first H4 bullish reversal candle forming at the daily support as well. This may be time to take out the profit.

The Bottom Line

Do you notice how things change within a candle? Before that bearish engulfing daily candle, the pair looks extremely good for the buyers. An upside breakout would make them go long on the pair and push the price towards the North. However, that does not happen, but the price comes down instead. This is what I call “Twist in the tale.” Forex traders often get these twists.

Categories
Forex Basic Strategies Forex Trading Strategies

What Should Know About Trading Ranges Using Support & Resistance?

What is Range trading?

It is said that the market only trends for 30% of the time. So it becomes necessary to have a range trading strategy to take advantage of the other 70% of the time. Range trading is not difficult, but it requires discipline and determination to make most out of it. When a market is trending, it forms a pattern of higher highs and higher lows, in case of an uptrend. The move, in this case, is really strong and is known as an impulsive move. The other type of movement is known as the corrective move, which comes in the form of a pullback. Impulsive moves are stronger than corrective moves.

When the market is making any such moves, it finds itself stuck between a high or low and continues to oscillate between these two points. It means buyers and sellers are equally strong, and this creates a very choppy environment.

Traders now trade these extremes and continue to trade until price breaks out on either of the sides. These two points act as potential support and resistance points, used by traders to place their orders.

In the above chart, we have drawn a few lines from where the market bounced off. The price action in those areas creates many trading opportunities. The instrument in the chart first trends down and then puts up a low (marked by line 1). Initially, you might think it as a downtrend and expect the pattern of lower lows and lower highs to continue.

Then you see the market rally to line 2, from where the market falls back to line 3 but does not fall till line 1. This highlights the fact that the market is no more trending. The market instead could be stuck in a range between line 1 and line 2. These are not ‘defined’ prices. Always consider them as zones with a margin of error both outside and inside the range. A trader will look to position himself/herself at these zones of support and resistance that forms the range.

Why support and resistance?

The price that is stuck between these two extremes has a lot of significance. This is because, at this point, the price can either Stop, Reverse, or Breakout. When you have the right knowledge, it will stop you from simply pushing the buttons and will make you trade with a defined strategy.

Range = Consolidation

A range is nothing but a price consolidation of the overall trend move. It could either end the current trend or cause a reversal. The different price behavior pattern in the range creates many trading opportunities, which can be traded by all types of traders, depending on their risk appetite. Now let’s discuss some important trading strategies using support and resistance of ranges.

Strategy Using Technical Indicators

Using technical indicators to trade can aid your trading strategy. Especially while trading ranges, many indicators can be a part of your trading plan. Here, we have used the Stochastic Indicator as a tool to trade the ranges.

In the above image, the two lines represent the support and resistance of the range formed. When the price reaches the resistance at point 1, the Stochastic enters the overbought area, and the slowdown in momentum is the confirmation signal for a sell. The resistance pushes the price back to support (point 2), but this time the momentum is very strong, hence no entry. The stochastic also does not enter the oversold area clearly. Next time the price goes to resistance with greater momentum, and the Stochastic too does not give an entry signal as it is not in the overbought area. This means one shouldn’t be going short at this point.

Overall, there is only one risk-free trade available in the above chart, and that is at point 1 (short).

Strategy Recap

Firstly, we should be able to see the price at one of the extremes. When that happens, the indicator should show either be at overbought or oversold conditions. The momentum of the price should be an important factor that determines our entry. If we see reversal patterns, this could be the best entry with a good risk to reward ratio. Do not forget to place protective stops much below or above the support and resistance levels, respectively. This will always protect your trades from a false breakout.

When not to buy at support and sell at resistance in ranges

You must have probably heard traders saying that more time a level is tested, the stronger it becomes. This is not true in the case of our range break-out strategy. You need to start paying attention to the price patterns at these ends. If the price has made multiple touches, it could be getting ready for a breakout in the direction of the higher time frame.

The above chart is an example of such a scenario. It shows a range, and at point 1, you can see the strength in the candle as price pushes towards the resistance area. The next push makes the price to consolidate at the extreme. It appears to be a battle between the bulls and bears. It is also making higher lows as a part of the uptrend. Hence a breakout after this point is not surprising.

You don’t want to see the higher lows at the resistance extreme and lower highs at the support extreme.

The resistance could still work, and a reversal could happen, but this type of price action does not give much confidence for shorts. Only aggressive traders may find some entry in that consolidation, for a potential long. They can put a protective stop below the higher low that was formed before the accumulation.

We hope you find this strategy informative. Let us know if you have any questions in the comments below. Cheers!

Categories
Forex Price-Action Strategies

Breakout by a Single Candle Generate More Impetus

Breakout is one of the most important factors in trading. Attributes of a breakout give clues with what traders can manage their opened position to make more profit. Price action traders, in particular, love to compute the attributes of a breakout to determine their take profit level.

In this section, we are going to demonstrate an example of a single candle breakout and its impact afterwards. Have a look at the chart below.

The price finds support at the red market level and heads towards the North. The price action suggests that the buyers are going to control the pair. A downward correction/consolidation followed by a bullish reversal candle at a value zone is what they need to wait for. Let us find out what happens next.

The price seems to have started having a pullback. The first corrective candle comes out as an Inside Bar, which is a good sign for the buyers. The buyers wait for the price to come back at a level of support with a reasonable distance from the resistance. Let us see how far it comes up to.

The price has crossed a good distance from resistance. The buyers are to wait for a bullish reversal candle. Ideally, a bullish engulfing candle is the first choice for the buyers. Other candles such as Inside bar, Spinning Top do the job as well, but an engulfing candle’s signal attracts more traders, and it brings more liquidity. Let us see what happens next.

Price action traders dream of such a reversal candle. This is not only a bullish engulfing candle but also an engulfing candle, which breaches the highest high of the last wave. Let us draw the consolidation zone on the chart.

The reversal candle makes the breakout with good momentum. A trader shall trigger a buy entry shall right after the candle closes. When a reversal candle itself makes a breakout, it makes the fore coming move go towards the trend’s direction with good momentum. Look at the chart below.

Look at the pace of the bullish move after the breakout. Here is another very important factor that traders must remember. A single candle breakout usually offers a 1:2 risk-reward ratio. This means traders shall add some extra pips with their profit target when they get such price action. The drama remains. Have a look at the chart below.

The price makes a correction and seems to have found support again. It suggests that the buyers are still in control. Smart buyers take their Partial profit and let the rest of the trade run to earn more pips.

As mentioned, breakout attributes give clues about the trend’s strength. Eventually, this helps traders manage their trade nicely and make more money out of trading.

Categories
Forex Basic Strategies

Understanding The N-period Narrow Range Trading Strategy

Introduction

There are three states in the market – trend state, channel state, and range state. A trending market is the one where the market makes higher highs or lower lows, and a ranging market is a state where the price goes through a consolidation phase. The channels can be considered as a particular case of range as they work similarly to a range, but are tilted.

What is consolidation?

To understand this strategy, we must first understand the concept of consolidation. Consolidation is a technical term in trading where the market loses momentum and starts to move in the form of a range.

A common tendency of the market is that, when the price starts to move in a range and begins to consolidate, it prepares blast in one of the sides. So, people always keep an eye on currency pairs, which are in a consolidation phase.

N-Period Narrow Range

In the N-period narrow range, the period N takes two values –4 and 7. So, we have the 4-period narrow range and the 7-period narrow range. These two are also referred to as the NR4 (Narrow Range 4) and the NR7 (Narrow Range 7).

The NR4 and NR7 trading strategy

This strategy is basically a modified range breakout strategy where the market consolidates in the beginning and then blasts out of a narrow range.

In NR4, number 4 refers to the period under consideration. That is, for NR4, the last four days are taken into consideration, and for NR7, the last seven days are taken into account.

What is the NR4 and NR7 strategy?

It is a breakout trading technique where we consider the last four or sever days to apply this strategy. And in these four or seven days, we compare the range of all these days and determine if the current day is an NR4 or NR7 day. Once we obtain the NR4 or NR7 day, we gear up to go long or short.

Calculating the range

Firstly, to trade this strategy, consider the candlestick chart on the daily timeframe. The range of a particular day is calculated as the difference between the high price and the low price.

What is the NR4 day and the NR7 day?

NR4 day

In layman’s terms, the least fluctuated day (4th day) in the recent four days is called the NR4 day. Technically, it is the day whose range is the smallest out of the previous four trading days.

NR7 day

Similarly, when the 7th day in the last seven days moves the least number of pips, it is referred to as the NR7 day.

How to trade the NR4/NR7 strategy?

Following is a set by step procedure to trade this strategy:

  1. Find the high and low of the last few days (seven for NR7 and four for NR4).
  2. Calculate the range (high – low) for each day under consideration.
  3. Compare these range values with the previous days.
  4. Determine if the present day is an NR4 or NR7 day. If so, then wait for the price to break out of the high or low of the NR4/NR7 day.

If the market breaks above the high, then it is an indication for a buy, or if it breaks below the low, then it is an indication for a sell.

Illustration to trade the N-period Narrow Range

Trading the NR4/NR7 strategy is simple. But, as far as the consistency of this strategy is concerned, one can make more out of this strategy only when the NR4/NR7 day appears in the right location. Hence, understanding ‘where’ the NR4/NR7 occurs is very vital. So, let’s consider a few examples to support this statement.

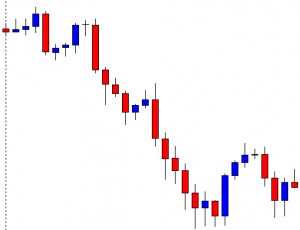
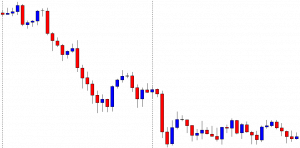
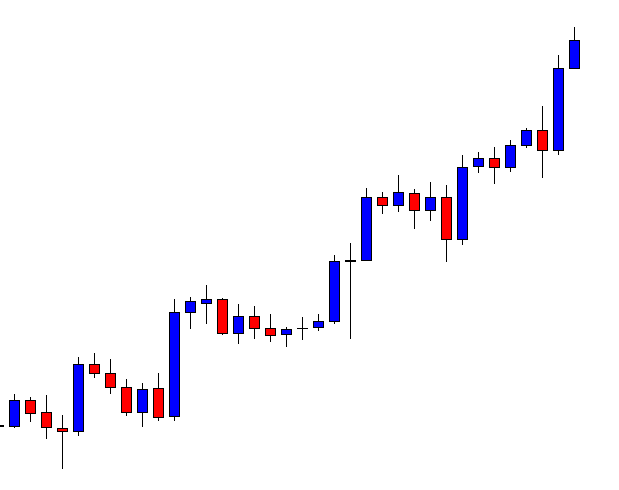
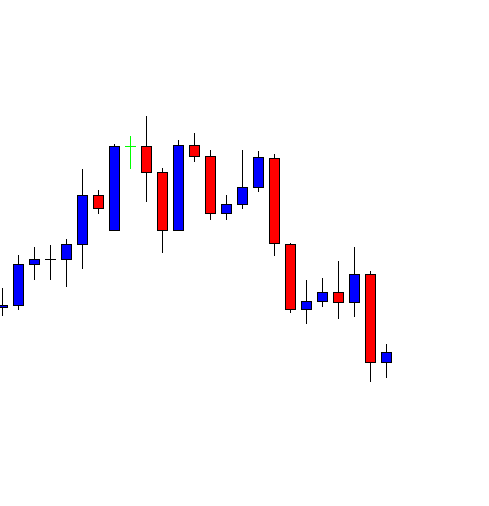
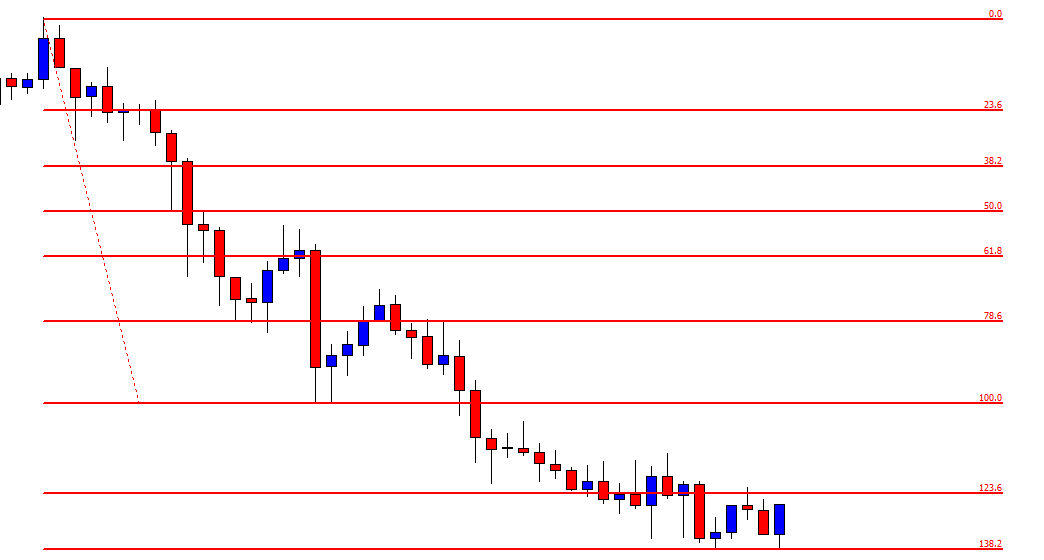
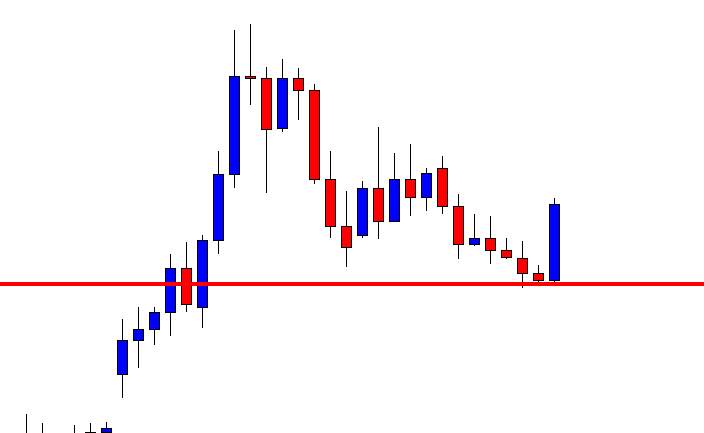
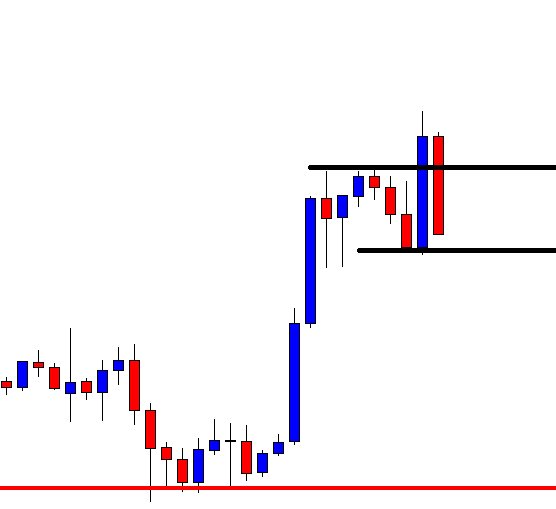
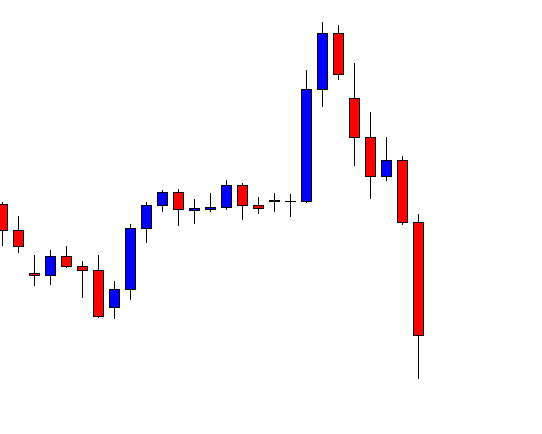
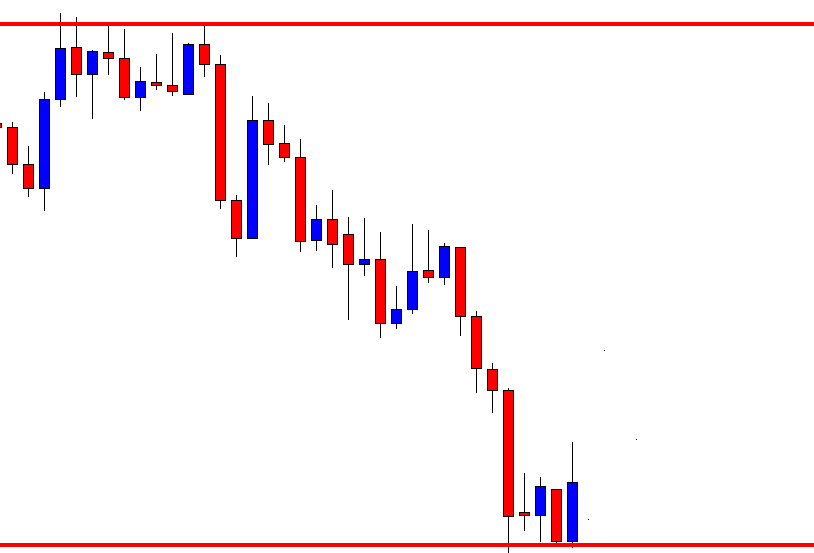
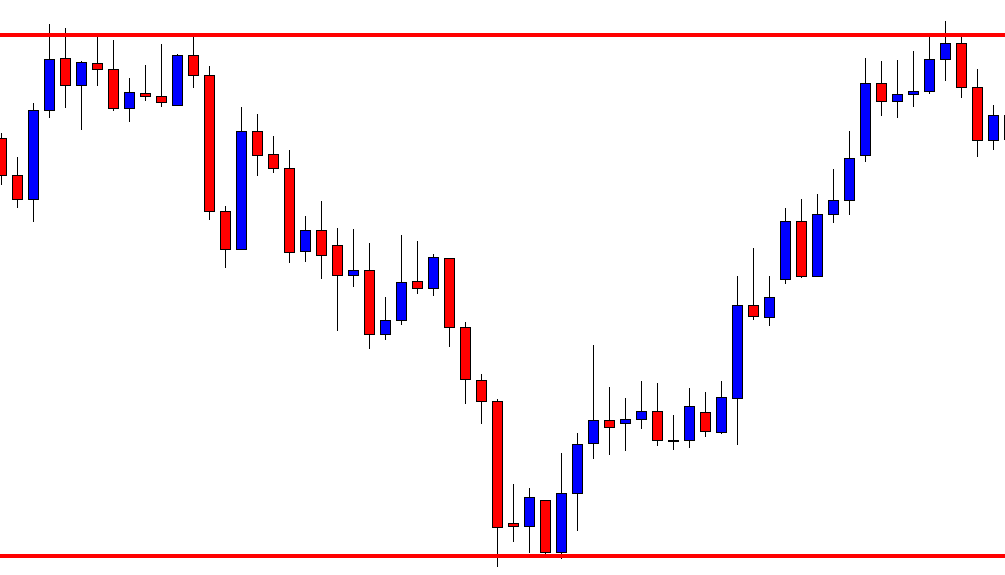
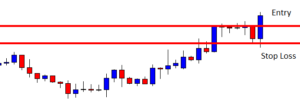
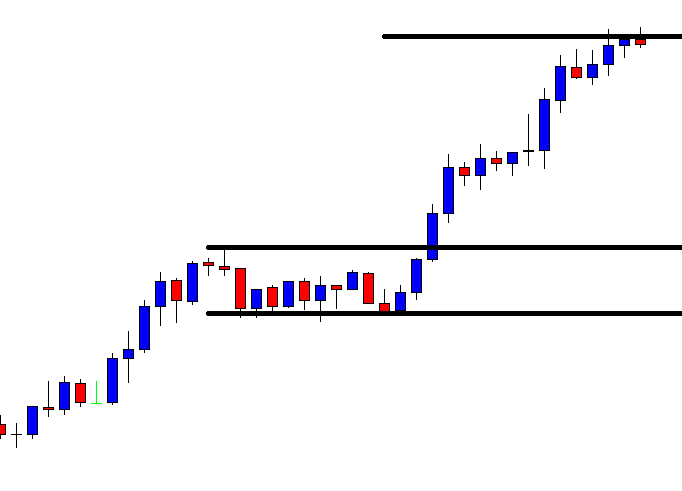
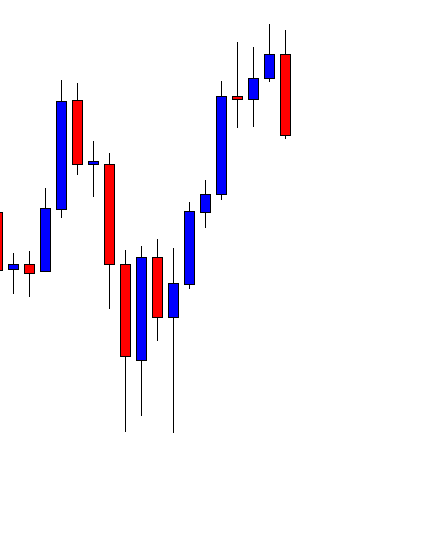
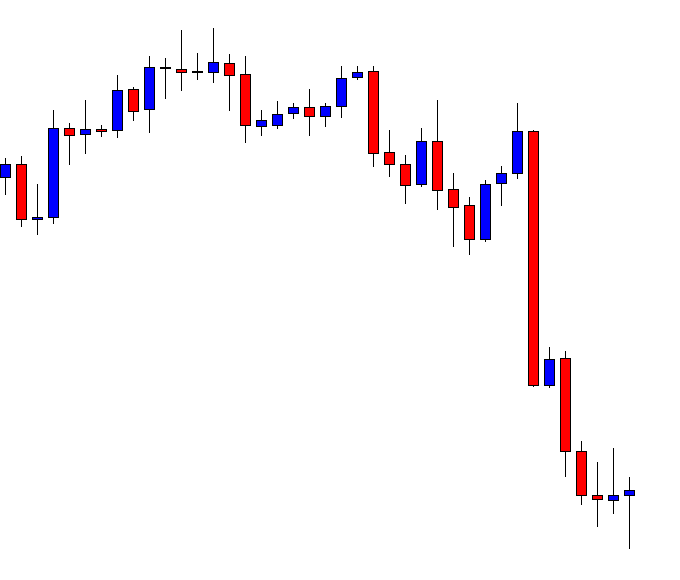
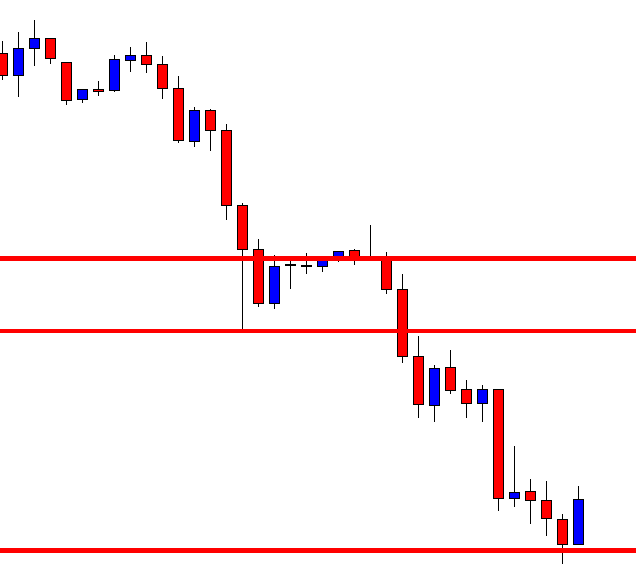
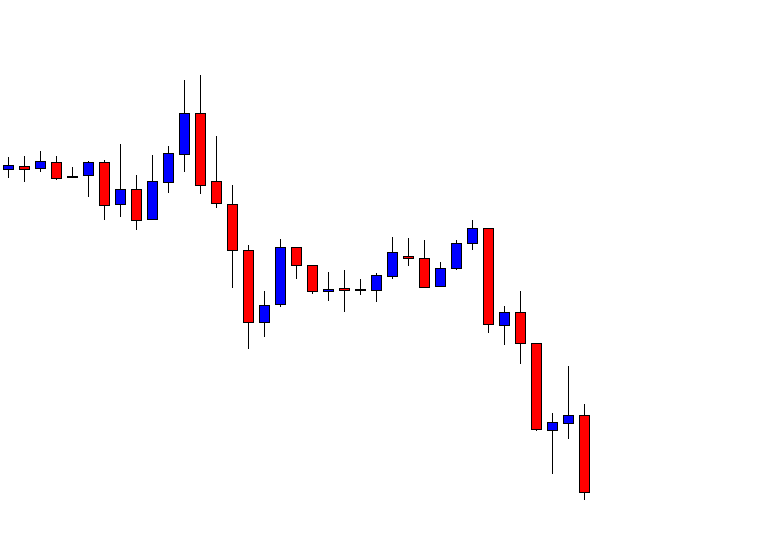
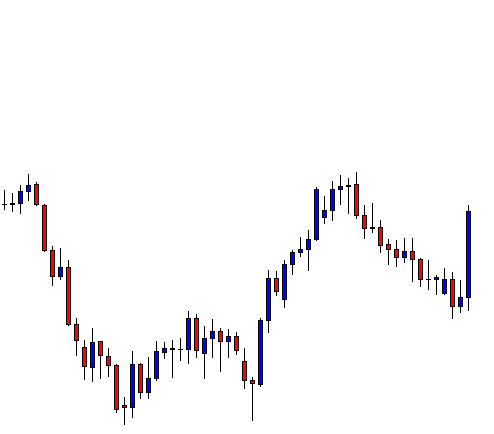
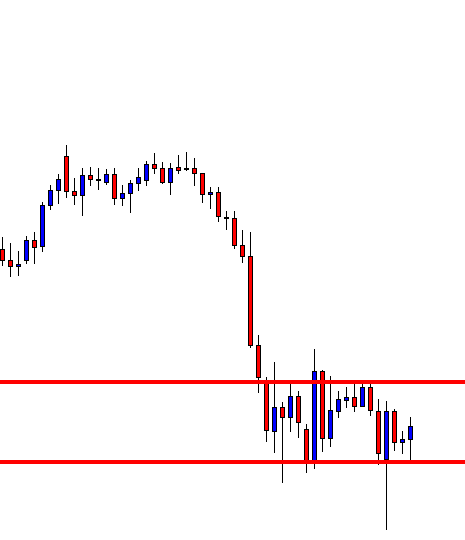
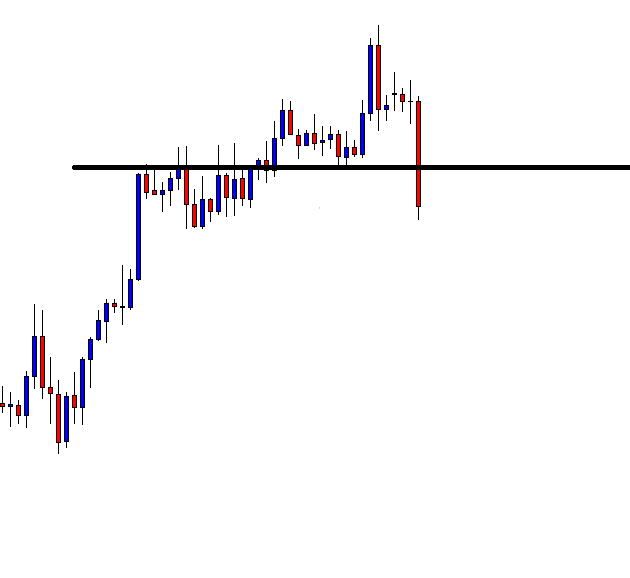
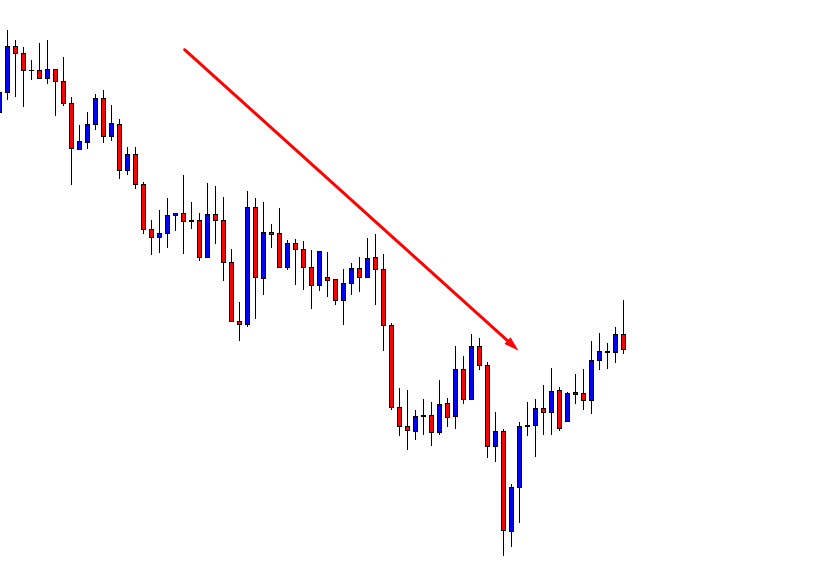
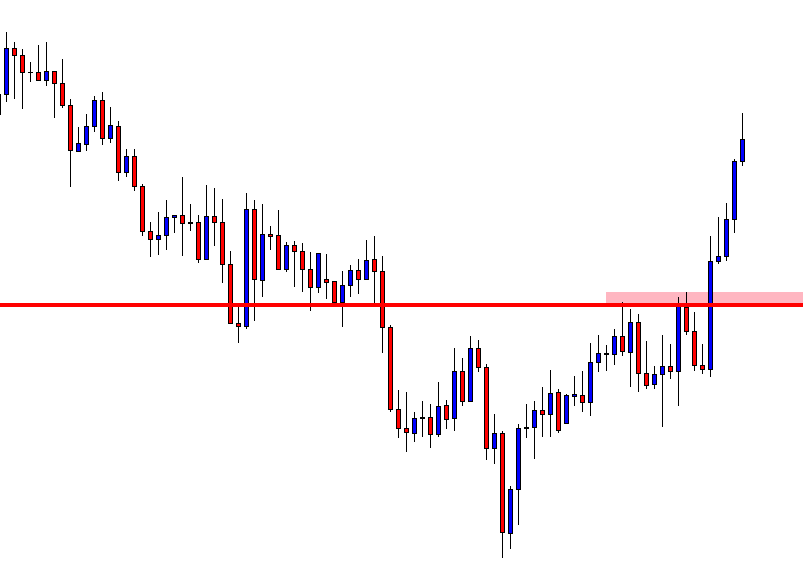
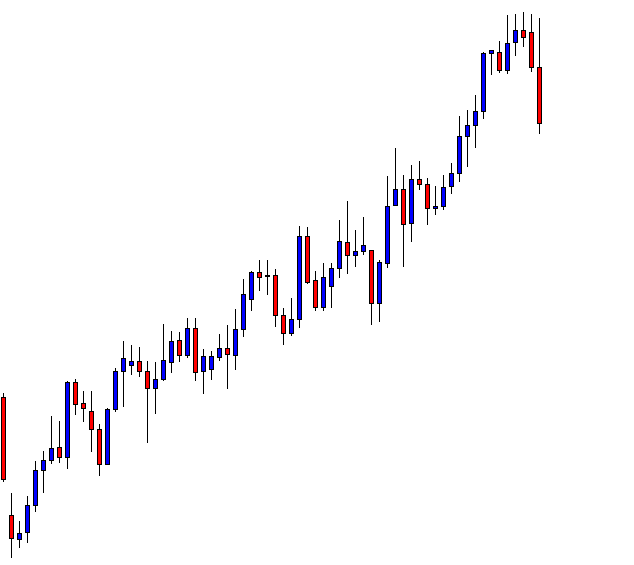
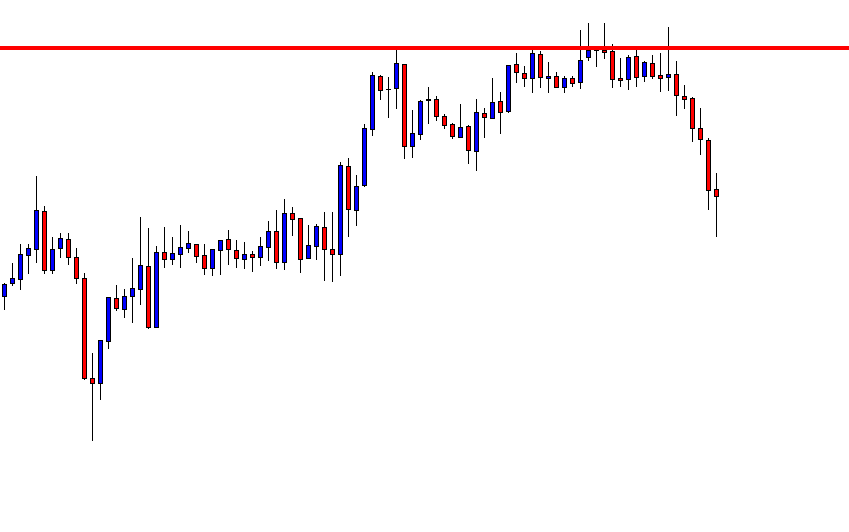
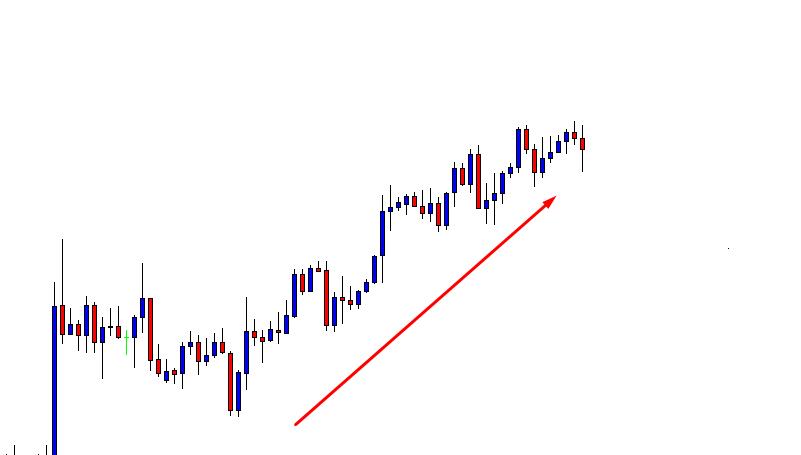
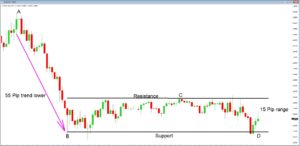
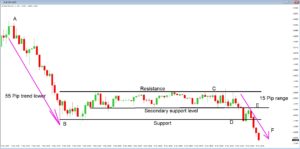
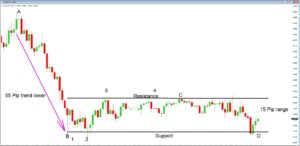
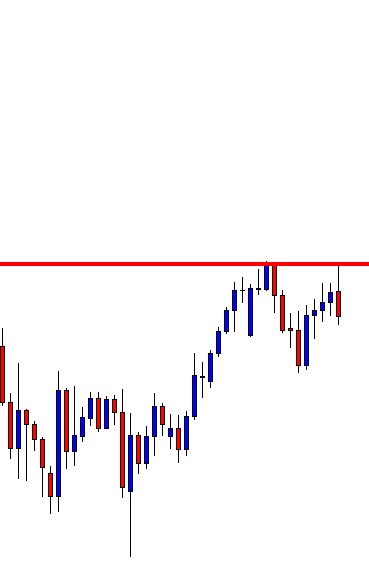
Below is the chart of USD/CAD on the Daily timeframe. We can clearly see that the market is moving in a channel state. Now, to trade this strategy, we blend it with the working of a channel.

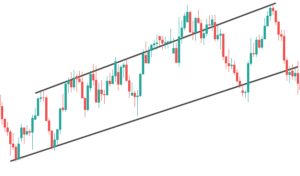
Trading a channel is pretty straightforward. When the price is at the bottom of the channel, we look for buying opportunities, and when it is at the top of the channel, we look for short-selling opportunities. With this mind, we try spotting the NR4/NR7 days in these regions.

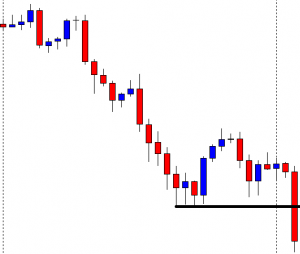
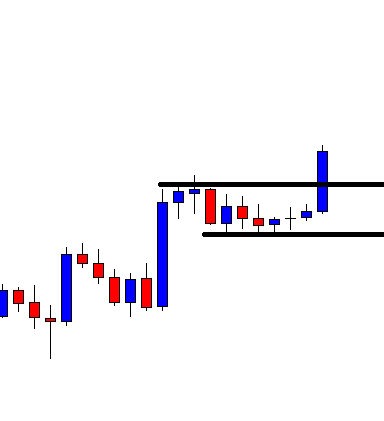
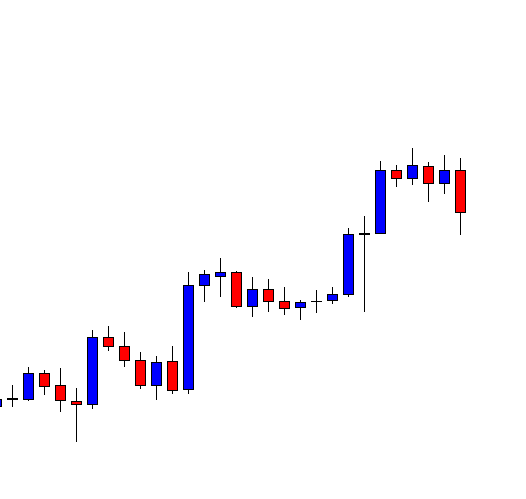
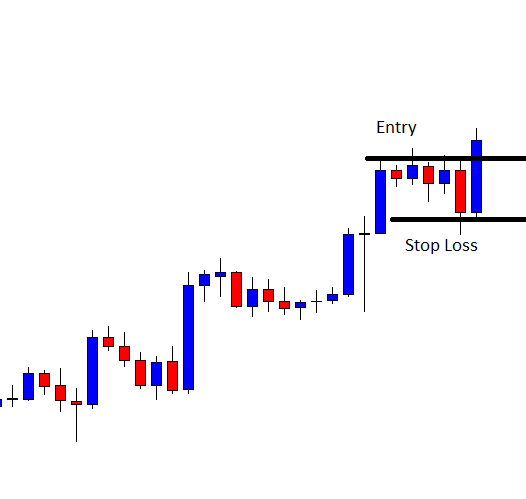
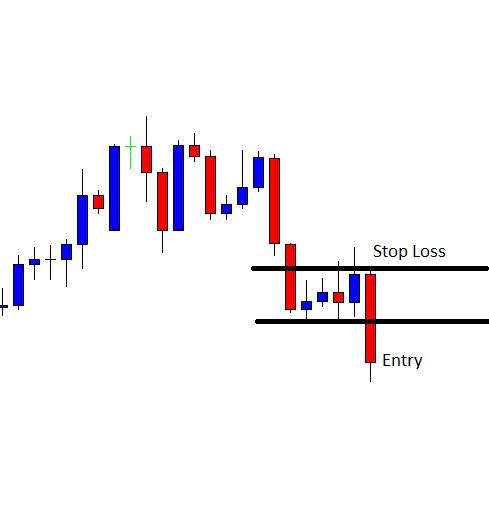
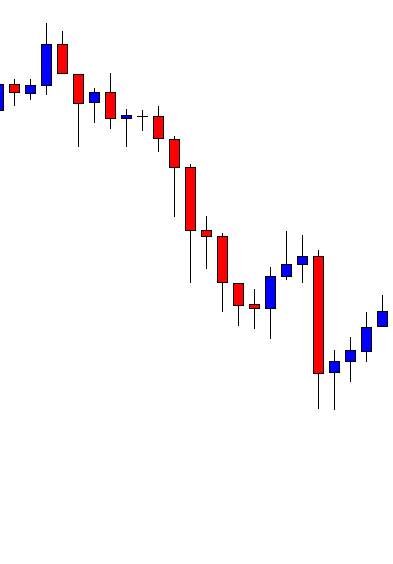
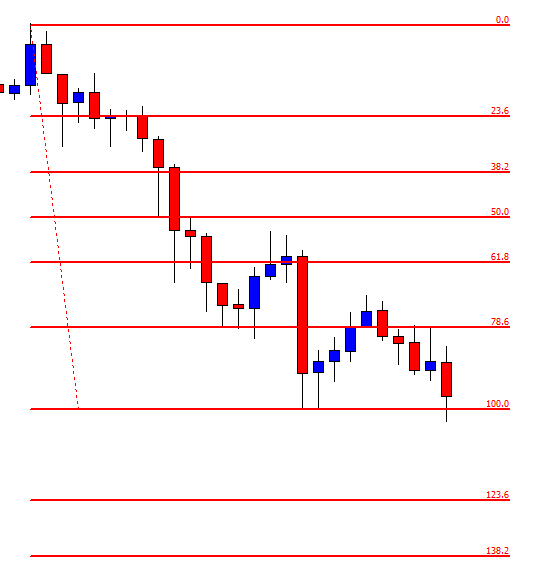
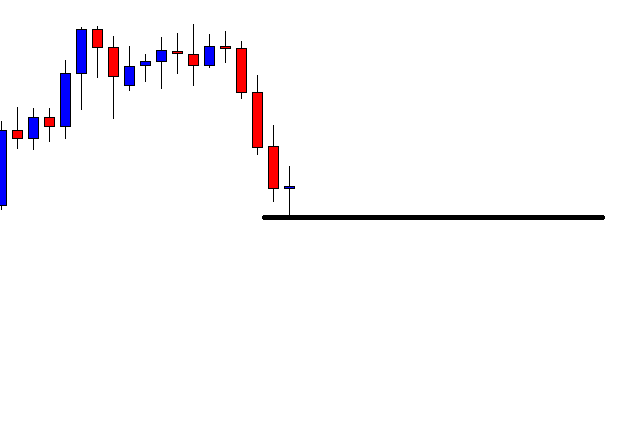
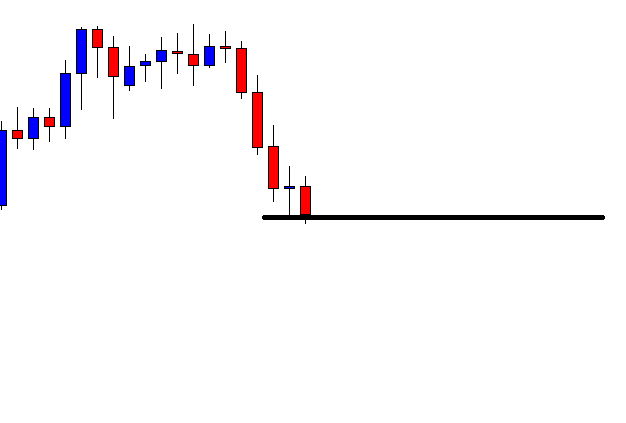
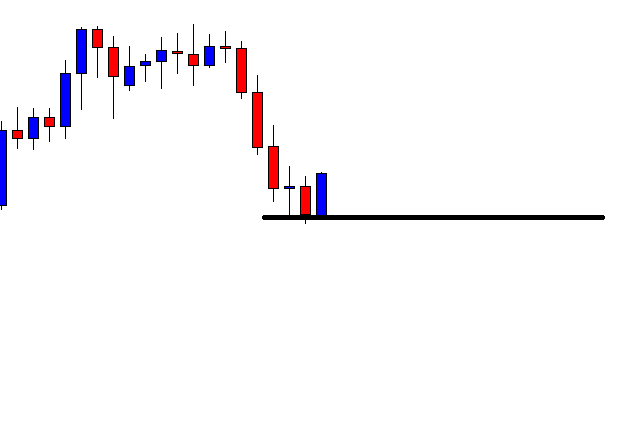
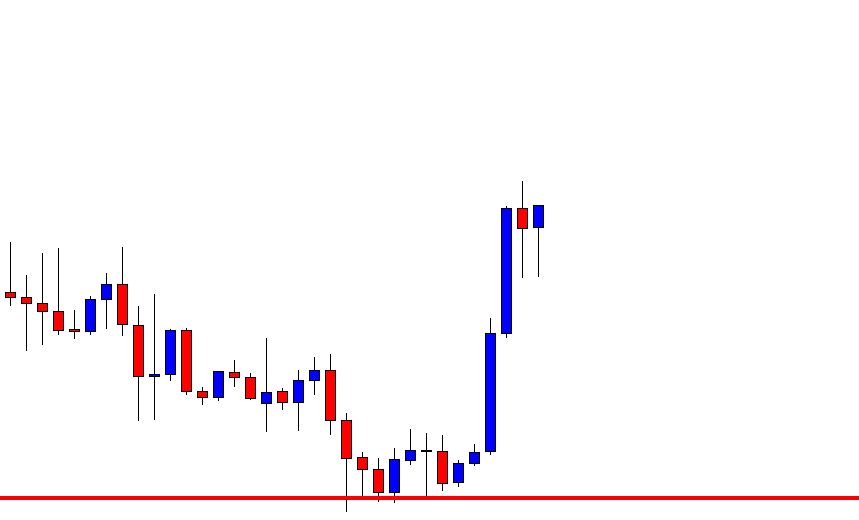
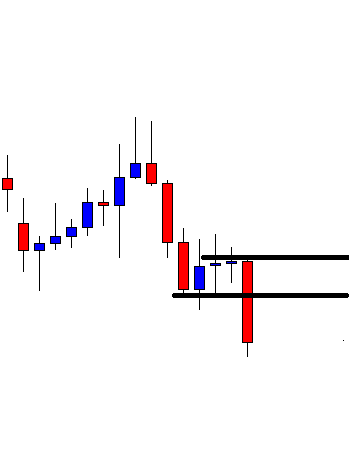
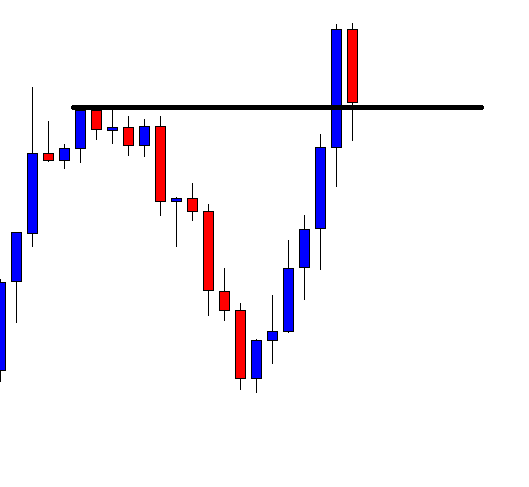
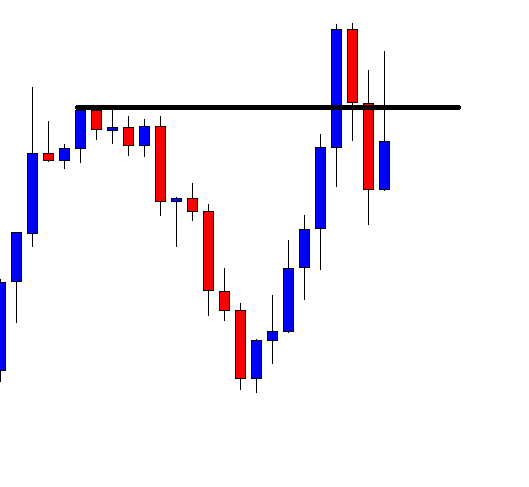
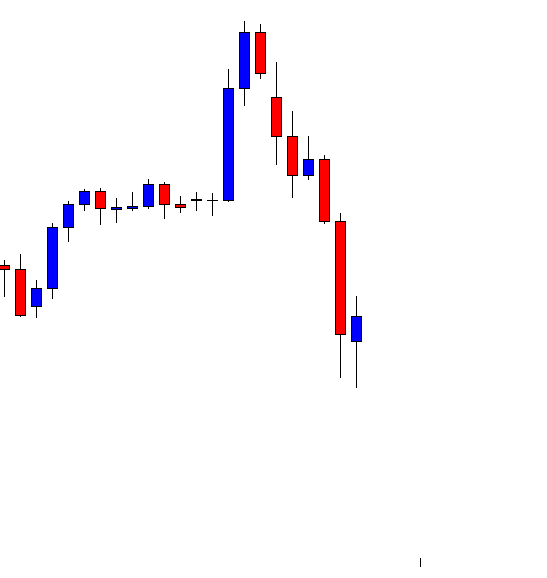
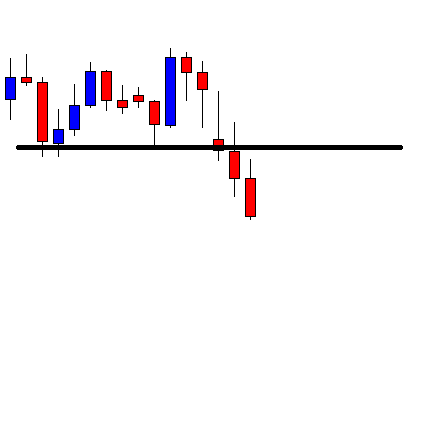
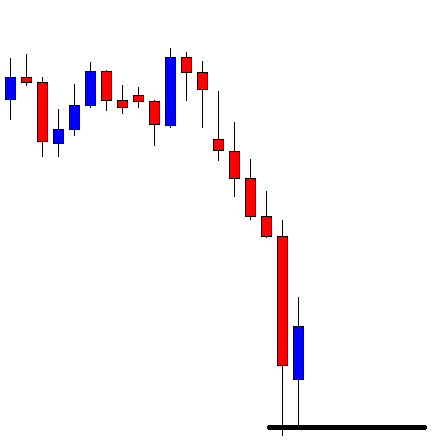
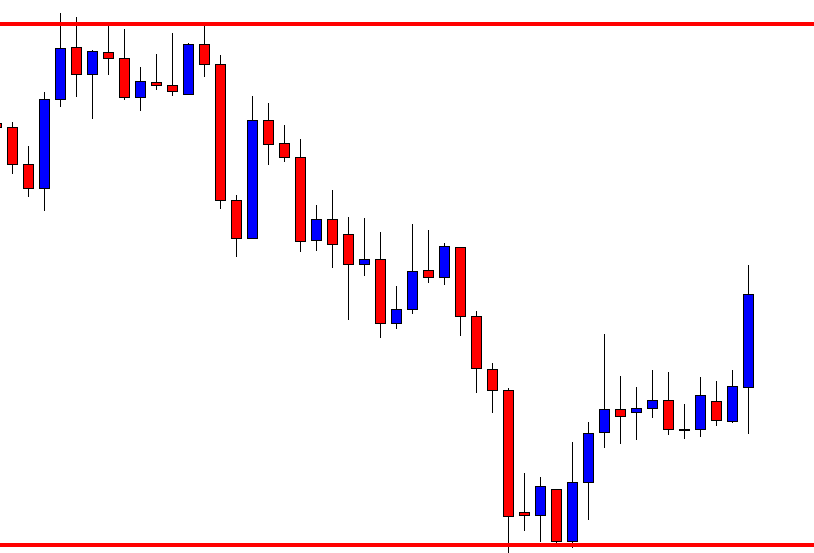
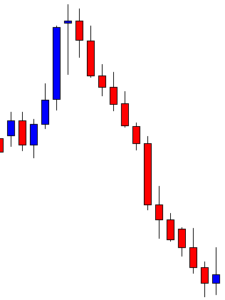
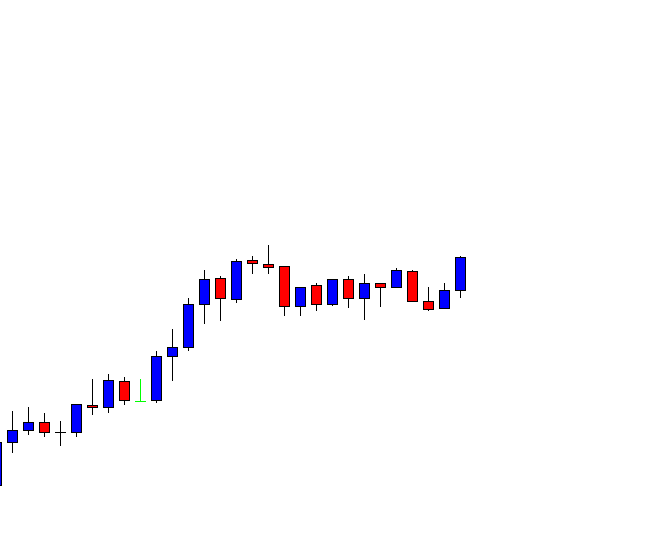
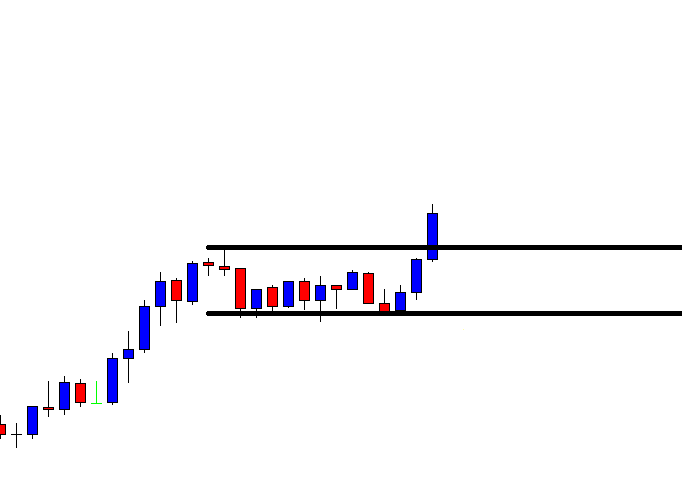
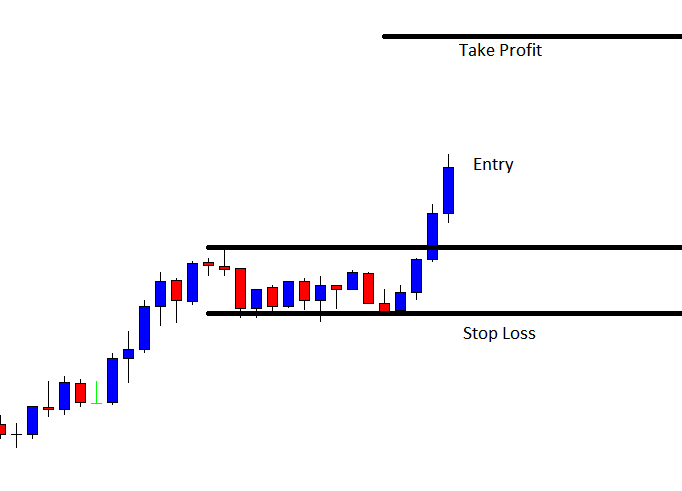
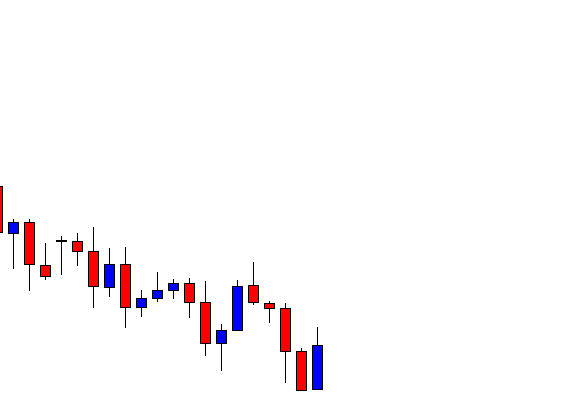
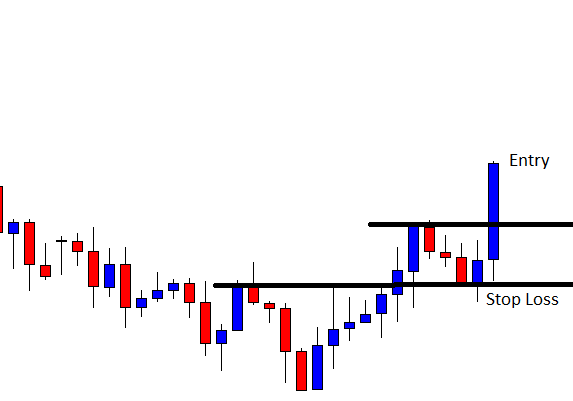
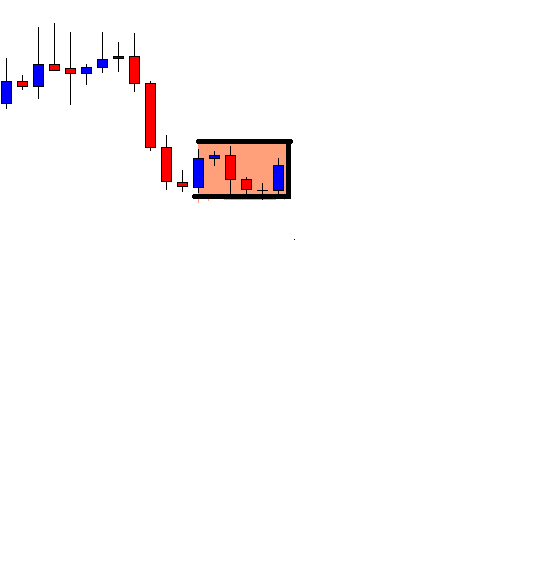
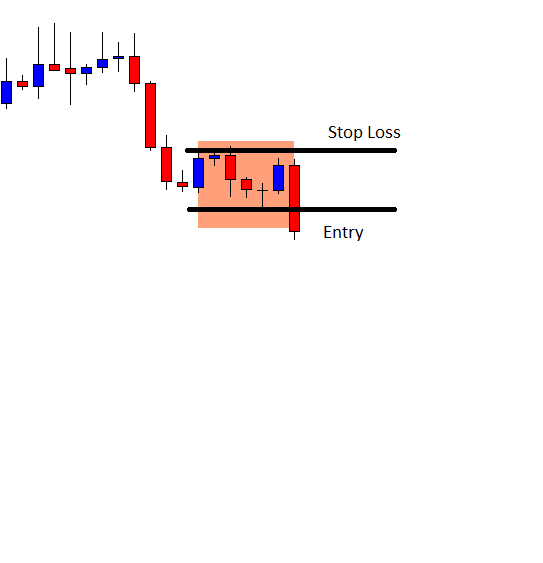
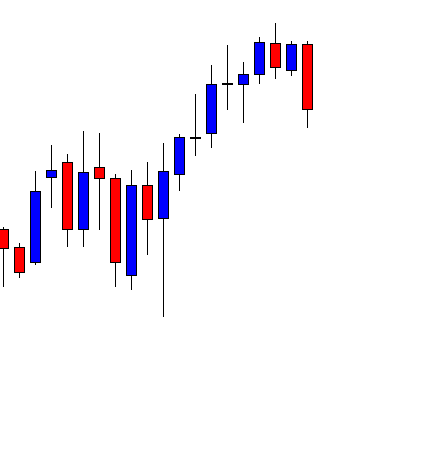
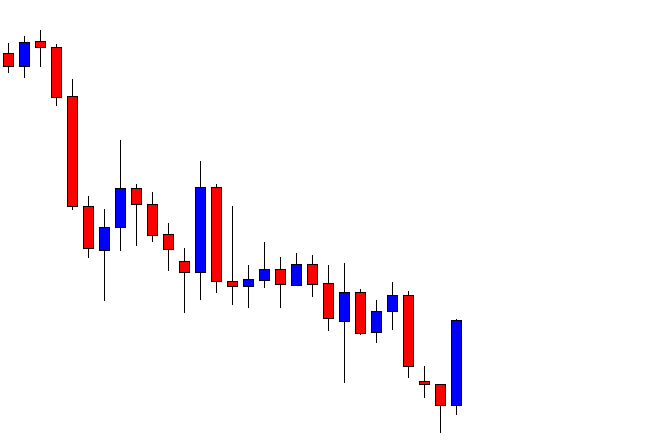
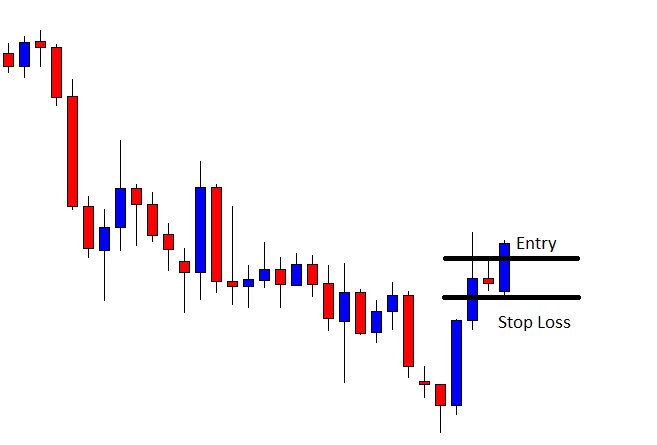
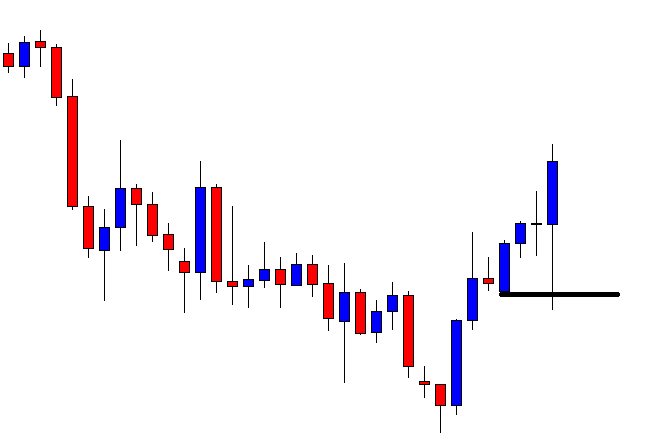
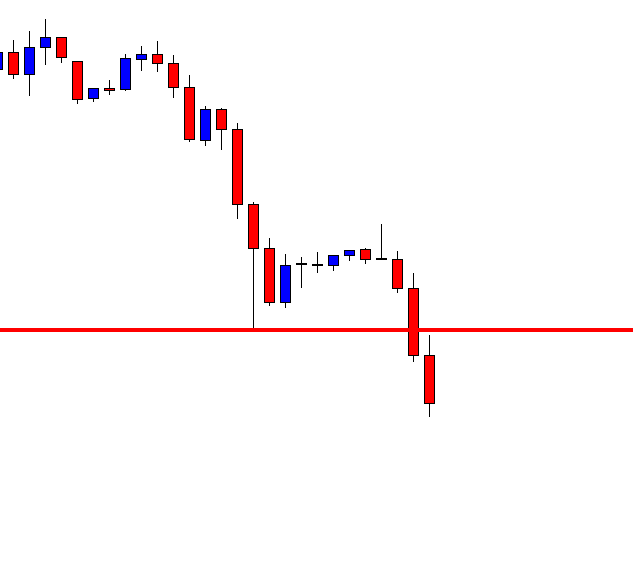
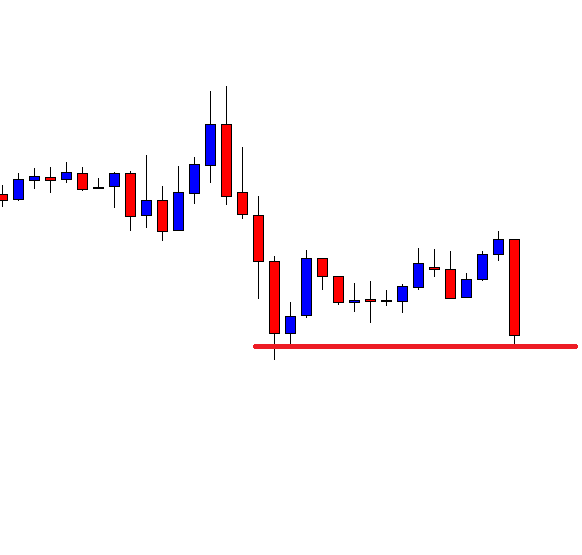
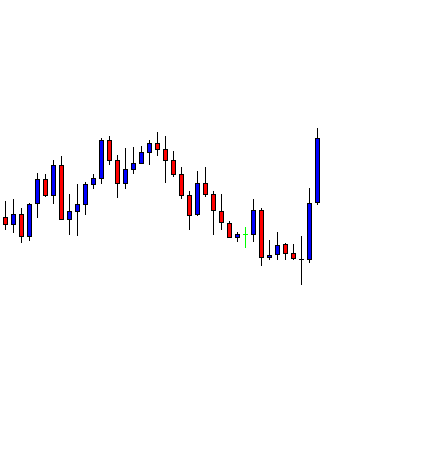
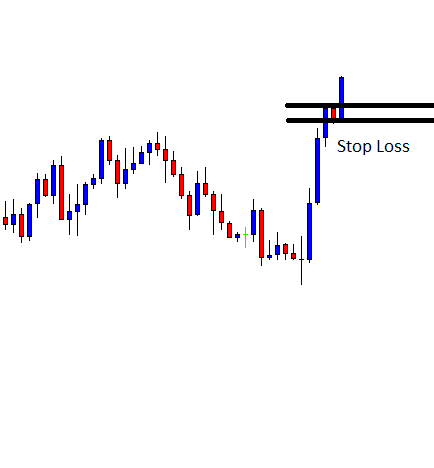
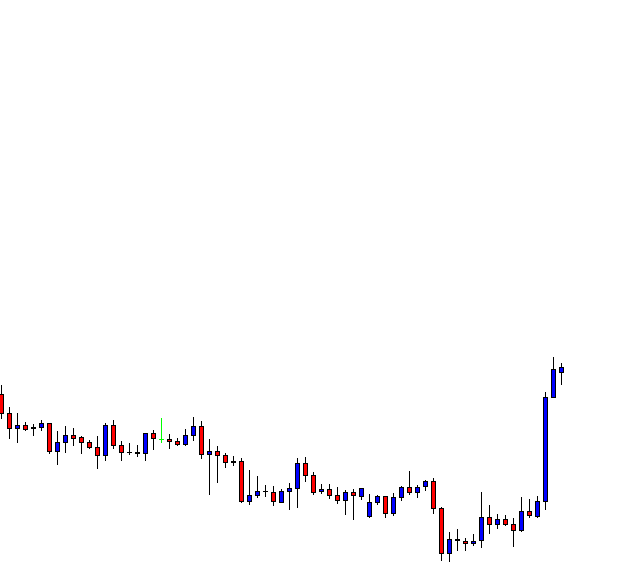
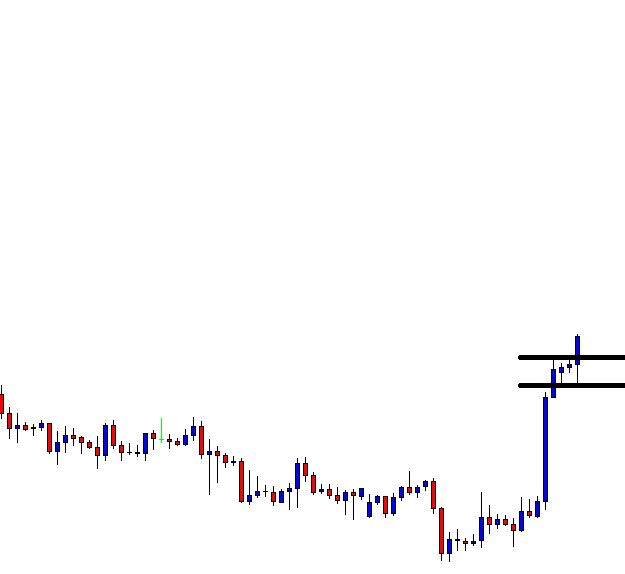
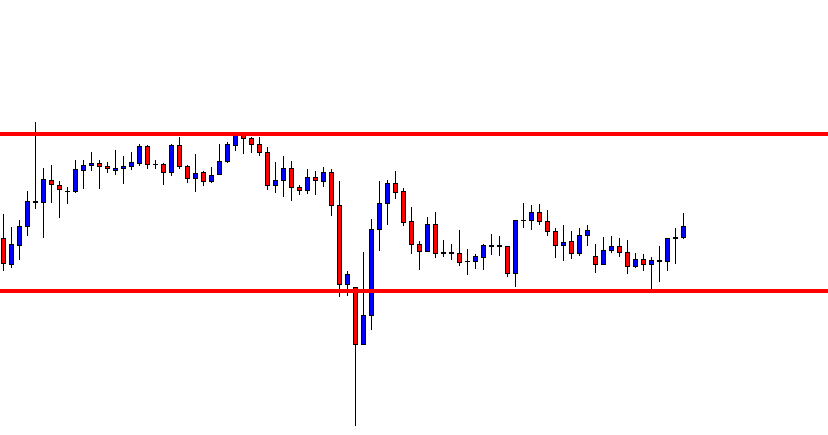
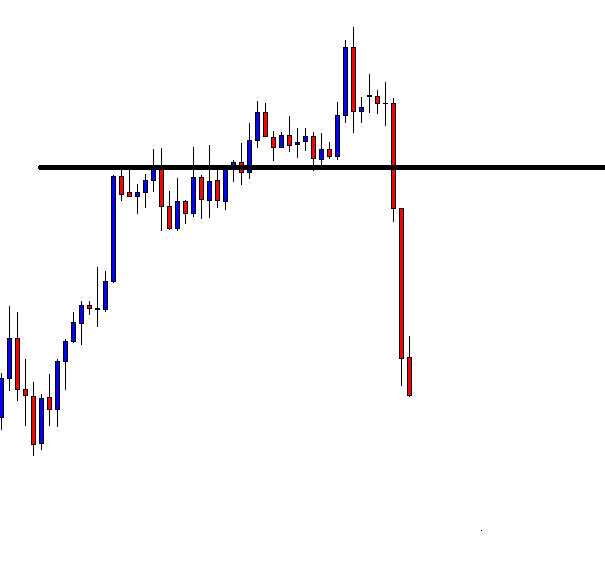
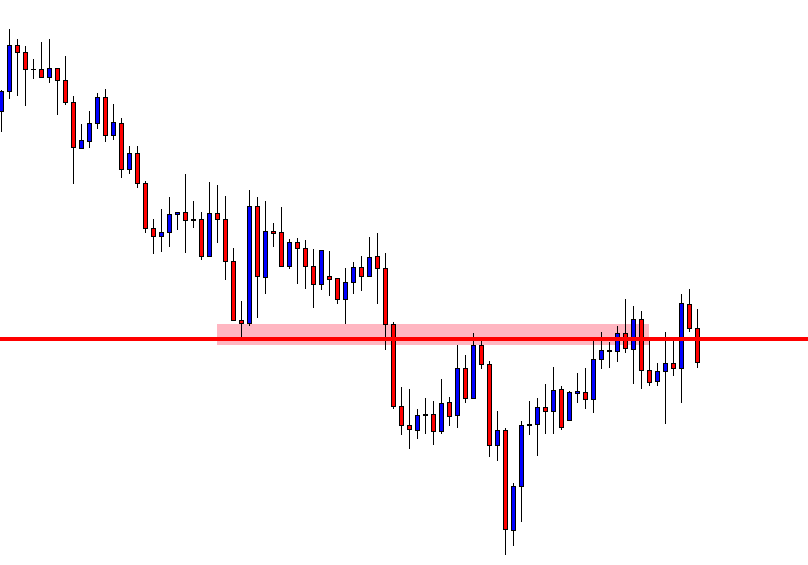
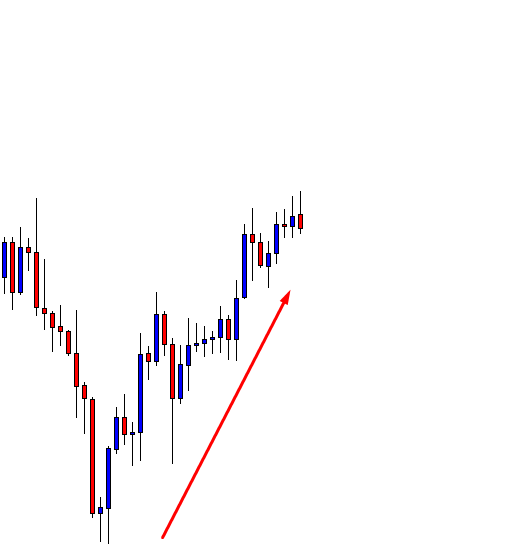
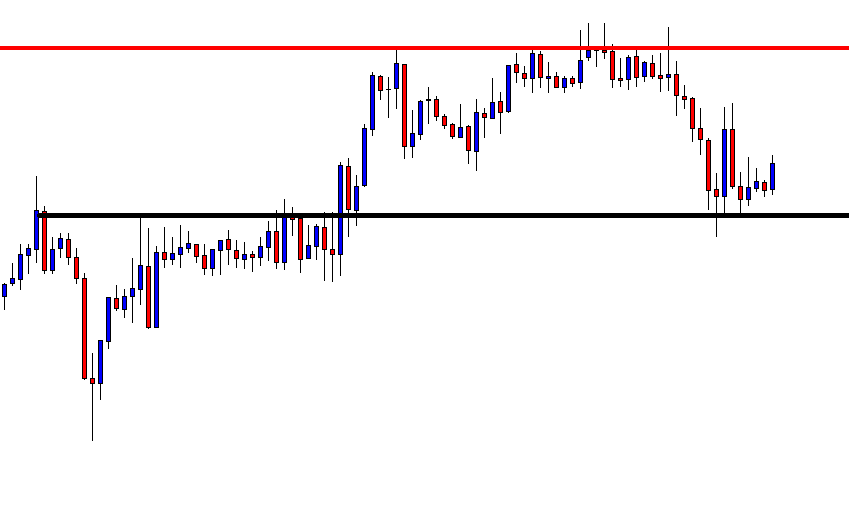
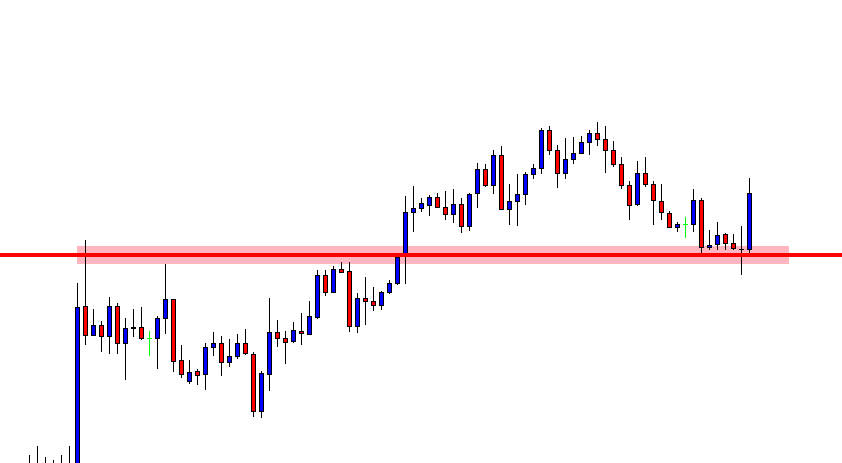
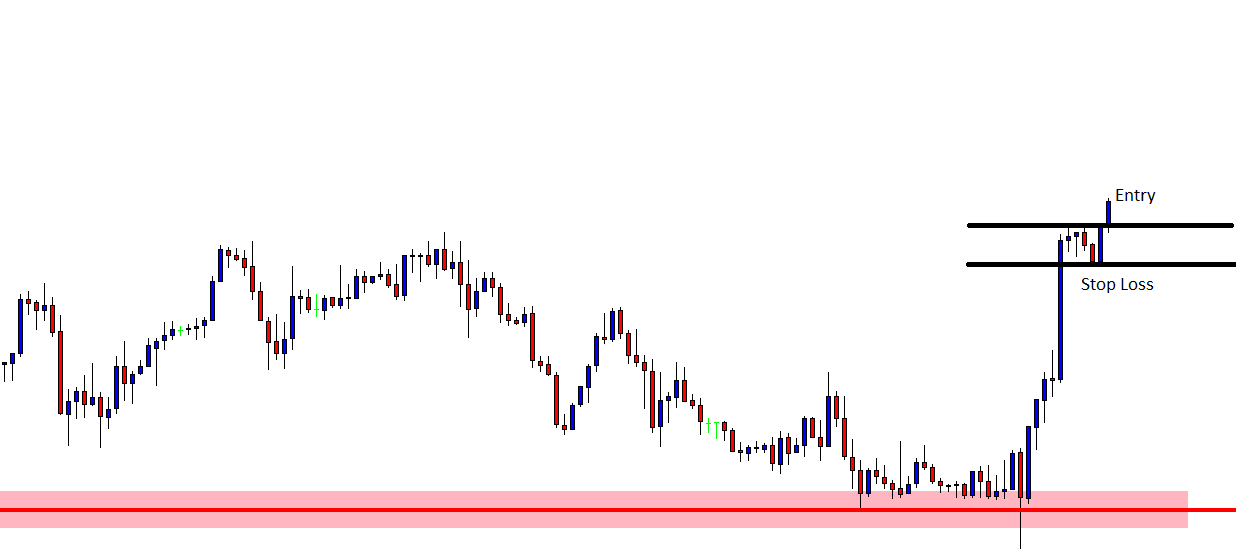
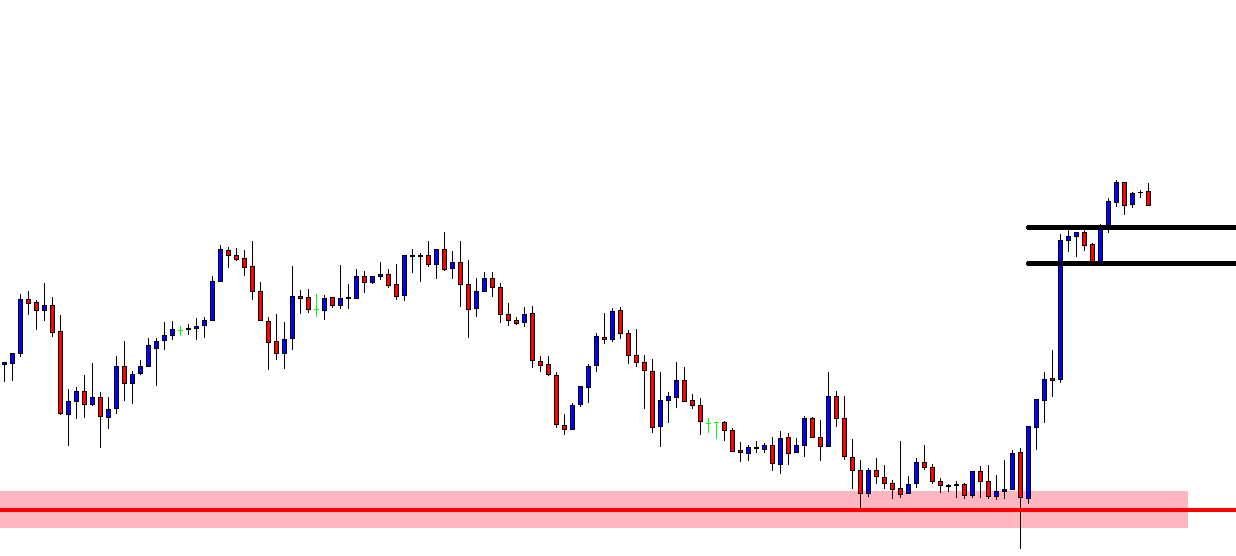
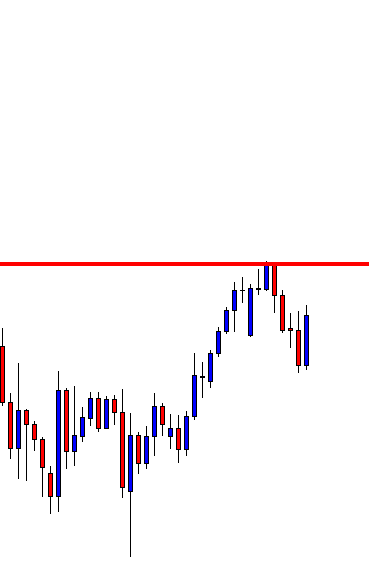
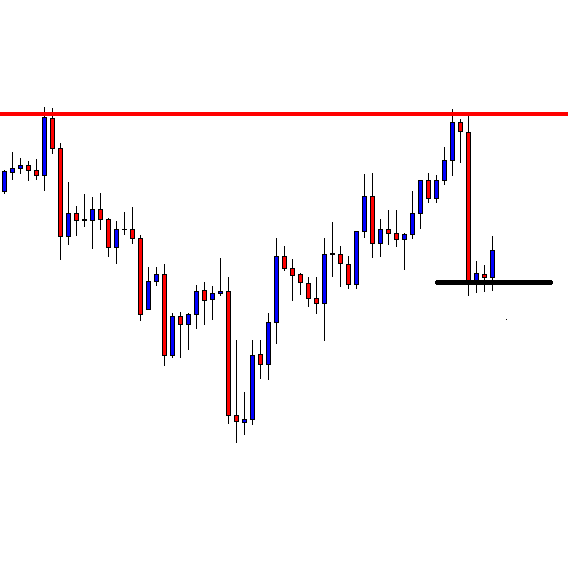
Below is the magnified image of the chart where we’re going to analyze the market. Initially, the market came down rolling until the bottom of the channel and began to hold down there. And the candle which held at the bottom turned out to be the NR7 day as it has the smallest range compared to the previous six days. This is an indication that the market (sellers) is slowing down. Later, the market blasts up north and breaks the high of the NR7 day. Therefore, now we can prepare to go long.

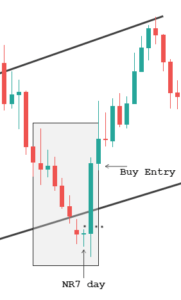
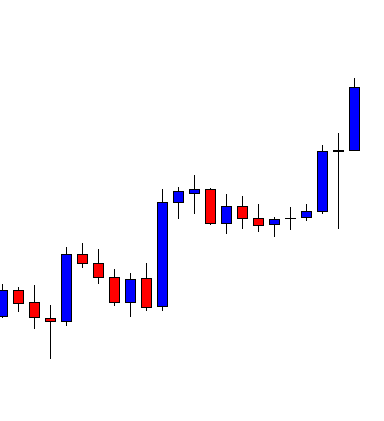
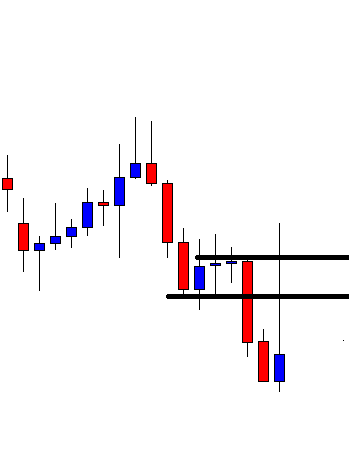
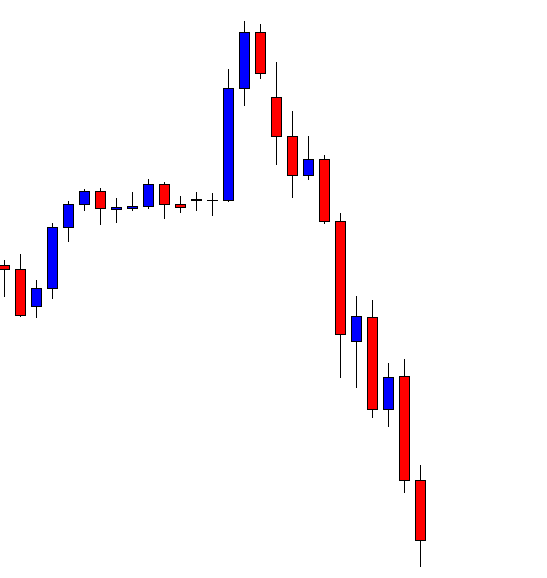
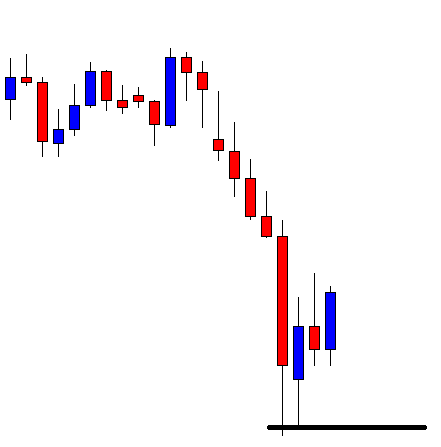
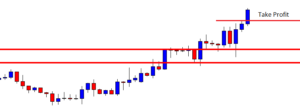
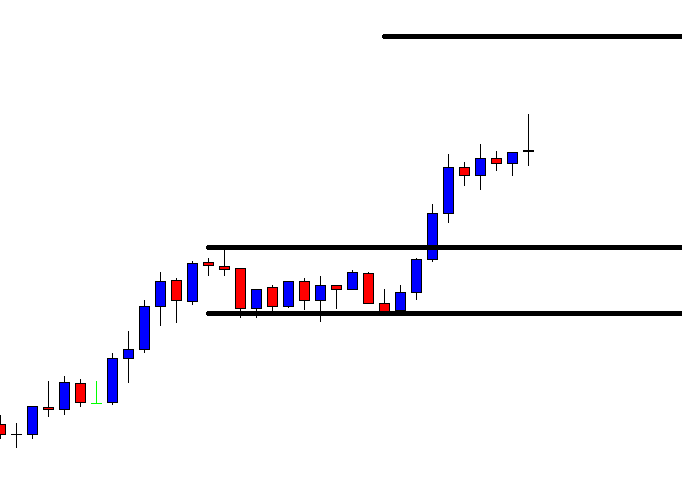
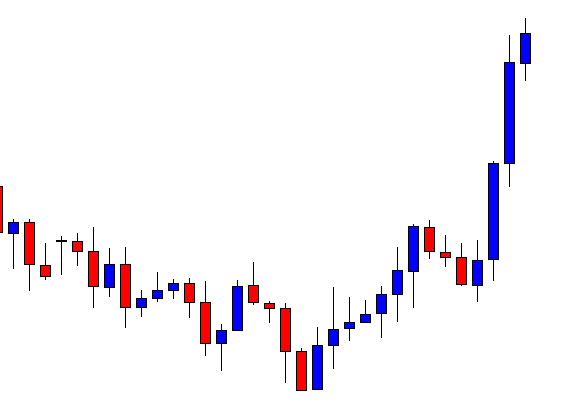
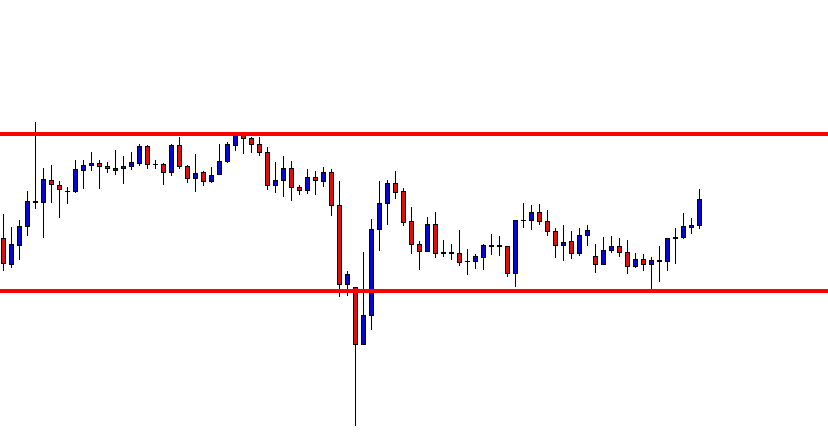
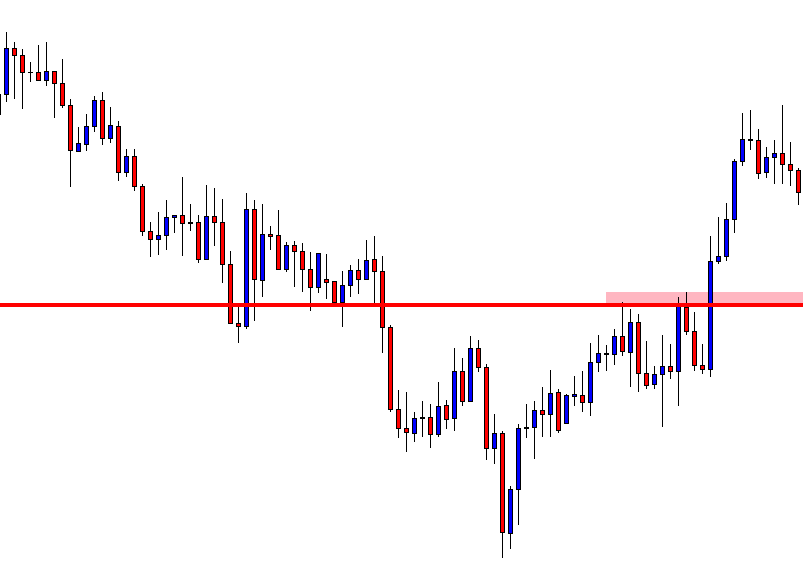
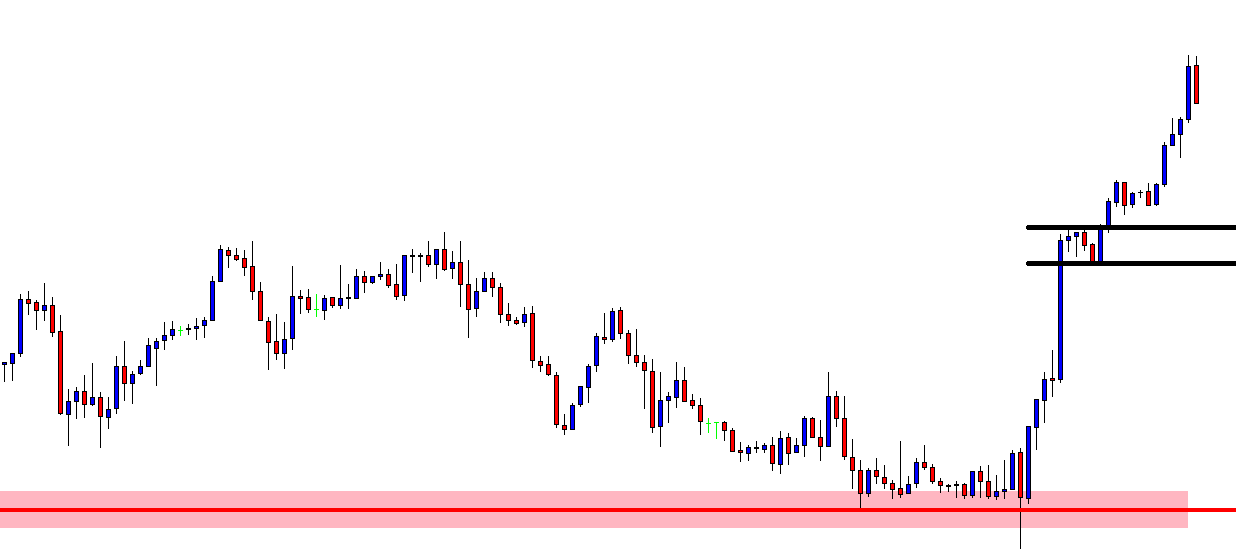
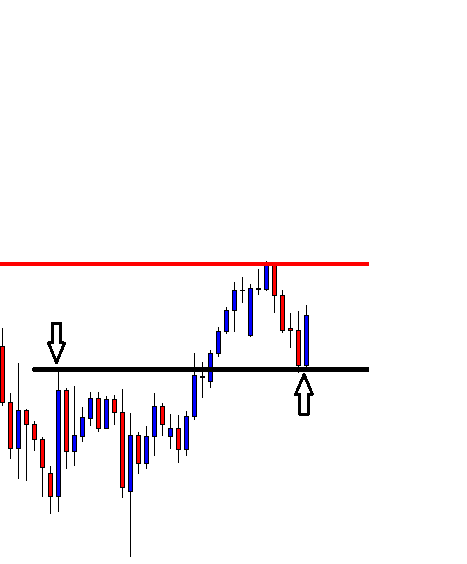
And as we can see, the trade performs exceptionally well. This is because the location was in favor of the NR7 day.

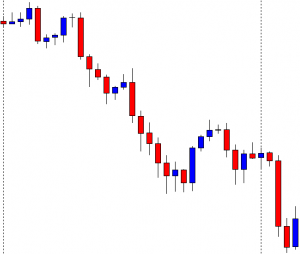
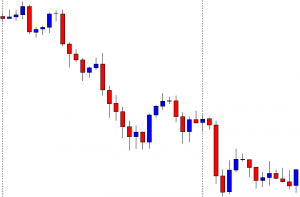
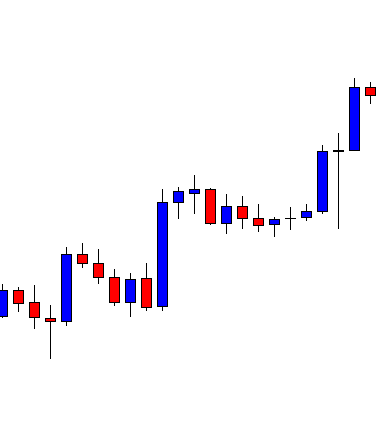
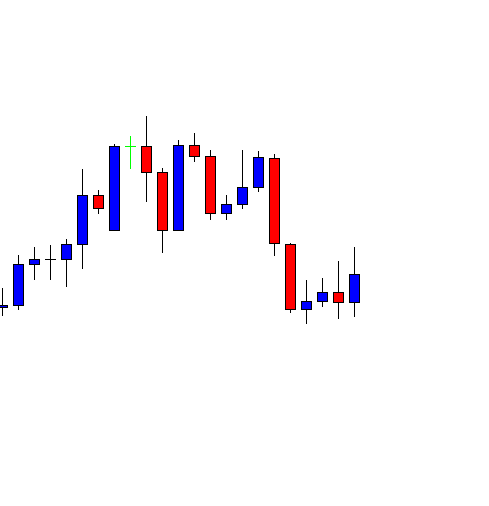
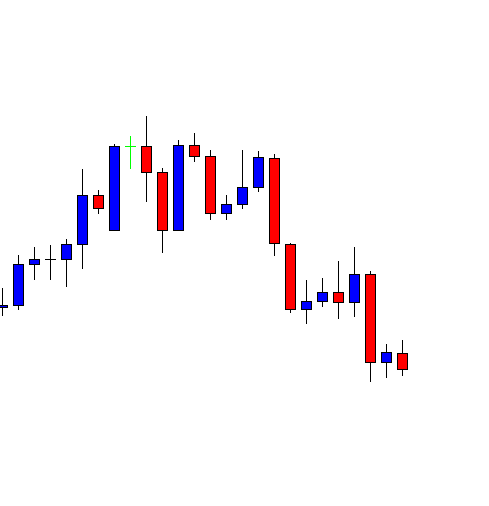
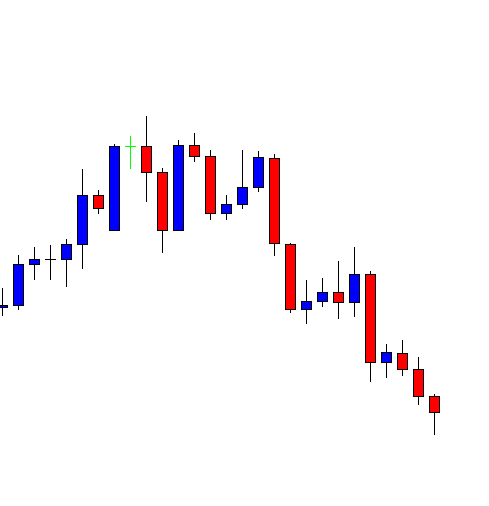
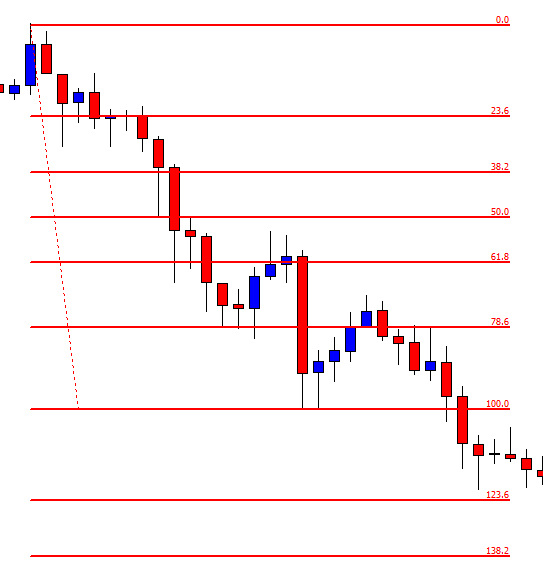
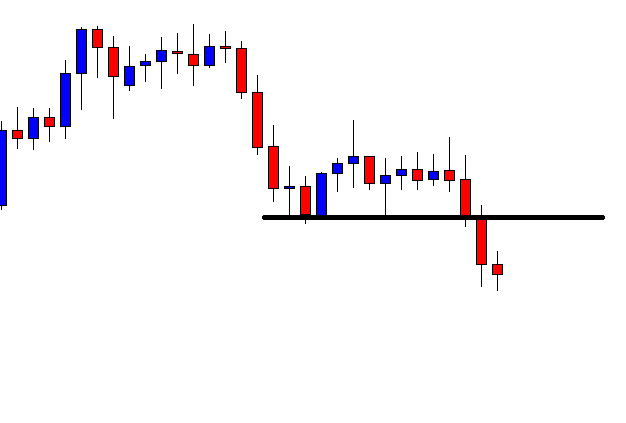
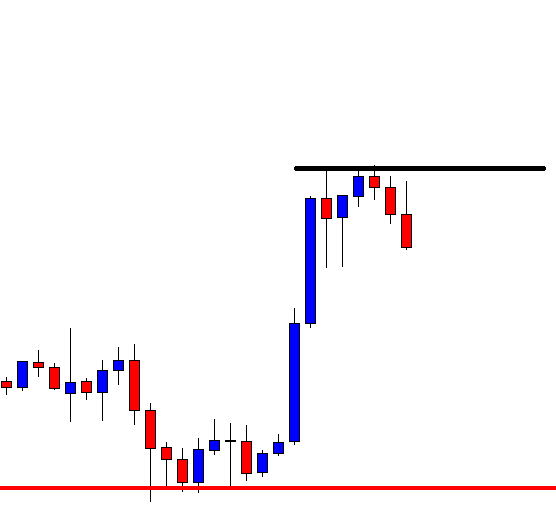
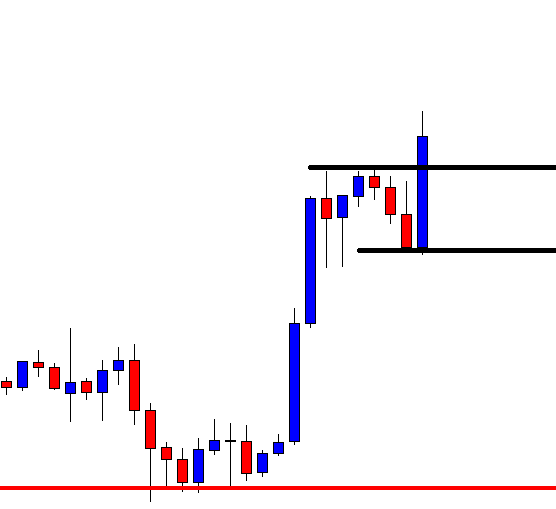
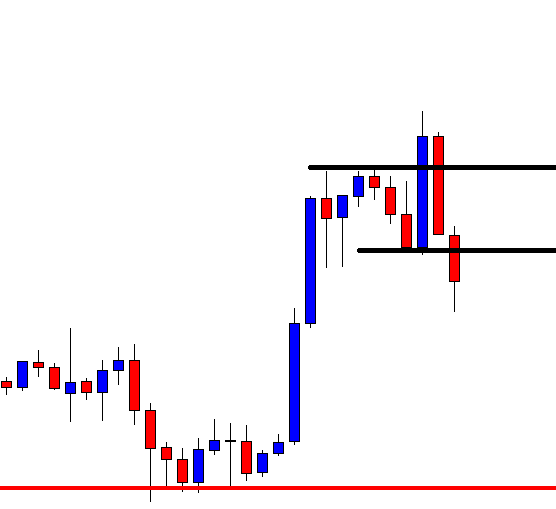
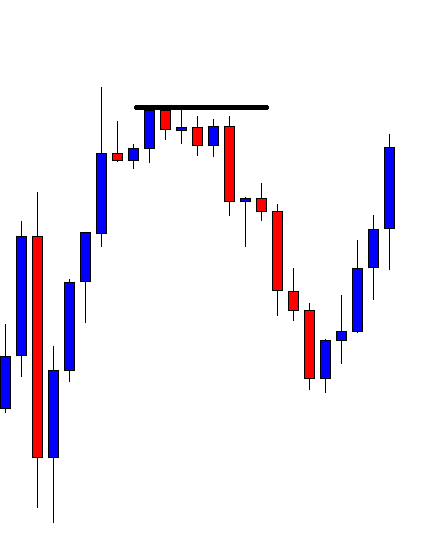
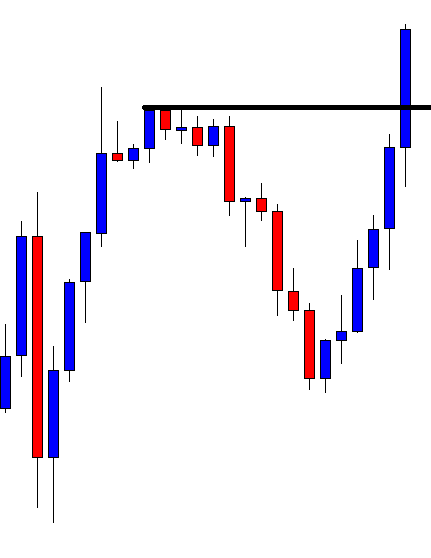
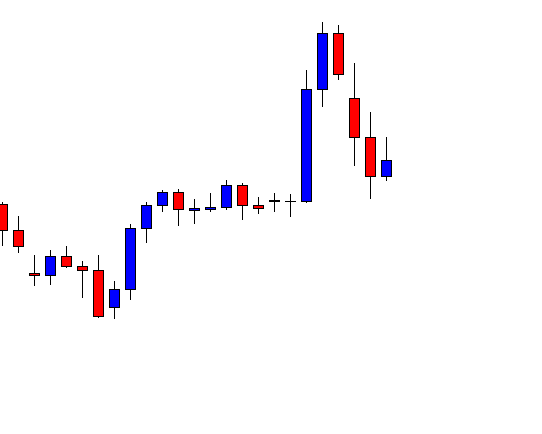
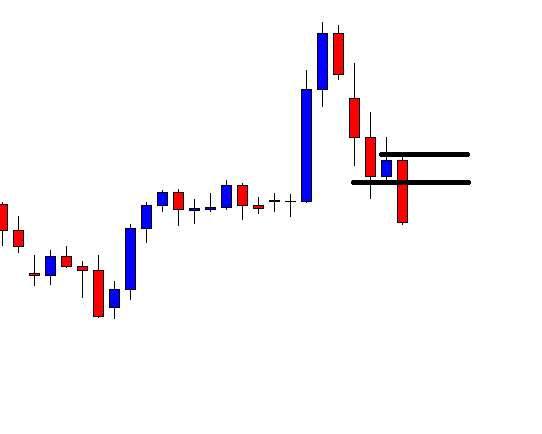
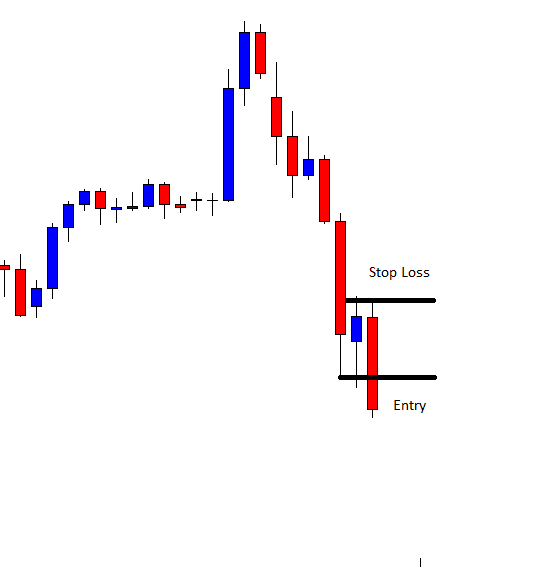
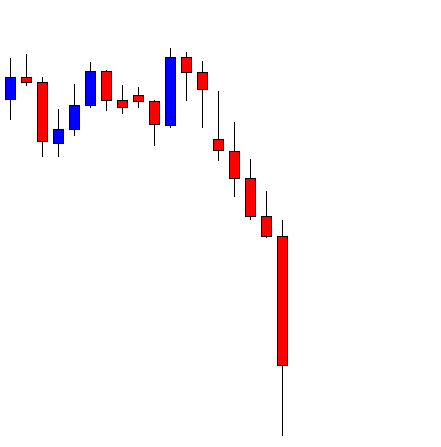
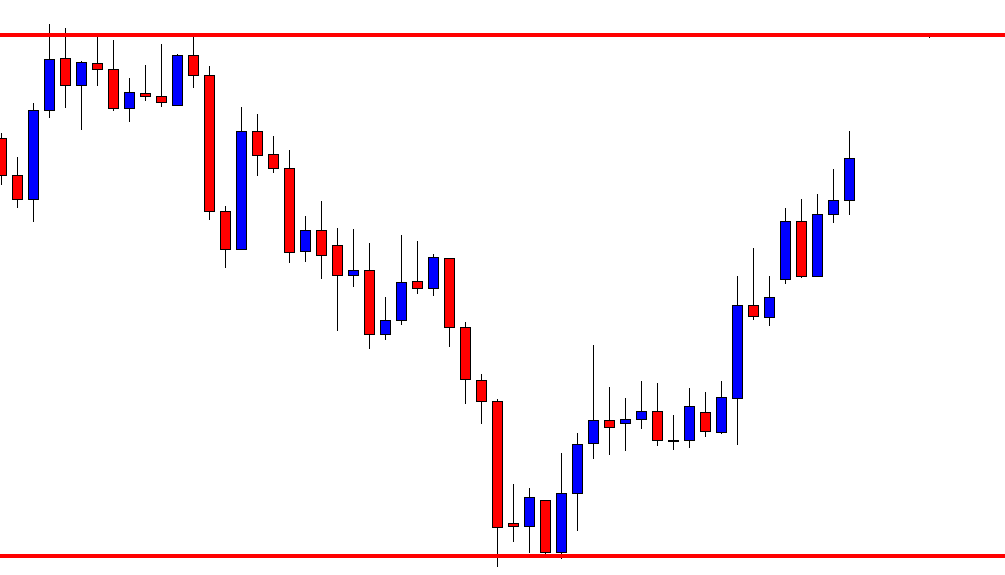
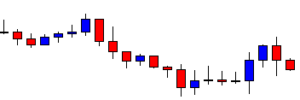
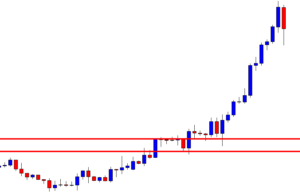
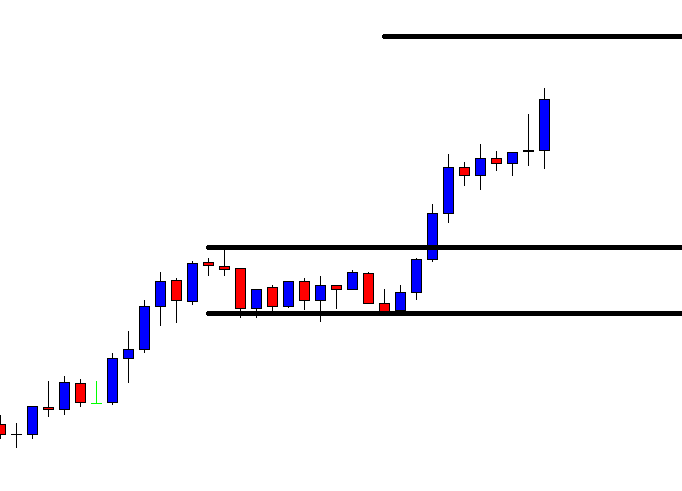
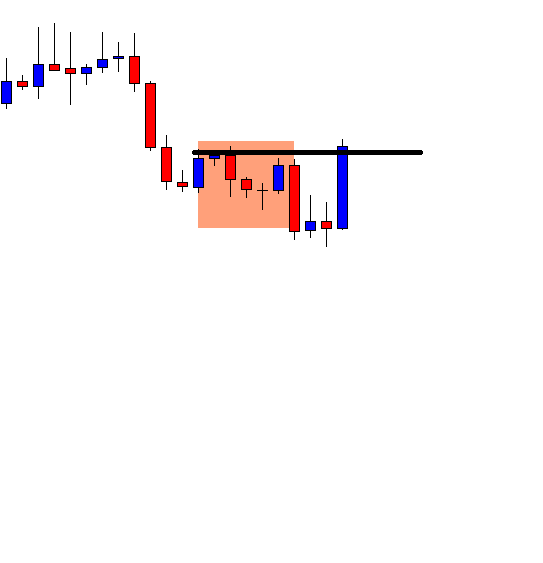
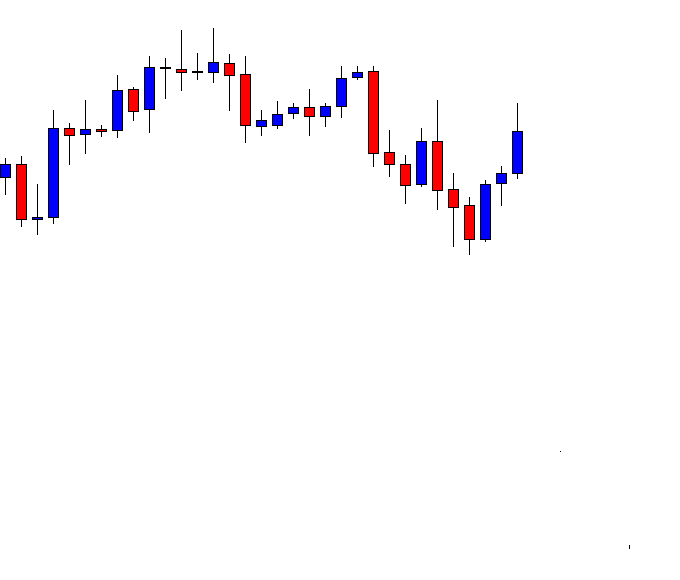
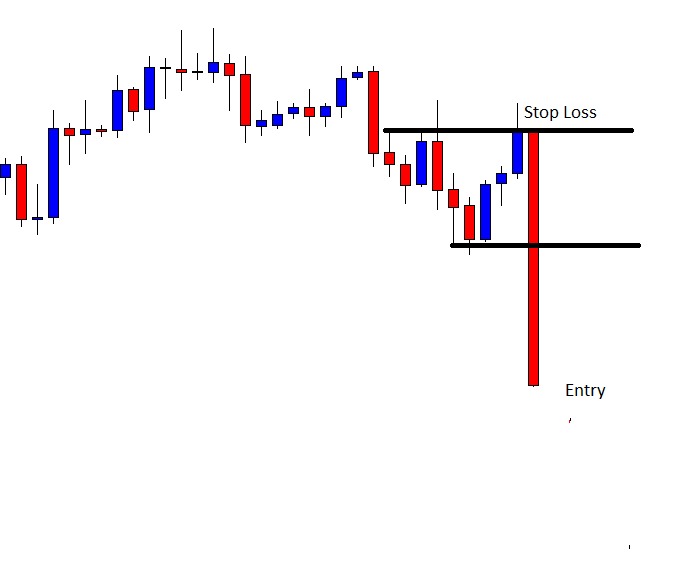
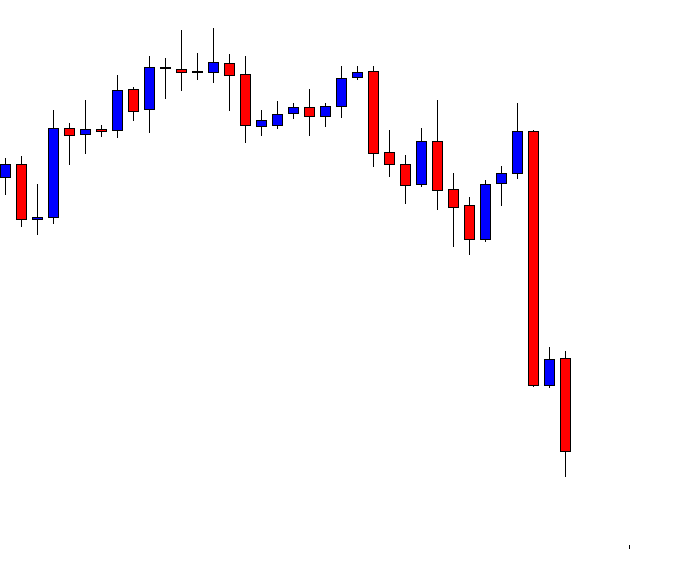
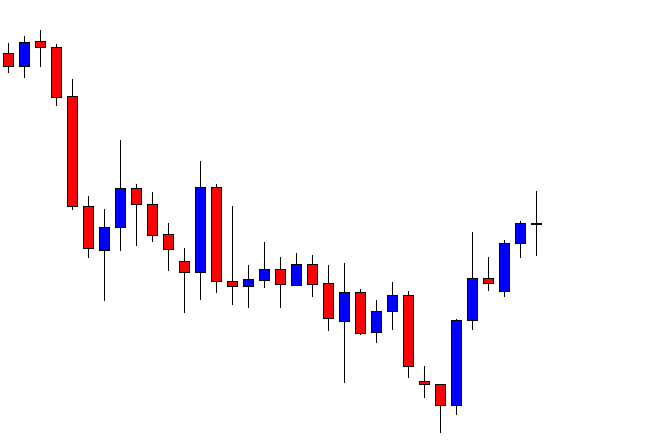
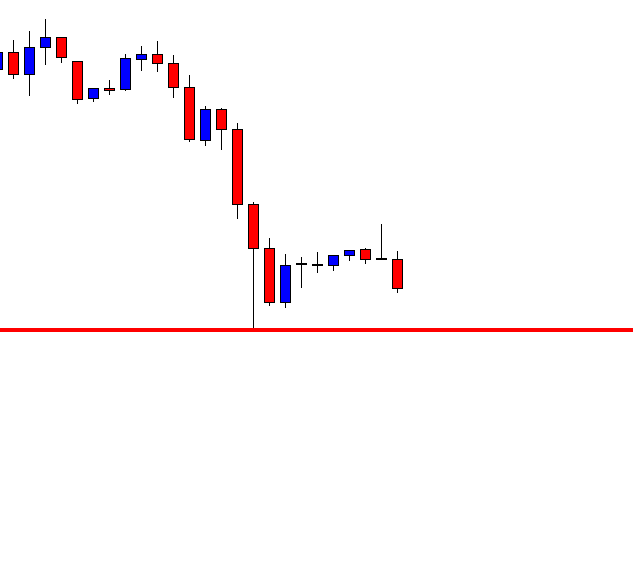
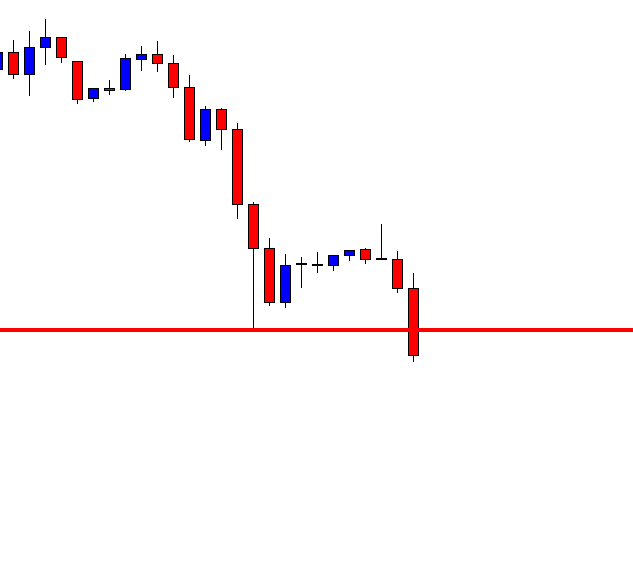
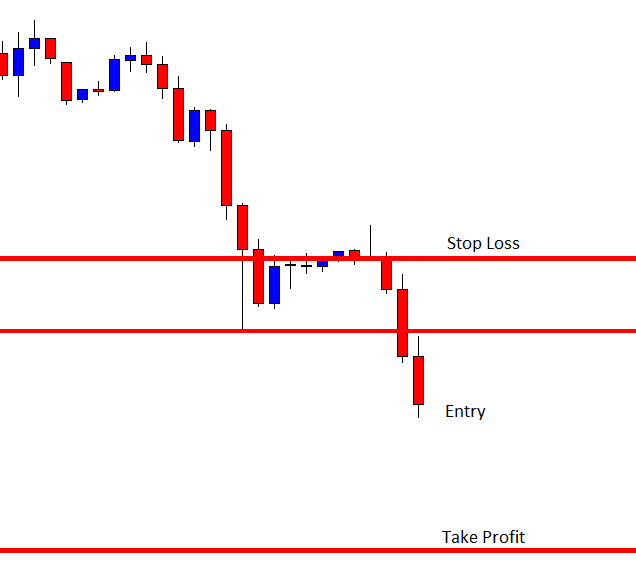
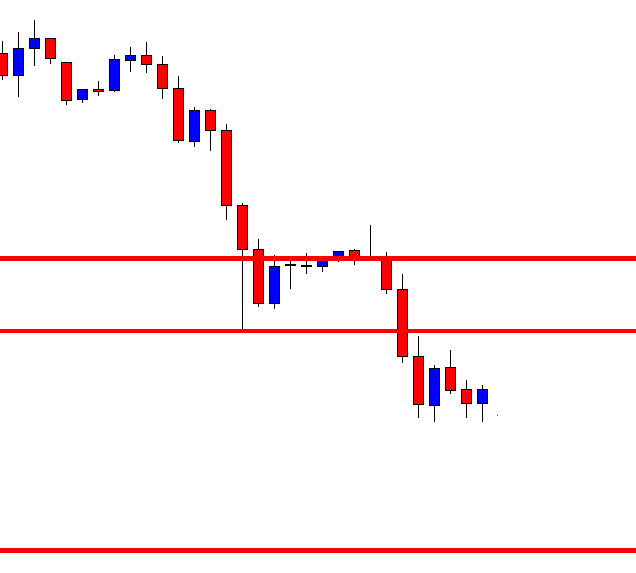
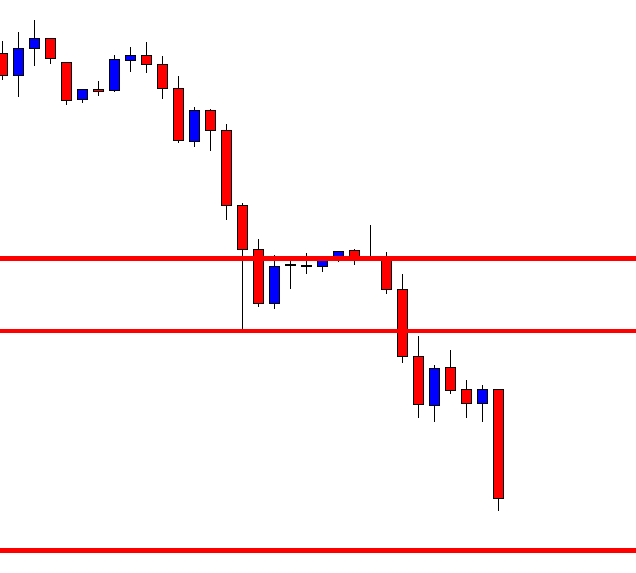
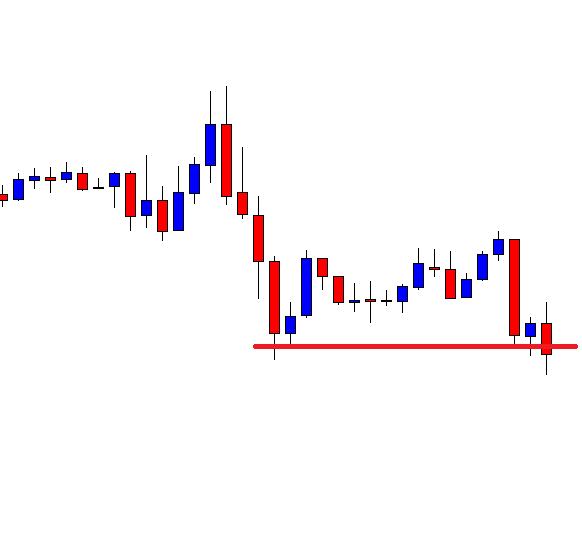
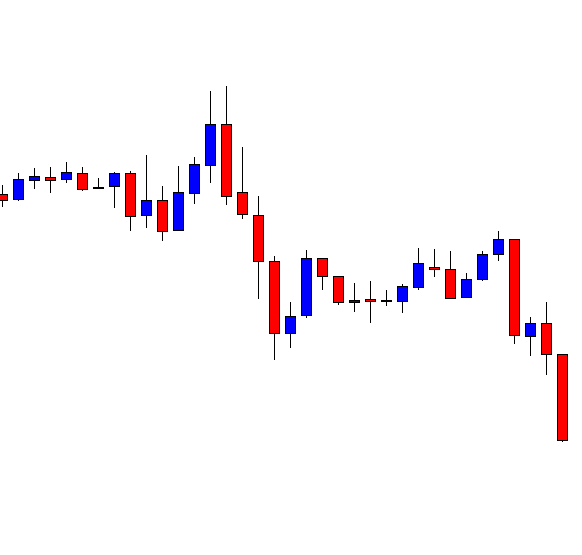
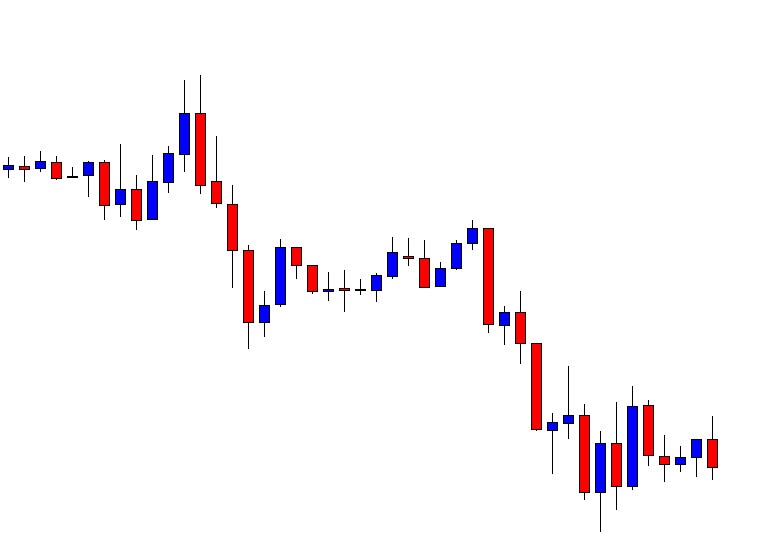
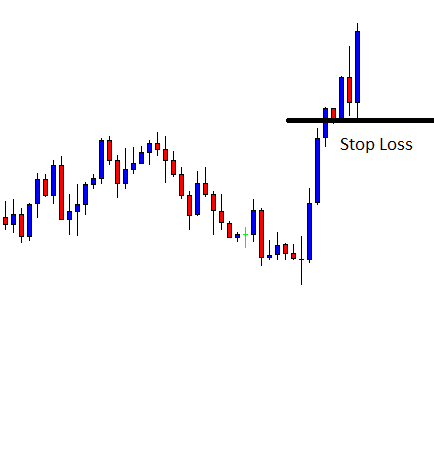
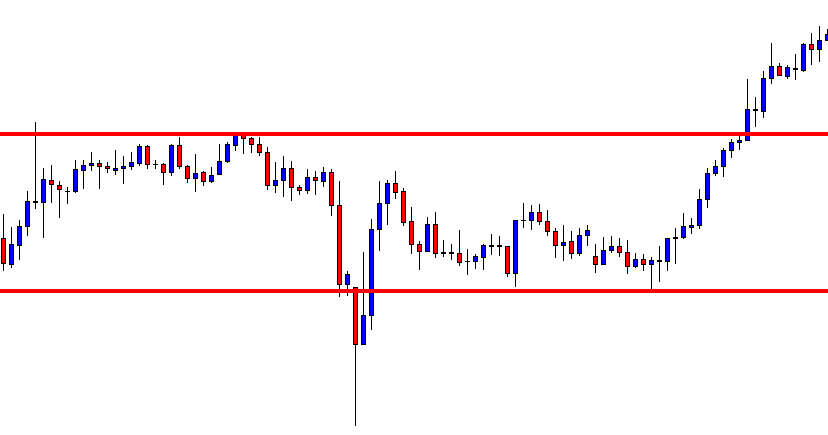
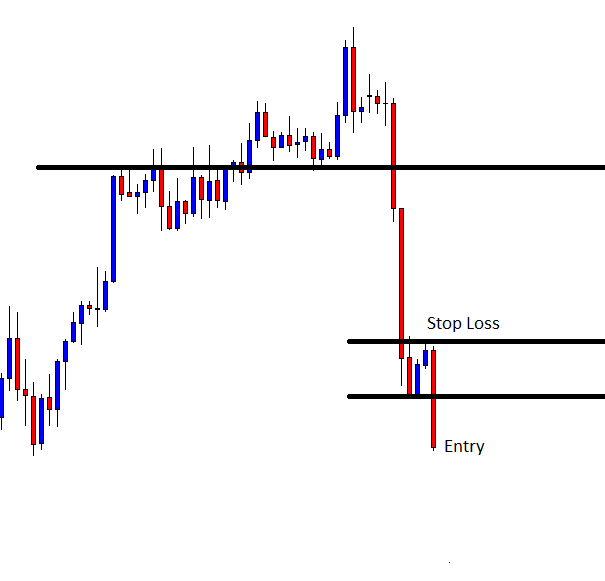
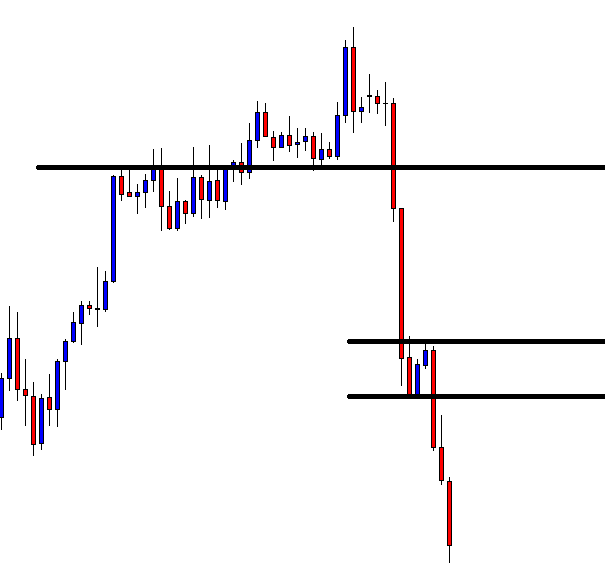
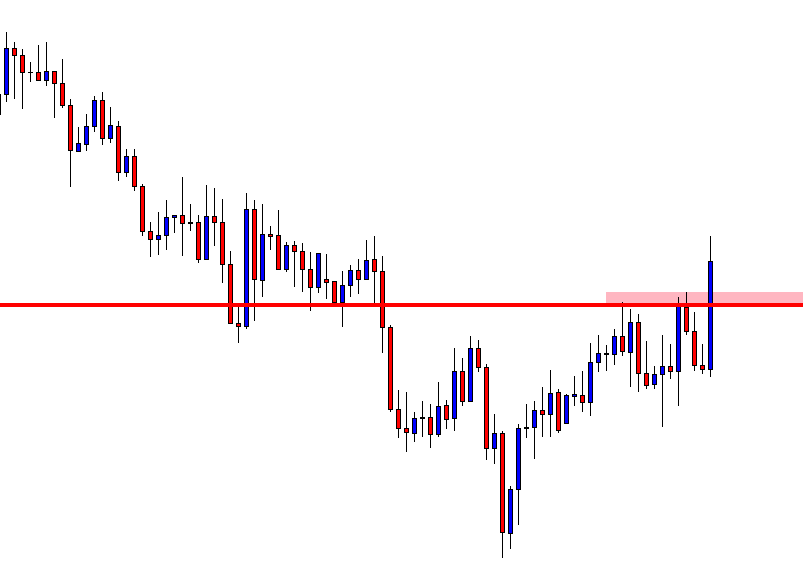
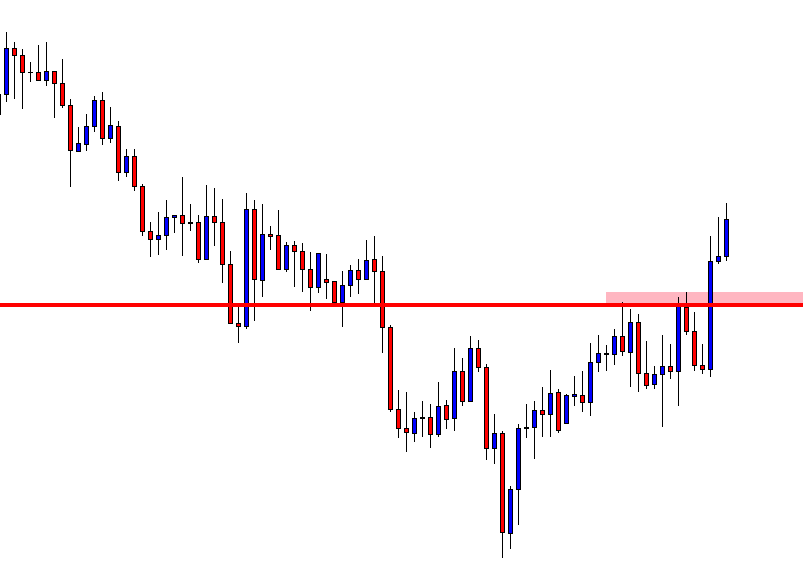
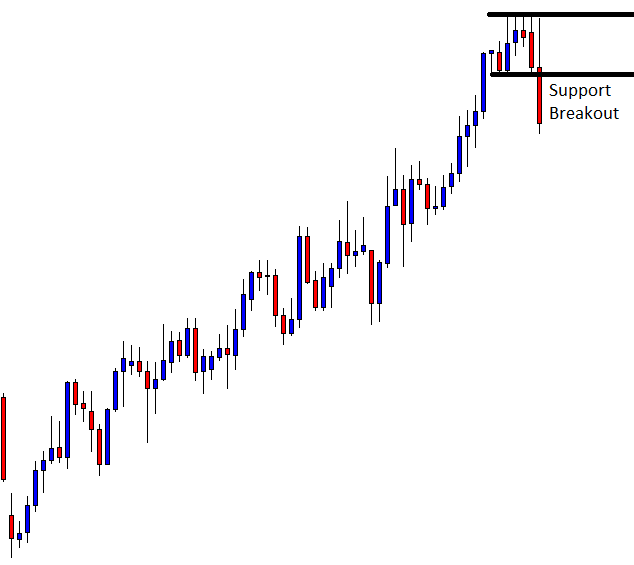
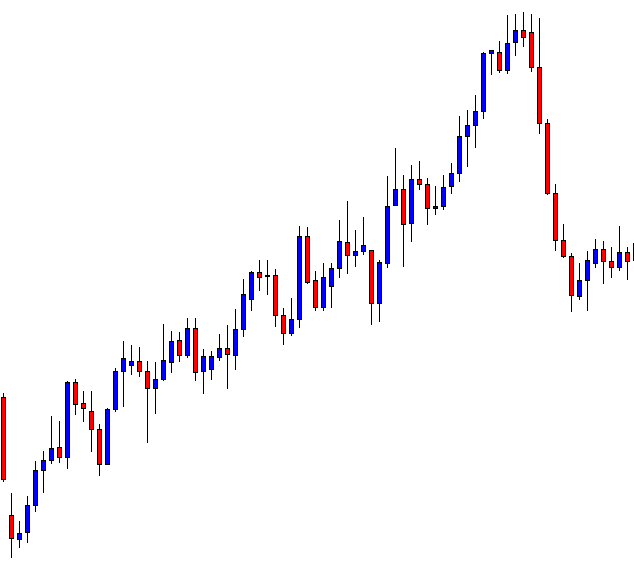
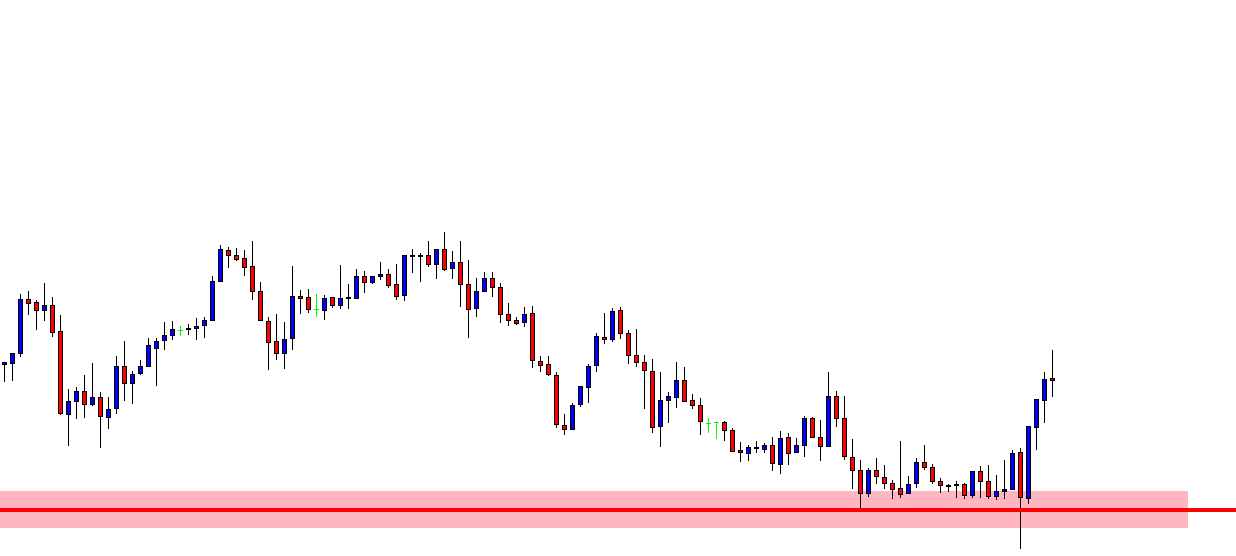
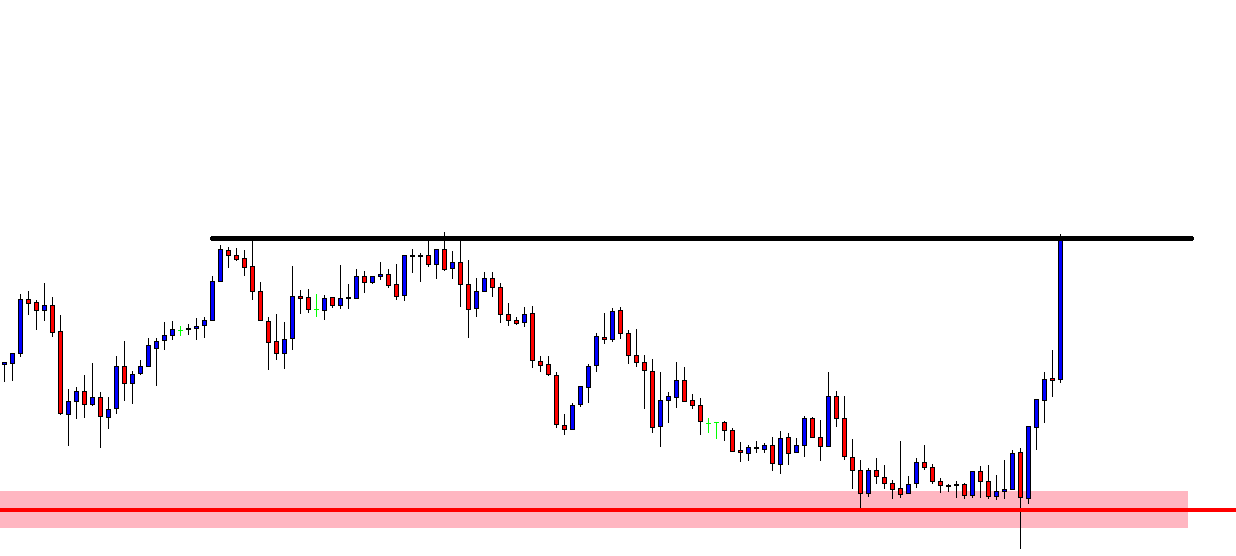
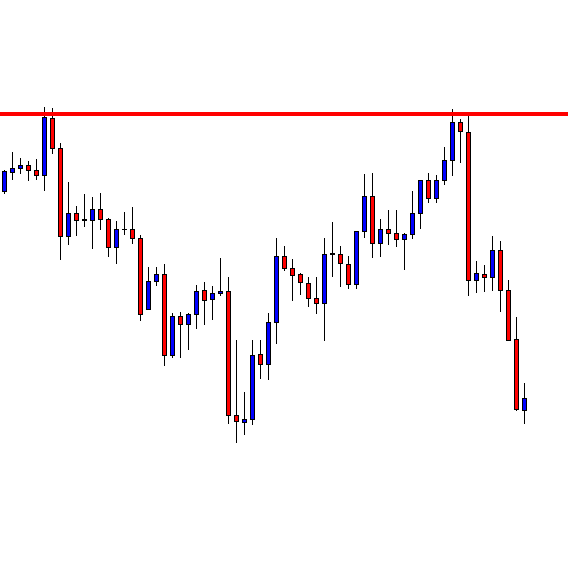
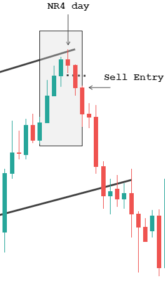
Continuing with the same chart, the market which was at the bottom of the channel now moves up to the top of the channel. During this up move, the market loses its momentum every step of the way and ends up giving us the NR4 day at the top of the Channel. Hence, once the price breaks below the low of the NR4 candle, we can go for the short sell. And as a result, the market does break through the NR4 day and heads down south.

Bottom line

Trading in the markets is not an easy task. There is no indicator, pattern, or strategy that can consistently work standalone. There are several other considerations that should be made before getting into a trade. For example, in the above trades, we saw how we combined the NR4/NR7 with the concept of channels and made a profit from them. Also, for any strategy, you trade, make sure that there is logical reasoning behind taking the trade. We hope you find this strategy informative. If you have any questions, please let us know in the comments below.

Categories
Forex Market Analysis

Consolidation In The Crypto Market

Cryptocurrencies have been stagnant and without many big moves to either side. The reason for that is the uncertainty abbot what happens on the tax day. We see less movement in crypto because, whoever wanted to pull their money out before tax date, did already, and we now see only people that hold.

BTC/USD consolidating

After the recent spike due to positive fundamental news (approval of the Muslim community), Bitcoin has its momentum slowed down. It made an attempt over an 8230 Fibonacci retracement line of resistance, but failed and is now consolidating and going slightly downwards, with decreasing volume. The price range is currently between the 50 EMA and 100 EMA on the 1h time frame.

crypto consolidation

NEO/USD bouncing off the resistance line

As we have concluded in the last analysis, neo was in a tough spot, and the most likely thing that would happen to it was the bounce off the red resistance line (shown in the graph). That is exactly what happened to it. This is a big deciding point for NEO, as indicators are “fighting” for the range and the direction of the next movement. RSI just left overbought, volume is declining, and there is a major resistance on the upside, but there are also both EMAs as support, they crossed each other, signaling a bull trend. I am more inclined towards the bear side for a bit until all the indicators get in line.

NEO/USD bouncing off the resistance line

XRP/USD forming a triangle pattern

XRP has recently spiked, after the big announcement that regarded cooperation with Apple. When that happened, XRP spiked up and broke the $0.63 resistance line, which has now become support. It bounced off of it a couple of times, forming a perfect triangle pattern, with the expected breakout from the pattern around the 19th or 20th of April. It will most likely be an upwards move, but it can’t be said with certainty. EMAs and the support line form a “defense” against triangle patter break downwards, but ultimately, people will decide.

XRP/USD forming a triangle pattern

Final word

Markets are mostly consolidating since these are uncertain times fundamentally. Everyone is waiting for a catalyst, for a reason to re-enter the market. The next few days will determine the overall short-term trend of the market, so watch out for the swing trades for now. One thing is good, and that is the increasing volume in the general crypto market.

© Forex.Academy