Categories
Forex Price-Action Strategies

Price Action Trading: Weekend and Partial Profit Taking

Partial profit taking is an option to be safe with our investment. It provides less reward to some extent. However, for the Forex traders, it is a great way to make sure that they cash in some profit or lose less money in a particular trade. In today’s lesson, we are going to demonstrate an example of a trade setup offering an entry four hours before the market closes. Traders have only one H4 candle to hit their target, or they would have to carry the trade during the weekend. Let us find out what we should do in such a situation

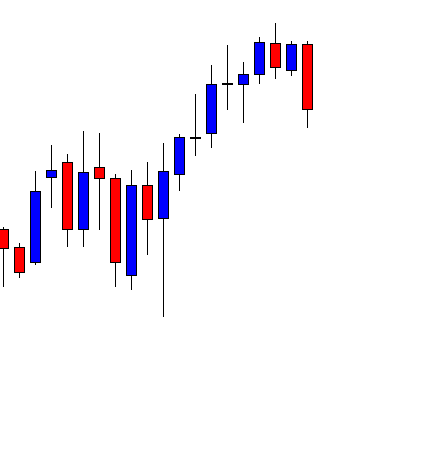
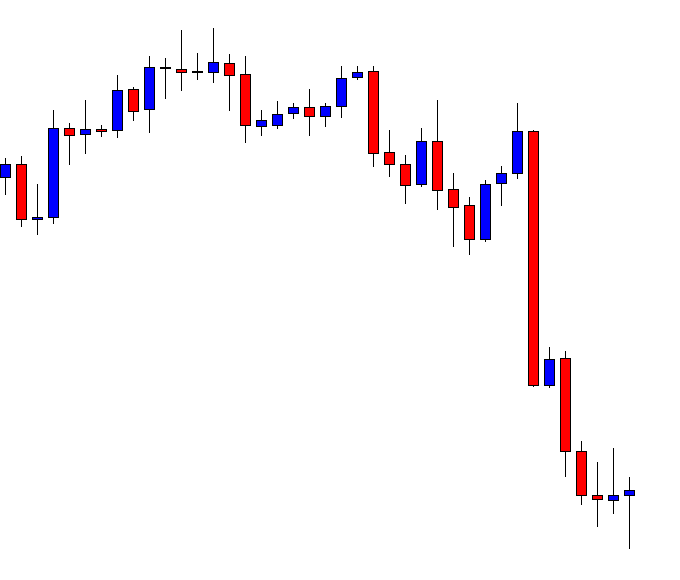
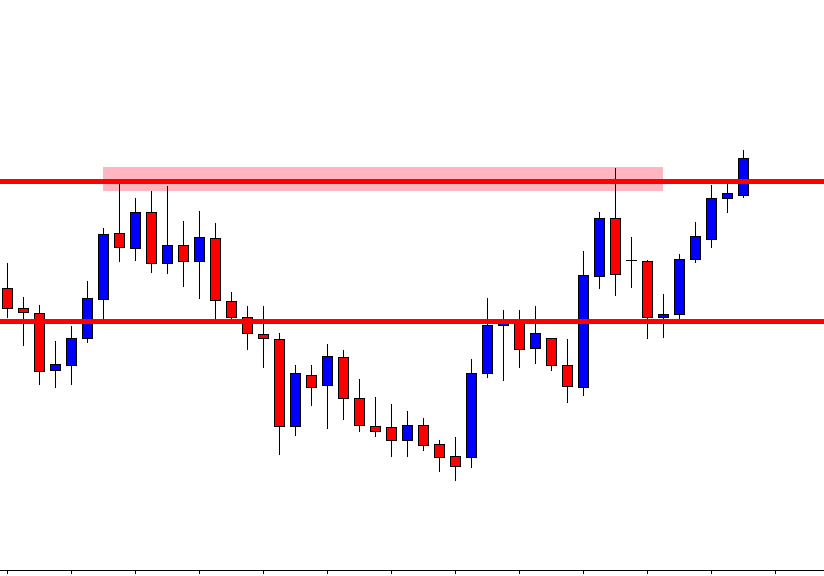
This is an H4 chart. The price heads towards the South at a moderate pace. The last candle comes out as a bullish engulfing candle. This may work as a bullish reversal for the minor charts’ traders. However, the H4 breakout sellers are to wait for the chart to produce a bearish engulfing candle closing below consolidation support to offer them a short entry.

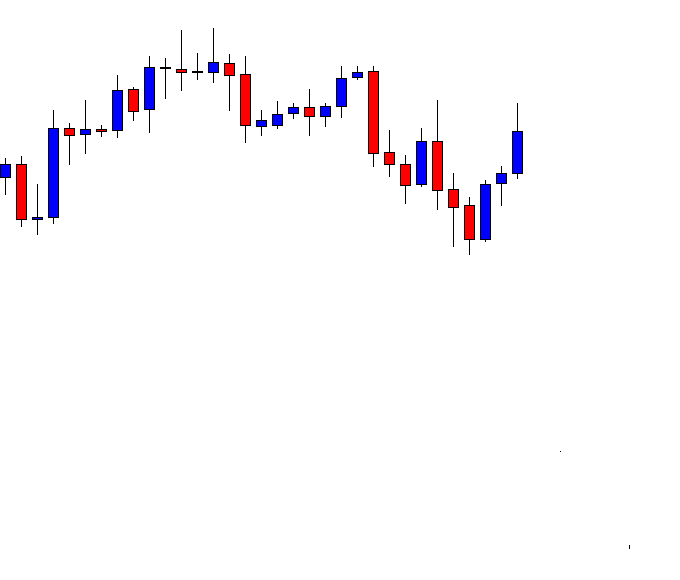
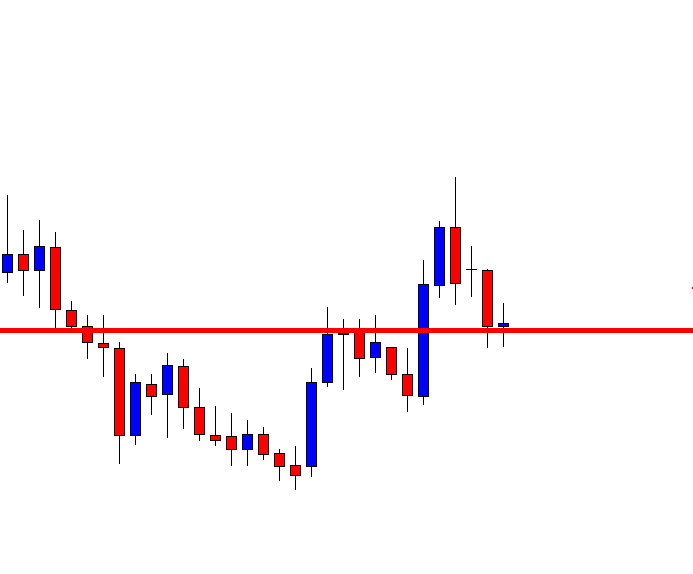
The price makes a bearish breakout. However, the H4 breakout sellers do not wait for such a breakout. The last candle comes out as a bearish engulfing candle, but the consolidation is shallow. Thus, the sellers may skip taking this entry as well.

Again, the price consolidates and makes another bearish move. This time it does not make any bearish breakout. The chart may end up producing a double bottom here. It is a long way to go. Meanwhile, the sellers must wait.

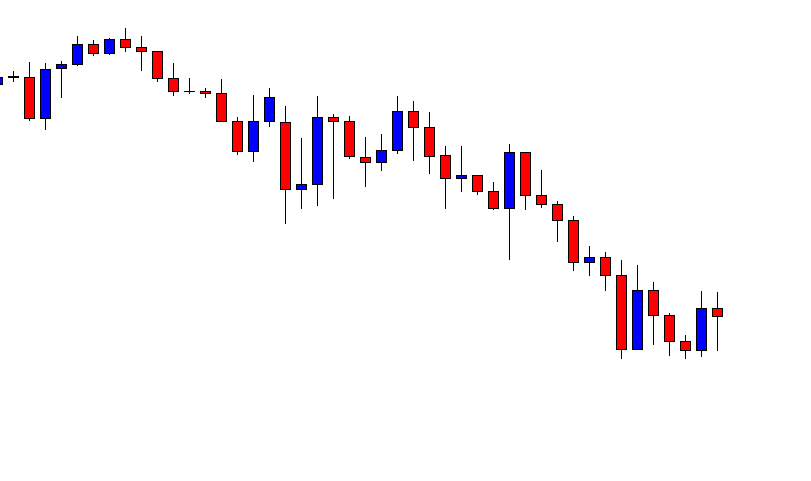
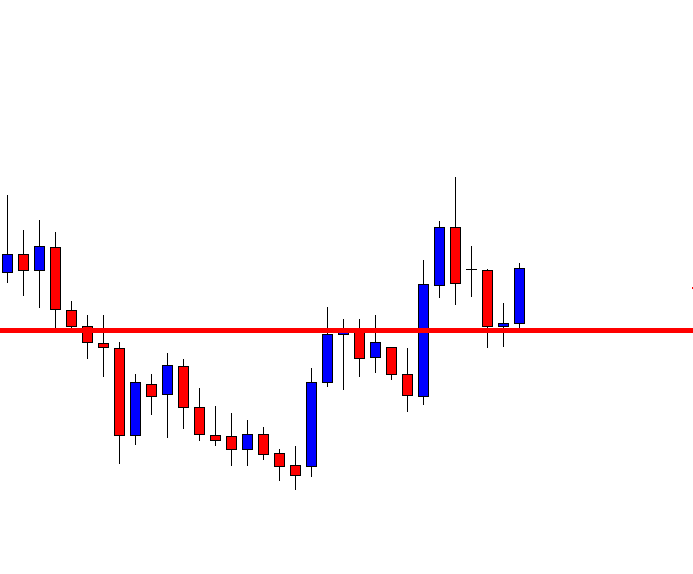
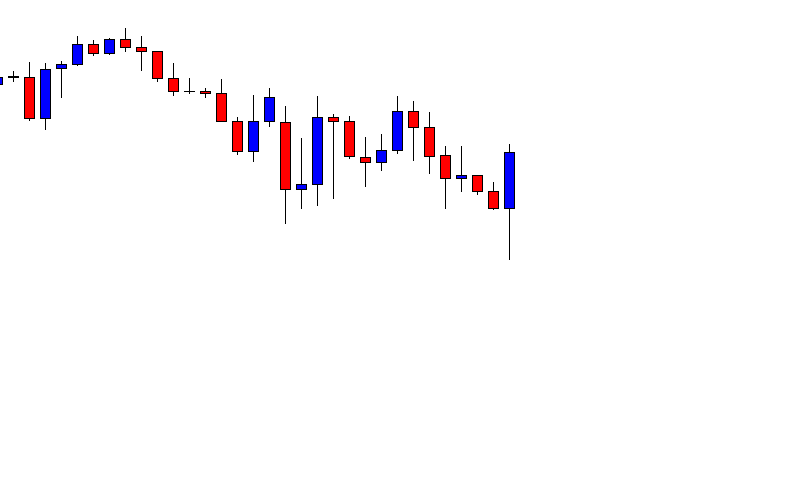
The chart produces a bullish engulfing candle followed by a bearish inside bar. Now, it looks that the buyers may take control. Let us proceed to the next chart and find out what happens next.

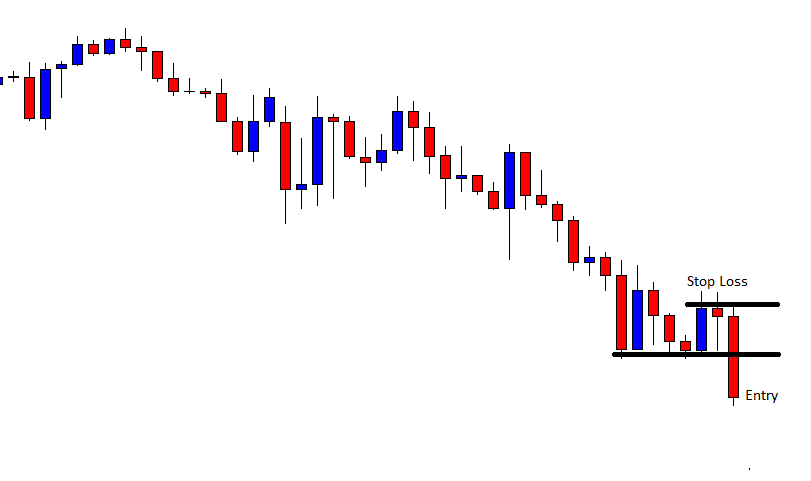
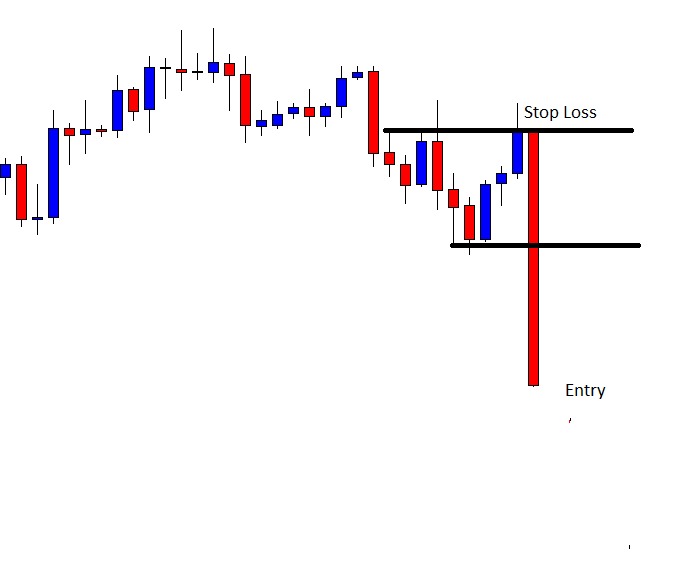
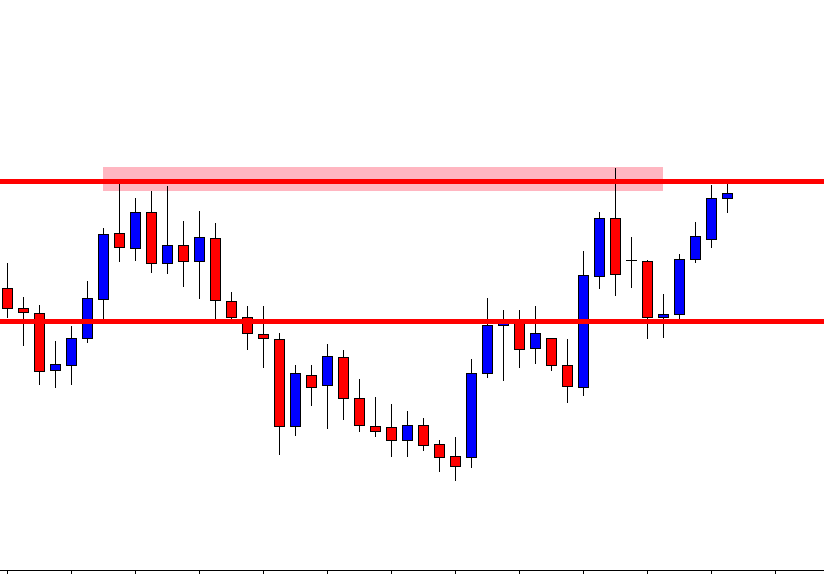
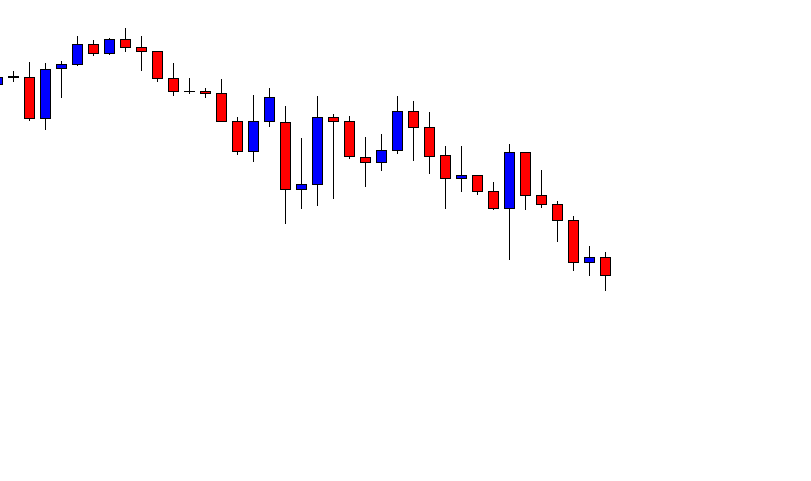
What a Surprise for the H4 breakout sellers! The last candle comes out as a bearish engulfing candle closing well below consolidation support. The sellers may trigger a short entry right after the last candle closes with 1 R by setting stop-loss above consolidation resistance. Do not forget this is Friday. The market is closing within 4 hours.

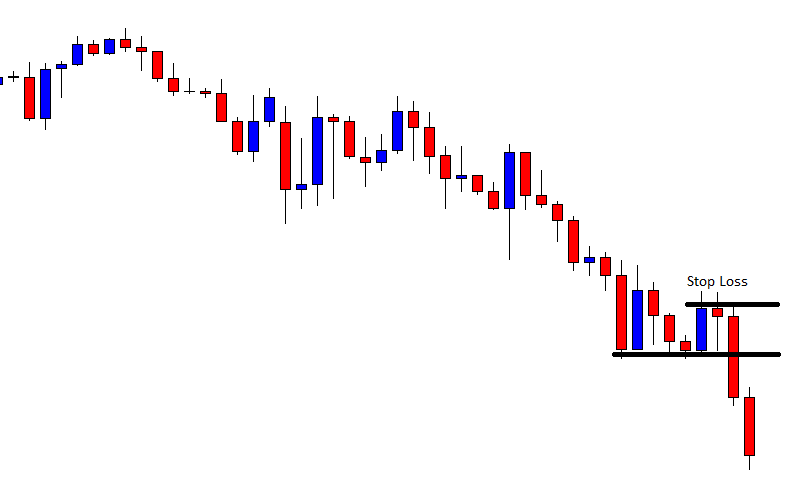
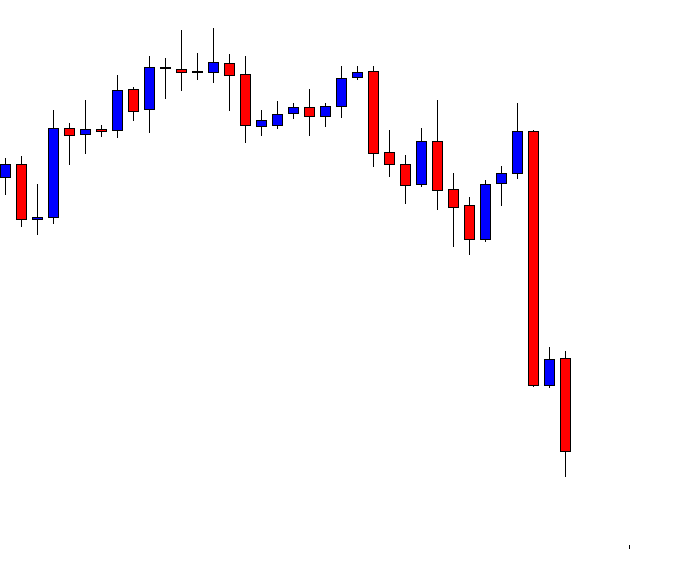
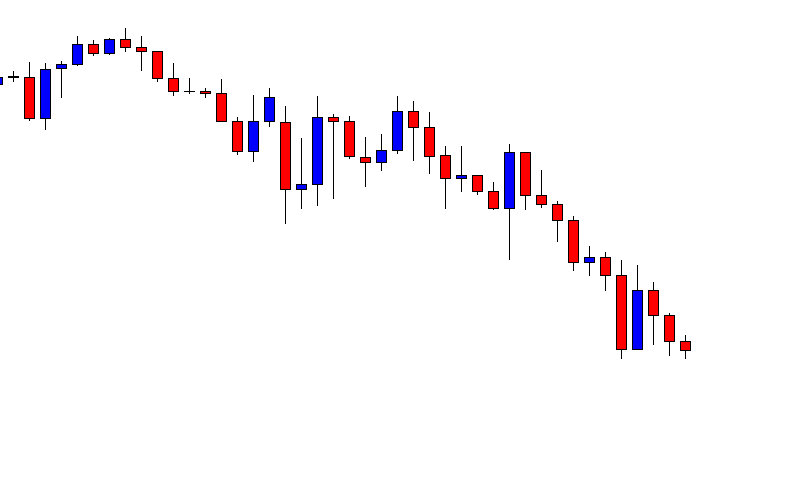
This is how the last candle looks. It suggests that the price may keep heading towards the South. However, carry trade during the weekend on the H4 chart is risky a little. The market often starts Monday with big gaps that affect the H4 charts. Thus, the sellers may consider taking a partial profit just before the market closes on Friday. It would not get them to achieve 1R in the end, but it would make sure that they earn some profit out of it. Even if the rest of the trade hits the stop loss, he will not lose as much as he would with his whole trade.


Categories
Forex Daily Topic Forex Price-Action Strategies

Taking Partial Profits: an Alternative if You are Too Defensive

In today’s article, we are going to demonstrate an example of the daily-H4 chart-combination price-action trading. The signal candle comes out as a strong bearish candle, which attributes have a lot to offer to the sellers. Let us find out how it ends.

This is a daily chart. The last candle comes out as a bearish engulfing candle. The daily-H4 combination traders are to flip over to the H4 chart for the price to consolidate and produce a bearish reversal candle to offer them a short entry below the consolidation level of support.

This is the H4 chart. The price consolidated earlier before producing that daily bearish reversal candle. Traders must wait for consolidation and a bearish candle from now. It produces two bearish candles consecutively. It may consolidate soon.

It produces one more bearish candle and starts having a correction instead of consolidation. It is less likely that the chart presents a bearish engulfing candle breaching the level of support. We shall never be certain, though, since it is the Forex market. Let us see what happens next.

Would you believe it? What a good-looking bearish engulfing candle that is! The sellers may trigger a short entry right after the candle closes by setting stop-loss above the level where it has a rejection. Such price action offers 1:1 risk-reward easily. Considering the signal candle, the price may go towards the South further and get more reward to the sellers.

The chart produces a bullish inside bar and heads towards the South again. The last candle comes out as a bearish Marubozu candle. The sellers must hold the trade to make a handful of pips.

The price heads towards the South for one more candle. However, it produces three consecutive bullish reversal candles. The last one comes out as a bullish pin bar. The price is still to cover a lot of space to get us 1:1 risk-reward. By looking at the price action for the last three candles, it seems that the price may have an upside correction before making the next bearish move. It may even change its trend as well. It is best to have a belief in our positions and hold it as long as we can. In other words, we shall remember the rule ‘set and forget.’ However, if the price produces too many reversal candles and strong reversal candle such as pinbar, truck rail, or engulfing candle, we may consider taking a partial profit.

In such cases, taking a partial profit comes handy. We may take out at least 50% profit and let the rest of it run. Even if the trend changes, we do not lose money. On the other hand, if it goes towards our desired direction, it gets us more profit.

Categories
Forex Price-Action Strategies

Trading the ABC Pattern

In today’s lesson, we are going to demonstrate an example of an ABC pattern trading on a daily chart. The ABC pattern is one of the most consistent trading patterns in the financial market. It offers an excellent risk-reward as well as a high winning percentage. Let us get started.

This is a daily chart. The price after being bullish makes a bearish move. The last candle comes out as a doji candle. This is a bullish reversal candle, which is not a strong one. However, look at the level where the price produces the doji candle.

It is a flipped level of support. Technically, the buyers are to wait for a bullish reversal candle to go long around this level. Since this is not a strong bullish reversal candle, the buyers might as well wait for a bullish engulfing candle to go long from here.

Here it comes. This is a bullish engulfing candle closing above the last bearish candle. This means it produces a morning star. The buyers may trigger a long entry right after the last candle closes. This point is known as point C in the ABC chart pattern. Traders shall set their stop loss below the level of support. With take profit, they are to be tricky. The last swing high (or low) often becomes a big factor. Thus, buyers may consider taking a partial profit. Have a look at the chart below.

The price often roams around and even makes a reversal at this point. This point is known as point B. If we take out the 50% profit around this level and let the rest of it run, we give ourselves a chance to win more pips without any risk. If the price produces an ABC pattern, in 70% cases, it makes a new higher high or lower low. Let us find out what happens here.

The price makes a breakout. We have taken out some of our profits. Now, we may consider using a trailing stop setting below the last candle (breakout candle). We must be patient and hold the trade until the price produces a strong bearish reversal candle.

The price heads towards the North with good bullish momentum, and then it produces a bearish reversal candle. It may still head towards the North if it makes a bullish breakout after consolidation. Meanwhile, we may come out with the rest of the trade.

The price pattern is produced in almost all the pairs and in all time frames. It is one of the most common price patterns, which is favorite among the financial traders. To be able to trade and make money out of it, we need to have a lot of back-testing and practice.