
In today’s lesson, we are going to demonstrate an example of an ABC pattern trading on a daily chart. The ABC pattern is one of the most consistent trading patterns in the financial market. It offers an excellent risk-reward as well as a high winning percentage. Let us get started.

This is a daily chart. The price after being bullish makes a bearish move. The last candle comes out as a doji candle. This is a bullish reversal candle, which is not a strong one. However, look at the level where the price produces the doji candle.
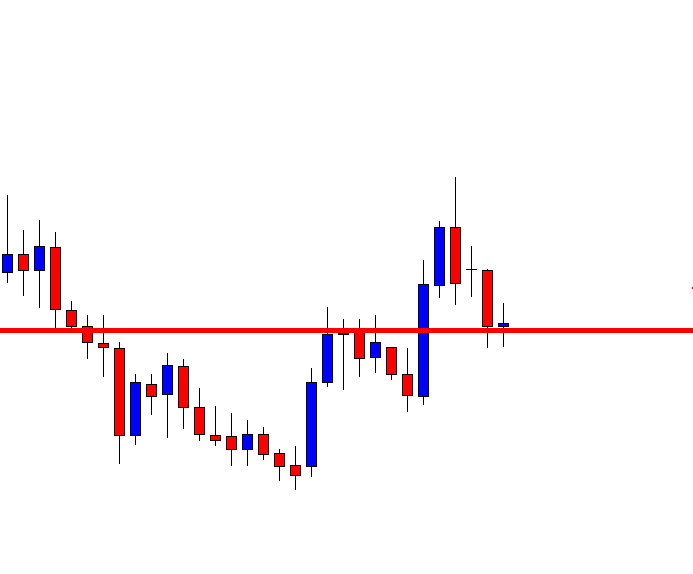
It is a flipped level of support. Technically, the buyers are to wait for a bullish reversal candle to go long around this level. Since this is not a strong bullish reversal candle, the buyers might as well wait for a bullish engulfing candle to go long from here.
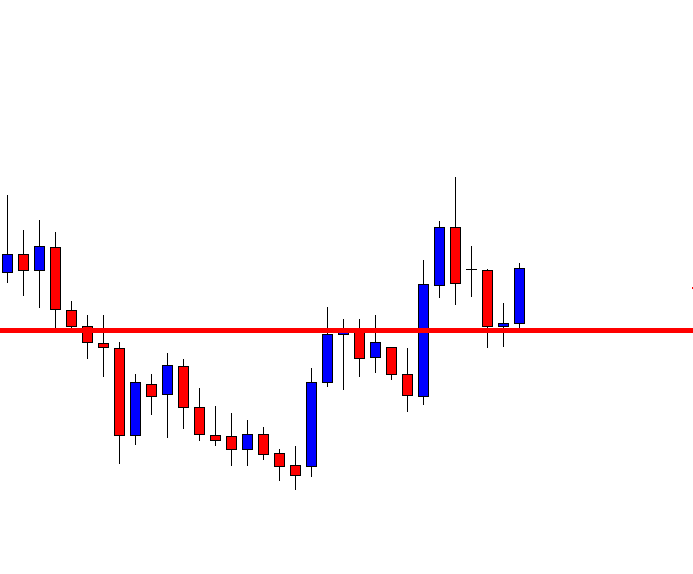
Here it comes. This is a bullish engulfing candle closing above the last bearish candle. This means it produces a morning star. The buyers may trigger a long entry right after the last candle closes. This point is known as point C in the ABC chart pattern. Traders shall set their stop loss below the level of support. With take profit, they are to be tricky. The last swing high (or low) often becomes a big factor. Thus, buyers may consider taking a partial profit. Have a look at the chart below.
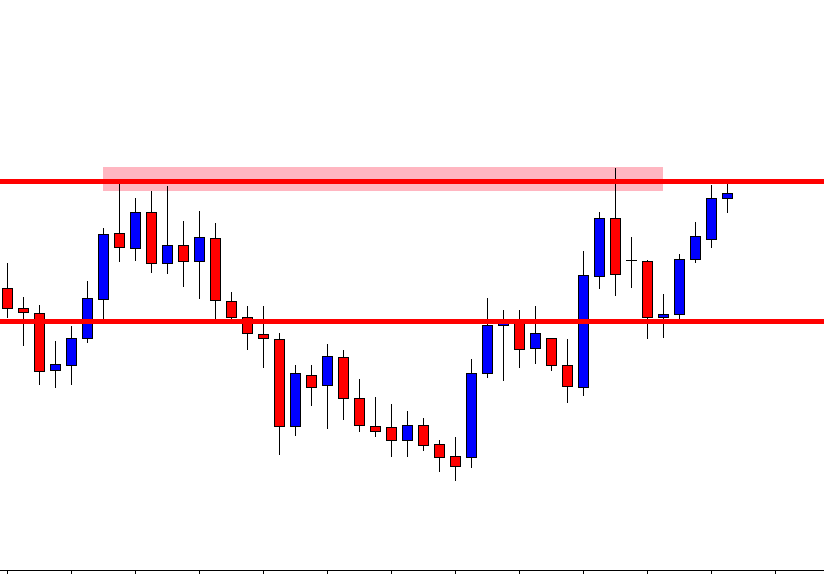
The price often roams around and even makes a reversal at this point. This point is known as point B. If we take out the 50% profit around this level and let the rest of it run, we give ourselves a chance to win more pips without any risk. If the price produces an ABC pattern, in 70% cases, it makes a new higher high or lower low. Let us find out what happens here.
The price makes a breakout. We have taken out some of our profits. Now, we may consider using a trailing stop setting below the last candle (breakout candle). We must be patient and hold the trade until the price produces a strong bearish reversal candle.

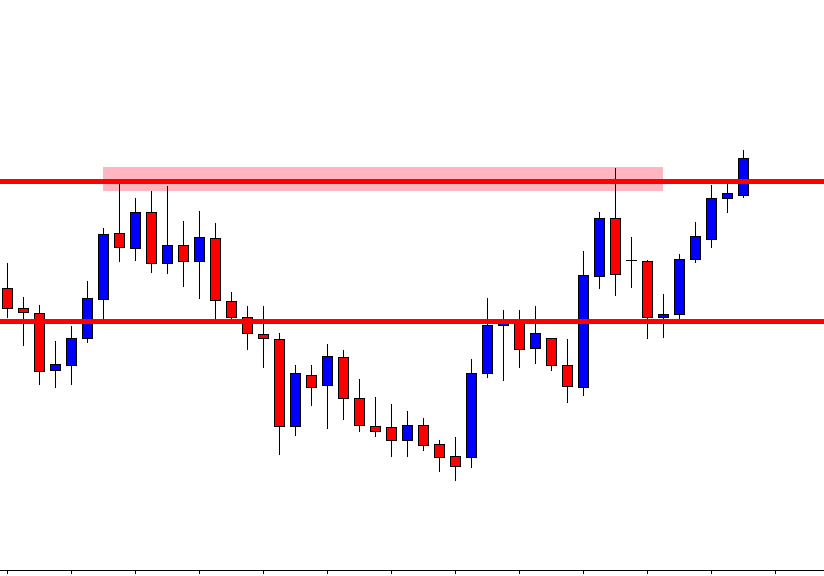
The price heads towards the North with good bullish momentum, and then it produces a bearish reversal candle. It may still head towards the North if it makes a bullish breakout after consolidation. Meanwhile, we may come out with the rest of the trade.
The price pattern is produced in almost all the pairs and in all time frames. It is one of the most common price patterns, which is favorite among the financial traders. To be able to trade and make money out of it, we need to have a lot of back-testing and practice.