Categories
Forex Daily Topic Forex Price Action

How to Professionally Deal with Fake Breakouts!

In today’s lesson, we are going to demonstrate an example of an H4 breakout at the weekly low. The price consolidates after the breakout and produces a bearish reversal candle right at the breakout level. It is a matter of time for the sellers to go short and drives the price towards the South. Let us find out what actually happens.

The chart shows that the price makes a good bearish move. It finds its support where the pair is traded for a while. The pair closes its week by producing a bearish candle. By looking at the chart, it looks that the sellers are going to keep their eyes on the chart next week.

The pair produces a bullish engulfing candle to start its trading week. The buyers on the minor charts may push the price towards the North. However, the H4 chart is still bearish biased.

The chart shows that the price may have found its resistance. The price has been in consolidation for a while. The last candle comes out as a bearish engulfing candle. The price may make its move towards the South now.

The chart produces consecutive bearish candles and makes a breakout at the last week’s low. The pair is traded below the breakout level for two more candles as well. The sellers are to wait for the price to consolidate and produce a bearish reversal candle followed by a breakout at the consolidation support to go short in the pair.

The chart produces a bullish engulfing candle closing within the breakout level. The next candle comes out as a bearish inside bar. The sellers would love to get a bearish engulfing candle closing below the bullish candle’s low. However, a breakout at the consolidation support would signal the sellers to go short in the pair. By drawing Fibonacci levels on the chart with Fibonacci extension, we see that the price finds its support at the level of 38.2% and finds its resistance at the level of 23.6%. In a word, the stage is getting ready for the Bear to make a move.

The chart produces a bullish candle. It is not a good sign, but the sellers still have hope. If the chart produces a bearish reversal candle again followed by a breakout at the level of 38.2%, the game is on for the sellers.

Now, the chart produces another bullish candle and heads towards the North. The sellers must be very disappointed since it seemed such a nice trade setup for them. The reality is it often happens to all traders. No point in being disappointed, but it must be dealt with professionalism.

Categories
Forex Price Action

Weekly High/Low Breakout Trading: Importance of Candles’ Body before Making a Breakout

In today’s lesson, we are going to demonstrate an example of an H4 chart that seems promising to make a breakout at the last week’s low. It produces a strong bearish candle as well at last, but the price does not head towards the South. We try to find out the possible reason behind that.

It is an H4 chart. The chart shows that the price heads towards the South with good bearish momentum. The price bounces twice at a level of support. The pair closes its trading week by producing a bearish candle.

The pair starts its next week by producing a bullish engulfing candle. It means the breakout length gets bigger, which attracts the sellers more. The sellers are to wait for the price to make a bearish reversal candle followed by a breakout at the weekly low.

The price finds its resistance and produces two consecutive bearish candles. The sellers are to keep their eyes on the chart closely. It seems that the Bear is going to make a breakout soon. Let us proceed to the next chart to see what happens next.

The chart continues to produce bearish candles. However, it has not made a breakout at the weekly low yet. The last candle comes out as a spinning top closing within the weekly low.

The chart produces a spinning top followed by a bullish engulfing candle. The price then consolidates within the last week’s low and a new resistance. The last candle comes out as a bearish engulfing candle closing just below the weekly low. The question is whether it should be considered as a breakout. It is a breakout, but the H4 traders should skip taking entry on this chart based on a weekly high/low breakout. The reason behind that is the chart takes too long to make the breakout. Once the price starts trending, it must make a breakout without producing any reversal candle. It means if the chart produced the last candle right after the first spinning top; it would be a hunting ground for the sellers. Since it produces four bullish reversal candles before making the breakout, the chart does not belong to the H4 traders based on the weekly low anymore. We must not forget that it must consolidate after a breakout, though. It means it must produce bullish reversal candle/candles in case of a bearish breakout, but it must make a breakout only by producing bearish candles and vice versa.

Categories
Forex Price Action

Disobeying the Breakout

In today’s lesson, we will demonstrate an example of a chart that makes a breakout, consolidates, and produces a reversal candle. However, it does not make a breakout at consolidation support. Thus, it does not offer an entry. Nevertheless, it makes a move towards the breakout direction later. We try to find out whether breakout traders find an entry from that move or not.

The chart shows that the price makes a long bearish move. It finds its support where it bounces twice. The chart ends its trading week by producing a Doji candle. The next week should be interesting.

The chart produces a bullish engulfing candle. The buyers may wait for the price to make a breakout at the last swing high. On the other hand, the sellers are to wait for the price to make a breakout at the last week’s low.

The chart produces a spinning top, and the price heads towards the South. It makes a breakout at the last week’s low. Thus, the sellers may keep an eye on this chart for the price to consolidate and produces a bearish reversal candle to offer them a short entry.

It produces a bullish engulfing candle. It is a strong bullish candle. However, the breakout level is still intact. If the level produces a bearish reversal candle followed by a breakout at consolidation support, the Bear may keep dominating in the pair.

The chart produces a Doji candle followed by a spinning top right at the breakout level. The sellers may go short below consolidation support. It looks it is a matter of time for the Bear to make a long move towards the South.

The chart produces a bullish candle breaching the breakout level. It spoils the sellers’ party. The weekly low is disobeyed by the H4 chart. Thus, the H4 sellers may skip taking entry on this chart. The chart becomes no hunting zone for both the buyers and the sellers as far as the H4 chart is concerned. Let us proceed and find out what happens next.

The price makes a bearish move. The pair is trading below the last week’s low. Look at the momentum. The price has been rather sluggish to head towards the South. It is because the pair is traded on other minor charts. As mentioned, if the price disobeys breakout on a chart, it is better not to trade based on that chart. The price may go either way, which makes things difficult for the traders to trade.

Categories
Forex Daily Topic Forex Price Action

Fibonacci Extension: How It Helps Traders

In today’s lesson, we will demonstrate an example of an H4 chart that makes a breakout heading towards the North. However, the chart does not offer entry. We try to find out the reason behind it.

It is an H4 chart. The chart shows that the price makes a good bullish move. Thus, the weekly candle ends up being a bullish candle. Let us proceed to the next chart to see how the price starts next week.

The first candle comes out as a bearish engulfing candle. However, the support level where the price had a bounce and headed towards the North is intact. The buyers may eye on the chart for the price to have a bounce and make a bullish breakout at the weekly high.

The chart produces a bullish inside bar. The candle is produced right at the level of support. It is not a strong bullish reversal candle, but things look good for the buyers.

The chart produces three more bullish candles breaching the level of resistance. The buyers are to wait for the price to consolidate and produce a bullish reversal candle to offer them a long entry.

The price keeps heading towards the North without having consolidation. In naked eyes, it seems that the price has traveled a long way. If it consolidates now, should the buyers go long?

The chart produces a bearish candle. It means the price may consolidate now. The breakout level is far away. If the price makes a bearish correction up to the breakout level, it will come out as a long bearish wave. This often changes the trend or makes the price get choppy, at least. Let us draw a Fibonacci Extension and explain it with the Fibonacci levels.

We know when the price makes a breakout; Fibonacci Extension can be used to determine the wave’s length. The breakout length is measured at 23.6%. The best level for the price to consolidate within 23.6% to 38.2% or 38.2% to 50.0%. Over here, the price consolidates within 61.8% to 78.6%. It means the price does not have much space to travel. Thus, the buyers may skip taking entry on this chart as far as the risk-reward ratio is concerned. The price may go up to the level of 100.0%, but it often ends up being choppy or makes a reversal in such cases. This is when Fibonacci Extension comes out as a handy tool with what traders can determine the trend’s potential length and calculate whether they should take an entry or not.

Categories
Forex Daily Topic Forex Price Action

Price Action Trading: Reasons to Skip Entries on Charts with Price Gap

Forex charts often have price gaps. It usually occurs in minor time frames. However, it sometimes occurs in time frames such as the H1, H4, daily chart as well. Since price movement is the key factor determining its next move for the price action traders, thus price gap creates confusion in price action trading. Thus, it is best to skip taking entries on charts with a price gap. Let us demonstrate an example and find out the reason behind it.

It is an H4 chart. The chart shows that the price produces a bullish engulfing candle right at a support level, where the price has several bounces. Thus, the H4-H1 combination traders may flip over to the H1 chart to go long in the pair.

The H1 chart shows that the price heads towards the North with good bullish momentum. The buyers are to wait for the price to consolidate and produce a bullish reversal candle to offer a long entry.

The chart produces a bearish engulfing candle. It is a strong bearish candle. However, the buyers may wait for the price to be held at a key level and produce a bullish reversal candle. Let us proceed to find out what happens next.

The chart produces a bullish reversal candle. It is an inverted hammer. Moreover, it is produced with a bullish price gap. Technically, the H4-H1 chart combination traders may trigger a long entry above the level of resistance. Here is an equation that must be considered if they are to determine risk-reward by using Fibonacci retracement. We find this out soon. Let us see how the price reacts now.

What a good bullish move it is! The price heads towards the North with very good momentum. The last candle comes out as a bearish candle. It suggests that the price may make a bearish correction. Let us now draw Fibonacci levels and explain the chart with some Fibonacci numbers.

Categories
Forex Daily Topic Forex Price Action

Importance of Choosing the Right Chart

In today’s lesson, we will demonstrate an example of a chart that makes a breakout at the weekly low, consolidates, and produces an excellent bearish engulfing candle. It looks like a good short entry for the sellers. However, things do not go as the sellers would love to see. We try to find out what may be the reason behind it.

It is the H4 chart. The chart shows that the price action has been choppy for the last three weeks. The price has been roaming around within two horizontal levels. Ideally, the price action traders would love to skip eying on such a chart to trade at. Let us proceed and see the H4 chart of the last week.

The chart shows that the price makes a bullish move to start its trading week. Then, it makes a bearish move and closes around the level where it started its week. It seems that the minor time frame sellers are driving the price down.

The chart produces a bullish engulfing candle right at the last week’s swing low. The minor time frame traders may push the price towards the North. The H4 sellers, on the other hand, may wait for the price to make a breakout at the swing low to go short on the chart. This is what the breakout traders usually do. However, the question is whether they should do it on this chart or not? We find it out in a minute.

It seems that the Bear is about to make a breakout at the last week’s low. The last candle comes out as a bearish engulfing candle closing right at the level of support.

The price makes a breakout at the weekly low. The last candle comes out as a bearish candle closing well below the level of support. The breakout traders are to wait for the price to consolidate.

The price consolidates. The last candle comes out as a bearish inside bar. If the price makes a breakout at the last swing low, the breakout traders usually trigger a short entry. Let us proceed and see what the price does.

The chart produces a bearish engulfing candle. It is an A+ signal candle as far as the breakout trading strategy is concerned. The sellers may want to trigger a short entry right after the last candle closes.

The chart produces a bullish engulfing candle and heads towards the North instead. The Forex market is unpredictable. The price could go either way anytime. However, it looks strange after the chart producing such a nice signal candle. There is nothing wrong with the entry apart from the fact that the chart has been choppy for the last three weeks. It means either the pair is waiting for a high impact news event to find its new direction or traded based on a bigger time frame. In a word, the price action traders may skip eying on such a chart to trade at. For them, choosing the right chart plays a vital role. Today’s example proves it again.

Categories
Forex Daily Topic Forex Price Action

Determinin Risk/Reward using Fibonacci Levels

In today’s lesson, we are going to demonstrate an example of a daily-H4 chart combination trading. We also find out how the price reacts to Fibonacci retracement levels and how Fibonacci levels may help us determine risk-reward. Let us start with the daily chart.

This is the daily chart. The chart shows that the price heads towards the North with good bearish momentum and crosses a long way. The last candle comes out as a spinning top with a bullish body. It is a bullish reversal candle, but not a strong one. Let us flip over to the H4 chart and see how it looks.

The chart shows that it produces a morning star. It is a strong bullish reversal pattern. The last candle comes out as a bullish inside bar. The buyers may wait for the price to find its support and produce a bullish reversal candle to go long on the chart.

The price heads towards the South to have a bearish correction. The last candle comes out as a Doji candle. It seems that the price may have found its support. It may not take long to produce a bullish reversal candle.

As expected, the chart produces a bullish engulfing candle closing well above the last swing low. Traders love to have a signal candle like this to trigger an entry. It usually attracts more traders to trade and brings more liquidity. However, here is an equation that we must remember. When the price makes a correction, it is good for the traders to have an engulfing candle as a signal candle closing within the last swing low. It offers the price to travel more space towards the trend. However, when the price consolidates, it must make a breakout at the last support/resistance, though. Let us find out how the price moves after that bullish engulfing candle.

The price heads towards the North with a sluggish pace. Moreover, the price gets caught within two horizontal levels for several candles. It seems that the price is struggling to go towards the North further. Let us draw Fibonacci levels and try to find out the reason behind it.

The chart produces the signal candle at the 61.8% level, which is fantastic. Usually, the price goes towards the level of 161.8% if it trends from the 61.8% level. Over here, the candle closes at 123.6% level, which means the price does not have enough space travel. This is why the price moves towards the North sluggishly. Fibonacci levels help us determine where to set stop loss and take profit. It also helps us determine the risk-reward, which we must not forget.

Categories
Forex Price Action

Do Not Be Biased, Take Decisions According to the Chart

In today’s lesson, we are going to demonstrate an example of a chart that makes a good bullish move but ends up having a rejection at a double top resistance. The price then shows the potential to make a bullish breakout. However, it has another rejection around the last week’s high and makes a bearish breakout. It looks good for the sellers at the time. We find out what happens afterward.

This is the H4 chart. The price makes a long bullish move. It ranges for a while and then continues its bullish journey again. Look at the last candle on the chart. It comes out as a bearish inside bar. Do not miss the point that the candle is produced right at the resistance, where the price has had a rejection.

The chart produces a bullish candle to start the next week. It then ranges for a while and produces two bullish candles. It seems that the price may head towards the North and makes a bullish breakout at the last weekly high.

It does not. It rather finds its resistance around the same level. Moreover, it produces a bearish engulfing candle. To be more precise, the chart produces an evening star. It is a strong bearish reversal candle. Let us wait and see what the price does next.

The chart produces a long bearish candle breaching the last swing low. The breakout is significant since the price trends from the last weekly low. The sellers may keep their eyes in the pair to go short. Before going short on this chart, the sellers shall wait for the price to make a bullish retracement since the price is within the last weekly range. Keep that in mind that the price is to make a bullish correction to offer a short entry.

The price does not make a bullish correction. It rather consolidates and produces a bearish reversal candle. Since the price is within the last weekly range, so it is not a short signal.

Here it goes. The price gets choppy. This chart becomes a risky chart to trade. Thus, traders might as well skip eyeing on the chart to trade at. At first, it looks good for the buyers. Then, it shows potential for the Bear to dominate since the price has several rejections at the same level. However, it ends up being an extremely choppy chart.  Thus, do not be biased with your initial assumption. Wait for the breakout, confirmation, and then trade.

Categories
Forex Price Action

Some Moves do not Belong to the Chart that You Follow

In today’s lesson, we will demonstrate an example of a chart that makes a breakout at the last weekly low. The price then goes back within the last weekly range and makes an interesting move. We will find out what that interesting move is all about in a minute. Let us get started.

It is the H4 chart. The chart shows that the price makes a bearish move. It finds its support and trades around it for a while. The last candle of the week comes out as a Doji candle. The sellers may keep their eyes on the chart to get a bearish breakout and find short opportunities.

The first candle of the week comes out as a bearish candle. The price heads towards the level of support, and it produces a hammer. The price may roam around the level of support before making its next move. Let us proceed to find out what happens next.

The chart produces two bearish candles. One of the candles closes well below the level of support. The sellers may keep the chart on their watch list closely. They may wait for the price to consolidate and produce a bearish reversal candle to go short in the pair.

The chart produces four candles with a bullish body. The last candle comes out as a commanding bullish candle closing above the breakout level. If the chart still produces a bearish engulfing candle closing below the last swing low, the sellers may still go short in the pair. However, it does not look that good for the sellers.

As expected, the price heads towards the North further. One of the candles closes above the weekly opening as well. It means the H4 sellers may skip eyeing on the chart to go short. The chart does not belong to the H4 sellers anymore. The buyers may go long on the pair upon bearish retracement followed by a bullish reversal candle at the key level of support though. That is another ball game. Let us find out what the price does afterward.

What a strong bearish move that is! The price does not produce a bullish reversal candle. It makes a strong bearish move and makes a new swing low instead. However, the H4 sellers upon weekly high/low breakout may not be able to catch the move. The move belongs to other chart traders. Most probably, the sellers on the daily chart can catch such a move.

We often find such a move that may not offer entry on the chart that we follow. Do not get disappointed. Stick to your chart and trading strategies. Something must be round the corner for you.

Categories
Forex Daily Topic Forex Price Action

Trading Within Last Weekly Range

In today’s lesson, we will demonstrate an example of a chart where the price is having a retracement within the last weekly range. The price produces a double bottom and makes a breakout at the neckline. It then consolidates but does not head towards the North as it normally does when it makes a breakout at weekly high/low. Let us proceed and find out the possible reason behind it.

The price makes a long bearish move and finds its support. Upon producing a bullish engulfing candle, it heads towards the North and comes back again. At the support zone, it produces a bullish inside bar. Let us see what happens next.

The price heads towards the North next week. It means it is trading within the last week’s range. The price is at the last swing high. If it makes a bullish breakout, the buyers may want to go long at its weakness.

The chart produces two bearish candles followed by a bullish engulfing candle closing within the last swing high. It seems that the price may consolidate more to find its way.

The price upon producing a spinning top followed by a bullish engulfing candle makes a bullish breakout at the last swing high. It is a neckline breakout of a double bottom. The buyers may keep their eyes on the chart to go long on its weakness.

The price produces a bearish inside bar followed by a spinning top with a bullish body. Then, it produces a bullish candle closing above consolidation resistance. Since it is a breakout at the resistance, it is supposed to be a buy signal. The question is whether the buyers should trigger a long entry or not. Let us see the next chart.

The price gets choppy, struggling to make a breakout towards the North. The buyers would not love to see such price action after triggering the entry. If the price makes a breakout at the last week high/low, traders wait for the price to consolidate and produce a bullish/bearish reversal candle to take entry upon a breakout. On the other hand, if the price trades within last week’s range, the price usually makes retracement (instead of consolidation) to offer entry. The Fibonacci level, such as the 38.2% and 61.8%, play a significant role in producing the reversal candle. In today’s chart, the price is in the weekly range. Thus, traders are to wait for the price to make a retracement to offer them entry. It rather consolidates, which ends up making the price choppy.

Categories
Forex Daily Topic Forex Price Action

Weekly High/Low Breakout Trading: The Chart You May Want to Avoid

In today’s lesson, we are going to demonstrate an example of a breakout at a weekly high. The price consolidates afterward but fails to make a breakout at consolidation resistance. Thus, the price does not head towards the North. Let us find out how that happens and what lesson it holds for us.

It is an H4 chart. The chart shows that the price makes a strong bearish move to start its trading week. Then, it gets choppy for the rest of the week. The chart closes its week, producing a bullish engulfing candle. Let us proceed to see how the next week goes.

The chart produces a bullish candle to start its trading week. However, it produces three consecutive bullish candles and makes a breakout at the last weekly high. The buyers are to wait for the price to consolidate and produce a bullish reversal candle closing above consolidation resistance to go long in the pair.

The chart produces two bearish candles closing within the breakout level. A bullish reversal candle closing above consolidation resistance is the signal for the buyers to trigger entry. They must keep their eyes on this chart.

The chart produces a bullish inside bar. It is a bullish reversal candle but not a very strong one. Since it closes within consolidation resistance, the buyers are to wait longer for the chart to produce a bullish candle closing above consolidation resistance.

The chart produces two more bullish candles. However, it has not made a breakout yet. It has been taking too long to produce the signal candle. Let us wait and see what it produces afterwards.

It produces a bearish inside bar at the consolidation resistance. It does not look good for the buyers. The price has a rejection at the level, and it produces a bearish inside bar. It means it is a double top resistance. A breakout at the last swing low may change the equation and attract the sellers instead. Let us proceed and see what happens next.

The price does not make a breakout at the last swing low, either. It produces a doji candle followed by a bullish engulfing candle at the last swing low. It means the chart keeps traders waiting for the next breakout. The bull holds the edge but weekly high/low breakout traders do not love to see such price action after a breakout. It is best to avoid taking entry on a chart like this.


Categories
Forex Market Analysis

Daily F.X. Analysis, October 06 – Top Trade Setups In Forex – U.S. and ECB Central Bankers to Speak!

On the news front, the eyes will remain on the Central Bank officials such as Fed Chair Powell Speaks and ECB President Lagarde Speaks. The ECB President Lagarde is due to speak at a fireside chat at the Wall Street Journal’s online CEO Summit while Fed Chair Powell is due to talk about the U.S. economic outlook at the National Association of Business Economics annual meeting, via satellite. Audience questions are also expected.

Economic Events to Watch Today  


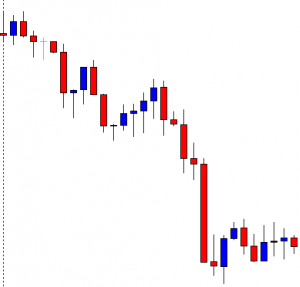
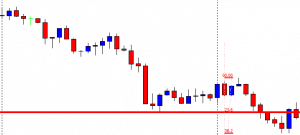
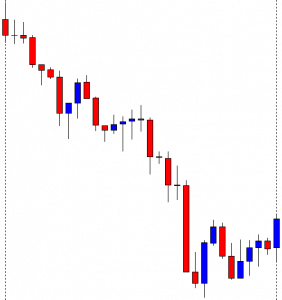
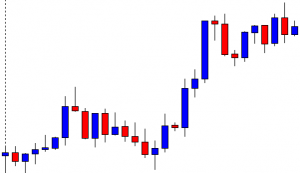
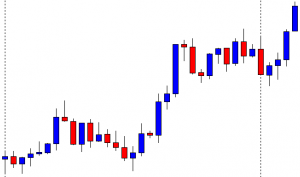
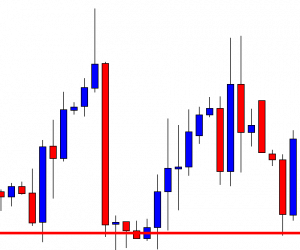
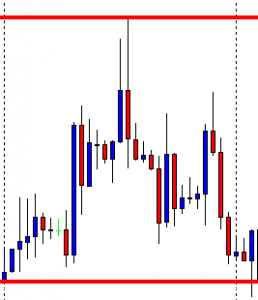
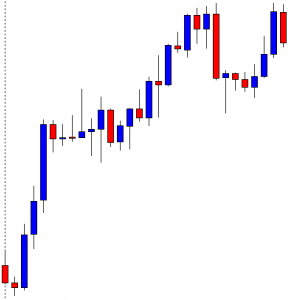
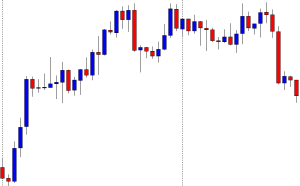
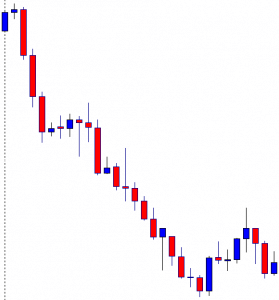
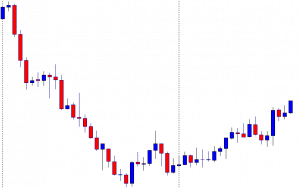
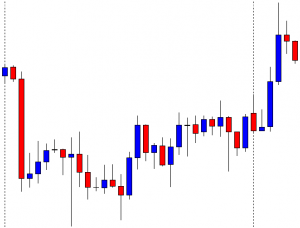
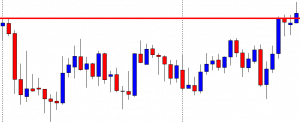
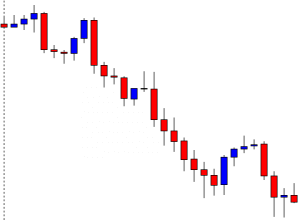
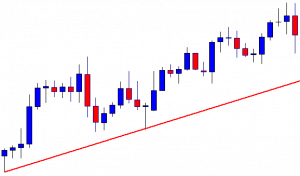
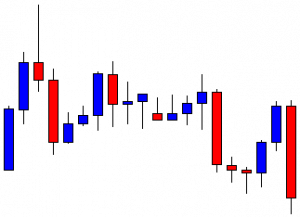
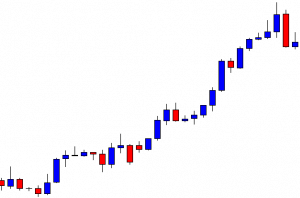
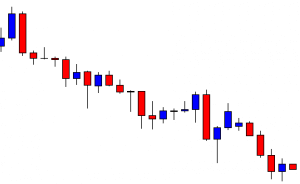
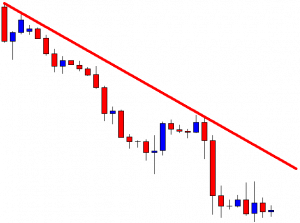
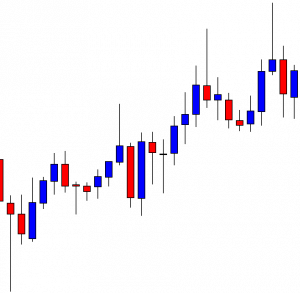
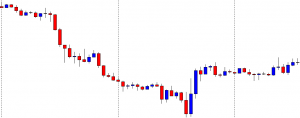
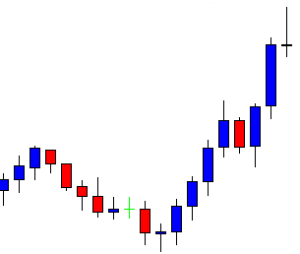
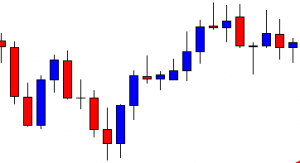
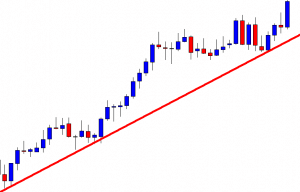
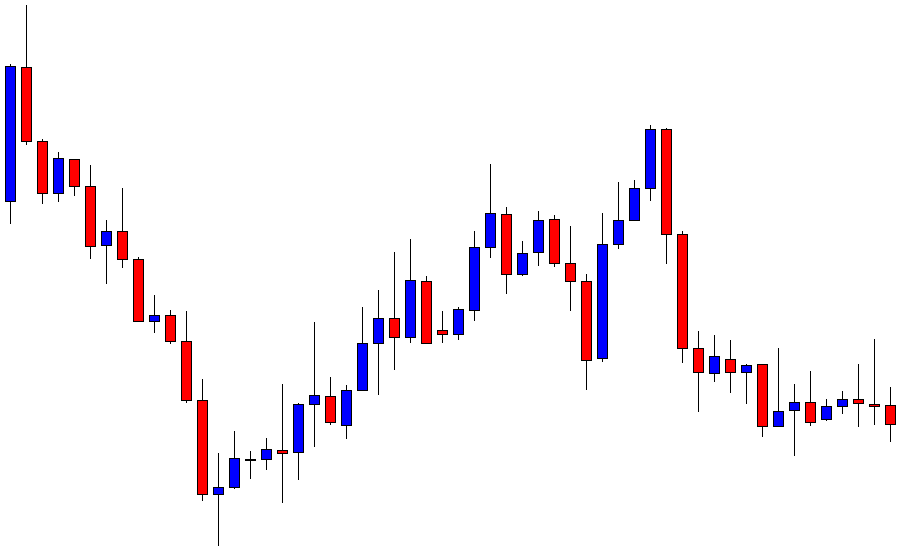
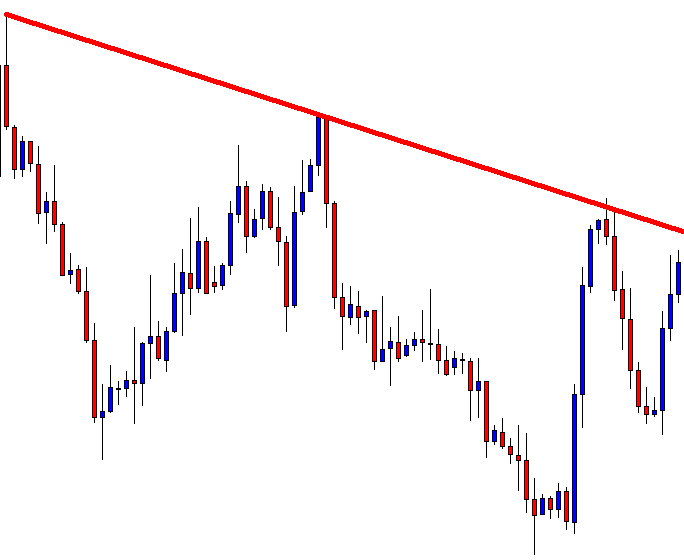
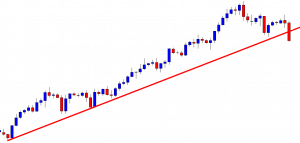
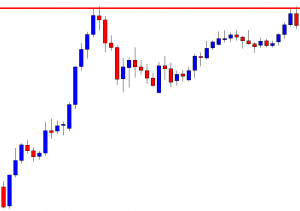
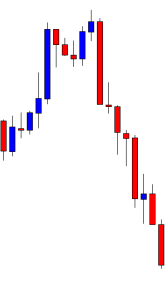
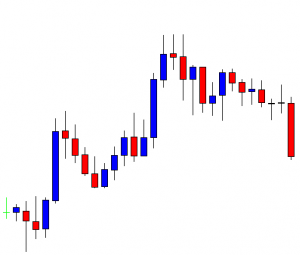
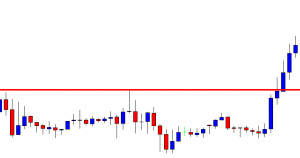
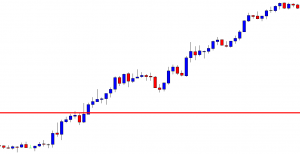
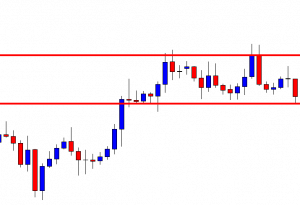
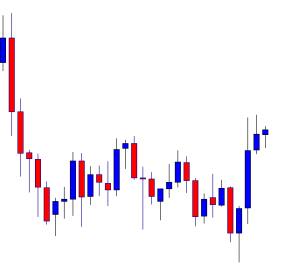
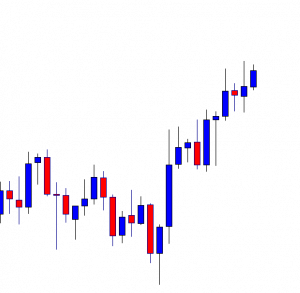
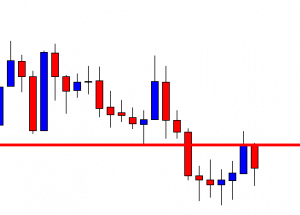
EUR/USD – Daily Analysis

The EUR/USD closed at 1.17824 after placing a high of 1.17973 and a low of 1.17047. Overall the movement of the EUR/USD pair remained bullish throughout the day. On Monday, the EUR/USD pair rose to its nine days highest level amid the broad-based U.S. dollar weakness and the strong positive macro-economic data from the European side.

The U.S. dollar was lower on Monday after the news about U.S. President Donald Trump’s health came into the market. The hopes that Trump will recover soon and be discharged from his military hospital as soon as Monday raised risk sentiment in the market and weighed on the safe-haven U.S. dollar. The fears that U.S. Presidential elections might not take place on schedule also dropped after the reports of Trump’s possible release from the hospital.

Another factor helping the risk sentiment was the hopes that U.S. stimulus measures will now be delivered soon as Trump’s infection has brought the virus to Capitol Hill. Both Democrats and Republicans will now realize the urgency of responding to the virus impact and reach a consensus over the aid bill’s size. The renewed stimulus hoped also added strength to the risk sentiment and helped the EUR/USD pair to gain further.

On the data front, at 12:15 GMT, the Spanish Services PMI for September dropped to 42.4 against the expected 46.4. AT 12:45 GMT, the Italian Services PMI rose to 48.8 from the projected 46.7 and supported Euro. At 12:50 GMT, the French Final Services PMI came in line with the expectations of 47.5. At 12:55 GMT, the German Final Services PMI rose to 50.6 against the forecasted 49.1 and supported Euro. 

At 13:00 GMT, the Final Services PMI for the whole Eurozone also rose to 48.0 from the anticipated 47.6 and supported the Euro currency. At 13:30 GMT, the Sentix Investor Confidence came in as -8.3 against the forecasted -9.2 and supported Euro. At 14:00 GMT, the Retail Sales from Europe rose to 4.4% from the expected 2.4% and supported Euro.

The Retail Sales in August from Eurozone raised nearly double than expectations to 4.4% and supported the local currency against its rival U.S. dollar and pushed the EUR/USD pair higher.

The Services PMI from all over European nations also rose and showed that the service industry improved from their previous levels and helped Euro to post gains. Furthermore, the Eurogroup meeting and the Financial Affairs Council meeting will start on 5-6th October. The Eurogroup will discuss its priorities under its new presidency and adopt a work program. The Eurozone’s policy priorities in the context of economic recovery and the draft budgets for 2021 will be discussed. Traders will look forward to meeting results for finding fresh clues about the EUR/USD pair in the coming days.

Daily Technical Levels

Support Resistance

1.1726    1.1817

1.1670    1.1854

1.1634    1.1909

Pivot point: 1.1762

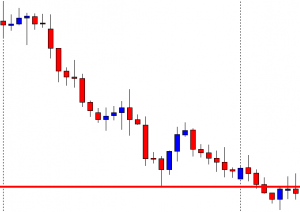
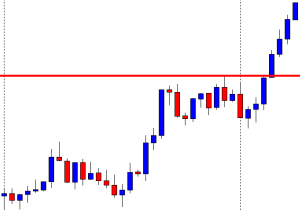
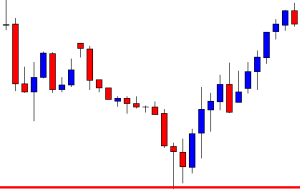
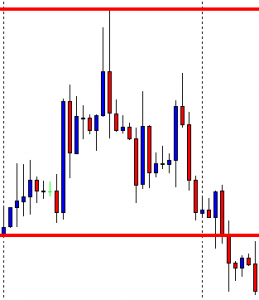
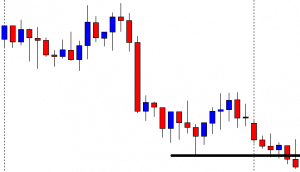
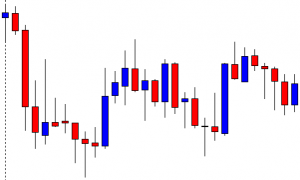
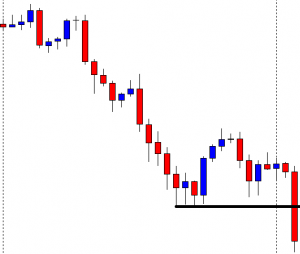
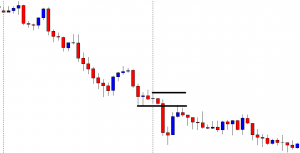
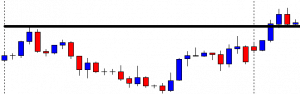
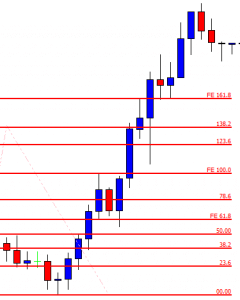
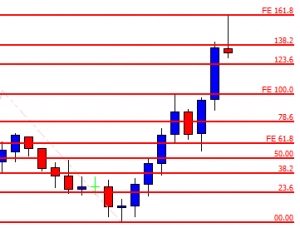
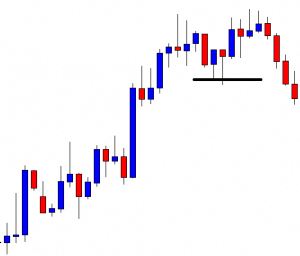
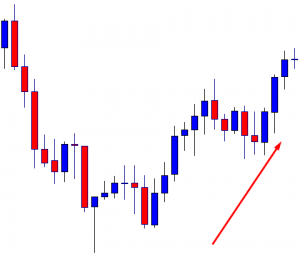
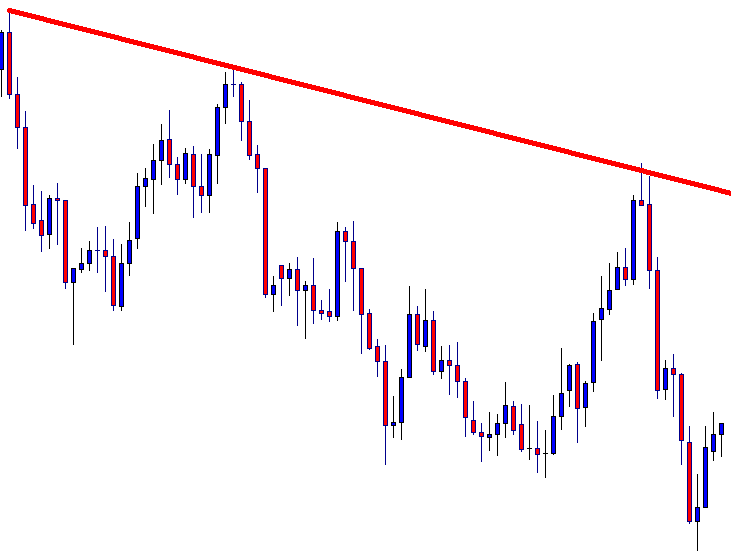
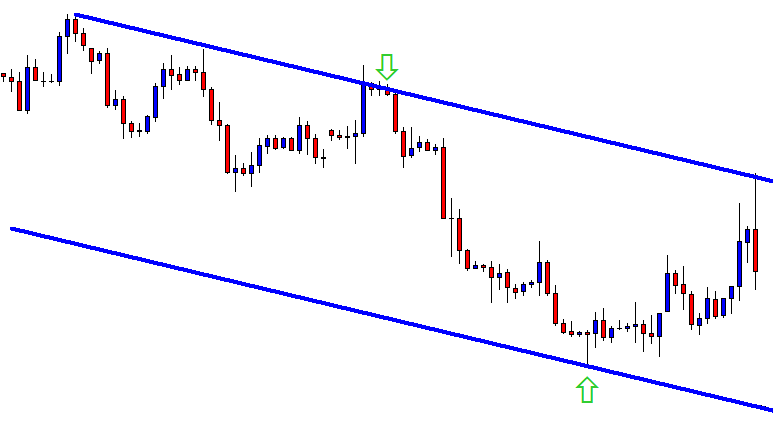
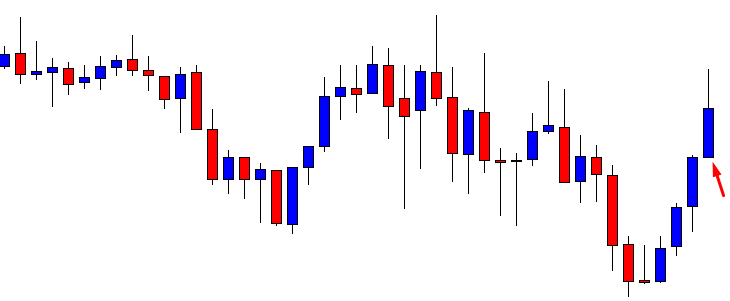
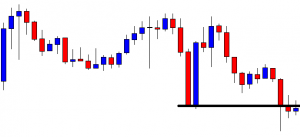
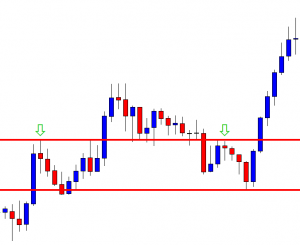
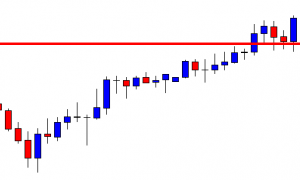
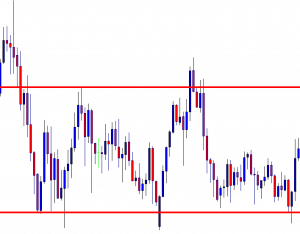
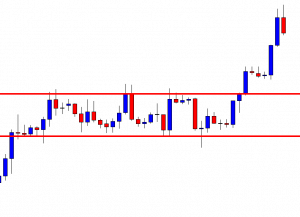
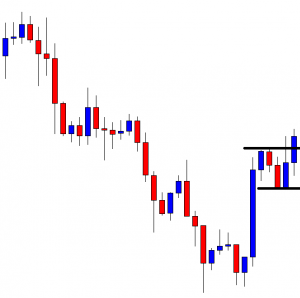
EUR/USD– Trading Tip

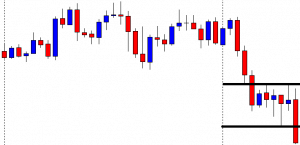
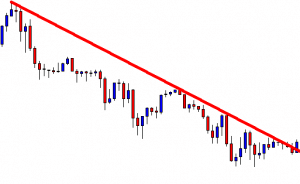
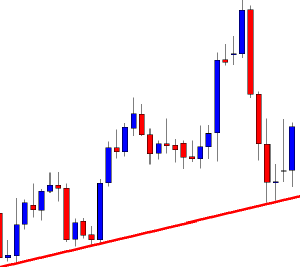
On Monday, the EUR/USD has mostly traded in line with our forecast to test the resistance level of 1.1801 level. On Tuesday, the EUR/USD is trading below a resistance level of 1.1801 level. Below this mark, the EUR/USD can plunge until the support resistance level of 1.1760 and 1.1740. In contrast, an upward breakout of 1.1801 can lead the EUR/USD pair towards 1.1840 areas. Let’s keep an eye on the Fed Chair Powell and ECB President Lagarde Speaks to determine further market trends. The bullish bias remains dominant today.


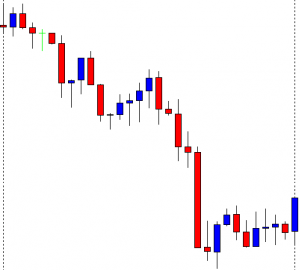
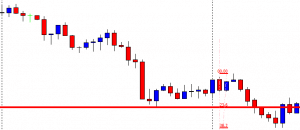
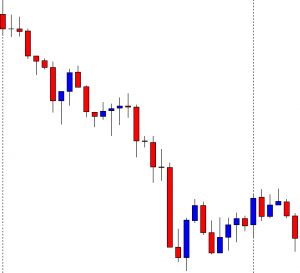
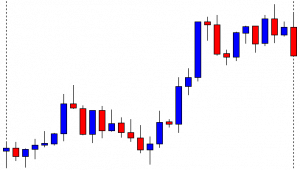
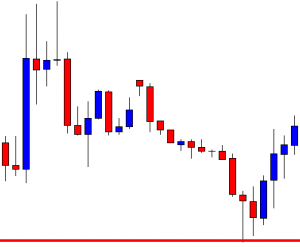
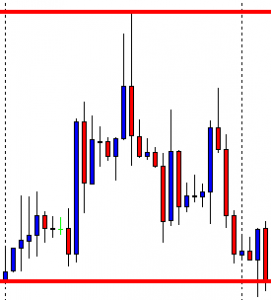
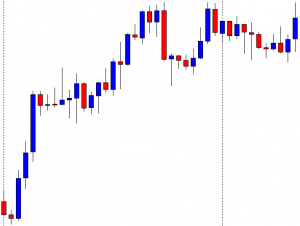
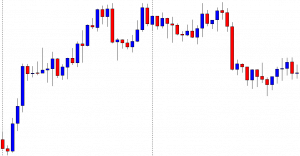
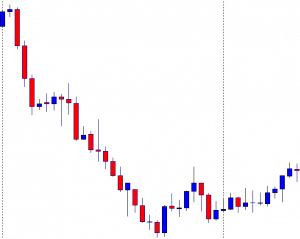
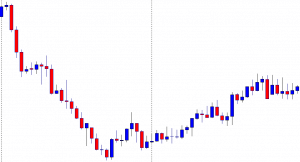
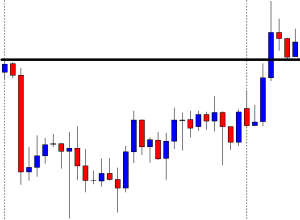
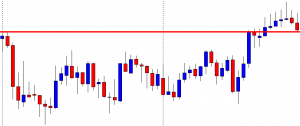
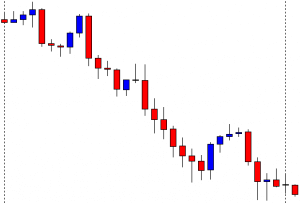
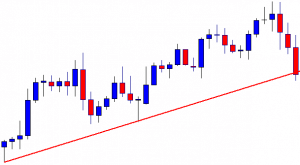
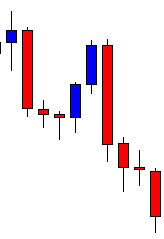
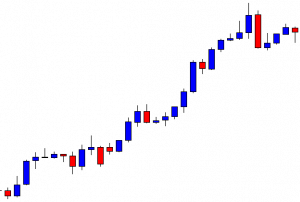
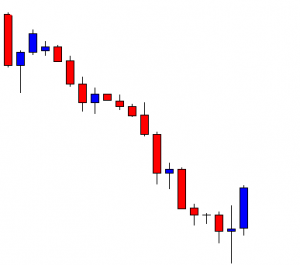
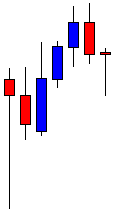
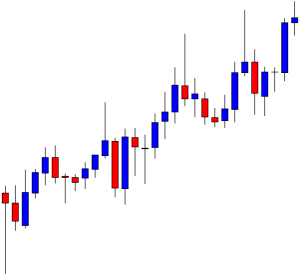
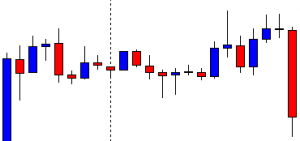
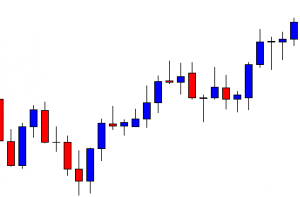
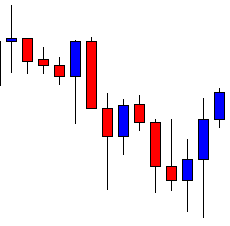
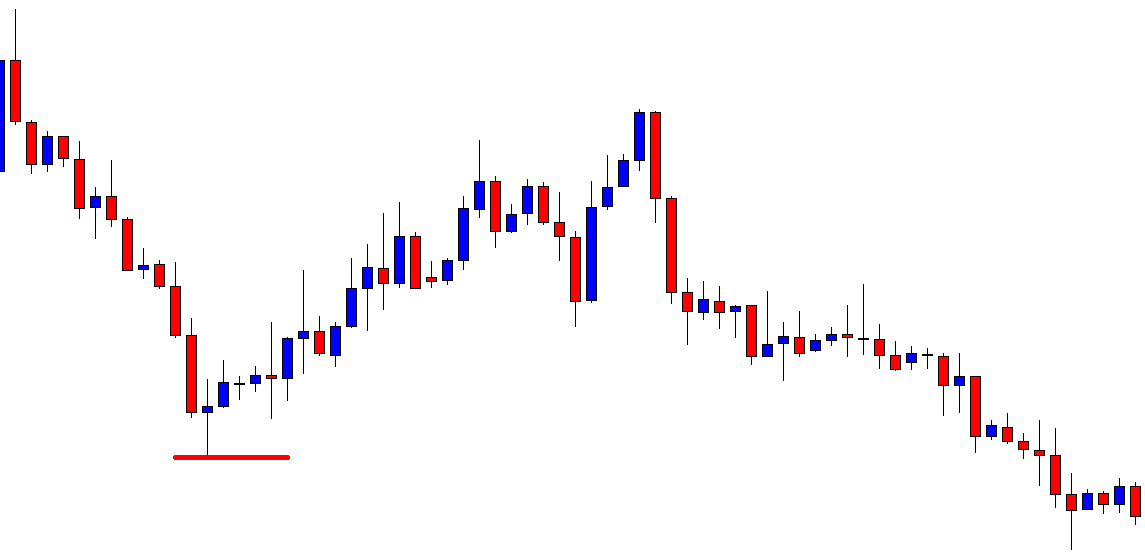
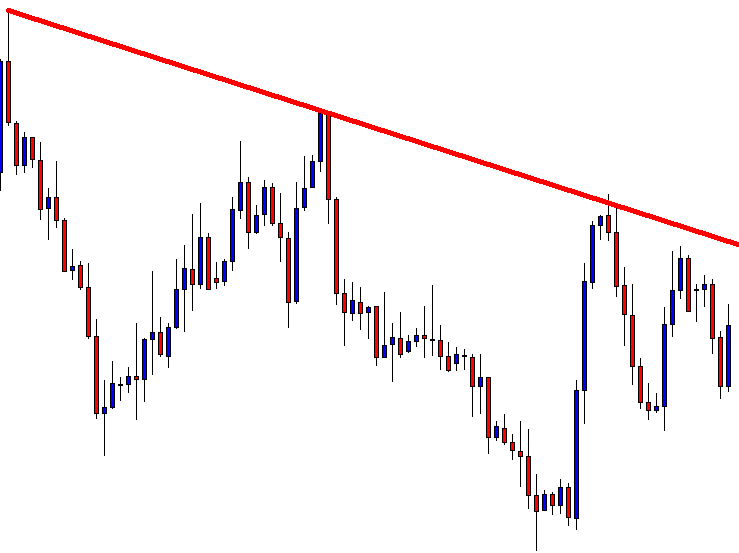
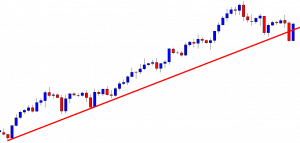
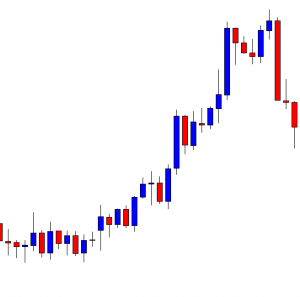
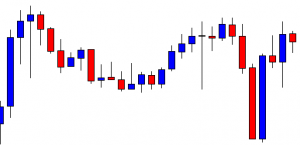
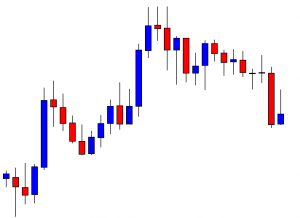
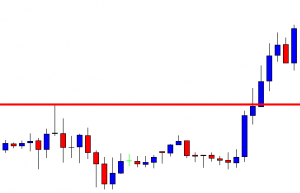
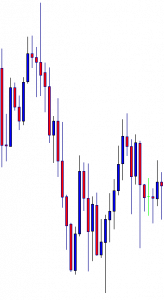
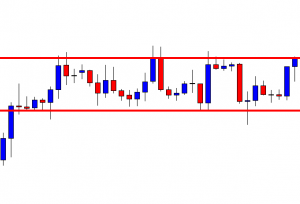
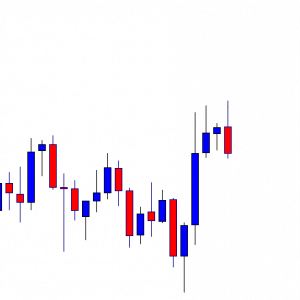
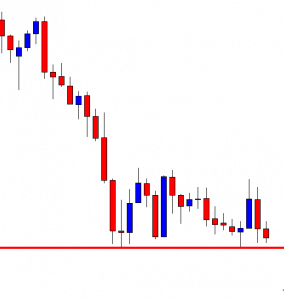
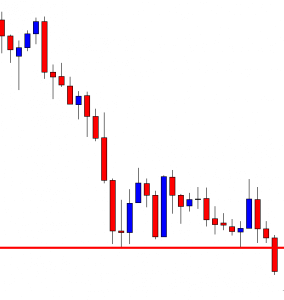
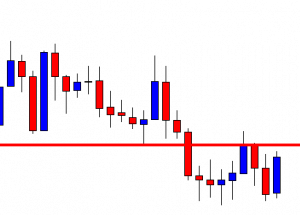
GBP/USD – Daily Analysis

The GBP/USD pair was closed at 1.29726 after placing a high of 1.29920 and a low of 1.28995. Overall the movement of the GBP/USD pair remained bullish throughout the day. The GBP/USD pair extended its previous daily gains and reached its 11-day highest level above 1.299 level on Monday amid the broad-based U.S. dollar weakness and renewed Brexit deal hopes along with the improving risk sentiment around the market.

The British Pound to U.S. dollar exchange rate moved higher on Monday on rising expectations that the U.K. and E.U. will reach a consensus on the post-Brexit trade deal. The Goldman Sachs forecasted that both parties would reach a deal by early November.

Another factor involved in the Brexit deal’s raised hopes was the report that suggested that E.U. chief negotiator Michel Barnier aimed to hold talks with European coastal states to get the freedom to negotiate terms with the U.K. on the fisheries issue. It is one of the sticking points that have caused a delay in the Brexit deal progress. The Brexit hopes were further bolstered after Prime Minister Boris Johnson and European Commission president Ursula von der Leyen agreed that talks should be intensified to close the significant gap that has stalled the negotiations’ progress. 

All these above optimistic reports helped the local currency and pushed the GBP/USD pair on the above side. The bullish calls were supported by Goldman Sachs that urges investors to buy Sterling. However, the Goldman Sachs Bank did not completely take the prospect of no-deal Brexit out off the table and said that No-Deal Brexit’s perceived probability would remain intact beyond the next European Council meeting in mid-October.

If no deal is reached between the E.U. and U.K., Britain will leave the E.U. without a deal at the end of the transition period on December 31.

Meanwhile, on the data front, at 13:30 GMT, the Final Services PMI from Great Britain for September rose to 56.1 against the 55.1 and supported GBP. The stronger than expected Services PMI showed an expansion in the U.K. services activities and supported the already rising GBP/USD pair on Monday.

However, the U.S. dollar was weaker on Monday due to the rising risk sentiment on the reports of the quick recovery of the U.S. President Donald Trump from coronavirus infection. The reports suggested that Trump would be released from his military hospital as soon as Monday, and he raised the risk sentiment after breaking the concerns that election might suffer from his illness. The weak U.S. dollar onboard, along with the improved risk sentiment, also helped the GBP/USD pair’s gains on Monday.

Daily Technical Levels

Support Resistance

1.2921    1.3013

1.2863    1.3049

1.2828    1.3106

Pivot Point: 1.2956

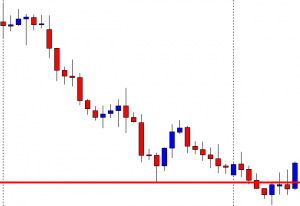
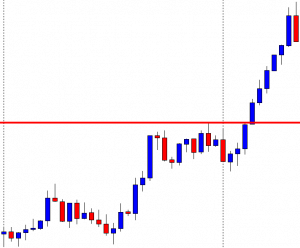
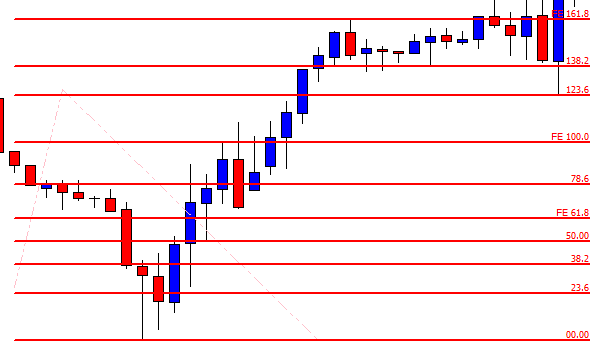
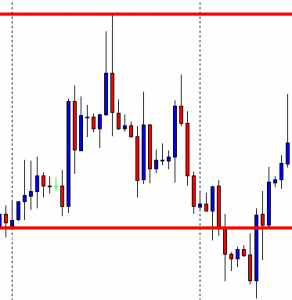
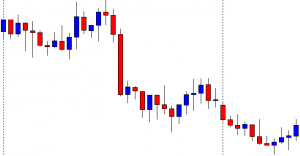
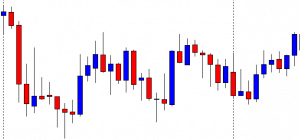
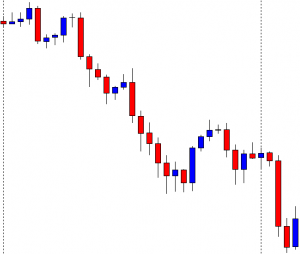
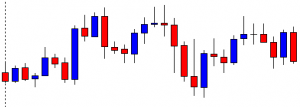
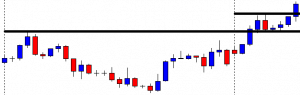
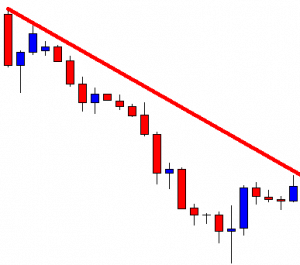
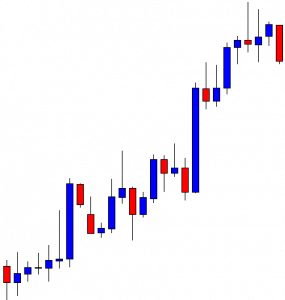
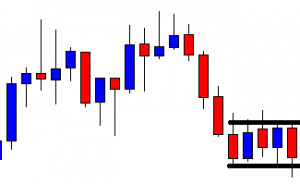
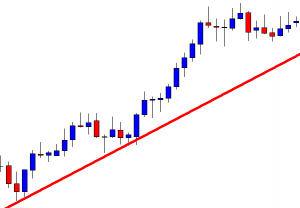
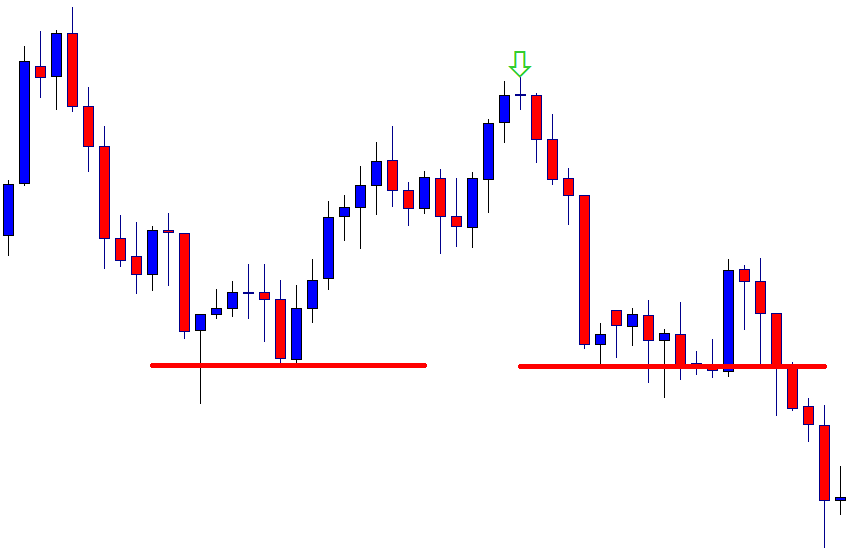
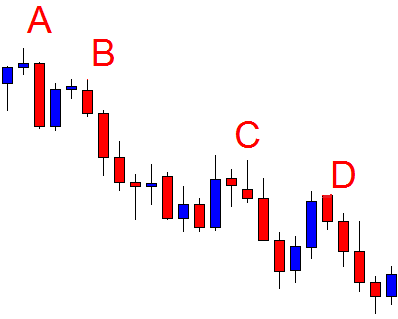
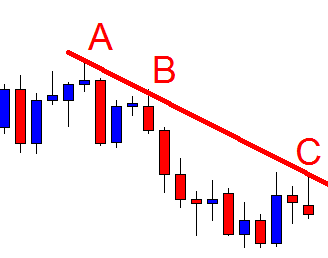
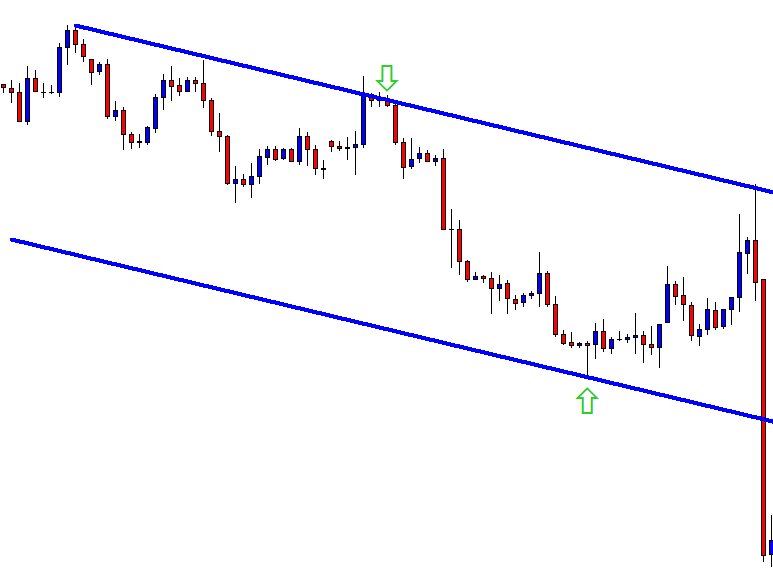
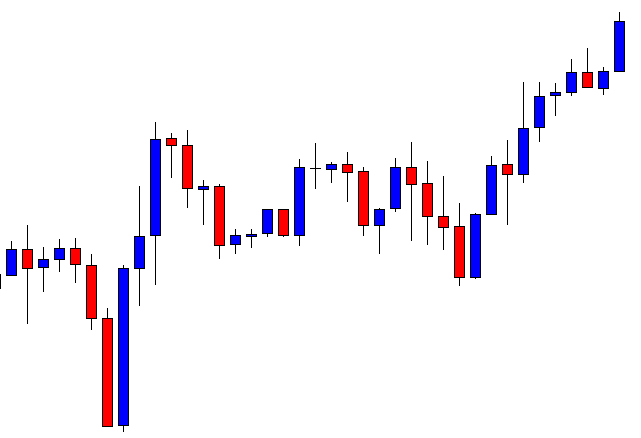
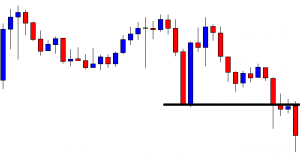
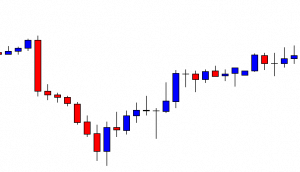
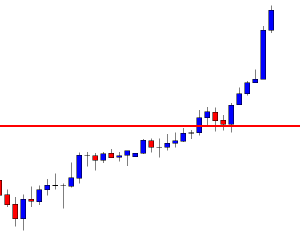
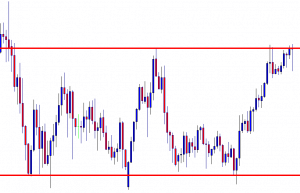
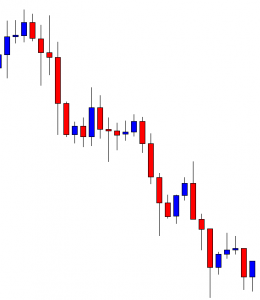
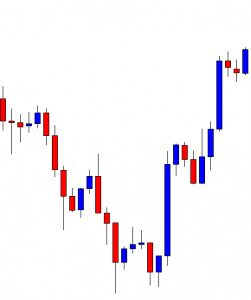
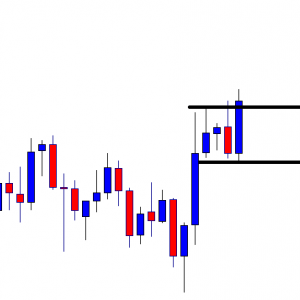
GBP/USD– Trading Tip

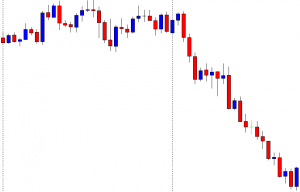
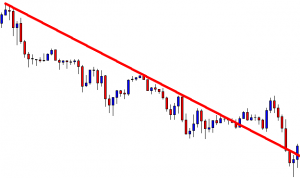
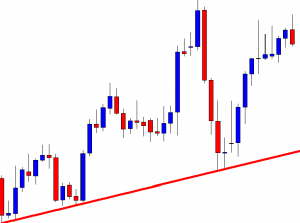
The GBP/USD is holding over a strong resistance become a support level of 1.2954 level. On the 4 hour timeframe, the Cable has formed an upward channel supporting the pair around 1.2950 and 1.2925 level. Whereas, the resistance stays at 1.3003 and 1.3058 level. The MACD and 50 EMA support bullish bias, which may keep the GBP/USD pair bullish over 1.2956 level. Let’s consider taking buying trades over 1.3000 level and bearish below the same level to target 1.2956. 


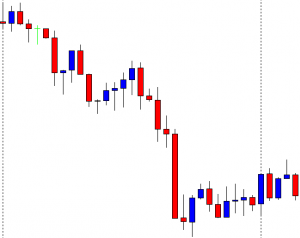
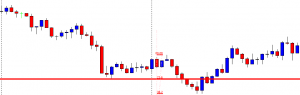
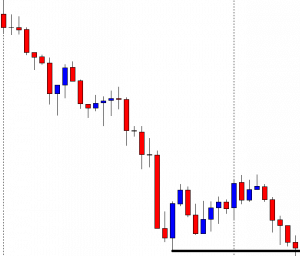
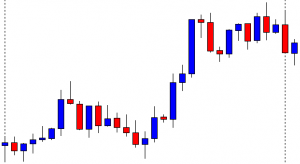
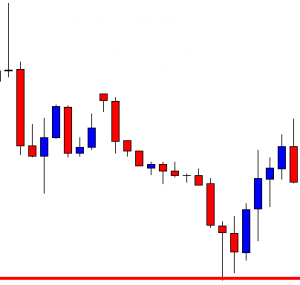
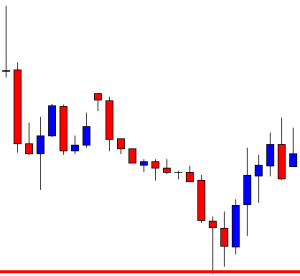
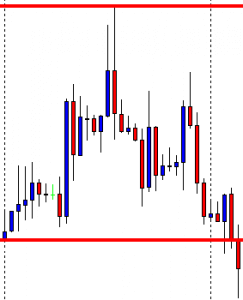
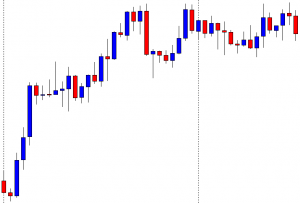
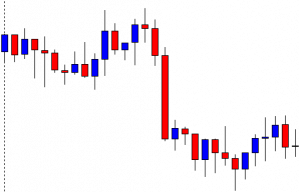
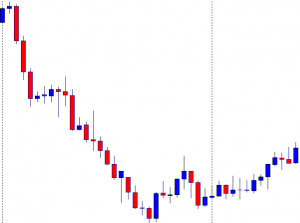
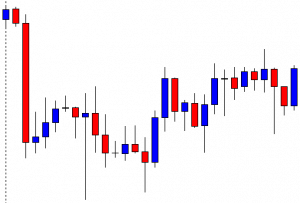
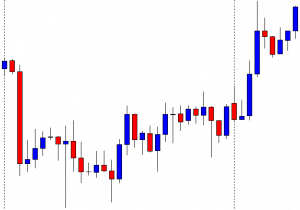
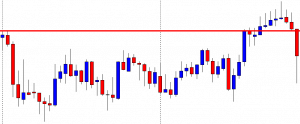
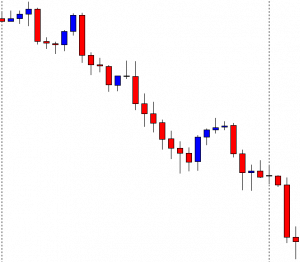
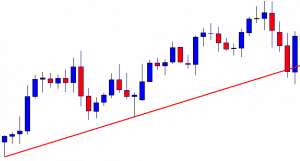
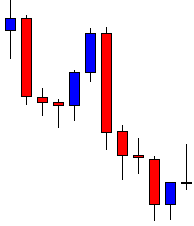
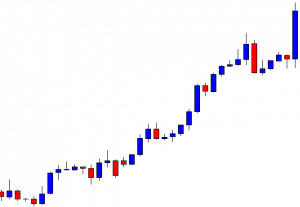
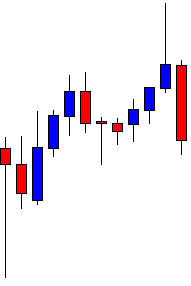
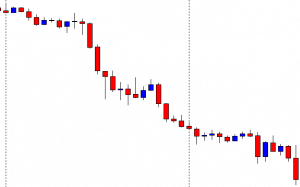
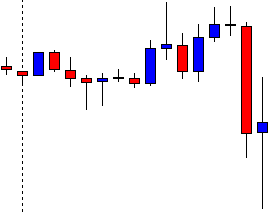
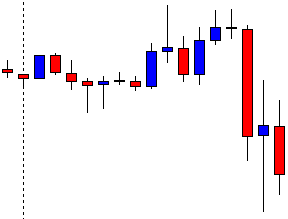
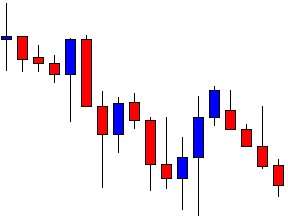
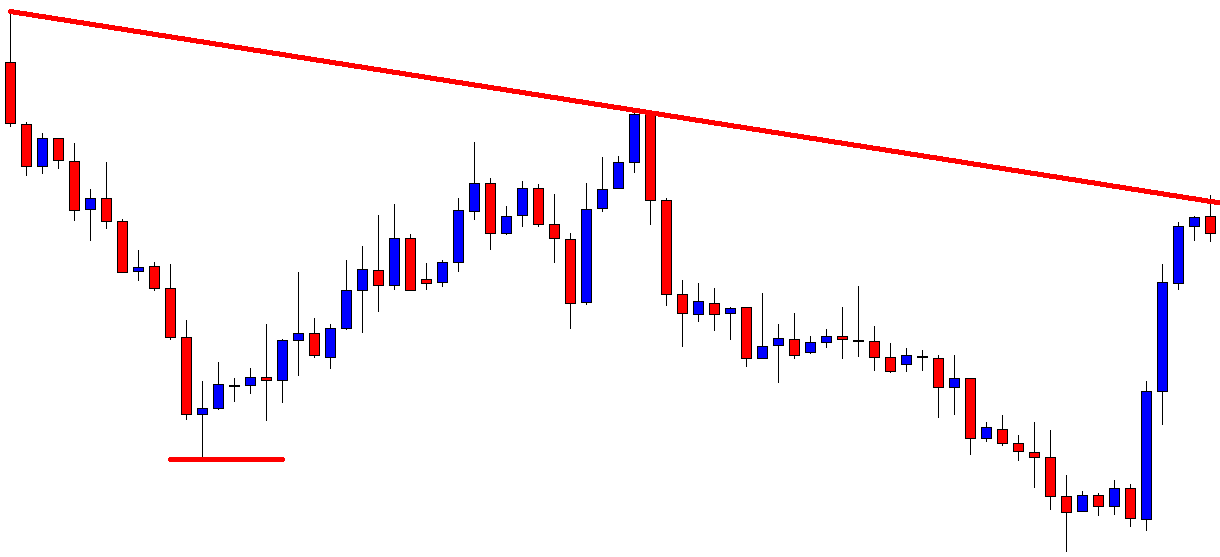
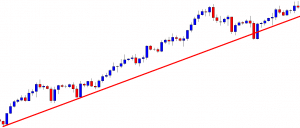
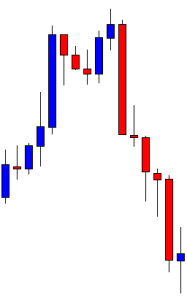
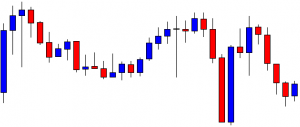
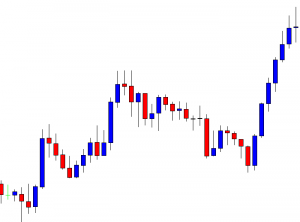
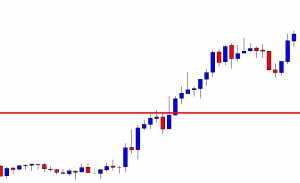
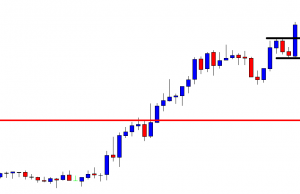
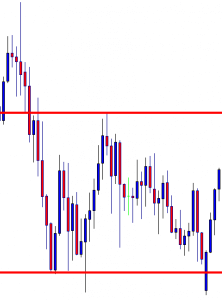
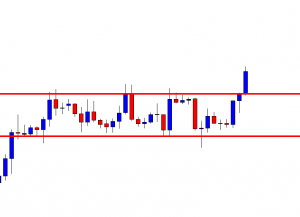
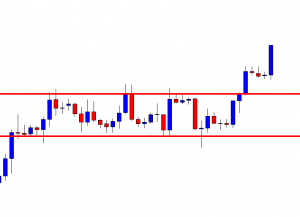
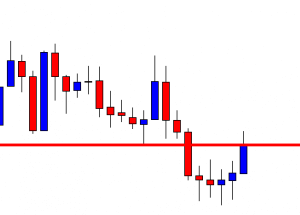
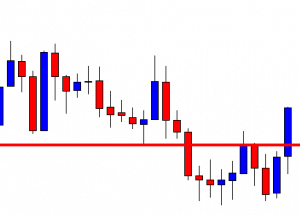
USD/JPY – Daily Analysis

The USD/JPY pair was closed at 105.735 and a high of 105.792 and a low of 105.228. Overall the movement of the USD/JPY pair remained bullish throughout the day. After posting hefty losses on Friday, USD/JPY reversed its direction and moved higher on Monday amid the improved risk sentiment and rising optimism in the market. 

The market’s mood was improved on Monday after a bumpy weekend related to the concerning news about the health of U.S. President Donald Trump. The Leader of the world’s largest economy was tested positive for coronavirus on Friday and was shifted to a military medical facility for treatment. The Contradictory headlines about his health and its effects on upcoming Presidential elections were raising concerns throughout the weekend. However, after the weekend, the news suggested that Trump was recovering, and he will be released from the hospital as soon as Monday. 

This news canceled the above fears and raised optimism around the market, boosting risk sentiment. The U.S. equities and the U.S. Treasury yields raised on the day, giving a boost to the U.S. dollar. Simultaneously, the rising risk sentiment weighed on the safe-haven Japanese Yen and pushed the USD/JPY pair on Monday.

On the data front, at 18:45 GMT, the Final Services PMI in September from the United States remained flat with the forecasts of 54.6. While at 19:00 GMT, the highlighted ISM Services PMI from the United States rose to 57.8 against the forecasted 56.3 and supported the U.S. dollar.

The ISM Services PMI showed an expansion in U.S. services activities in September and raised hopes for the quick economic recovery that helped improve the market’s risk sentiment and weighed on the Japanese Yen due to its safe-haven nature and ultimately pushed the USD/JPY pair even higher.

Moreover, the risk sentiment was also supported by the better than expected Retail Sales report from the European Union on Monday that doubled the expected number and supported riskier assets. The European stocks raised after this report, and U.S. stocks followed them that raised the market’s risk sentiment and helped the riskier GBP/USD pair gain further in the market.

Meanwhile, the USD/JPY pair’s gains remain limited by the rising fears of a second wave of coronavirus globally in the winter season. From all across the globe, the reports were suggesting a rising number of coronavirus cases. Europe struggled hard to fight against the pandemic and contained the spread as France and the U.K. saw a continuous rise in the number of daily count on infection cases. 

Meanwhile, other countries like Oman, Israel, India, France, Canada, UK, and Japan also reported a rise in the number of infected people. This raised global concerns supported the safe-haven appeal and capped further gains in the USD/JPY pair.

Daily Technical Levels

Support Resistance

105.39    105.91

105.08    106.12

104.88    106.43

Pivot point: 105.60

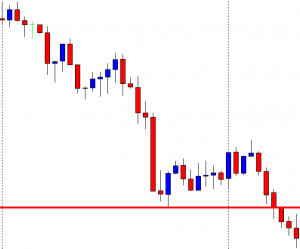
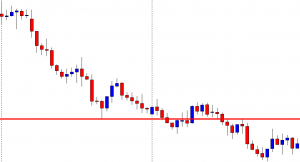
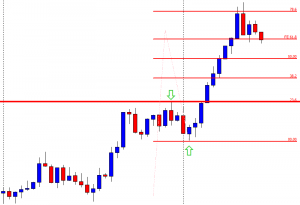
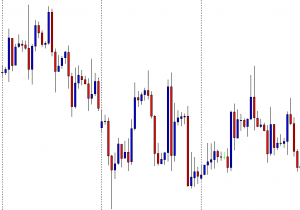
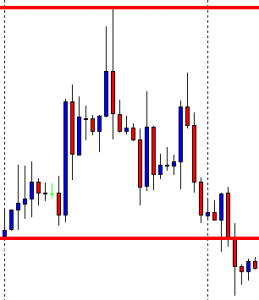
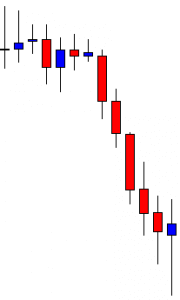
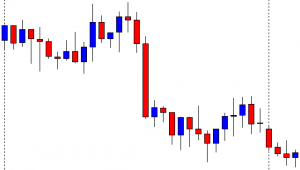
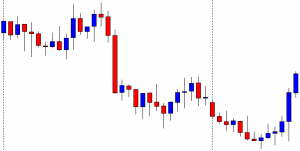
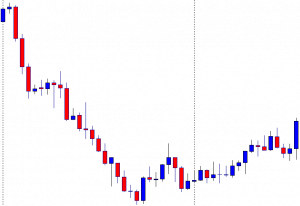
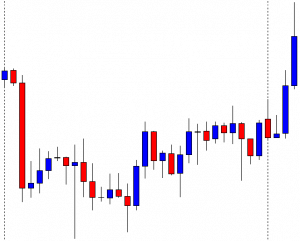
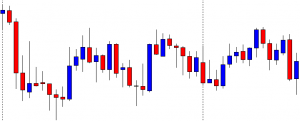
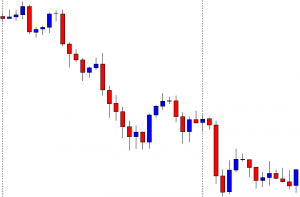
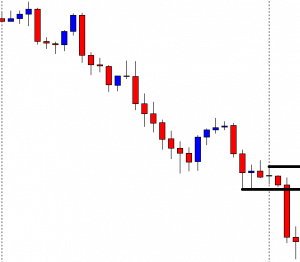
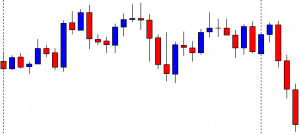
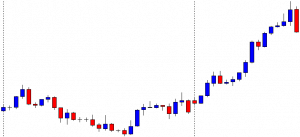
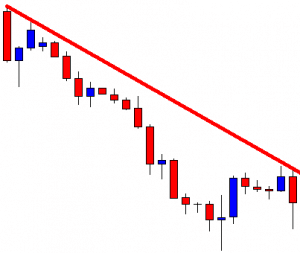
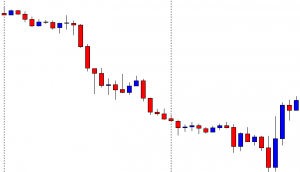
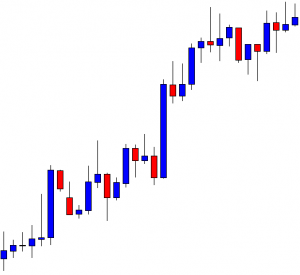
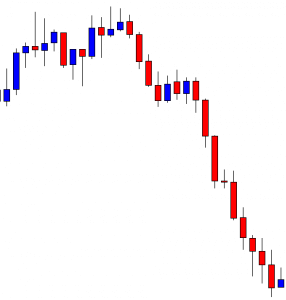
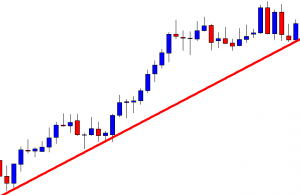
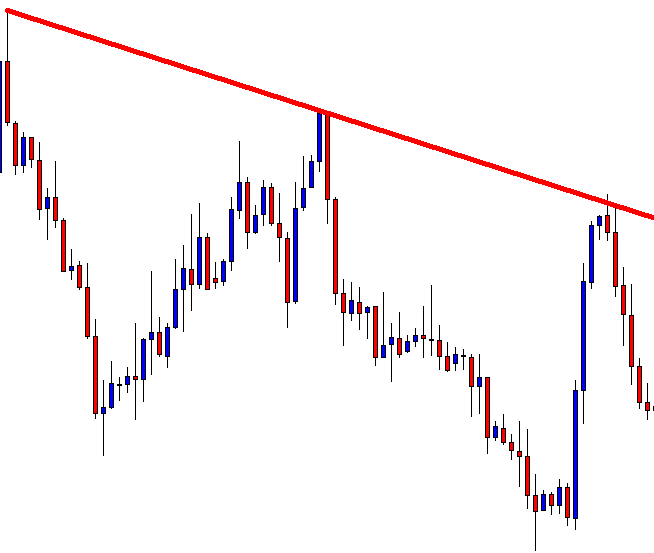
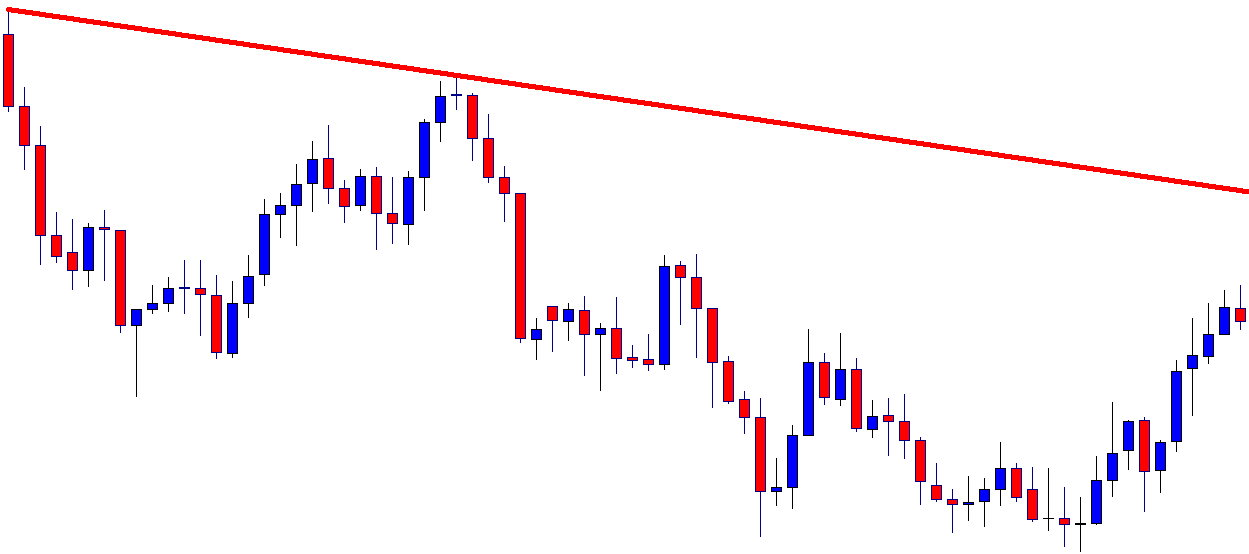
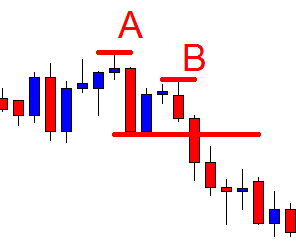
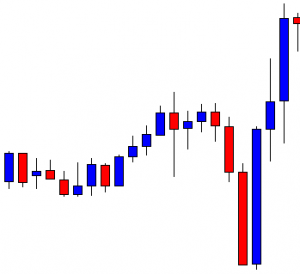
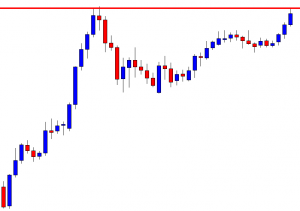
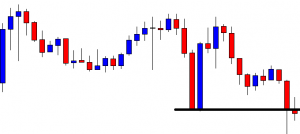
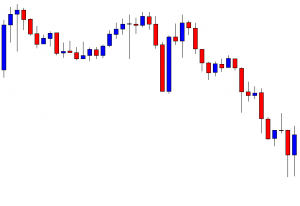
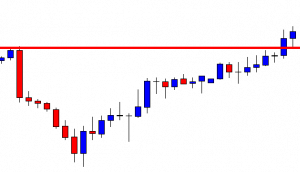
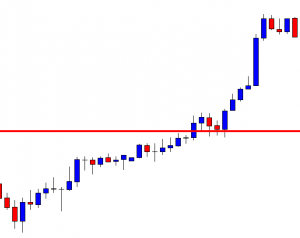
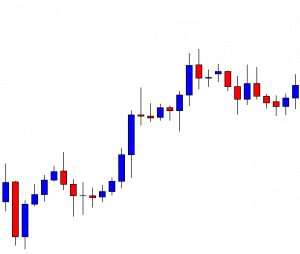
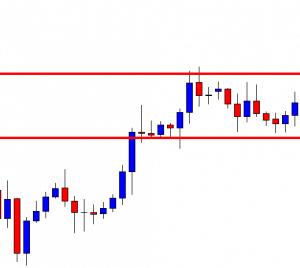
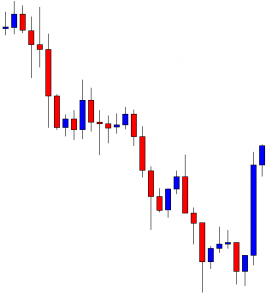
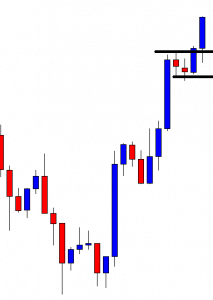
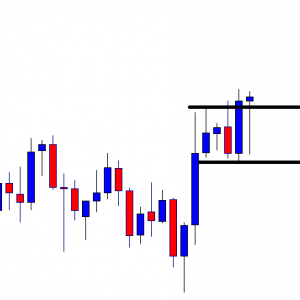
USD/JPY – Trading Tips

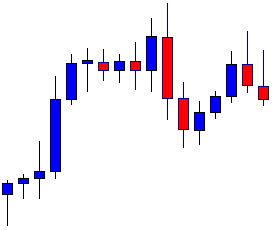
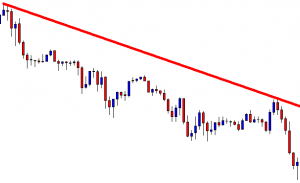
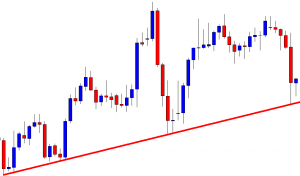
The USD/JPY is also trading bullish at 105.650 over the stronger U.S. dollar; however, the recent bullish bias in safe-haven Japanese yen drives a slight bearish correction in the market. On the 4 hour chart, the double top resistance level of the 105.800 level keeps the pair bearish. In case of a bullish breakout, the 105.800 resistance level may lead the USD/JPY pair towards the next target level of 106.240. On the lower side, the USD/JPY may find support at 105.400 level today. I will be looking to take a buy position over the 105.810 level. Good luck! 

Categories
Forex Daily Topic Forex Price Action

Weekly High/Low Breakout Trading: Count the Breakout Candle’s Attributes

In today’s lesson, we are going to demonstrate an example of an H4 breakout at the last week’s high. However, the price does not head towards the North as it usually does. Let’s find out why that happens.

The chart shows that the price after making a strong bearish move gets choppy. The H4 traders may wait for the price to make a breakout at either side. A bullish breakout may attract the buyers to go long in the pair. On the other hand, the sellers may wait for the price to make a bearish breakout.

The price produces a bearish candle to start the next week. The price finds its support, and it heads towards the North. However, the last weekly high is still intact. The buyers must wait for the breakout at the level to go long.

The price finds its intraweek resistance. It comes down. Intraweek support holds the price and produces a bullish inside bar. It is not a strong bullish reversal candle. However, it is produced at double bottom support. Let us wait and see whether it makes a breakout at the neckline or not.

The price heads towards the North and makes a breakout at the neckline. The candle closes within the last week’s high and consolidates. It then produces a bullish candle closing above the last week’s high. However, the candle has a long upper shadow. Considering its upper shadow, traders do not usually get attracted to trade upon such a breakout candle.

As anticipated, the chart produces some bullish candles with long upper shadow after the breakout. The price heads towards the North with a sluggish pace. It then produces a bearish Pin Bar and drives the price towards the breakout level again. A bullish reversal candle closing above consolidation resistance may attract the buyers to go long in the chart again. Let us find out what happens next.

The chart produces a long bearish candle with long lower shadow. The pair is trading within the last week’s range again. The H4 buyers have lost their hope. They may skip eying on the chart to concentrate on somewhere else.

If we look back, a double bottom, along with a breakout at the last week’s high, do not push the price towards the North. Most probably, this is because of the breakout candle’s attributes. We may still keep an eye on such a chart, but it would be wise to concentrate more on those charts, which makes a breakout with a commanding candle.


Categories
Forex Daily Topic Forex Price Action

Breakout at Weekly High/Low, Wait for Consolidation

In today’s lesson, we are going to demonstrate an example of an H4 breakout at the weekly low. The chart produces a strong bearish candle to make the breakout. The Bear looks good to make a strong move towards the South. However, the price does not head towards the downside. It rather gets choppy. Let us find out the reason behind it.

It is an H4 chart. The chart shows that the price makes a strong bearish move. It has a bounce at a level of support twice. If the price makes a breakout at the neckline, the buyers may look to go long in the pair upon bearish correction. On the other hand, the sellers may wait for the price to make a breakout at the week’s low to go short upon consolidation and getting a bearish reversal candle.

The chart produces a strong bearish candle breaching through the last week’s low. The breakout length is good as well. It means that the sellers may wait for the price to consolidate and to get a bearish reversal candle to go short in the pair. It seems that the sellers may dominate in the pair in this week as well.

The chart produces another bearish candle followed by a bullish engulfing candle. Producing a bullish engulfing candle to consolidate is not a good sign for the sellers. However, if the next candle comes out as a bearish engulfing candle closing below consolidation support, the sellers will be right on the track.

The chart does not produce a bearish engulfing candle. It rather produces another bullish candle. It seems that the price is having a bullish correction. When the H4 chart makes a breakout at the weekly low/high, the price is supposed to consolidate and produce a reversal candle to offer entry. If it makes a long bullish/bearish correction, it is assumed that the traders are not confident to take the price towards the trend. The chart shows that the price is obeying the level of support, where it has its first bounce.

The choppy price action continues. The H4 traders may wait for the price to make a breakout in the next week. The level of support becomes daily support now. Thus, weekly-H4 traders must wait to find the next direction.

We must remember when a pair trades within last week’s high and low, the price usually makes a correction. When it makes a breakout, it consolidates. If it takes too long or too many candles to make a breakout, traders may skip taking entry on that chart.

Categories
Forex Daily Topic Forex Price Action

Count the Breakout Length

In today’s lesson, we are going to demonstrate an example of a chart where the price makes an H4 breakout at the last week’s low. However, the chart does not offer entries. It rather gets choppy. We will try to find out the reason behind that. Let us get started.

It is an H4 chart. The chart shows that the price makes a bearish move and had a bullish correction. Upon producing a bearish engulfing candle, it heads towards the South again. The market is about to close for the weekend, and the sellers are going to wait for the H4 chart to make a bearish breakout and go short in the pair.

The chart produces a Doji candle to start its trading week. The next candle comes out as a bearish engulfing candle. It seems that the pair is going to make an H4 breakout at the week’s low soon.

The chart produces a long bearish candle closing well below the week’s low. It does not consolidate but produces a spinning top with a bearish body. The chart looks bearish, and the sellers may love to wait for the price to consolidate and to offer them a short entry. The question is whether they should wait to go short in the pair or not.

Look at those two drawn lines. One at the above indicates the highest high of the current week. The other one at the bottom indicates the lowest low of the last week. The difference between these two lines is vital. It determines the length of the next move. Usually, the price travels twice the distance of that length with good momentum. Once it travels three times that distance, the price usually makes longer consolidation or correction. The price travels three times that distance here. Thus, it may make a long bullish correction.

The chart produces a bullish engulfing candle followed by another bullish candle closing within the last week’s lowest low. The chart then creates an inverted hammer and drives the price towards the South. Look at the pace of that bearish move. It has been sluggish, and it suggests that the sellers are not interested in going short in this chart. The price has been roaming around the last swing low for quite a while. In a word, the H4 traders must wait for the price to give them the next direction. Meanwhile, it is a chart not to invest money and time in.

Categories
Forex Daily Topic Forex Price Action

Weekly High/Low Offers a Better Reward in the H4 Chart Trading

We are going to demonstrate an example of a trade setup on the H4 chart. The price, after breaches the last week’s low; it consolidates and produces a strong bearish reversal candle. It then heads towards the South with extreme bearish momentum. Let us find out how that happens.

It is an H4 chart. Look at the vertical line on the left. It is the beginning of the week. The chart shows that the price gets trapped within two horizontal levels. The pair is about to finish its trading week. The chart suggests that both the sellers and the buyers are going to keep their eyes on the chart next week to get the breakout and trade.

The pair produces two bullish candles consecutively to start its trading week. However, it produces a bearish engulfing candle and drives the price towards the South. Do you see anything here? Yes, the pair makes a breakout at the last week’s low. It means that the Bear may dominate on the H4 chart. Ideally, traders are to wait for the price to consolidate or make a bullish correction followed by a bearish breakout to go short in the pair.

The price consolidates. It produces some bearish reversal candles such as spinning top, hammer, Doji candle. However, it does not make a breakout at the last swing low. The sellers must wait for an H4 candle to close below consolidation support. Let us wait for more and see what the price does.

The chart produces a bearish engulfing candle closing well below consolidation support. The sellers may trigger a short entry right after the last candle closes. They may set their stop loss above consolidation resistance and set their take profit with 2R. This is the beauty of using weekly high/low and the H4 chart. It offers an excellent reward. Let us now proceed and find out how the entry goes.

The price heads towards the South with good bearish momentum. It produces three bullish inside bars in this move. The last candle comes out as a bullish engulfing candle. The sellers may consider closing their entry and come out with the profit. If we count, we find that the entry offers more than 2R reward. This is what usually happens when the price makes an H4 breakout at the last week’s high/low. Deep consolidation and a strong reversal candle add more fuel to its journey as usual. In our fore coming lessons, we will learn to integrate Fibonacci levels in this strategy to determine our target with better accuracy. Stay tuned.

Categories
Forex Price Action

It is Not over until It’s Over

In today’s lesson, we are going to demonstrate an example of a trendline trade setup. The price heads towards the North, and upon finding its support, it keeps moving towards the upside. At some point, it seems that the price is about to make a breakout at the trendline. However, the trendline works as a level of support and produces a beautiful bullish engulfing candle ending up offering a long entry. Let us find out how that happens.

The chart shows that the price makes a bullish move and comes down to make a bearish correction. It makes a bullish move again but finds its resistance around the same level. At the moment, the chart suggests that the bears have the upper hand.

The chart produces a Doji candle having a long lower spike. It pushes the price towards the North, and the price makes a breakout at the highest high. The last move confirms that the bull has taken control. The buyers may look for buying opportunities. Assume you are a trendline trader. Do you see anything?

Yes, you can draw an up-trending trendline. The last candle comes out as a bearish engulfing candle. It suggests that the price may make a bearish correction. As a trendline trader, you are to wait for the price to produce a bullish reversal candle at the trendline’s support to go long on the chart.

The chart produces two more candles that are bearish. The last candle closes just below the trendline’s support. It seems that the price is about to make a breakout at the trendline. The next candle is going to be very crucial for both. If the next candle comes out as a bullish reversal candle, the buyers are going to push the price towards the North. On the other hand, if the next candle comes out as a bearish candle closing below the trendline’s support, the sellers may push the price towards the South. Let us find out what happens next.

The chart produces a copybook bullish engulfing candle. Traders love to get this kind of reversal candle. The buyers may trigger a long entry right after the last candle closes. Let us proceed to find out how the trade goes.

The price heads towards the North with good bullish momentum. It makes a breakout at the last swing high as well. It means the trendline is still valid for the buyers. The chart produces a bearish reversal candle. Thus, the buyers may consider taking their profit out here.

If we look back, we find that the trendline’s support produces an excellent bullish reversal candle, which some buyers may not expect. This is what often happens in the market. Thus, never give up until its really over.

Categories
Forex Daily Topic Forex Price Action

What Does A Combination of Double Top and Evening Star Do?

We know a double top is a strong bearish reversal pattern. When the price trends with a double top, it usually creates strong bearish momentum. At consolidation, if it produces an evening star, it creates more momentum that is more bearish since the evening star is a strong bearish reversal pattern as well. In today’s lesson, we are going to demonstrate an example of that.

The chart shows that the price has been roaming around within two horizontal levels. It has several rejections at the resistance zone. At the last two rejections, it produces two bearish engulfing candles. Moreover, the last candle breaches through the level of support or the neckline. It means the chart may get bearish since it produces a double top.

As expected, the price heads towards the South with good bearish momentum. The sellers are to wait for the price to consolidate and a bearish reversal candle/pattern to go short in the pair.

It seems that the price may have found its support. It produces a bullish inside bar followed by a Doji candle. If the price makes a breakout at the level of consolidation support, the sellers may go short in the pair and drive the price towards the South.

The chart produces a bearish engulfing candle closing well below consolidation support. It is a strong bearish reversal candle itself. The combination of the last three candles is called the evening star, which is a very strong bearish reversal pattern. It suggests that the price may get very bearish soon. The sellers may trigger a short entry right after the last candle closes by setting stop-loss above the last candle’s highest high. We talk about the take-profit level in a minute. Let us find out how the trade goes.

The price heads towards the South with extreme bearish momentum. The last candle comes out as a bullish engulfing candle. It may make a bullish correction or reversal now. However, before producing the bullish engulfing candle, the price travels 2R. Even if the sellers close the entry at the last candle close, they make 1R profit.

When a trend starts with a strong reversal pattern such as the double top/double bottom, morning star, evening star, and it produces a strong reversal pattern at consolidation as well, the price usually produces a longer wave. Trade management is to immaculate, though. Thus, make sure that the trade is made relatively on a bigger time frame such as the H4, the daily, the weekly, etc.

Categories
Forex Daily Topic Forex Price Action

Using Weekly High or Weekly Low in the H4 Chart Trading

The Weekly high or Weekly low plays a significant part in the H4 chart traders. In today’s lesson, we will demonstrate an example of how last week’s high works as a level of support and pushes the price towards the upside by offering a long entry to the buyers. Let us get started.

It is an H4 chart. Look at the vertical dotted line. The price starts its week with a spinning top having a bullish body. The price then heads towards the North and come down again. In the end, the price closes its week around the level where it starts its trading week.

The pair starts its week with a spinning top having a bearish body this time. The price heads towards the North and makes a breakout at the last week’s high. The price usually comes back at the breakout level to have consolidation and ends up offering entry upon producing a reversal candle. Let us draw the breakout level to have a clearer picture.

The drawn line indicates the last week’s high. Now, the H4 chart suggests that the price made a breakout, and the pair is trading above the level currently. The buyers are to wait for the price to consolidate and produce a bullish reversal candle to go long in the pair.

The chart produces a bearish candle closing within the breakout level first. The next candle comes out as a Doji candle. The buyers are to wait for a breakout at consolidation resistance to go long in the pair. Let us proceed to the next chart to find out what the price does next.

The chart produces three more bullish candles. One of the candles breaches through the level of resistance closing above it. The buyers may trigger a long entry right after the last candle closes. The buyers may set their stop loss below the breakout level. To set the take-profit level, the buyers may set their take profit with 2R. It is the best thing about this trading strategy. It offers at least 2R. Sometimes the price travels even more than 2R. Let us find out how the trade goes.

The price heads towards the North with good bullish momentum. Before hitting 2R, it produces a bearish inside bar. It continues its journey towards the North and travels more than 2R. The last candle comes out as a bearish engulfing candle. It suggests that the price may get bearish now.

The best things about using the strategy are

  1. Traders know where the price is going to consolidate.
  2. Which level is going to produce the signal candle.
  3. It offers an excellent risk-reward.
Categories
Forex Daily Topic Forex Price Action

Keep an Eye at the Last Daily Candle’s Closing

In today’s lesson, we are going to demonstrate an example of the daily-H4 chart combination trading. In the daily-H4 chart combination trading, the daily chart plays a very significant role. As long as the price in the daily chart heads towards the trend, the traders may find the opportunities to take entry. Let us now proceed and find out what that means.

It is a daily chart. The chart shows that the price heads towards the North with good bullish momentum. The last candle comes out as an inverted hammer with a tiny bullish body. The long upper shadow suggests that the price has a strong rejection at a level of resistance. Nevertheless, the candle has a bullish body, and the candle closes above its last candle’s highest high. Thus, the daily-H4 combination traders may flip over to the H4 chart to go long in the pair.

This is how the H4 chart looks. It produces a bearish engulfing candle followed by a spinning top. It seems that the price may have found its support. If the price makes a breakout at the last swing high, the buyers may go long in the pair.

The chart produces two more bullish candles. The last candle comes out as a hammer with a bearish body. It seems that the price does not know where to go. Traders must be patient here.

The chart produces a bullish engulfing candle closing well above the last swing high. The buyers may trigger a long entry right after the last candle closes. It seems that the bull may make another strong move towards the North. Let us find out how the trade goes.

As expected, the price heads towards the trend with extreme bullish pressure. It hits 1R by the next candle. The candle closes with a thick bullish body. It means that the buyers still have control in the chart. Thus, the buyers may wait for the price to consolidate and get a bullish reversal candle followed by a bullish breakout to go long and drive the price towards the North further.

If we concentrate on the daily chart, we see that the last daily candle is not a strong bullish candle. However, consolidation and a bullish engulfing candle in the H4 chart attract the buyers to go long in the pair. As long as the daily candle closes above/below the last candles highest high/lowest low, the daily-H4 chart combination traders shall keep their eyes in the H4 chart for finding trading opportunities.

Categories
Forex Daily Topic Forex Price Action

Double Top and Evening Star Drive the Price Far Down to Consolidate

In today’s lesson, we are going to demonstrate an example of a double top offering an entry, not right after the breakout. It rather offers an entry upon finding its resistance, which is well below the neckline level. Let us find out how that happens.

The chart shows that the price gets trapped within two horizontal levels. It produces a bearish engulfing candle but heads towards the North upon having a bounce at the level of support. The last candle comes out as a Doji candle around the resistance zone. Let us find out what happens next.

The chart produces a bearish engulfing candle closing well below the neckline. The chart produces an evening star to make the breakout. It suggests that the price may head towards the South with good bearish momentum.

The price heads towards the South with three more candles. However, the price does not consolidate around the neckline. Thus the sellers in the chart may find it difficult to go short in the pair. Let us wait and see whether it consolidates or not.

The chart produces two bullish corrective candles. If the price finds its resistance and produces a bearish reversal candle, the sellers may go short below the last swing low.

The chart produces a bearish engulfing candle closing well below the last swing low. The sellers may trigger a short entry right after the last candle closes by setting stop-loss above the candle’s highest high and by setting take profit with 1R.

The price travels a long way towards the South. The last candle comes out as a bullish inside bar. It is a weak bullish reversal candle. However, the way the price has been heading towards the South; it suggests that the price may continue its bearish move. However, many sellers may want to close their entries and come out with the profit after the last candle.

Usually, traders wait for the price to consolidate and produce a reversal candle at the breakout level. However, when a trend starts with a strong reversal pattern, such as the morning star/evening star, the price may not consolidate around the neckline level. Nevertheless, if the chart allows the price space to travel, traders may wait for the price to consolidate and to get a reversal candle to trade. This is what happens here. The price finds its resistance, not at the neckline but somewhere else, and produces a strong bearish engulfing candle offering an entry.

Categories
Forex Daily Topic Forex Price Action

Trendline Trading: A Trendline forming with a Tiny Slope

In today’s lesson, we are going to demonstrate the formation of a down-trending Trendline. A trendline can be formed with a double top or double bottom as well. However, double top’s resistance or double bottom’s support may not be horizontal. Let us find out how they may look in the chart.

The chart shows that the price heads towards the South with moderate bearish pressure. The last candle comes out as a bearish engulfing candle closing well below the last swing low. The sellers may wait for the price to consolidate or make a bullish correction to go short.

The chart produces two bullish candles. The price has a rejection from the zone where it had a rejection earlier. The last rejection does not come from horizontal support, but it looks adjacent to that. Thus, it can be considered as a double top’s resistance zone.

The price heads towards the South by making a breakout at the last swing low. It produces a bullish inside bar. If the chart produces a bearish reversal candle, the sellers may go short below the last swing low. Let us proceed to find out what happens next.

The price gets bearish by making a breakout at the last swing low. Look at the last three candles. The combination of these three candles is called Morning Star. It seems that the price may make a long bullish correction. Can you guess where the price may find its next resistance?

We can draw a down-trending trendline here by using those points of the double top. Look at the price action around the trendline’s resistance. The last candle comes out as a bullish candle with an upper shadow. A bearish reversal candle at the trendline’s resistance may drive the price towards the South again.

The trendline’s resistance produces a bearish engulfing candle. It has a long lower shadow, though. The sellers may go short below the last candle’s lowest low. Let us find out what the price does.

As expected, the price makes a strong bearish move and makes a new lower low. Thus, the sellers may wait again for the price to go towards the trendline’s resistance and get a bearish reversal candle to go short in the pair. In a word, a very valid trendline is in play in this chart. Do you remember how it has started? It has started from a point that does not seem to form a trendline. The slope has been tiny, making it difficult to spot out. However, the market often produces such a trendline with a tiny slope, which shall be taken into account by the trendline traders.

Categories
Forex Price Action

An Interesting Fact about Equidistant Channel

In today’s lesson, we are going to demonstrate an example of the formation of an up-trending equidistant channel. Usually, the price forms an up-trending equidistant channel by having two bounces and one rejection. However, the price sometimes determines the upper band first by having two rejections. In today’s lesson, this is what we are going to demonstrate.

The chart shows that the price makes a bullish move and produces a bearish engulfing candle. The last candle in the chart comes out as a doji candle with a long lower shadow. It suggests that the price finds a strong level of support in the minor charts.

The price heads towards the North and has a strong rejection. The last candle comes out as a bearish engulfing candle again. A candle with a long upper shadow followed by a bearish engulfing candle may drive the price towards the South.

It does not. It produces a bullish engulfing candle and pushes the price towards the North. The chart produces an inverted hammer. The long upper shadow suggests that the price has a rejection from a strong level of support. So far, we have noticed that the price is up-trending by making new higher highs. Do you notice anything else? Let us proceed.

After making a bearish correction, the price finds its support. It produces a bullish engulfing candle and pushes the price towards the North. The last candle comes out as a bullish candle with a long upper shadow though. It is more evident now that the price is up-trending by obeying an equidistant channel.

Upon finding its support, it produces a bullish inside bar. It seems that the buyers based on the equidistant channel may go long in the pair. We have not drawn the channel yet. The reason is we have to be able to spot out the channel by looking at the price action. Let us now draw an equidistant channel and see how the price has been obeying it.

It looks like a copybook equidistant channel. It offers two good long entries. Do you notice one thing here? The price gives a clear sign that it may form an up-trending equidistant channel at the very outset. When it has its second rejection, it does not trend from the lower band. However, it determines its upper band, which helps traders sniff about a potential up trending equidistant channel. This is what happens so often. The price may determine its upper band first not by bouncing off at the lower band or it may determine its lower band by not having rejection from the upper band.

Categories
Forex Daily Topic Forex Price Action

Double Top/Double Bottom and Intraday Trading

In today’s lesson, we are going to demonstrate an example of a double top that drives the price towards the downside in an intraday chart. The double top/double bottom usually makes the price bearish if they are formed in a major chart. However, they work in the same way in minor charts as well. Let us find out how it drives the price in an H1 chart. Let us get started.

It is an H1 chart. The chart shows that the price makes a long bearish move. The chart belongs to the sellers. The sellers may wait for the price to make a bullish correction and produce a bearish reversal candle at flipped resistance to go short in the pair.

The chart makes a strong bullish move instead, upon producing a bullish engulfing candle. The last candle comes out as a bullish engulfing candle after consolidation. It seems that the buyers are dominating the minor charts.

The price does not continue its bullish move. It has been in long consolidation. The price is roaming around the level of resistance, where it has had a bounce. A bullish breakout may attract the buyers to go long in the pair. On the other hand, a bearish reversal candle at a double top resistance may make the sellers wait to go short in the pair below the neckline.

The chart produces a long bearish candle closing below the neckline. It suggests that the Bear may dominate in the pair. The sellers are to wait for the price to consolidate and produce a bearish reversal candle to go short in the pair. Let us find out what happens.

The next candle comes out as a spinning top closing within the breakout level. It seems that the pair is getting ready to get bearish. The sellers are to keep their close eyes in the pair to get a bearish reversal candle and a breakout at the lowest low to trigger a short entry.

Here it comes. The pair produces a bearish engulfing candle. The candle’s body engulfs the last candle’s body. However, the sellers may wait for the price to make a breakout at the lowest low of the last candle (wick’s lowest low). It is very important as far as intraday trading is concerned.

The price breaches the wick’s lowest low and heads towards the South with good bearish momentum. It travels a long way by offering 1:2 risk-reward. It’s a good thing about intraday trading that it offers good risk-reward.

We have demonstrated an example of a double top driving the price towards the downside in the H1 chart. They work in any time frame from 1M to 1Month. However, it is better not to use it in too minor time frames such as the 1M, 5M, 15M.

Categories
Forex Daily Topic Forex Price Action

Trendline Trading: How a Trend upon a Trendline Run Longer

In today’s lesson, we are going to demonstrate an example of a chart that made a long bearish move obeying a bearish trendline. The price after forming a bearish trendline does not offer entry to the sellers. It makes a breakout at the first trendline and then produces another bearish trendline ending up offering short entries. Let us now have a look at the chart and find out how it happens.

The chart shows that it makes two swing lows trending from two swing highs. By joining those points, we can draw a trendline shown in the above chart. The sellers may wait for the price to go back at the trendline’s resistance and produce a bearish reversal candle to go short in the pair. However, the price action has been choppy around the trendline’s resistance. The last candle comes out as a bullish engulfing candle. It does not look good for the sellers.

The price makes a breakout at the trendline’s resistance. It heads towards the North and then makes a strong bearish move. Such price action may puzzle traders. Do you notice something interesting here? Have a look at the next chart.

The sellers may draw another bearish trendline by joining two swing lows. As long as the price makes new lower lows, we can draw a bearish trend line by joining two higher highs. We know what sellers are to do here. Yes, they are to wait for the price to go back to the trendline’s resistance and produce a bearish reversal candle to go short in the pair.

The chart produces a bearish inside bar. It is not a strong reversal candle. However, it is produced at a trendline’s resistance. The sellers may keep their eyes in the pair to go short according to their trading strategies. The price may find its next support at the last swing low. The chart shows that the price has enough space to travel towards the South.

The price heads towards the South at a moderate pace. It makes a long bearish wave, though, by making a breakout at the horizontal support. In the end, it comes out as an excellent trade for the sellers.

If we recap, the first drawn trendline is disobeyed by the price. It is breached, and the chart looks slightly bullish biased. It does not make any more bullish breakout but makes a long bearish move by making a breakout at the last swing low. It gives the sellers an opportunity to draw another bearish trendline, and that ends up offering an excellent entry.

Categories
Forex Price Action

When Key Fibonacci Level Produces an Engulfing Candle

In today’s lesson, we are going to demonstrate an example of a chart that makes a strong bullish move upon producing a bullish engulfing candle at a key Fibonacci level. We know an engulfing candle creates good momentum. If it is created at a significant Fibonacci level, it often pushes the price towards the trend further than traders’ expectations. Let us see and find out what and how that happens.

It is an H1 chart. The chart shows that the price heads towards the South. It keeps making new lower lows. At the last bounce, the chart produces a Morning Star. It may make a bullish reversal now. Let us wait and see whether it makes a breakout at the last swing high or not.

The chart produces four consecutive bullish candles. The price breaches the last swing high. The buyers may wait for the price to consolidate around the breakout level and get a bullish reversal candle to go long in the pair.

It produces a bearish candle closing within the breakout level. The buyers may keep their eyes sharp to see how the next candle comes out. A bullish reversal candle followed by a breakout at the highest high is the signal to trigger a long entry. If the reversal candle comes out as a bullish engulfing candle closing above the resistance, the buyers may trigger a long entry right after the candle closes.

The candle comes out as a bullish engulfing candle closing well above the resistance. The buyers may trigger a long entry right after the candle closes. Since it is an H1 chart, Fibonacci levels come extremely handy to determine the take profit level. We find out that in a minute. At first, let us find out what the price does.

The price heads towards the North with extreme bullish momentum. It produces only one bearish candle and resumes its bullish journey. With naked eyes, we can tell that the price travels about 4R. It means as far as risk-reward is concerned, it is an excellent deal. Let us draw Fibonacci and see price trends from where to where.

The price makes the bullish reversal at 61.8% and heads towards the level of 161.8% in a hurry. It makes a breakout at 161.8% consolidates and resumes its bullish move. Ideally, the buyers should set their take profit at 161.8%. It would allow them to take 1:2 risk-reward. However, we have seen here that the price travels towards the North even further than that. It often happens when the reversal candle comes out as a bullish engulfing candle, and it is produced at the key Fibonacci level at 61.8%. We may not be too greedy but set our take profit at 161.8% in such cases. However, back in our mind, we know that we are dealing with an excellent trade setup.

Categories
Forex Daily Topic Forex Price Action

Trend Line Trading: The Entries to be Skipped

In today’s lesson, we are going to demonstrate an example of a chart that trends towards the North by obeying a trendline. It offers a long entry once the trendline is established. At the fourth bounce, it produces a bullish reversal candle. We find out whether the buyers should take a long entry or not upon getting the bullish reversal candle at the trendline’s support. Let us get started.

The chart shows that the price heads towards the North upon producing a bullish reversal candle. It consolidates and resumes its bullish journey. The chart looks like the buyers’ hunting ground.

The price upon producing a spinning top, it produces a long bearish candle. It consolidates with some candles and produces a bullish engulfing candle. The buyers may keep an eye in the chart to go long above the last swing high. If the price makes a bullish breakout, the buyers get two swing lows and two swing highs to draw an uptrending trend line.

Here it goes. The price makes a bullish breakout and heads towards the North further. The chart produces a bearish engulfing candle. It may make a bearish correction. As it looks, the chart belongs to the Bull without any doubt.

The price makes a bearish correction; consolidates and heads towards the North again. The breakout traders may find a long opportunity and grab some pips. The price makes a long bearish correction. In fact, it makes a breakout at a significant level of swing low. It seems that the chart is slightly bearish biased. Have a look at the chart below.

The trendline’s support holds the price and produces a bullish engulfing candle. The trendline traders may go long in the pair right after the last candle closes. The last swing high is the safest option to set take profit. It means the risk-reward ratio looks good for the trendline traders.

The price heads towards the North with good bullish momentum. However, it seems that the horizontal level of resistance is too strong to be breached. The price consolidates here with several candles. The last candle comes out as a bearish engulfing candle. The buyers may close the entry. The question is does the price come back to the trendline’s support or it makes a breakout at the highest high.  Let us proceed to the next chart and find out what happens.

The price comes back at the trendline’s support. It produces a hammer. Should the buyers go long from here as far as trendline trading is concerned? Think about it for a minute.

If your answer is ‘No’, you are right. The reason why the buyers should not go long from here is it does not make a new higher high upon getting its last bounce. In fact, traders may wait for the price to make a breakout at the trendline’s support and go short in the pair. In our forthcoming lessons, we will learn about trendline breakout and trendline breakout trading. Stay tuned.

Categories
Forex Price Action

Fibonacci Trading: Fibonacci Levels Maximize Profit for Intraday Traders

In today’s lesson, we are going to demonstrate an H1 chart offering an entry by using intraday support/resistance. To go with it, Fibonacci levels are used to spot out the stop-loss and take-profit levels. Let us now get started.

The chart shows that the price makes a long bearish move. The H1 chart makes a breakout at the last day’s lowest low (black drawn line). Usually, the chart attracts the sellers to look for short opportunities upon getting a bearish reversal candle. However, look at the combination of the last three candles. It is called Morning Star, which is one of the strongest bullish reversal patterns.

The price heads towards the North and goes back in the last day’s lowest low. Moreover, it makes a breakout at today’s highest high as well (black drawn line). Within four candles, the chart looks good for the buyers. The buyers may look to go long in the pair upon getting a bullish reversal candle at the breakout level.

The chart produces a bearish candle. The breakout level seems to hold the price as a level of support. A bullish reversal candle at the level may attract the buyers to go long and push the price towards the North further.

Here it comes. The chart produces a bullish engulfing candle right at the breakout level. The buyers may trigger a long entry right after the last candle closes by setting stop loss below the lowest low of the signal candle. We are going to talk about the take profit level in a minute. Let us find out how the trade goes.

The chart produces a bullish candle. The price heads towards the upside with the next candle as well. However, the candle comes out as a Doji candle having a long upper shadow. It suggests that the price may make a bearish correction or make a bearish reversal. Since the trade setup is based on the H1 chart, the buyers may lose a good number of pips if they are to wait for the chart to produce a reversal candle to close their entry. It is tough to manage trade in the H1 chart manually. Thus, setting the take profit is the best way. The question is, where should we set our take profit? In this regard, Fibonacci levels come extremely handy. Let us draw the Fibonacci levels in the chart and find out how they work in the chart above.

There you go. The price produces a bullish reversal candle at 61.8% level and heads towards the level of 161.8%. It means the buyers may achieve 1:2 risk-reward easily by using Fibonacci levels in intraday trading. In our fore coming lessons, we are going to demonstrate more examples of integration of Fibonacci levels and intraday trading. Stay tuned.

Categories
Forex Daily Topic Forex Price Action

A Classic Example of Trading on a Double Top

Last week, in one of our lessons, we showed an example of how the price gets bullish based on the double bottom and flipped support. In today’s lesson, we are going to demonstrate an example of a double top and flipped resistance. a Double Top is the opposite of a Double Bottom, so it drives the price towards the South. It is one of the strongest bearish reversal patterns. Traders love to go short when a chart produces a double top in the Forex market. Let us now proceed and find out how it usually works.

The chart shows that the price heads towards the North and finds its resistance. It produces a bearish engulfing candle. Sellers on the minor chart may look to go short in the chart. However, the sellers in this chart may wait for either the price consolidates and makes a bearish breakout or to produce a double top.

The price finds its support and heads towards the level of resistance again. It consolidates around the level of resistance. A bearish reversal candle followed by a breakout at the last support may attract the sellers to go short in the pair since the chart would produce a double top, and the breakout would be a neckline breakout.

Here it goes. The price heads towards the South with good bearish momentum. It makes a breakout at the neckline and produces one more bearish candle. The sellers are going to wait to go short in the pair below the lowest low. However, it is best to wait for the price to consolidate around the breakout level and produce a bearish reversal candle to get a better risk-reward.

The price consolidates around the breakout level and produces a bearish engulfing candle at the breakout level. The sellers may go short below consolidation’s support by setting stop-loss above consolidation’s resistance and by setting a take-profit target with 1R at least. Please note, a double bottom/double top and consolidation around the neckline breakout level usually offers more than 1R. Let us find out how the trade goes.

The price heads towards the downside with extreme bearish momentum. It produces an inverted hammer. The price may make a bullish correction from here. Count the length that the price has traveled so far. It has traveled a long way offering about 6R to the sellers. One trade like this in a week may make a trader fulfilled. Thus, keep your eyes on patterns such as the Double Top/Double Bottom. Remember the procedure; wait for the price to consolidate and produce a reversal candle at the breakout level; trigger an entry below consolidation support/resistance, and manage your trade accordingly.

Categories
Forex Price Action

Trendline Trading: Be Sensible to Count or Not to Count Shadows

We are going to demonstrate an example of trendline trading in today’s lesson. The price, after being bearish, produces a bullish engulfing candle and heads towards the North. It makes a bearish correction and produces another bullish candle to make a bullish breakout at the last swing high. At the second bounce, the candles have tiny lower shadows. In the end, the pair makes another bullish move at the trendline’s support without counting those lower shadows at the second bounce. Let us now have a look at what and how that happens.

The price makes a bearish move makes a bullish correction and resumes its bearish journey. Upon finding its support, it produces a bullish engulfing candle at the last bounce in this chart. The chart is slightly bearish biased. Let us see what happens next.

The chart produces another bullish candle, consolidates, and heads towards the North. Then, it makes a bearish correction. A bullish reversal candle followed by a breakout at the highest high will make the chart a hunting ground for the buyers.

The chart produces a bullish engulfing candle and makes a breakout at the last swing high. It means the buyers may draw a trendline and wait for the price to come back at the trendline’s support to go long in the pair.

This is the drawn trendline, which is drawn by using the first two spikes. However, spikes at the second bounce are not counted. After the second bounce, the price heads towards the North, but it doesn’t come at the trendline’ support to offer a long entry to the buyers. As long as the price does not breach the trendline support, it is valid, and traders may wait for the price to come back at the trendline’s support and offer them a long entry.

Here it comes. The chart produces a bullish engulfing candle right at the trendline’s support. The buyers may go long right after the last candle closes by setting stop loss below the signal candle’s lowest low and by setting take profit with 1R. Let us find out how the trade goes.

The price hits 1R in a hurry. It then produces a spinning top. However, the next candle comes out as a bullish engulfing candle, which suggests that the buyers may wait again for the price to come back at trendline’s support to take another long entry.

If we use spikes of the second bounce, the trendline’s support would have more space for the price to travel. We have used spikes of the first bounce and candle’s bodies of the second bounce. Since both spikes of the second bounce cannot be added with a line, it is better to skip it. Moreover, the price at the third bounce produces a bullish engulfing candle. Most probably, the price is going to obey the trendline. This is what happens here, and this is what usually happens with a trendline.

Categories
Forex Daily Topic Forex Price Action

The Double Bottom and the Flipped Level of Support

In today’s lesson, we are going to demonstrate an example of a double bottom, which pushes the price towards the North. The example also proves an old theory of support becomes resistance or resistance becomes support after a breakout. Let us get started.

The chart shows that the price makes a bearish move and finds its support. The level of support produces a bullish candle, which is followed by two more bullish candles. The buyers may wait for the price to consolidate and produce a bullish reversal candle to go long in the pair.

The price makes a long bearish correction. It comes back to the level of support again. A bearish breakout may attract the sellers to go short and drive the price towards the South. On the other hand, the buyers may wait to get a bullish reversal candle at its second bounce.

The chart produces a bullish engulfing candle. Since it is produced at the second bounce, the buyers in the chart may wait for the price to make a breakout at the neckline and go long.

The price heads towards the North with good bullish momentum. It makes a breakout at the neckline and trades above the level for one more candle. The buyers would love to see the price to consolidate or make a bearish correction at the breakout level and produce a bullish reversal candle to trigger a long entry.

The price makes a bearish correction and produces a bullish engulfing candle closing above the level of resistance. The buyers may trigger a long entry right after the last candle closes by setting Stop Loss below the candle’s lowest low and by setting Take Profit with 1R. Here we must notice that the neckline level becomes the level of support. This is one of the most reliable theories in the financial market.

The price heads towards the North with extreme bullish momentum. It hits 1R in a hurry and travels towards the North further. The last candle comes out as a hanging man, which is a bearish reversal candle. However, it is not a strong one. The price may keep traveling towards the North. Anyway, the buyers achieve their target with the entry, which is taken on two theories.

  1. Double Bottom- A very strong bullish reversal pattern
  2. Resistance works as a level of support after the breakout.

In the case of a double bottom and neckline breakout, we may sometimes find that the price does not come at the breakout level. It consolidates well above and makes a bullish move. In some cases, the price may not hit the target. However, if the price comes and produces a bullish reversal candle at the breakout level, the price may hit the target in most of the cases.

Categories
Forex Daily Topic Forex Price Action

Trend Line Trading and Trade Management

In today’s lesson, we are going to demonstrate an example of trendline trading and how the trade may be managed. We know that trading with a trendline is very rewarding since an established trendline often ends up offering several entries. However, things may not always go as smoothly as we like. Like other trading strategies, trendline trading may end up offering entries that may not hit the target or make traders have a loss. In today’s lesson, we are going to see an example of trendline trading, where things do not go according to traders’ expectations.

The chart shows that the price makes a strong bearish move. It may have found its support. It produces two bullish candles. The sellers may wait for the price to make a breakout at the lowest low to go short in the pair. Let us find out what happens next.

The price makes a long bullish move followed by a bearish correction. It produces a bearish engulfing candle and heads towards the South again. The chart is bearish biased, but the pair is trading around the level, where it had a bounce earlier.

The price makes a breakout at the level and trades below the level for several candles. It means the sellers have two higher highs from where the price makes two bearish breakouts. It means the sellers can draw a trendline here and wait for the price to go towards the trendline’s resistance to go short in the pair.

The price heads towards the South and produces a bearish engulfing candle. The sellers may trigger a short entry right after the last candle closes by setting take profit at the last swing low.

It looks fantastic for the sellers. The price heads towards the target in a hurry. It seems the sellers do not have to wait too long to reach the target. The way it has been going, the price may end up making a breakout at the last swing low too.

It does not. The price finds its support and produces a bullish engulfing candle. It heads towards the trendline’s resistance. The sellers must be disappointed with the entry. They may have to encounter a loss here.

The price finds its resistance as well. It does not go towards the trendline’s resistance, but it makes a bearish move. Look at the last candle. It comes out as a bullish engulfing candle. The entry is running with some profit, and the trendline’s resistance is still intact. What do you think the sellers do with the entry? If we follow ‘set and forget,’ we may leave it like this and wait until the price hits either the stop loss or the take profit. It is an H4 chart. Many traders look after their trades and manage their trade by taking a decision as far as price action is concerned. In this case, they may do two things.

  1. Close the whole trade
  2. Close 50% trade and let rest of the 50% run

We come across three types of trade management here. It is up to you which one you choose. Choose one that suits your trading style and stick with it.

Categories
Forex Price Action

Trend Line Trading: An Incident That Often Confuses Traders

In today’s lesson, we are going to demonstrate an occurrence that often happens when the price trends with a trendline. A trendline works as a support/resistance. However, there is a little dissimilarity between horizontal support/resistance and trendline support/resistance. To draw a horizontal support/resistance, one bounce or rejection is enough. However, a trendline can be drawn only when the price makes a new higher low/lower high. This is what traders must remember, and we find this out the reason behind it.

The price makes a strong bullish move, as it produces seven consecutive bullish candles. The last candle comes out as a bearish engulfing candle. Considering the trend’s length, the buyers may keep their eyes on the pair to go long upon having a bullish reversal candle at flipped support.

The price consolidates and bounces at the same level twice. The last candle comes out as a bullish reversal candle. The buyers on the minor chart may look to go long in the pair and push the price towards the North.

The price heads towards the North and makes a breakout at the last swing high. It means we can draw an up-trending trend line and wait for the price to come at trendline’s support and to get a bullish reversal candle to go long in the pair. Let us find out what happens next.

The price does not produce a bullish reversal candle. It makes a breakout at trendline’s support and trades below the level for several candles. If the price makes a breakout at the last swing low, the sellers may look to go short in the pair. Let us see what happens next.

The price upon finding its horizontal support heads towards the North and makes a breakout at the last swing high. What does that mean? It means we can draw an up-trending trend line by using the last swing low from where the price makes a bullish breakout. Let us draw it and see how it looks.

It is a new trendline. It offers price to makes more bearish correction and more space towards the North to travel. As a matter of fact, its support zone has changed, but the new trendline is valid for the same old chart. It’s an incident that happens in the Forex market so often. Thus, keep an eye on a chart closely and do not make an immediate trading decision. Be sure about the breakout. If the breakout is confirmed, change your trading direction. If the breakout is not confirmed, let the price decide its way. We just have to follow the price and trade with its direction.

Categories
Forex Price Action

Trendline Trading: Major Chart’s Support/Resistance and Take-Profit Target

In today’s lesson, we are going to demonstrate an example of trendline trading where the price trends towards the South by obeying a down-trending trendline. In one of our lessons, we learned the importance of choosing a chart for trendline trading. In today’s example, we find out one more point to go with that. Let us get started.

It is an H4 chart. The chart shows that the price heads towards the South by having a bullish correction. The chart shows that the price produces a double bottom. The buyers may keep their eyes on the chart to go long upon having a breakout at the neckline.

The price makes a breakout at the neckline and heads towards the North. It makes a bearish correction and resumes its bullish journey. The last wave suggests that the buyers may push the price towards the level, where the price made its bearish move earlier.

It does not. The price finds its resistance and makes a strong bearish move. It makes a breakout at the last swing low. What does that mean? It means we have two swing highs. With those, we can draw a down-trending trend line and wait for the price to go towards the trendline’s resistance to go short in the pair.

The price attempts to go towards the trendline’s resistance several times. However, it comes back to its horizontal support again. If we look at the horizontal support, the price bounces at the level three times. It becomes daily support, considering the number of H4 candles. On the other hand, the trendline’s resistance is an H4 resistance. The question is whether the H4 trendline traders should wait to go short from the trendline’s resistance or not? Let us proceed to the next chart and find more about it.

The chart produces a bearish engulfing candle. The price trends towards the South from the same trendline’s resistance. It produces another bearish reversal candle in the same chart.  Ideally, trendline traders should trigger a short entry right after the last candle closes by setting their take profit at the horizontal support. This is how the daily support is respected as well as the H4 sellers go short in the pair by using the trendline trading strategy. Let us see how the trade goes.

Wow! The price heads towards the South with good bearish momentum. It hits the target and makes a breakout at the horizontal support. It means the trendline is still active. The sellers may wait again for the price to go towards the trendline’s resistance and to get a bearish reversal candle to go short in the pair.

We must choose the right chart for trendline trading to take entry and we must remember the bigger time frame’s support/resistance to set take profit. If the risk-reward ratio is at least 1:1, we may take entry. If it is less than 1:1, we may skip taking entry and concentrate on some other charts.

Categories
Forex Price Action

Trend Line Trading: Establishment and Choosing the Chart Timeframe

In today’s lesson, we are going to learn how a trend line is established and how to choose the chart to trigger entry as far as trend line trading is concerned. Traders at the beginning often are carried away and select a wrong chart to trade with a trend line. The point is, we must choose the right time frame to make the best use of a trend line. Let us now find out how we can do that.

It is a daily chart. The chart shows that the price after making a bullish correction heads towards the South and makes new lower lows. We see four significant swing highs from where the price makes four swing low. If you are a trendline trader, you know from where you have to keep an eye on this chart, don’t you? Then again, let us explore it.

The price produces a spinning top followed by a bearish engulfing candle. It makes a bullish correction and finds its resistance at point B. The price makes a breakout at the last swing low and heads towards the South further. By joining two swing highs, we can draw a down-trending trend line.

The chart shows that the price is down-trending by obeying the drawn trend line with the first two points. Concentrate on the point C. This is where traders keep their eyes to get a bearish reversal candle to go short in the pair. The chart shows that the price produces an inverted hammer. The trend line sellers may go short below the last candle’s lowest low.

As expected, the price heads towards the South with good bearish momentum. The chart produces two consecutive bearish candles. Moreover, the chart makes a new lower low as well. This means the game is not over yet for the trend line sellers. They may wait to go short again from the resistance of the trendline upon getting a bearish reversal candle.

The chart produces a bearish inside bar. The sellers may go short again below the last candle’s lowest low. It seems that the sellers are having a feast here. This is the beauty of trend line trading.

The sellers again make a handful of pips. In fact, the price makes a breakout again at the last swing low. They may wait for the price to go towards the trendline and produce a bearish reversal candle at point E to go short again. Now, let’s flip over to the H4 chart and find out how it looks.

The chart shows that the price is down trending. However, it is tough to find out the signal candle. We get more than one bearish reversal candle at point B and C. At point D, it is extremely confusing were to trigger an entry. With the Daily chart, it is very explicit, though. To be able to choose the right chart that obeys a trend line, we may always concentrate on point B (2nd point) and calculate with which chart it responds more. We then keep our eyes on that particular chart to be able to take entry with precision.


Categories
Forex Daily Topic Forex Price Action

Trend Line Trading: It Takes at Least ‘two’ to Draw a Trend Line

In today’s lesson, we are going to demonstrate an example of trendline trading. We try to learn what steps traders need to take to trade using a trendline strategy. We are going to demonstrate a chart, which heads towards the North by obeying an up-trending trend line. With the trend line trading strategy, we must remember, “It takes at least ‘two’ lows to draw a trend line.” Let us proceed and find out how it works.

The chart shows that the price produces a double bottom and heads towards the North. The buyers may wait for the price to make a bearish correction and create a bullish reversal candle to go long in the pair. The last candle comes out as a bearish pin bar. The price may make a bearish correction from here.

The price makes a long bearish correction. It produces several Doji candles. However, it does not create any bullish momentum. It is an H4 chart. The correction takes more than six candles. The level of resistance becomes a daily resistance. Some buyers may skip eyeing on the chart to go long in the pair. Let us see what happens next.

The chart produces a bullish engulfing candle and heads towards the North by making a new higher high. Do you notice anything here? Yes, we can draw an up-trending trend line. Let us draw it.

Over here, we have two swing lows. At the second swing low, the price makes a breakout at the last swing high. It means as far as fundamentals of drawing a trend line is concerned, the chart offers the buyers to draw an up-trending trend line. We must remember that it takes at least two swing lows (price trending higher from those points) to draw a trend line. The buyers are to wait for the price to come at the level of support and produce a bullish reversal candle to go long in the pair.

The price comes at the level of support and produces a bullish pin bar. It is delivered right at the trendline’s support. The buyers may get ready to go long in the pair above the reversal candle’s highest high.

The next candle comes out like a spinning top, which breaks the reversal candle’s highest high. However, the price does not head towards the North according to the buyers’ expectations. Nevertheless, on the next day, the price makes bearish correction at intraday charts and heads towards the North. Let us proceed to the following chart to find out how the trade goes.

The price hits the first target in a hurry. It makes a breakout at the level and creates a new higher high as well. It means the buyers are going to keep their eyes on the chart to go long again from the trendline’s support, and this is the beauty of the trendline trading.

Categories
Forex Basic Strategies

Let’s Learn Some Momentum Trading Techniques Using The Awesome Oscillator

Introduction

Bill Williams was the one to first developed the Awesome Oscillator, and it essentially indicates the market momentum. On the other hand, RSI (Relative Strength Index) is a trading indicator that provides an idea of the overbought and oversold zone. In the Awesome Oscillator based trading strategy, we will use the Awesome Oscillator to determine the market direction and use the RSI to increase the probability by eliminating unwanted market movements.

The Awesome Oscillator

Bill Williams has created the Awesome Oscillators to identify the market momentum of a currency pair. Besides the forex market, this trading strategy works well in all financial markets, including the stock, indices, cryptocurrencies, and commodities. The elements of this trading indicator are pointed out in the image below.

  • The first element of Awesome Oscillator is the 34 period’s simple moving average indicating the median of the last 34 candlesticks.
  • 5-period simple moving averages indicate the median of the last five candlesticks.
  • Histogram and Zero Line.

Let’s have a look at how these elements represent in a market:

  • When the Awesome Oscillator is below the zero lines, we should focus on the short term moving average. If the 5 SMA moves below the 34 SMA, it will indicate a downtrend.
  • If the position of Awesome Oscillator is above the zero lines, we can consider the trend as an uptrend.
  • If the Awesome Oscillator histogram moves to the green zone, we can consider the candlestick that moved higher than the previous candle.
  • We will consider the histogram at the red zone that is smaller than the previous candlestick.
  • The rules mentioned above are not exact buying and selling signals. Instead, it provides a trading opportunity where traders should consider other confirmations.

We can also identify the divergence between the price and the Awesome Oscillator to find a trading opportunity.

If you see the price of a currency pair to make a lower low from the left side to the right side, but the Awesome Oscillator makes the opposite, you can find a potential divergence. In divergence, the Awesome Oscillator should create two peaks above the zero lines considering the market condition.

Awesome Oscillator with RSI Trading Strategy

In this trading strategy, we will combine the Awesome Oscillator to identify the market momentum and the Relative Strength Index to get the overbought or oversold zone. If we can combine these accurately, we can make a trading strategy that can provide a good profit.

This strategy works very well in most of the currency pairs and time frames. Therefore, we can take swing trade, day trade, and even position trade. Besides the technical formation using these two indicators, we will use price action to enter the trade. Moreover, we will use stop loss and take profit as a risk management tool before taking the trading decisions.

Now let’s move to the trading strategy. In the image below, we can see the visual representation of how to trade using the Awesome Oscillator RSI trading strategy. The rules for buying and selling of a currency pair are mentioned below:

Buy Trade Setup

  • At first, the RSI should be below the 30 levels and point to an upward reversal.
  • When the RSI moves above the 30 levels, we will consider buying signals only if the Awesome Oscillator shows a green bar.
  • When the green bar appears, we can place a buy stop about 2- 5 pips above the current candlestick and allow the price to take our trade automatically.
  • Sometimes RSI might signal 1-2 candlestick later than the Awesome Oscillator. In that case, we can consider trading entry by taking a smaller lot.

Sell Trade Setup

  • At first, the RSI should be above the 70 levels and point to a downward reversal.
  • When the RSI moves below the 70 levels, we will consider selling signals only if the Awesome Oscillator shows a red bar.
  • When the red bar appears, we can place a sell stop about 2- 5 pips below the current candlestick and allow the price to take our trade automatically.
  • Sometimes RSI might signal 1-2 candlestick later than the Awesome Oscillator. In that case, we can consider trading entry by taking a smaller lot.

In this strategy, we did not consider the histogram crossing zero lines. However, suppose you want to increase the probability of your trading. You can look at the zero line cross as a further trading condition that will indicate the overbought and oversold zone.

Stop Loss And Take Profit Idea

The stop loss and take profit idea is a vital element of any trading strategy. There are many ways to set take profit and stop-loss depending on the market swing low and Sewing high. In a buy trade setup, the stop loss should be below the recent swing low with 10 to 15 pips buffer. Similarly, in a sell trade, the stop loss should be above the recent swing high with 10 to 15 pips buffer.

Another idea of a stop-loss plan is to set it at 1.5X ATR. It will indicate the actual volatility of the currency pair that you are trading. Besides the stop-loss setting, take profits can be set with a multiple-level approach. You can hold your position until the Awesome Oscillator crossed above or below the zero lines. Later on, you can monitor the momentum of the price to identify the next take profit level.

Summary

Let’s summarise the awesome oscillator and RSI trading strategy:

  • If the RSI is above the 70 levels and points downward movement, we will consider selling setups only, and if the RSI starts to move from the 30 levels, we will consider buying only.
  • To enter the trade, we can take a pending order above or below the previous candle if other conditions meet.
  • The stop loss should be below the swing low or swing high with some buffer or at 1.5 X ATR.
  • For setting take profit, you can hold the trade until the Awesome Oscillator crosses above or below the zero lines. Moreover, if the market conditions allow you to extend the take profit.

In every trading strategy, trade management is an essential tool that a trader should not ignore. In the forex market, we anticipate the price based on our technical and fundamental analysis. As we trade on probabilities, there will be conditions where the market will hit our stop loss. Therefore, strong trade management is the only way to keep your balance steady growth.

Categories
Forex Price Action

Trend Line Trading: Keep an Eye at New Highs/Lows

In today’s lesson, we are going to demonstrate an example of trendline trading. The trendline trading is one of the most consistent trading strategies. Thus, a trader can make profits by properly dealing with how trends develop. In today’s example, we will demonstrate a chart with an up-trending trendline, where the price goes down trendline’s support. However, it produces a bullish reversal candle and ends up offering a long entry. Let us get started.

The chart shows that the price heads towards the North upon finding its support. It has several higher lows that can be used to draw trendlines. However, before drawing a trendline on a chart, we have to spot out the most significant higher lows to draw an upward trend line and, conversely, the most significant lower highs to draw a downtrend line. Over here, look at the two points with the ‘right’ marks. Let us proceed to the next chart to find out how it looks with a drawn trendline.

We have drawn the trendline by using two right marks. Ideally, traders are to wait for the price to come at the level of support (trendline’s support) and get a bullish reversal candle to go long in the pair. At the last swing low, the price approaches at the level of support. However, the chart does not produce a bullish reversal candle at the level of support. They may wait for the price to come right at the drawn trendline’s support.

The price comes down. One of the bearish reversal candles closes below the level of support. The sellers may become interested here that the price may end up making a bearish breakout. If the next candle closes below the trendline, the sellers may consider having a breakout. Let us find out what happens.

The next candle does not close below the trendline. It comes back in. It means that the price obeys the trendline’s support. The last candle comes out as a bullish Marubozu candle forming by testing the trendline support. The buyers may go long in the pair again and push the price towards the last swing high.

The price heads towards the North at a moderate pace. As far as the bullish reversal candle is concerned, it is supposed to create more buying pressure. Anyway, the price hits buyers’ first take profit target. It may continue its bullish journey if it makes a bullish breakout at the last swing high. If it does not make a new higher high but comes back at the trendline’s support, the price may get choppy. If it makes a new higher high, the trendline becomes active, and the buyers may wait to go long from the trendline’s support again.

Categories
Forex Price Action

Equidistant Channel: An Excellent Price Action Trading Tool

In today’s lesson, we are going to demonstrate a trade setup with Equidistant Channel. Price action traders rely on Equidistant Channel a lot. It is one of the best price action trading tools. However, Forex traders’ life is not as easy as it seems. Like other trading tools, Equidistant Channel needs adjustment. To be able to do that traders need enough knowledge and experience. Let us now proceed to find out what a trader may need to do to make it work for him.

To draw the equidistant channel, we need to find out at least four points. Two swing highs and two swing lows are the best combinations. It works with three swing highs and one swing low or vice versa. In the chart above, we have two swing highs and two swing lows. In naked eyes, it seems that we will be able to draw an equidistant channel here.

We have drawn an equidistant channel. The price is now at the resistance. Some traders go long from here. Ideally, to get a good risk-reward, traders should wait for the price to go at the level of resistance and produce a bearish reversal candle to go short in the pair. Let us find out what happens next.

The chart does not produce a bearish reversal candle. It breaches the level instead. It means this is not a valid equidistant channel anymore. The sellers must be disappointed. What do you think is there any twist in the tail?

The chart makes the new lowest low. It gives three swing highs and one swing low. It means we can draw another equidistant channel. Look at the above chart where the price getting a bounce at the level of support. The price again heads towards the North. Traders may wait for the price to get a rejection at the level of resistance and produce a bearish reversal candle to go short in the pair again.

Here it comes. The level of resistance produces a bearish engulfing candle right at the level of resistance. Traders may trigger a short entry right after the last candle closes. To set take profit, they may use the level of equidistant support. The price often keeps going down with a down-trending equidistant channel. However, the best practice is closing down the trade at the first bounce in case of down-trending equidistant channel trading. Let us find out how the trade goes.

The price hits take profit level like a rocket. Some may regret that they should hold the position and close it manually. Do not forget the rule of sticking with the rule in forex trading. We have seen that the chart does not produce a signal on the first occasion. It rather breaches and lets traders draw another equidistant channel. Yes, it does offer an excellent entry for the sellers too.

Categories
Forex Daily Topic Forex Price Action

Pay Attention to the Signal Candle Along with Reversal Candle

In today’s lesson, we are going to demonstrate an example of a combination of an H1-15M chart trading strategy. The price makes a strong bullish move and makes a long bearish correction. It produces several bullish reversal candles, but the price does not react to all of them. It makes its bullish move at last. We try to find out why it reacts to that particular bullish reversal candle. Let us get started.

This is an H1 chart. The chart shows that the price produces a bullish engulfing candle and heads towards the North. The buyers are to wait for the price to make a bearish correction and produce a bullish reversal candle to go long again in the pair. The last candle comes out as a hanging man. It may make the pair make a bearish correction. Let us proceed to the next chart to find out what happens next.

The price makes a long bearish correction. It produces several bullish reversal candles. However, it does not make its bullish move. If we spot out, we find that there have been three significant bullish reversal candles. To make things clearer, have a look at the chart below.

Here are the three most significant bullish reversal candles that the chart produces. On the first two occasions, the price does not head towards the North. Let’s try to dig out what happens on the first occasion. On the first occasion, the chart produces a bullish engulfing candle. This is one of the strongest bullish reversal candles. The buyers are to flip over to the 15M chart. If the 15M chart produces a bullish continuation candle, they may trigger a long entry. Over here, the 15M chart does not produce a bullish continuation candle. Thus, the price does not head towards the North. On the second occasion, the 15M chart produces a bullish continuation candle. You can assume by the look of the next H1 candle. However, the price does not continue its move or makes a breakout at the highest high. The reason behind that is the reversal candle comes out as an Inside bar. On the third occasion, the reversal candle comes out as a bullish engulfing candle. Let us flip over to the 15M chart.

Look at the arrowed candle. This is what comes out after the bullish engulfing candle. The buyers have been waiting to get a candle like this after a strong H1 bullish reversal candle. They may trigger a long entry right after the candle closes (15M). Let us find out how the price moves now.

It moves towards the North with good bullish momentum. We must notice that when two factors come together, the price reacts vigorously. We may find that sometimes the price moves on the case of the second occasion as well. However, when it meets two of them together (H1 bullish engulfing and 15M bullish continuation and vice versa), most likely, it goes towards the trend and helps traders make money.

Categories
Forex Daily Topic Forex Price Action

It Often Makes You Wait Longer Than You Want

In today’s lesson, we are going to demonstrate an example of a daily-H4 chart combination entry. The daily char produces a bearish engulfing candle at a significant level of resistance. It makes the daily-H4 chart combination traders flip over to the H4 chart to look for a potential entry. The H4 chart shows that the chart creates a double top. Simply, an ideal combination for the traders to go short on that chart. However, things do not go as smoothly as traders expect it to go in the Forex market. Let us find out what happens.

This is the daily chart. The chart shows that the price, after being bullish, has a rejection at the level of resistance marked with the red line. The price comes down and makes a bullish move again. If it makes a breakout, the buyers may push the price further up. On the other hand, sellers are to wait for the price to produce a bearish reversal candle to consider short opportunities. Let us find out what happens next.

The chart produces a bearish engulfing candle. Since it shows in the daily chart, the combination traders may flip over to the H4 chart to look for a short opportunity. A double top resistance and a bearish engulfing candle suggest the sellers may jump in here to drive the price towards the South further.

It is the H4 chart. The chart produces a double top and makes a breakout at the neckline. The combination traders are to wait for the price to consolidate and produce a bearish reversal candle to go short below consolidation support. The price consolidates here. However, considering consolidation length, it is better to skip such entry.

The price heads towards the South with extreme bearish pressure. It travels a long way to produce a bullish reversal candle. The sellers would love to get the reversal candle earlier though. Anyway, it is better late than never.

The chart produces a bearish engulfing candle closing well below consolidation support. The sellers may trigger a short entry right after the last candle closes by setting stop-loss above consolidation resistance with 1R.

The price heads towards the South with good bearish momentum and hits the target. It seems that the price may travel towards the South further. The point to be noticed here is that the chart consolidates after traveling a long way. It would give a better reward if it consolidated and produced the signal candle earlier. It makes the sellers wait for more as well. In the end, the sellers make a profit out of it but think how hard they are to concentrate on it to make it work for them.Traders’ life is not as easy as some people may think.

Categories
Forex Daily Topic Forex Price Action

Even a Fragile Breakout Makes the Price Move

In today’s lesson, we are going to demonstrate an example of a chart producing a double top and offering entry. The breakout does not look that promising though. However, the price heads towards the breakout direction and makes a long bearish move. Let us get started.

The chart shows that the price has a rejection at a level and makes a bearish move. Upon finding its support, it produces a bullish engulfing candle and heads towards the North. The chart produces a bearish inside bar around the level of double top resistance. It may attract the sellers to keep their eyes on the chart to go short upon a neckline breakout.

The price heads towards the South with good bearish momentum. The last candle comes out as a bullish inside bar. It is a sign that the chart may get choppy instead of making a breakout at the neckline. However, we never know. The sellers may keep patience and wait for a bearish breakout.

The price consolidates for a while and makes a bearish move. The last candle closes below the neckline. It is a kind of breakout that the sellers are waiting for, but it is a breakout. Let us wait and see what the price does here.

The chart produces a spinning top. The candle closes within the breakout level. Thus, it is a valid breakout. The sellers may wait for the chart to produce a bearish engulfing candle closing well below the last swing low. Let us proceed to the next chart.

Look at the last candle. The candle comes out as a bearish engulfing candle closing well below the last swing low. The sellers may trigger a short entry right after the last candle closes by setting stop-loss above the breakout level and take profit with 1R.

The price heads towards the South with excellent bearish momentum. It hits the target of 1R in a hurry too. This means the trade setup has worked for the sellers nicely. Considering the breakout factor, the trade setup is not an A+ trade setup. However, we may consider two important factors here.

  1. Double Top
  2. The signal candle.

These two factors are significant to make the price move. Yes, when an A+ momentum breakout goes with two of them, it gives us more chances to make a profit out of the trade. Today’s example shows that as long as it’s a breakout, upon the breakout confirmation, the price may head towards the trend direction with good momentum if the mentioned two factors meet all the requirements.


Categories
Forex Price Action

Price Action Trading: Factors that you should Remember

In today’s lesson, we are going to demonstrate an example of a chart offering an entry upon producing a bullish reversal candle followed by a breakout. The chart produces a bullish reversal candle earlier too, but that did not make the price move towards the North. We’ll try to find out why it does not head towards the North at its first attempt. Let us get started.

The chart shows that the price heads towards the North upon producing an ABC pattern. We may notice that we have four significant points here, such A, B, C, and D. The price most likely reacts at these levels again. Let us proceed to the next chart.

The price heads towards the South at a moderate pace. The last candle comes out as a bearish Marubozu candle. It seems that the price may remain bearish for a while. Let us proceed to the next chart to find out what happens next.

The chart produces an inverted hammer. It is a sign of a bullish reversal. However, considering point B, the price makes a bearish breakout at the level. Thus, the pair may continue its bearish move. The sellers may look for short opportunities in the minor chart.

The next candle does not make a bearish breakout. It comes out as a bullish candle. The last candle comes out as a Doji candle. Ideally, neither the bull nor the bear dominates in the pair. The sellers are to wait for the price to make a breakout at the last swing low. The buyers are to wait for the price to make a bullish reversal candle closing above consolidation resistance. Let us see what the price does.

The price comes down. It produces a bullish engulfing candle. Some sellers may have to encounter a loss here. Upon creating the bullish engulfing candle, the price heads towards the North with good bullish momentum. Now a few questions may be raised here.

  1. Why does the price not head towards the North but comes down?
  2. Why does the price not continue its bearish move but produces a bullish engulfing candle?
  3. Why does not price head towards the North at its second attempt?


Have a look at the chart below with some drawings in it.

At its first attempt, the price does not make a breakout at the level of resistance drawn. The price reacts at this level several times. Thus, this is a crucial level, which is to be counted by the buyers before taking long entries. The price finds its resistance here and makes a bearish move. It finds its support at the drawn line, where the price reacts to it earlier as well. The reversal candle comes out as a Doji candle, and the chart takes four candles to make the breakout. This is one of the reasons that the price does not continue its bearish move.

At its last attempt, it produces a bullish engulfing candle, the candle is produced at a key level, the price makes a breakout at the last swing low, and the breakout candle comes out as a strong bullish candle. These factors attract more buyers and make the price move towards the North with good bullish momentum. We need to remember such factors every time we take entries as far as price action trading is concerned.

Categories
Forex Daily Topic Forex Price Action

Reversal Breakouts Offer a Lot

The trend is traders’ friend. Breakout is traders’ best friend. In today’s lesson, we are going to demonstrate an example of an H1 breakout, which makes a reversal even in the daily chart. Thus, the price heads towards the breakout direction with good momentum ending up offering an excellent reward. Let us get started.

The chart shows that the price makes a strong bearish move and finds its support. Upon producing a bullish engulfing candle, the price heads towards the North at a moderate pace. The price does not make a breakout at the last swing high. Thus, the chart is still bearish biased. Please note, the H1 chart does not show, but the daily trend has been bearish in this chart.

The chart shows that one of the candles breaches through the last swing high, closing well above the level. The last candle comes out as a bullish candle as well. It confirms the breakout. The buyers may wait for the price to consolidate and get a bullish reversal candle to go long in the pair.

The last two candles come out as bearish candles. The spinning top closes within the level of support. If the level produces a bullish engulfing candle, the buyers may go long in the pair.

The last candle comes out as a bullish engulfing candle closing well above consolidation resistance. The buyers may trigger a long entry right after the candle closes by setting stop loss below the level of support and by setting take profit with 1R.

The price heads towards the North with extreme bullish momentum. The way the chart looks, it seems it may continue its journey for a while. The chart shows that the buyers achieve their target within the next two candles after triggering the entry. Let us proceed to the following chart to see what the price does.

The last candle comes out as a bearish engulfing candle. It is produced at the second rejection as well. This means the chart forms a double top here. A double top resistance forming a bearish engulfing candle suggests that the price may make a bearish move here. However, if we calculate the length of the bullish move, it ends up being a very good one. This is what usually happens when the price makes a breakout at the last daily candle’s highest high when the daily chart is bearish and if the breakout takes place at the lowest low when the daily trend is bullish. Make sure the price consolidates and produces a strong reversal candle at the breakout level. If that happens, it often ends up offering an excellent reward in the end.

Categories
Forex Price Action

H1-15M Combination Trading: Consolidation Level May Vary

In today’s lesson, we are going to demonstrate an example of an H1-15 chart combination trading. The price makes a strong bearish move in the daily chart. Then, it is trapped within two horizontal levels. Next, it makes a bullish breakout and ends up offering an excellent entry. Let us get started.

This is the H1 chart. The chart shows that the price is trapped within two horizontal levels. Upon having a bounce, the price heads towards the North. The buyers are to wait for the price to make a bullish breakout at the level of resistance. Let us proceed to the next chart.

The chart shows that the price heads towards the North and trades above the level of resistance upon making a bullish breakout. The H1-15M chart combination traders are to wait for the price to consolidate and produce a bullish reversal candle to offer them a long entry.

Here it comes. One of the candles comes out as a bearish engulfing candle. However, the next candle comes out as a bullish engulfing candle closing above consolidation resistance. The H1-15M combination traders may flip over to the 15M chart to trigger a long entry.

This is how the 15M chart looks, and it looks very bullish. The buyers are to wait for a bullish candle to close above the last candles to trigger a long entry. As far as the recent price action is concerned, it may not take too long to produce a 15M signal candle.

The chart produces two bearish candles and consolidates. The last candle comes out as a bullish engulfing candle closing well above consolidation resistance. The buyers may trigger a long entry right after the last 15M candle closes by setting a stop-loss order below consolidation support and by a take-profit target with 1R. Let us find out how the trade goes.

The price heads towards the North with good bullish momentum and hits 1R in a hurry too. It keeps going towards the North. It may extend its bullish wave as well. Ideally, the price is to consolidate around the breakout level.

In this example, the price consolidates way above the breakout level. It often happens in the H1 chart. It does not mean that we do not get the opportunity to take an entry. Chart combination trading may help us take entries in such a situation. Once a breakout takes place (H1 chart), we are to wait for the price to consolidate and produce a reversal candle. Then, we are to flip over to the 15M chart and wait for the trend continuation to trigger entry.

Categories
Forex Chart Basics Forex Daily Topic Forex Price-Action Strategies

Spotting Out Support/Resistance is an Art

Support/Resistance levels are one of the most important factors in trading. In today’s lesson, we are going to demonstrate an example of adjustment in determining the support/resistance level.

Forex market gets volatile from time to time. It often produces spikes. Sometimes traders have to count those spikes to determine support/resistance level, and sometimes they do not have to do that. We try to learn when we have to count, and when we do not have to count those.

This is an H1 chart. However, any chart may look like this. If we are to draw support/resistance levels here, we may find out the two most significant points where the price bounces and where it gets a rejection from. Let us proceed to the next chart with those two lines.

Look at the level of drawn support. The price bounces at the level and produces a bullish inside bar. It comes back at the level and bounces twice. At the second bounce, it produces a long lower shadow and heads towards the North. We may skip counting the spike here and draw the level of support at where the price produces a bullish inside bar and bounces twice later.

Look at the level of resistance. This is where we have counted spikes since the price reacts at the level earlier. However, we may have to adjust it later. We will be able to find this out later as far as price action is concerned.

When the price comes back down, it breaches the level of support and produces a good bullish candle. However, there is a gap, and the price goes back within the previous level of support. Thus, we may still consider the drawn level as a significant level of support.

The price heads towards the North and breaches the level of drawn resistance. The price comes back within the drawn level again. The drawn level is still a significant level of resistance since the price reacts to it. However, we have a new highest high, which must be counted.

The price heads towards the South and reacts to the level of drawn support again. Upon producing a bullish inside bar, it heads towards the North again. Here are two questions.

  1. Where would you set your take profit level as a buyer?
  2. Do you have anything else to do here?

As a buyer, you may consider taking your profit at the previously drawn level. Here we have drawn the level of resistance with a little adjustment. Have you noticed it? Yes, this is what you have to do. Spotting out significant points and monitoring price action around them are two most important things to be able to make adjustments with the support/resistance level. To be able to trade accordingly, we often need to do this. Thus, we must learn the art of adjusting the support/resistance level.

Categories
Forex Price Action

Do Not Abandon a Chart with Choppy Price Action

In today’s lesson, we are going to demonstrate an example of a chart where the price gets caught within two horizontal levels and makes a bullish breakout. We try to find out what it has to offer and how the price action goes. Let us get started.

The price makes a strong bullish move. Upon finding its resistance, it is in a bearish correction. The buyers may eagerly wait to go long in a chart like this if the chart makes a breakout at the last highest high. The last two candles come out as bullish candles. It seems that the price may have found its support.

The chart shows that two lines may be drawn by using significant levels, where the price reacts several times. The buyers may eye on the price and hope that the chart makes a breakout at the level of resistance to offer them a long entry.

The chart shows that it does not make a breakout at the highest high. However, it gets rejection and makes another bearish move towards the level of support. Here is an interesting thing. The sellers may wait for the chart to make a breakout and offer them a short entry here since the level is a double top resistance.

The chart does not make a breakout, but it produces a long bullish engulfing candle. It gets rejected again and heads towards the South. Upon having a bounce, it heads towards the North. Two horizontal levels may be drawn, which is called horizontal channel or box channel. The price may go either way. Now, the buyers are to wait for a bullish breakout and go long in the pair.

After a long while, the chart makes a bullish breakout. The buyers may wait for the price to make a correction/consolidate and produce a bullish reversal candle to offer them a long entry.

The price makes a bearish correction and seems to have found its support. It produces a doji candle. The buyers may get ready to trigger a long entry. Some buyers may flip over to the smaller chart to trigger a long entry, and some may go long above the last highest high. Some may wait for a bullish engulfing candle closing above resistance. It depends on their trading strategy.

The chart produces a bullish engulfing candle closing above consolidation resistance. The price may head towards the North with good bullish momentum as far as the last candle’s attributes are concerned.

The price heads towards the North and hits 1R within the next candle. The last candle comes out as a bearish inside bar. It suggests that the price may consolidate and make a bearish correction. In the end, the buyers have made some green pips.

The market ranges most of the time. When it makes a breakout, it does not take too long to offer an entry. In today’s lesson, we have seen that the price makes us wait for a long. It takes a long time to make a breakout. Traders must keep their eyes on such charts and wait for the price to take a direction. In the end, even a choppy chart may end up offering a good entry too.

Categories
Forex Daily Topic Forex Price Action

Double Top or Double Bottom Often Offers More

In today’s lesson, we are going to demonstrate an example of a chart offering multiple entries upon producing the double bottom. We know the double bottom is one of the strongest bullish reversal patterns. When a chart produces a double bottom, price action traders keep their eyes on the chart to keep going long. Usually, a double top or a double bottom ends up offering multiple entries. Let us now have a look at today’s example of how it offers us multiple entries.

This is an H4 chart. The chart shows that the price heads towards the South with good bearish momentum. It makes a long bearish move too. However, look at the last candle in the chart. It comes out as a bullish inside bar, which is produced at double bottom support. The buyers are to wait for a breakout at the neckline and go long in the pair.

The chart shows that one of the candles breaches through the neckline level. The next candle comes out as a bullish candle. The buyers are to wait for the price to consolidate and produce a bullish reversal candle to go long in the pair.

Upon producing a bearish inside bar, the price produces a bearish candle. The last candle looks very bearish. However, the buyers must keep their eyes on the chart since it may produce a bullish reversal candle anytime as far as double bottom and neckline breakout are concerned.

The chart produces a bullish reversal candle followed by another bullish candle breaching through consolidation resistance. The buyers may trigger a long entry right after the last candle closes by setting stop loss below consolidation support and by setting take profit with 1R.

The price heads towards the North with good bullish momentum. It hits 1R within the next candle. The price consolidates and produces a bullish reversal candle closing above the last swing high. Do you notice anything here? Yes, this is another entry. The buyers may trigger a long entry right after the last candle closes. Let us have a look at the trade setup with two horizontal lines on the chart.

The price heads towards the North again and hits 1R within the next candle. It seems that the buyers are having a feast here. The way it has been going, they may wait for the price to consolidate again and produce another bullish reversal candle to offer them one more entry. In a word, this is a chart that is going to be closely monitored by the buyers until it produces a strong bearish reversal pattern such as a double top or a bearish engulfing candle on the daily chart (this is an H4 chart). Next time when you see a double top or bottom on a chart, keep eyeing on the chart to make full use of that.


Categories
Forex Price Action

How Market Tests You and What You May Learn from It

In today’s lesson, we are going to demonstrate an example of a daily-H4 chart combination trading, which has a good lesson to give us. Usually, daily-H4 combination traders look for a strong reversal candle in the daily chart. Then, they flip over to the H4 chart to trigger entry upon consolidation and a signal candle. We get all these in our today’s example, but the price acts a bit differently after triggering the entry. Let us proceed to find out what happens there.

It is the daily chart. The chart shows that the price produces a bullish engulfing candle at a level of support where the price bounces several times. The combination traders may flip over to the H4 chart now and wait for the price to consolidate and produce a bullish reversal candle.

This is how the H4 chart looks. It looks very bullish. The last candle comes out as a bullish candle closing within a level, where the price gets rejection twice. The pair may consolidate here.

The pair produces a bearish engulfing candle. This is a strong bearish reversal candle. However, the H4 buyers must not lose their hope since the last daily candle comes out as a bullish candle. They must wait with hope.

The next candle comes out as a bullish engulfing candle closing above the level of resistance. The buyers may go trigger a long entry right after the last candle closes by setting stop loss below consolidation support and by setting take profit with 1R. Typically, this is an ideal price action to go long for the daily-H4 chart combination traders. Let us proceed to the next chart to find out what happens next.

The next candle comes out as a bullish pin bar. Look at the lower shadow. The price is about to hit the stop loss. However, if the stop loss is set here accordingly, the entry is safe. Nevertheless, the last candle comes out as a surprise for the buyers. It has three lessons to give us. We will learn them in the conclusion. Meanwhile, let us find out how the entry goes.

The price then heads towards the North with a moderate pace and hits the target. The combination traders make some profit out of the trade. It is good. Let us now find out what those three lessons are.

  1. Look at the daily chart again. See the price consolidates within two horizontal levels. There are two resistances. It means the price does not have enough space to travel towards the North as far as the daily chart is concerned. It may have held some buyers in the H4 chart back to go long in the pair.
  2. Set your stop loss accordingly with some safety pips as well.
  3. Be patient. If a trade does not go according to your expectation, do not panic.


Categories
Forex Daily Topic Forex Price Action

Evaluate Whether the Chart Belongs to Your Strategy or Not?

In today’s lesson, we are going to demonstrate an example of an H1 chart, where the price makes a bearish breakout and produces a bearish reversal candle upon making a bullish correction. However, things do not go as the sellers would like. Let us find out what happens and what the reason may imply.

The chart shows that the price produces two bearish candles consecutively. The level of support seems to be a strong one. It may produce a bullish reversal candle and push the price towards the North. However, the sellers may wait for the price to make a bearish breakout at the level of support.

Here it comes. The next candle breaches the level of support closing well below the level. This is one good-looking breakout candle. The sellers are to wait for the price to consolidate or make a bullish correction to produce a short signal.

The price makes a bullish correction. The last candle closes within the breakout level. Please pay attention to the number of candles the chart uses to make the bullish correction. The chart takes five candles to complete the correction. It means the level of support has become H4 support. Let us proceed to the next chart.

The chart produces a bearish inside bar. This is a bearish reversal candle, of course. However, the question may be raised here whether the sellers take a short entry depending on the H1 chart or not? Let us assume that a seller triggers a short entry by setting stop-loss above the breakout level.

The next candle comes out as a bearish candle. However, the last candle comes out as a bullish engulfing candle. The level is H4 support now. Thus, the buyers may look to go long in the pair and drive the price towards the North. It does not look good for the seller. The price may hit stop loss.

The next candle comes out as a strong bullish candle closing well above the breakout level. The short entry has been wiped off. If we consider the sequence bearish breakout, bullish correction, bearish reversal candle at the breakout level, it seems perfect to go short in the pair. What goes wrong here? In the Forex market, any entry may go wrong. However, over here, the H1 sellers may miss the point that the support is not H1 support anymore. It is H4 support since the level of support holds five candles. This is why the H1 traders may skip taking the short entry in this chart. It often happens in combination trading that traders forget to calculate or synchronize the chart that they are trading at. However, to be successful in trading, traders must not miss this point.