In today’s lesson, we are going to demonstrate an example of a double bottom, which pushes the price towards the North. The example also proves an old theory of support becomes resistance or resistance becomes support after a breakout. Let us get started.
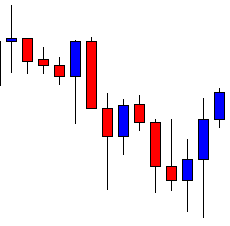
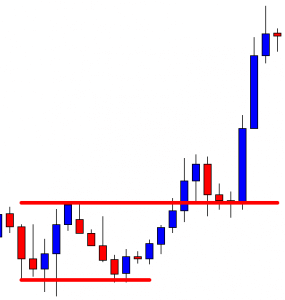
The chart shows that the price makes a bearish move and finds its support. The level of support produces a bullish candle, which is followed by two more bullish candles. The buyers may wait for the price to consolidate and produce a bullish reversal candle to go long in the pair.
The price makes a long bearish correction. It comes back to the level of support again. A bearish breakout may attract the sellers to go short and drive the price towards the South. On the other hand, the buyers may wait to get a bullish reversal candle at its second bounce.
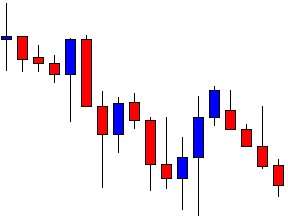
The chart produces a bullish engulfing candle. Since it is produced at the second bounce, the buyers in the chart may wait for the price to make a breakout at the neckline and go long.
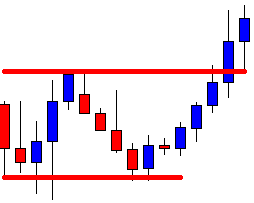
The price heads towards the North with good bullish momentum. It makes a breakout at the neckline and trades above the level for one more candle. The buyers would love to see the price to consolidate or make a bearish correction at the breakout level and produce a bullish reversal candle to trigger a long entry.
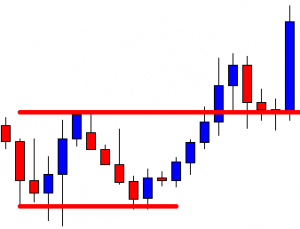
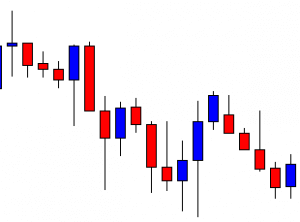
The price makes a bearish correction and produces a bullish engulfing candle closing above the level of resistance. The buyers may trigger a long entry right after the last candle closes by setting Stop Loss below the candle’s lowest low and by setting Take Profit with 1R. Here we must notice that the neckline level becomes the level of support. This is one of the most reliable theories in the financial market.
The price heads towards the North with extreme bullish momentum. It hits 1R in a hurry and travels towards the North further. The last candle comes out as a hanging man, which is a bearish reversal candle. However, it is not a strong one. The price may keep traveling towards the North. Anyway, the buyers achieve their target with the entry, which is taken on two theories.
- Double Bottom- A very strong bullish reversal pattern
- Resistance works as a level of support after the breakout.
In the case of a double bottom and neckline breakout, we may sometimes find that the price does not come at the breakout level. It consolidates well above and makes a bullish move. In some cases, the price may not hit the target. However, if the price comes and produces a bullish reversal candle at the breakout level, the price may hit the target in most of the cases.