Categories
Forex Price Action

An Interesting Fact about Equidistant Channel

In today’s lesson, we are going to demonstrate an example of the formation of an up-trending equidistant channel. Usually, the price forms an up-trending equidistant channel by having two bounces and one rejection. However, the price sometimes determines the upper band first by having two rejections. In today’s lesson, this is what we are going to demonstrate.

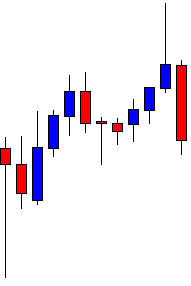
The chart shows that the price makes a bullish move and produces a bearish engulfing candle. The last candle in the chart comes out as a doji candle with a long lower shadow. It suggests that the price finds a strong level of support in the minor charts.

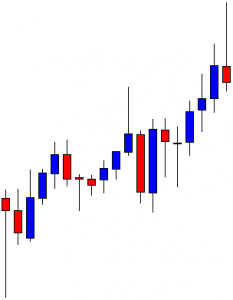
The price heads towards the North and has a strong rejection. The last candle comes out as a bearish engulfing candle again. A candle with a long upper shadow followed by a bearish engulfing candle may drive the price towards the South.

It does not. It produces a bullish engulfing candle and pushes the price towards the North. The chart produces an inverted hammer. The long upper shadow suggests that the price has a rejection from a strong level of support. So far, we have noticed that the price is up-trending by making new higher highs. Do you notice anything else? Let us proceed.

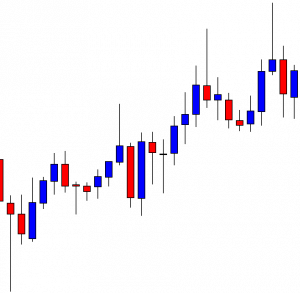
After making a bearish correction, the price finds its support. It produces a bullish engulfing candle and pushes the price towards the North. The last candle comes out as a bullish candle with a long upper shadow though. It is more evident now that the price is up-trending by obeying an equidistant channel.

Upon finding its support, it produces a bullish inside bar. It seems that the buyers based on the equidistant channel may go long in the pair. We have not drawn the channel yet. The reason is we have to be able to spot out the channel by looking at the price action. Let us now draw an equidistant channel and see how the price has been obeying it.

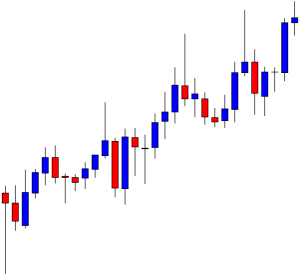
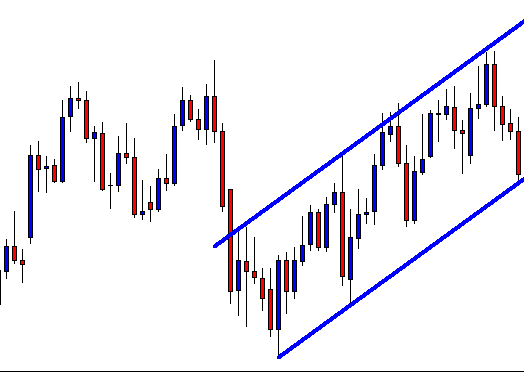
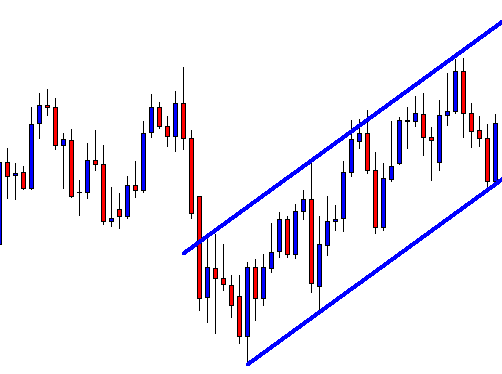
It looks like a copybook equidistant channel. It offers two good long entries. Do you notice one thing here? The price gives a clear sign that it may form an up-trending equidistant channel at the very outset. When it has its second rejection, it does not trend from the lower band. However, it determines its upper band, which helps traders sniff about a potential up trending equidistant channel. This is what happens so often. The price may determine its upper band first not by bouncing off at the lower band or it may determine its lower band by not having rejection from the upper band.

Categories
Forex Price Action

The Beauty of Horizontal Channel Trading

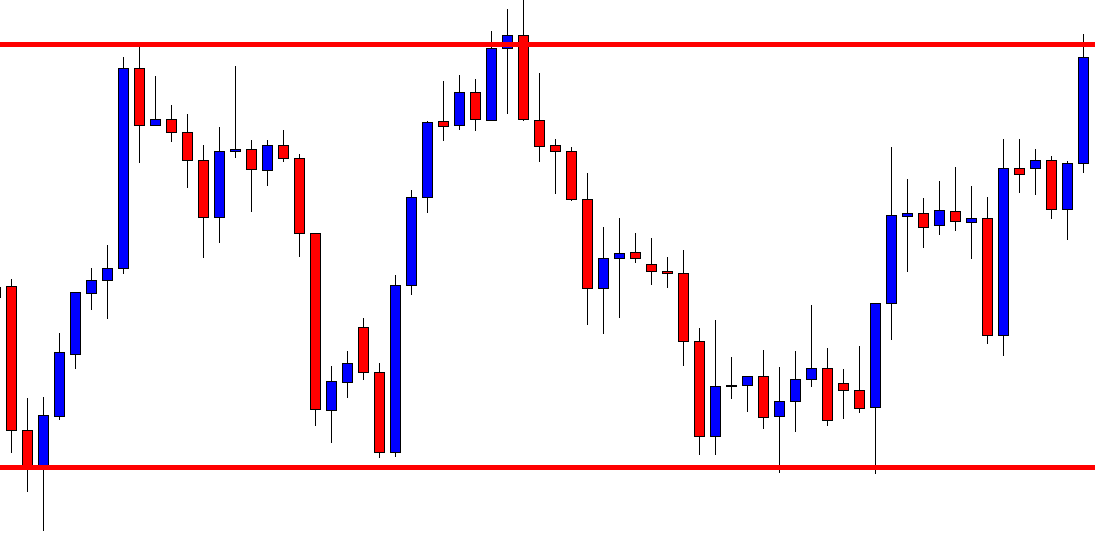
In today’s lesson, we are going to demonstrate an example of a chart where the price gets caught within a horizontal channel. We’ll try to learn how we can trade and make the most of it. Let us get started.

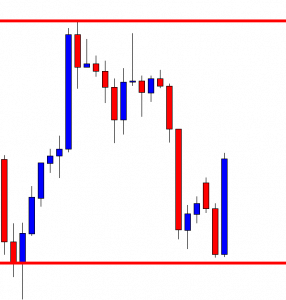
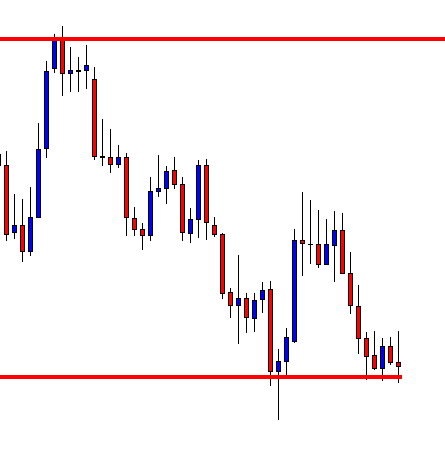
The chart shows that, after being bearish, the price bounces at the drawn level. It produces a bullish engulfing candle and heads towards the North. The chart is bullish-biased. Thus, price-action traders are to look for long entries. Let us see what happens.

The price finds its resistance instead. It produces a bearish inside bar, but it does not make a new higher high. Thus, the buyers do not get an opportunity to go long at the top. The price heads towards the South towards the level of support. Since the level has been working as a level of support, the buyers may wait for the price to produce a bullish reversal candle to go long in the pair.

The chart shows that the price produces a bullish engulfing candle at the support zone. The buyers may trigger a long entry by setting stop loss below the candle’s lowest low and by setting take profit at the level of resistance. The risk-reward looks good.

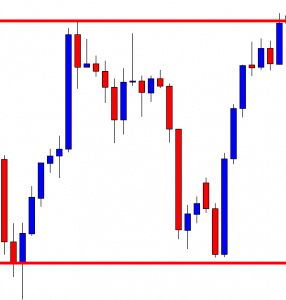
The price heads towards the North with good bullish momentum. It hits the target in a hurry too. At the moment, the price is right at the level of resistance. Can you guess what traders should do now? Look at the next chart.

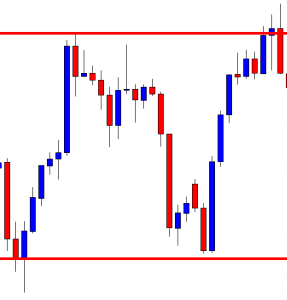
The chart shows that the price produces a bearish engulfing candle at the resistance zone. A point is to be noticed here that the chart produces a bullish spinning top. However, it cannot be considered a breakout. It rather produces a bearish engulfing candle. Thus, the traders may go short in the pair by setting take profit at the support zone and by setting stop-loss above the last candle’s highest high.

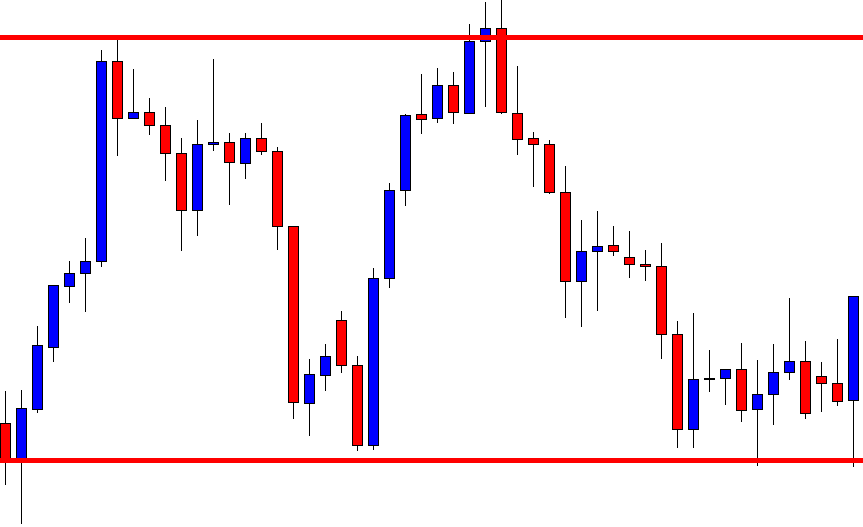
The price heads towards the South with an average pace. It consolidates for a while and resumes its bearish journey. The price has been roaming around the level of support for quite a while. It means the support gets even stronger. Look at the last candle. It comes out as a bullish engulfing candle. The buyers may trigger another long entry here. Let us find out what happens next.

The price hits the target. The price makes a long bearish correction and tests the buyers’ patience, though. However, in the end, the buyers come out with their pips. Trading is beautiful when the price moves like this, isn’t it?

Categories
Forex Course

144. Trading The Channel Breakouts In The Forex Market

Introduction

Breakout trading is one of the easiest and most common and smartest ways to trade the market. It doesn’t matter whether you are a scalper, intraday trader, investor, or a swing trader; you can always make money in the market if you master the breakout trading only.

Breakout trading is an attempt to enter in the market when the price action moves outside the significant price range, most of the time it takes an immense amount of power to break the significant areas, and you will always witness the spikes, fake-outs near the breakouts, this is because both of the parties tries to dominate the shows.

What is a Price Channel?

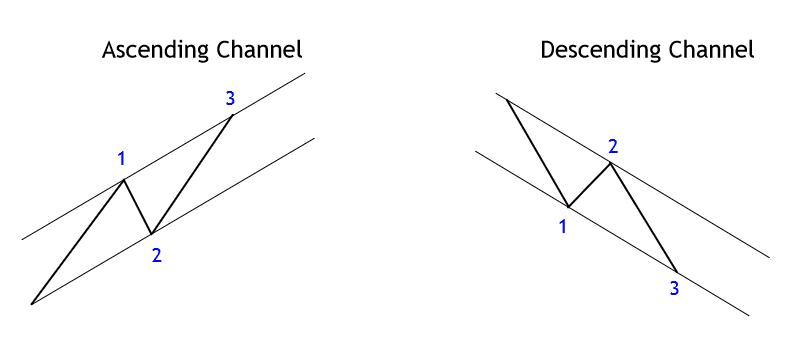
A price channel is a state of the market that connects the swing high and swing higher lows in an uptrend. Conversely, in a downtrend, it connects the swing low and lower low. The upper trend lines act as a resistance to the price action, and the lower trend lines act as a support line on the price chart. The price respects these areas by staying inside the price channel. When the opposite party becomes dominates, then we witness the breakout in a channel.

Trading Channel Breakouts

Buy Trade 1

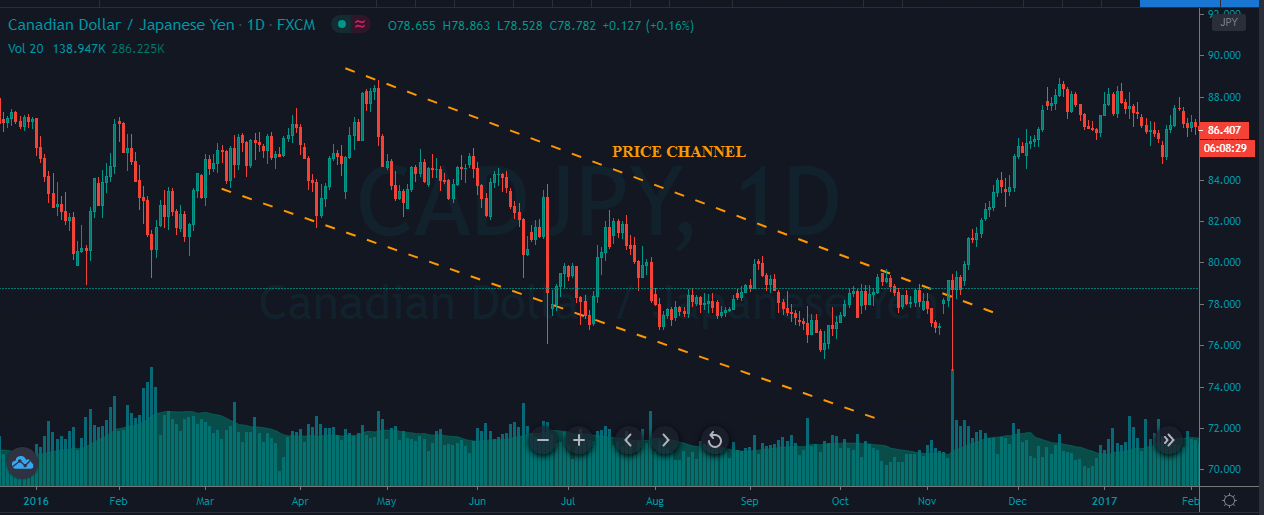
The price chart below represents a channel breakout in the CAD/JPY forex pair.


As we can see, the sellers are getting weaker in the channel, and as a result, soon after the breakout price action changed its trend. So, around 81.55, the price action broke to the north and printing a brand new higher high.

Buy Trade 2

The image below represents the formation of a price channel in the CAD/JPY forex pair.

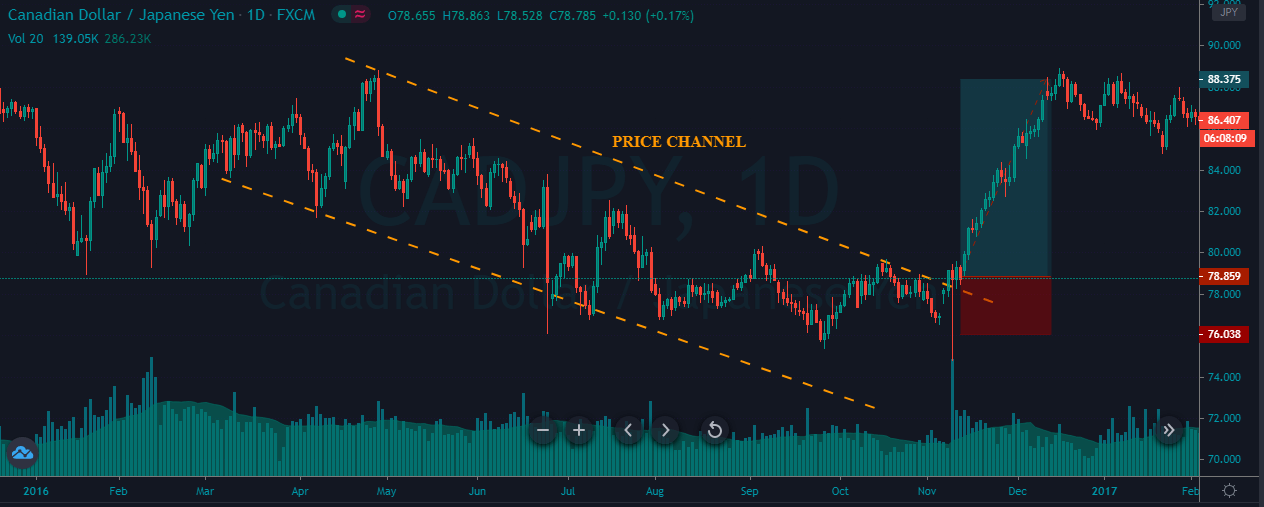
As we can see, the below price chart represents our entry-exit and stop loss in this pair. So during the downtrend, both buyers and sellers were holding equal power. Near to the 78.00 area, price action broke to the north, and after the breakout, we took a buy-entry. After our entry, the price made a brand new higher high, but the hold at the most recent higher high convinced us to close our trade at the 88.37 level.

Sell Trade 1

The image below represents the formation of a Price channel in a downward trend.


The image below represents our entry, stop loss, and take profit in this Forex pair. The channel is typically formed when there is no trend, or when the trend is about to end. On a lower timeframe, we can trade inside the Channel, but on this timeframe, the break below the 78.30 level indicates that the sellers stole the show, and are ready for a brand new lower low.

Sell Trade 2

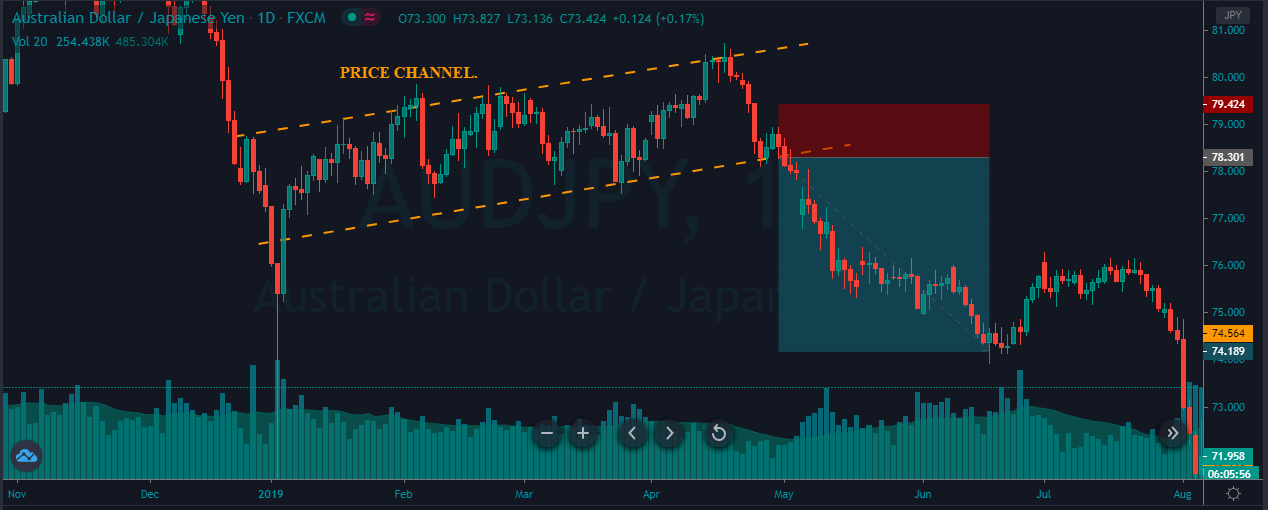
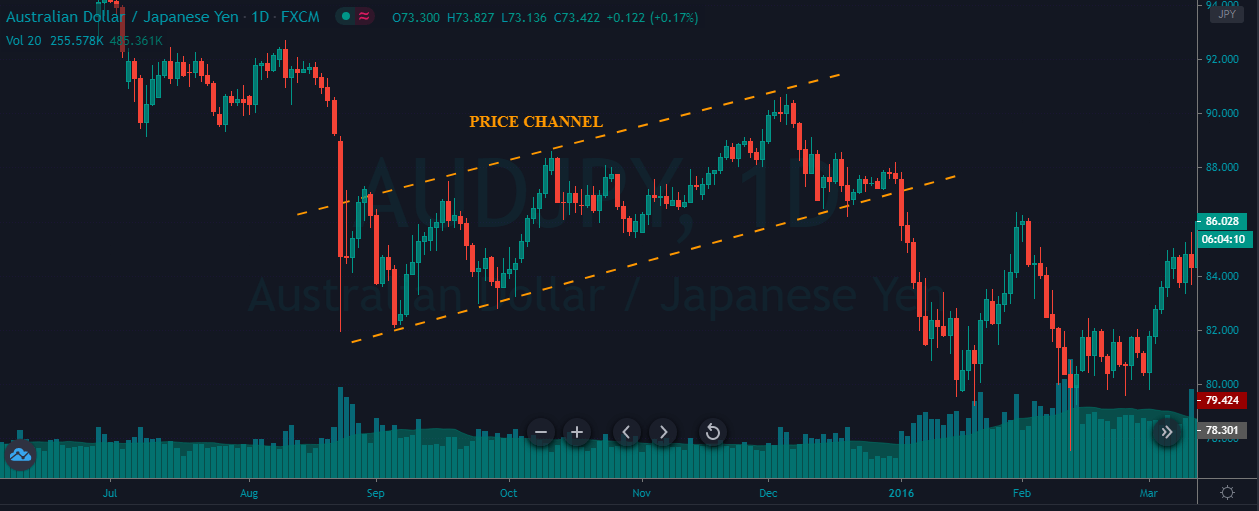
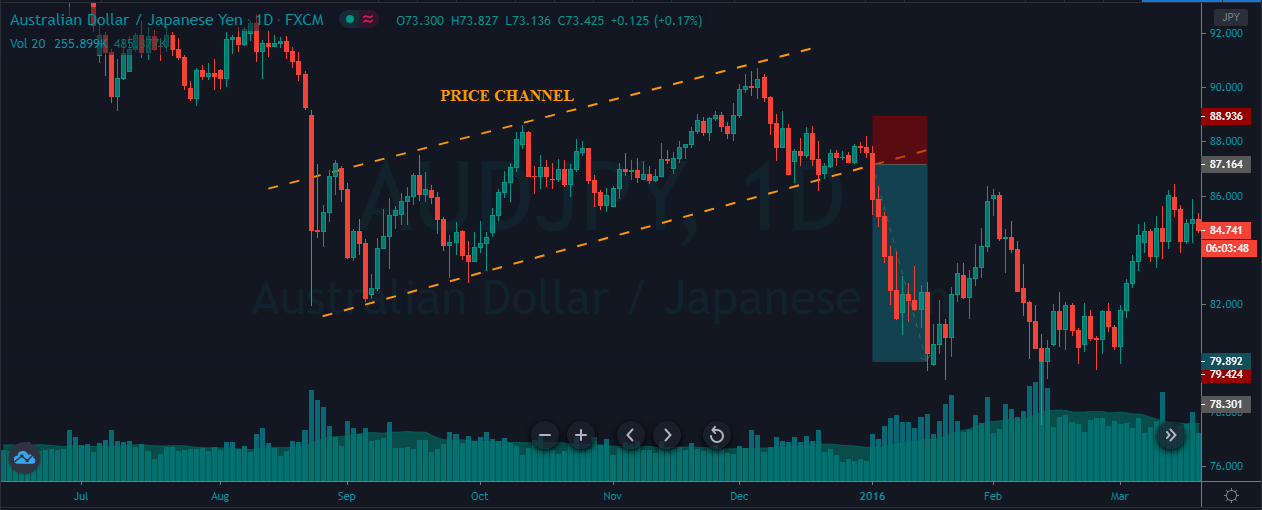
The image below represents a channel breakout in the AUD/JPY Forex pair.

Right after the price action approaches the most recent support area, it just got shot down and broke below the Channel. The strong red breakout candle is an indication for us to go short in this pair and right after our entry, we have witnessed a brand new lower low.

Trading channel breakouts is this simple. But minute details like drawing channel lines accurately is crucial. Let’s learn more breakout trading techniques in the upcoming lessons. For now, don’t forget to take the quiz.

[wp_quiz id=”85204″]
Categories
Forex Course

139. How Professionals Trade The Different Market States?

Introduction

In this series of different states of the market, we understood the terminology and the concepts involved. However, in the forex market, if we do not go practical, there is the least use to the concept. In other words, one must understand how to trade in the market, knowing its state. In this final lesson of the series, we shall dive deep into the topic and understand how to apply them in the market.

Trading a Trend

Trading a trending market is the simplest and safest way to trade in the market. This is because, in a trend, it is evident on which party is dominating the market. For example, in an uptrend, it is clear that the buyers are more powerful than sellers. And hence, we look for buying opportunities rather than selling.

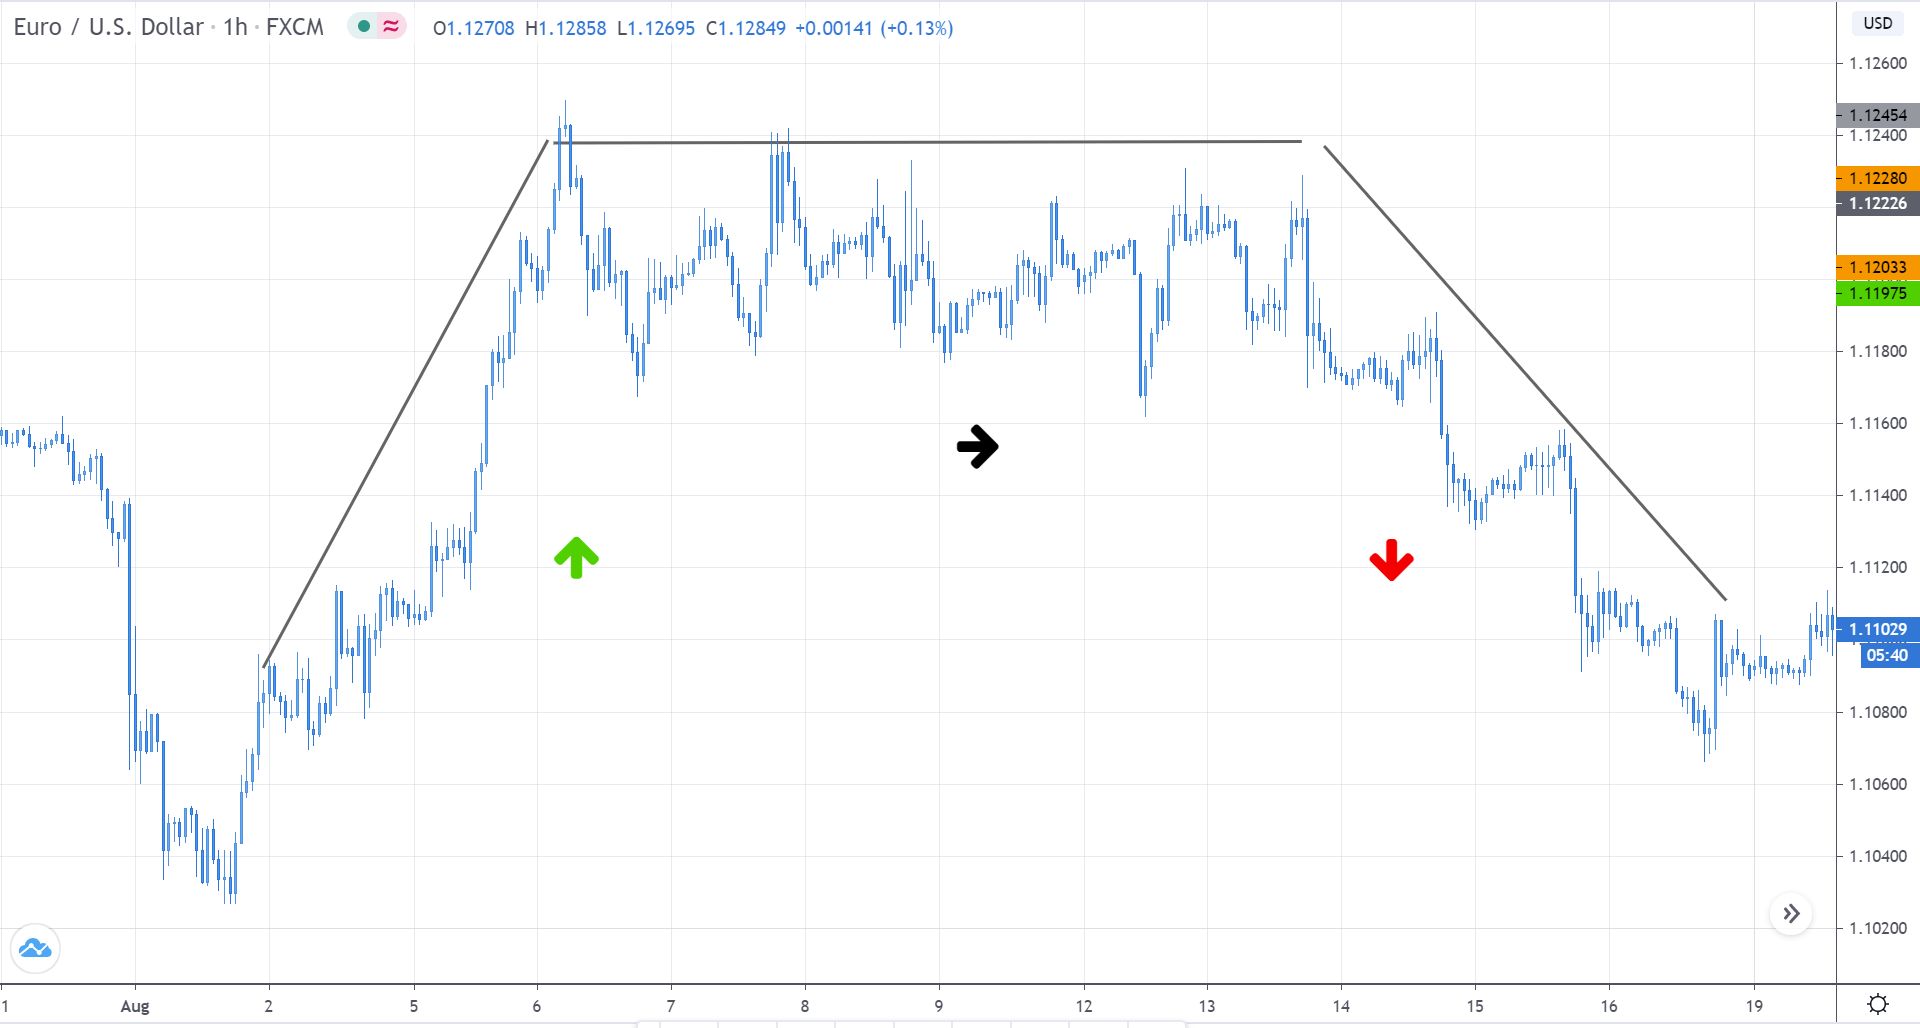
In a trend, the market makes higher highs and higher lows. In other words, the market moves in one direction with temporary pullbacks in the opposite direction. These pullbacks (retracements) typically turn around to the original trend direction at the support and resistance levels. So, to trade a trend, we wait for the market to make a higher high / lower low and retrace to the S&R level, before triggering the buy or sell.

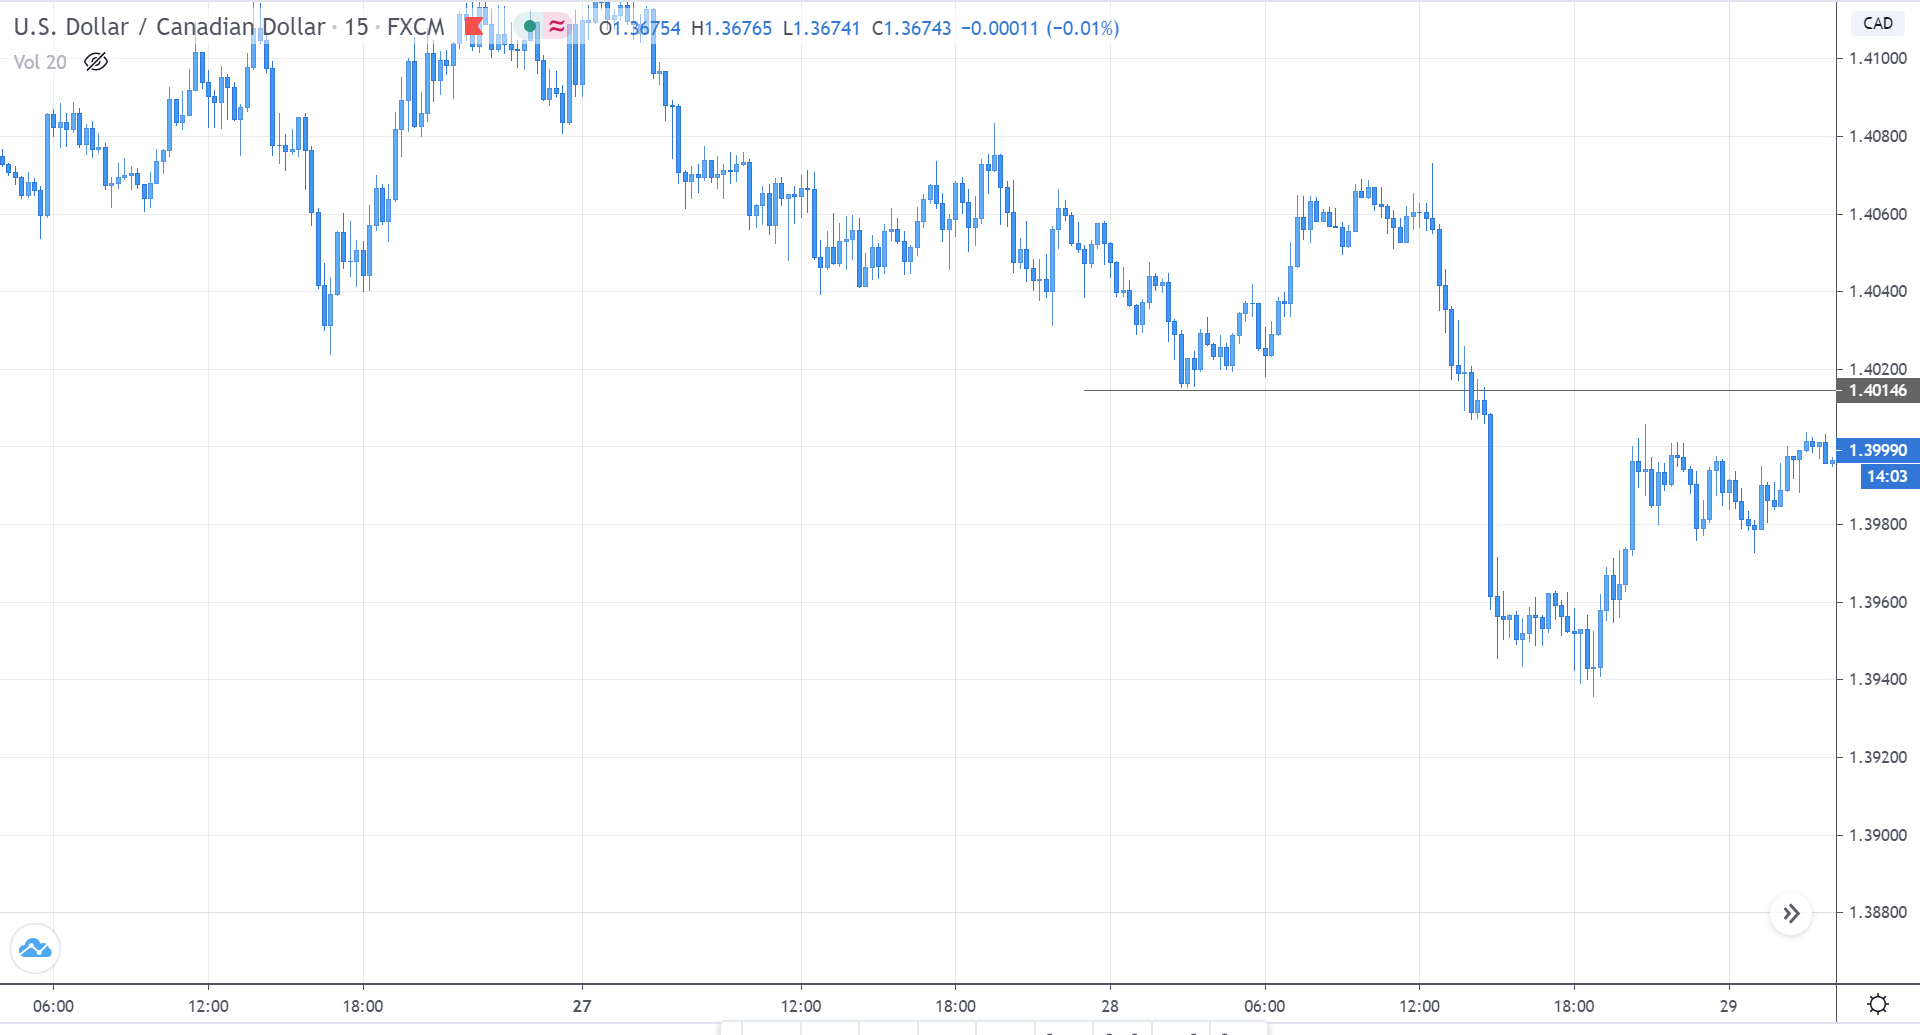
Consider the below chart of USD/CAD. The market is in a clear downtrend. The market made a new lower low by breaking below the grey ray. It then retraced back to the S&R area (grey ray) and is currently moving sideways. And this sideways movement in the market has high significance.

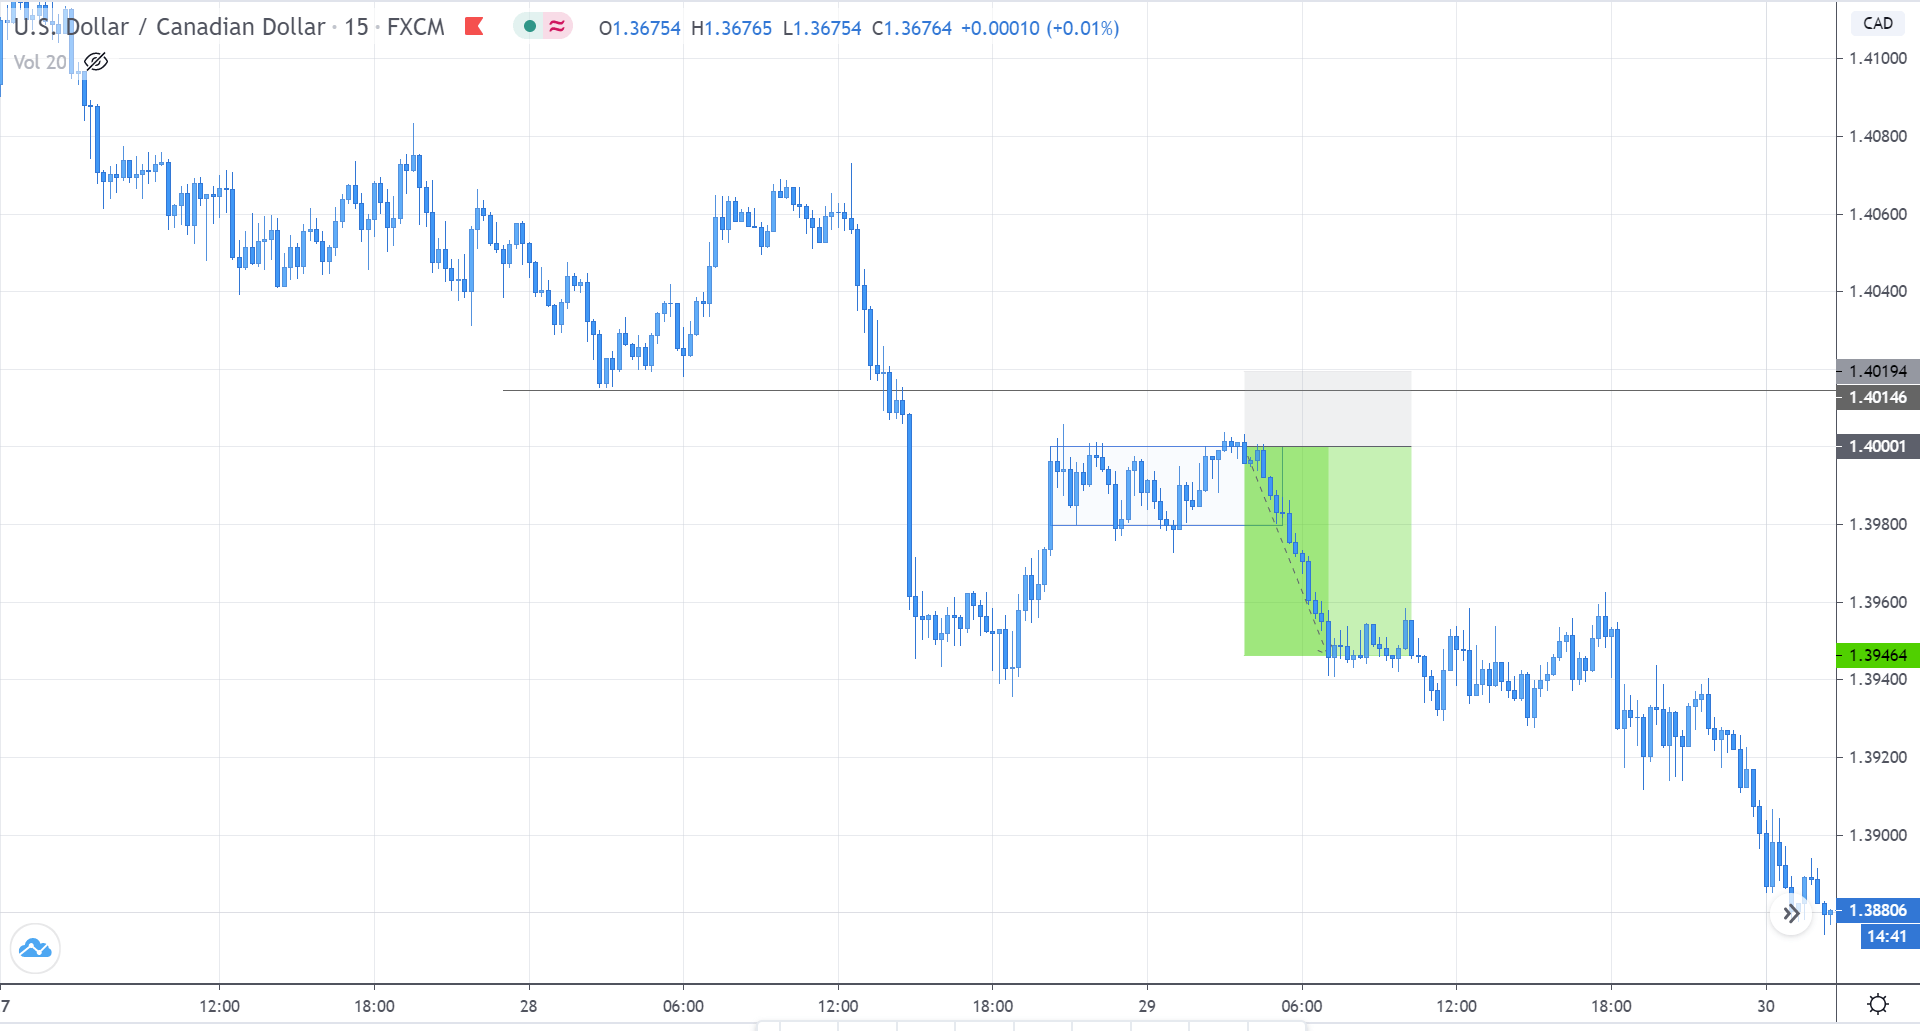
After the sellers made a new low, the buyers began to show up. They made it until the S&R level. And the market is currently in a range. As per the definition of a range, we know that there is strength from both the parties. In other words, the buyer who was temporarily dominating the market is slowing down as they are unable to make a higher high. And this price action is happening in the S&R area of the sellers. Therefore, we can conclude that the sellers are here to continue their downtrend.

One can enter when the price is at the top of the range (resistance) or when it starts to fall from the resistance. Placing the stop-loss few pips above the S&R level, and a take profit at the Low, is the safest approach to trade a trend.

Trading a Range

In a range, the market moves between levels – Support and Resistance. In this type of market, there is power from both buyers and sellers. Typically, the market shoots up from the support and drops from the resistance. However, randomly buying at support and selling from resistance is not the right way to trade a range like a professional. To trade a range with high odds in your favor, you must be aware of the overall trend. And you place your bets on the direction of the overall trend.

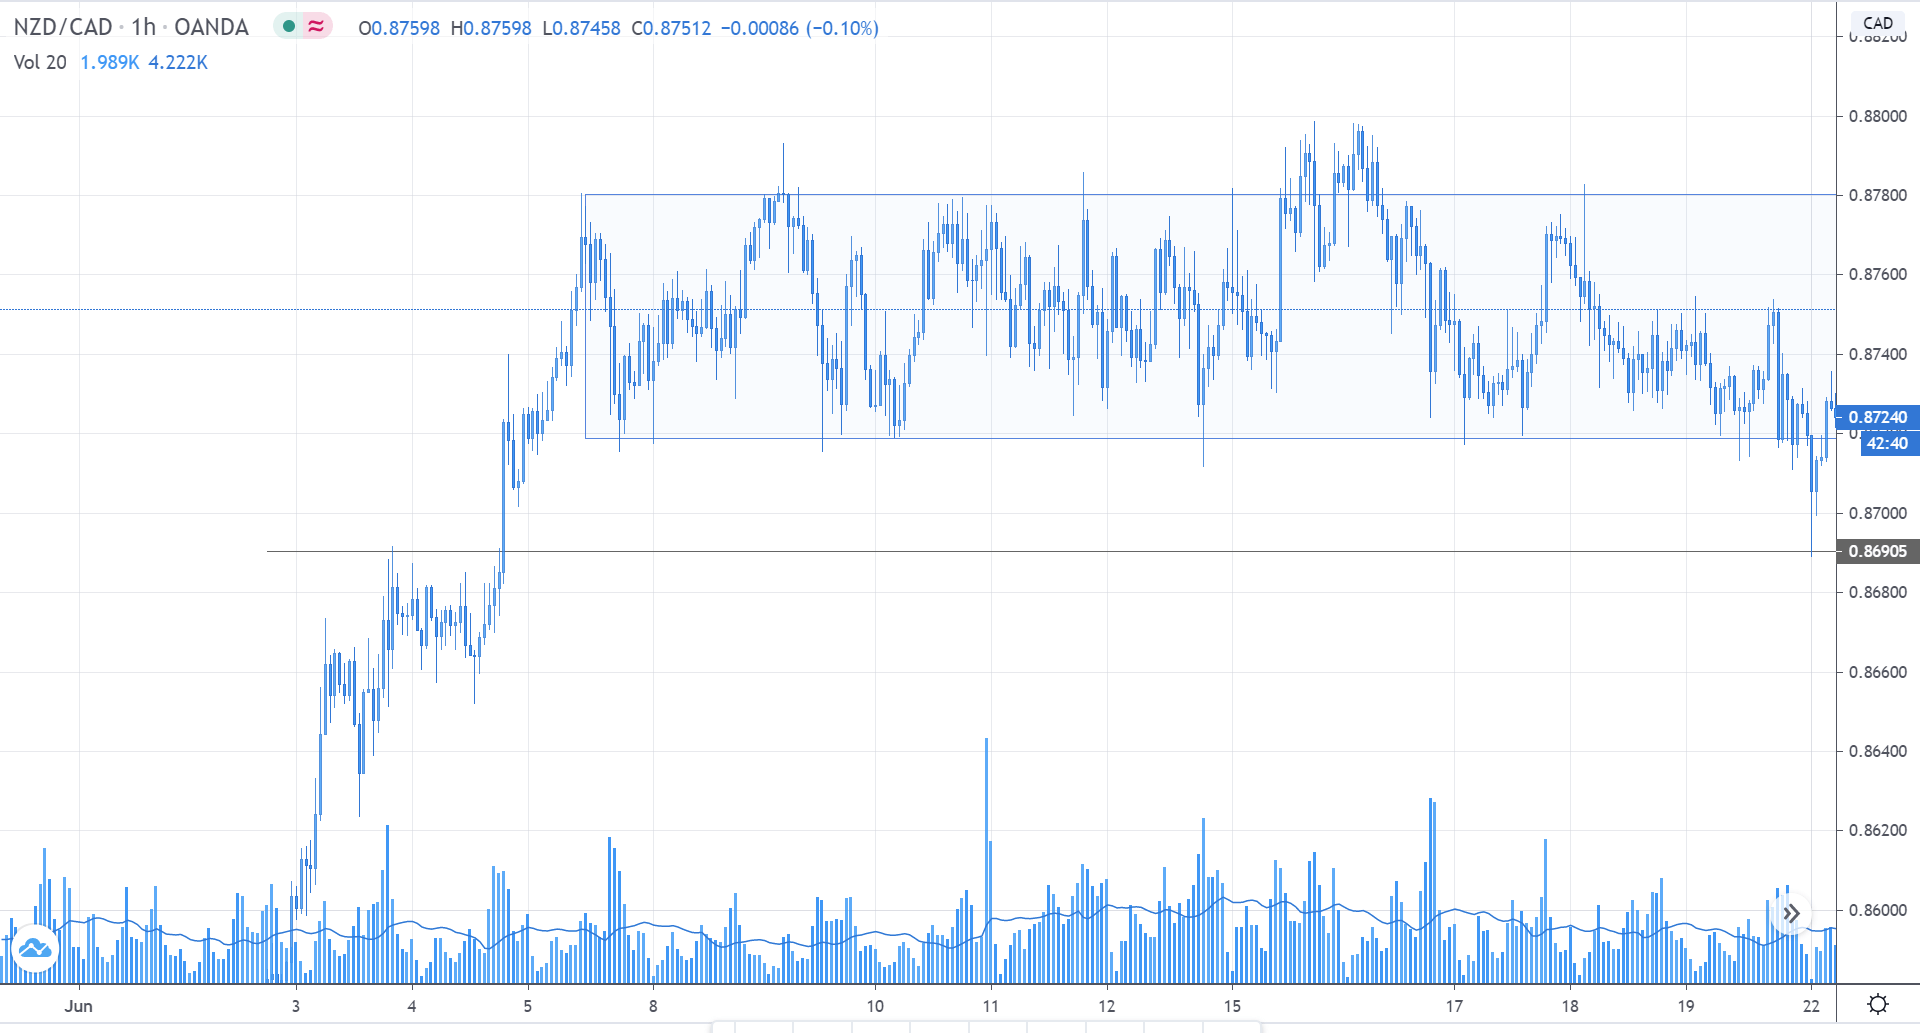
Consider the below chart of NZD/CAD. We can clearly see that the market is in a range. But, looking from the left, the market is in a strong uptrend, and the price is holding above the S&R level (grey ray). In the current market, we see that the price dropped below the bottom of the range, touched the S&R level, and shot right back up into the range. Thus, confirming that the big buyer is preparing to do the buys.

Since the price strongly reacted off from the S&R level and held above the support of the range, we can prepare to go long on the market. Stop-loss from this trade would be below the S&R level, while the target point would be at the top of the range. In hindsight, the buyers were able to push the market above than the resistance.

This brings us to the end of this series. We hope you found this lesson and the previous chapters interesting and informative. Stay tuned until we release our new set of lessons.

[wp_quiz id=”79656″]
Categories
Forex Course

137. Differentiating between a Retracement and a Reversal

Introduction

Broadly speaking, there are three states in the market – trend, range, and channel. If we were to go a little more in detail, a market has components like retracement and reversal. Identifying and differentiating between a retracement and reversal is a skill in itself. In this lesson, let’s go and understand what these terms mean and how to differentiate them.

What is Retracement?

Retracement is the terminology usually associated in a trending market. We know that in a trending market, the price moves in one specific direction. For instance, an uptrend is defined as a sequence of higher highs and higher lows. As per the definition of an uptrend, the prices do not keep moving higher and higher continuously.

After trending up to a certain point, the price temporarily moves in the opposite direction. This movement against the original trend is referred to as retracement. Technically, the price action from a higher high to the higher low is called a retracement.

Uptrend Example

Downtrend Example

What is a Reversal?

A reversal can be defined as the overall change in the direction of the market. A market can reverse from an uptrend to a downtrend, or from a downtrend to an uptrend.

Reversal to the Upside

In this type of reversal, initially, the market trends in a downtrend making lower lows and lower highs. Later, the market goes into a transition state where the price typically ranges for a while. In other words, the price stops making lower lows and lows highs. Instead, it makes equal lows or higher lows. Finally, the market starts to trend north by making higher highs and lower lows.

Reversal to the Downside

This reversal happens when the market transits from an uptrend to a downtrend. In an uptrend, the price makes higher highs and higher lows. But, when the trend begins to diminish, the higher highs turn into equal highs, and higher lows start to become equal lows. Finally, when the seller’s pressure comes in, the price begins to make lower lows and lower highs, forming a downtrend. Thus, the complete scenario is referred to as a reversal.

Predicting a possible reversal or retracement in the market is pretty challenging. If you’re stuck in a position and unsure if it is a retracement or a reversal, you may try the following options to manage the trade:

  • Hold onto your positions by keeping the stop loss as it is. If it is a retracement, you can ride the trade, else get stopped if it is a reversal. This is the simplest approach.
  • If you are more inclined towards a reversal than a retracement, then you may close your positions. Based on where the market breaks through, you can look for re-entry. But, you might have to compromise on the risk: reward.
  • You could close the entire position and stay away from the pair and look for other opportunities. This is the safest option possible, especially for conservative traders.
[wp_quiz id=”79176″]
Categories
Forex Course

134. Knowing the State of the Market

Introduction

Many newcomers and novice traders believe that the market moves in a random direction. They think it is all about the fundamental factors that keep the market going. In reality, the market does move based on fundamental factors, but it doesn’t imply that the prices move in random directions. The prices on the charts move in a specific direction as they are nothing but the past transactions of the big institutional players.

Charts tell a lot about the market environment. It clearly determines who is in control of the market – the buyer or the sellers. Based on this, there are three states of the market:

  • Trend
  • Range
  • Channel

Broadly speaking, in any market, be it Stock, commodity, currency, or cryptocurrency, the prices move only these three states. Let us understand each of them.

Of course, there are several types of chart patterns, but they all fall in one of the types on a bigger picture. All technical traders must have an understanding of the market environment. Whatever be the strategy, it will work applied in the right state of the market. Also, every type of market has its own concepts to trade.

Trend

The most evident type of market is a trending market. At the same time, it is one of the most confusing states to understand. A trending market is a type where the prices make Higher High & Higher Low sequences or Lower Low & Lower High sequences. In other words, in a trending market, the prices make a Higher High / Lower Low, retrace to the Support & Resistance, and continue with the same pattern.

A trending market is a type that can be found in any type of market. That is, even in ranges and channels, trends can be spotted (in a miniature picture).

Based on the direction of the market, we can divide trends into two types –

Uptrend (Bullish) – A market that faces upwards is an uptrend. The price makes Higher Highs and Higher Lows. It is a market where the buyers (bulls) are in control of the market. Note that a Higher High alone cannot be regarded as an uptrend.

Downtrend (Bearish) – A market whose trajectory is downwards is referred to as a downtrend. The price moves by making Lower Lows and Lower Highs. In this market, the sellers (bears) dominate the market.

Range

A ranging market is a type where the price does not create Higher Highs of Lower Lows. Thus, it moves sideways. There is a certain price shoots up and a price where it drops. It moves within these two prices. In this market, both buyers and sellers are strong. For example, if we say the market is ranging between 0.1200 and 0.2400, it means that the buyers are pushing up the market to 0.2400 from 0.1200, while the sellers are hitting it right back down to 0.1200.

Channel

A channel is basically a tilted channel. In other sense, a channel is a trend that is quite weak. In a channel, the price does try to make a Higher Highs or Lower Lows but retraces deeply before going for the next set. In a trend, the market respects the Support & Resistance, but the channel does not.

We hope you were able to get a gist on the states of the market. In the coming article, we shall elaborate on each of the types and understand how to trade them.

[wp_quiz id=”81457″]
Categories
Forex Price-Action Strategies

Trading is the Hardest Way to Make the Easiest Money

Financial traders need to be very alert and patient to deal with the market. These two components are vital for a trader to be successful in trading. In today’s lesson, we are going to demonstrate an example of alertness and patience. Let us get started.

The price heads towards the South. Ideally, a trader shall look for short opportunities in a chart like this. The last candle comes out as a bullish reversal candle. It is time for consolidation and waiting to get a downside breakout to take a short entry.

The price seems to go too far. It consolidates and produces a bearish engulfing candle. We may flip over to the H4 chart to find an entry since this is a daily chart. The support level looks strong since it created a long bullish move. The price may play around the level for a while.

As expected, the price stalls at the level of support. Things are different now. A downside breakout would make the pair bearish. A bullish reversal candle would make the traders look for long opportunities. This is where traders must be alert and never be rigid with their initial thought.

A bullish reversal candle forms right at the level of support. Traders may want to flip over to the H4 chart to look for long opportunities. We are not flipping over to the H4 chart this time since I know what happens afterward. Our trading lesson today is going to emphasizes something else.

The price heads towards the South instead. The H4 chart does not offer any entry after that daily bullish engulfing candle. Now, the price action is choppy. It seems that it is a chart to avoid for a while.

Not really, be alert. The price obeys a down-trending channel. Thus, any rejection at the upper band may create short opportunities. The price heads towards the resistance. Let us wait for a bearish reversal candle at the upper band (resistance of the channel).

The price makes a breakout at the upper band instead. It consolidates and produces a Spinning Top. Again, we are to change our trading direction. This time we are to go long.

The last candle breaches the horizontal resistance after consolidation. A long entry may be triggered right after the candle closes. Let us proceed to find out what happens next.

Two consecutive bullish candles form right after the breakout candle. Formation of a bearish reversal candle signals that it may be time to come out with a profit. At last, we make some green pips by going long.

The Bottom Line

This is an example of why we must not be rigid with our direction and how important it is to be alert with price patterns. Trading is never easy. As they say, “Trading is the hardest way to make the easiest money”. If we work hard in learning, only then we will be able to make money easily.

Categories
Forex Price Action

Price Action, Market Psychology, and Adjustment

Price action traders are to get clues from what the price has been doing. Horizontal Support/ Resistance, Trend Line Support/Resistance, Fibonacci Levels, Equidistant Channel along with Candlestick Pattern are price action trader’s main weapons. A trader must know how to use these tools as far as price action trading is concerned. Moreover, traders often need to adjust to marking levels, which are to be integrated with price action and market psychology. In today’s lesson, we are going to show an example of that.

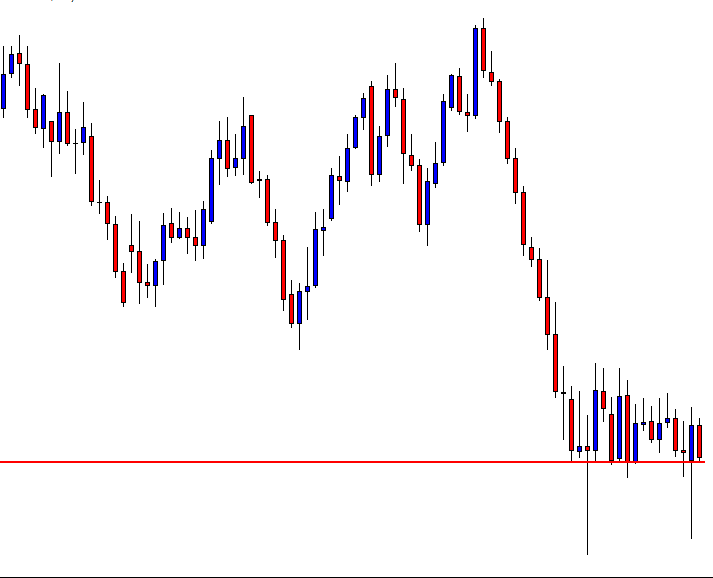
The price has been heading towards the downside with strong bearish momentum. Ideally, traders are to look for short opportunities at upside pullback. See the first reversal candle. The candle closes within the support of the last bearish candle. Thus, the traders must wait to go short since the support holds the price. Let us see what happens next.

At the last candle, the price goes towards the downside but comes back within the support again. Equations are different now. Long lower shadow and proven support suggest that the traders may have to wait longer than they thought.

As expected, the price consolidates on choppy price action, which makes traders wait. Traders find horizontal support. Let us draw it.

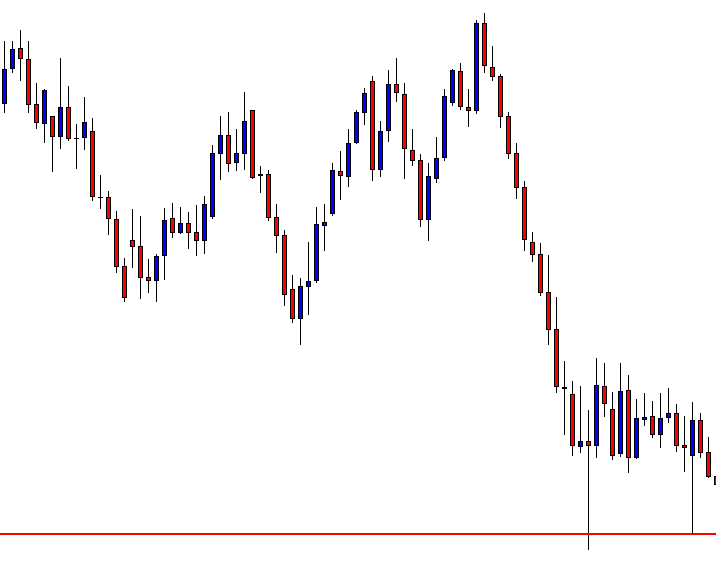
The price obeys the support level several times. However, do not forget that the price had a strong rejection. This is where traders may need to make an adjustment.


The price has been heading towards the adjusted support. Risk-Reward does not look right here. It is better to wait for either a downside breakout or a bullish reversal to go long. Let us see what happens next.


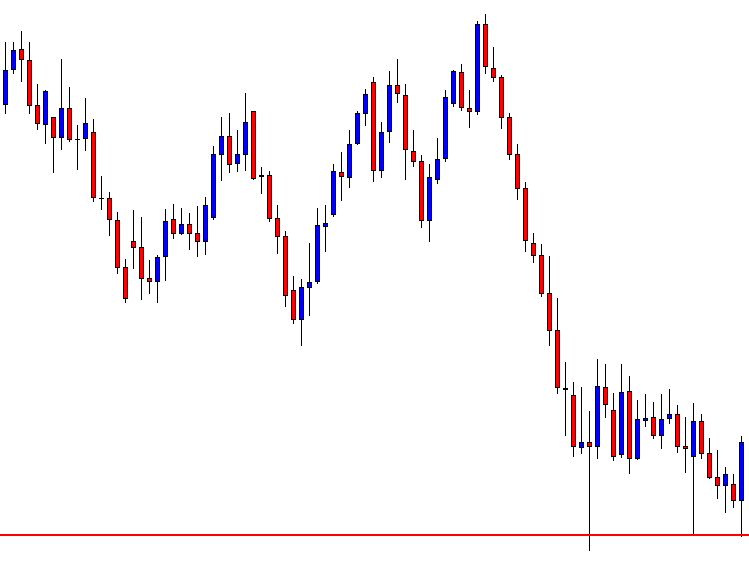
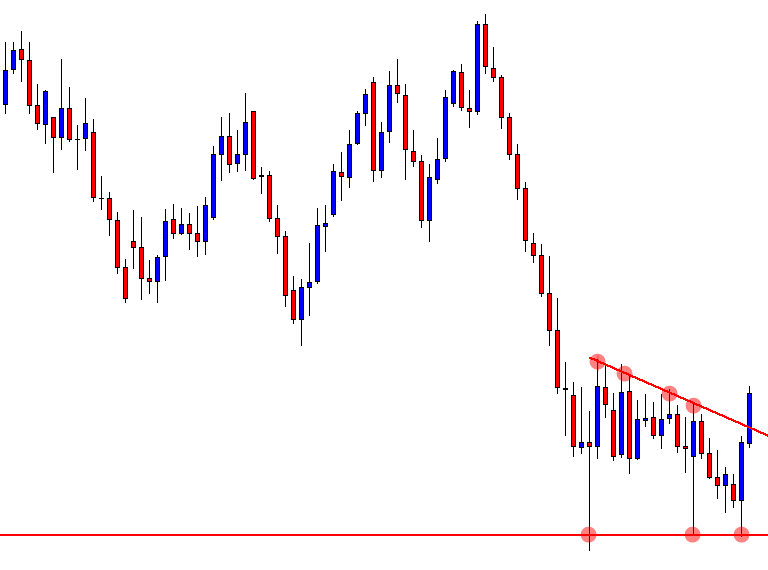
We have a bullish reversal here. A bullish engulfing candle right at the support level suggests that the traders may have to look for long opportunities here. The question is, shall we take an entry right after the last candle closes or not. The answer is ‘No”. We have to wait for an upside breakout. Can you guess where the breakout level is? Think for a minute, and then proceed to the chart below.

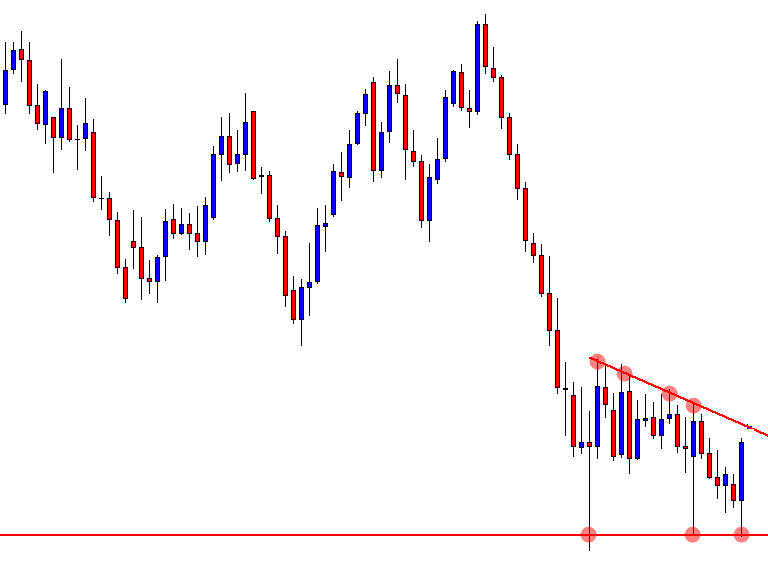
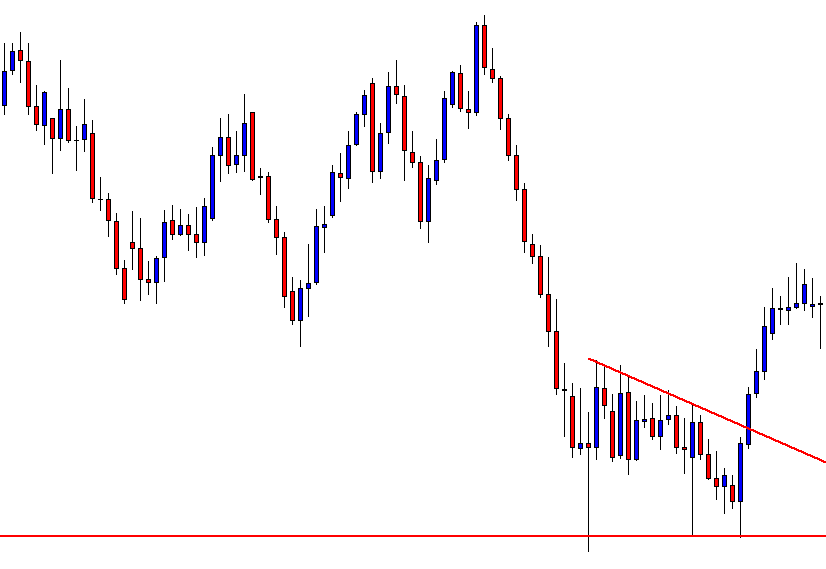
The price has been obeying a down-trending Trend line producing a Descending Triangle. Thus, the breakout at the Trend line resistance is a signal to go long here. All the buyers need here a breakout by a bullish Marubozu candle.

Here comes the breakout that the price action traders shall wait for. The buyers may trigger a long entry right after the breakout candle closes. Stop Loss is to be set below the horizontal support. Let us find out how it proceeds.

The price heads towards the North and provides 1:1 Risk-Reward. So far here, it seems that it is having consolidation. Some traders may want to come out with their profit. Some may shift their Stop Loss at the breakeven and take some profit out targeting to go all the way towards the swing high. This depends on how a trader wants to manage his trade. With these above charts and examples, we have realized the importance of adjustment in marking support/resistance.


Categories
Forex Price Action

Equidistant Channel Trading: What Else to Consider?

Equidistant Channel is a very reliable trading tool for the price action traders. In an ascending Equidistant Channel, the buyers wait for the price to come at the support level and to get a bullish reversal candle to go long. It is vice versa, in the case of a descending channel. However, some other equations are to be taken care of by the traders when trading with an Equidistant Channel. In today’s lesson, this is what we are going to demonstrate. Let us get started.

The chart above shows that the price is caught within an ascending Equidistant Channel. Look at the last bearish wave. After a rejection, the price heads towards the support. As a trader, we shall wait for a bullish reversal candle to go long here. Let us proceed to find out what happens next.

Wow! The price action traders always dream of this. This is one good bullish reversal candle. A bullish engulfing candle right at the channel’s support, the buyers, shall jump into the pair to start buying. However, we must set stop loss, take profit. Stop Loss level looks very evident here, which will be below the signal candle (Bullish Engulfing Candle here). What is about the Take Profit level? Where shall we set it? Typically, we set it at the upper band of the channel since the price usually goes towards the resistance of the channel after having a bounce at the support level.

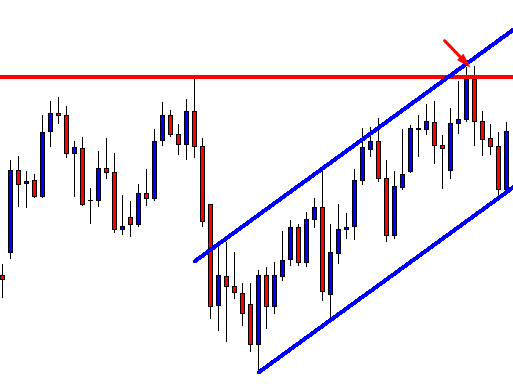
Look at the chart. At the last wave, the price produced a bearish engulfing candle right at a strong horizontal resistance (arrowed). It had a rejection at this level earlier, as well. Thus, this is a level, which must be counted at the time of setting Take Profit level.

Despite having an engulfing daily candle, the price does not head towards the North with a good buying pressure. Anyway, it heads towards the upside. Look at the rejection. This means setting our take profit at the horizontal resistance would give us 1:1 risk and reward ratio here. This is not bad. However, if we make a target to go all the way towards the upper band, it may get us a loss instead.

Let us see how the price action acts afterward.

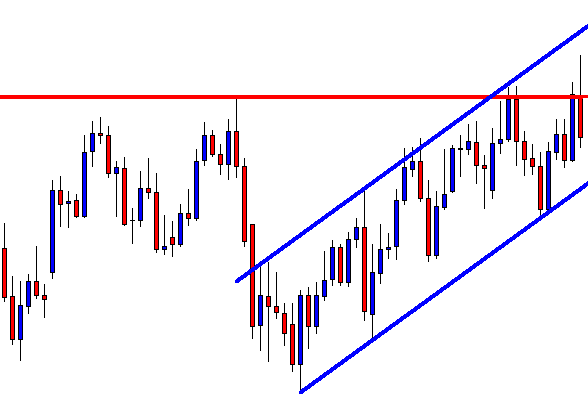
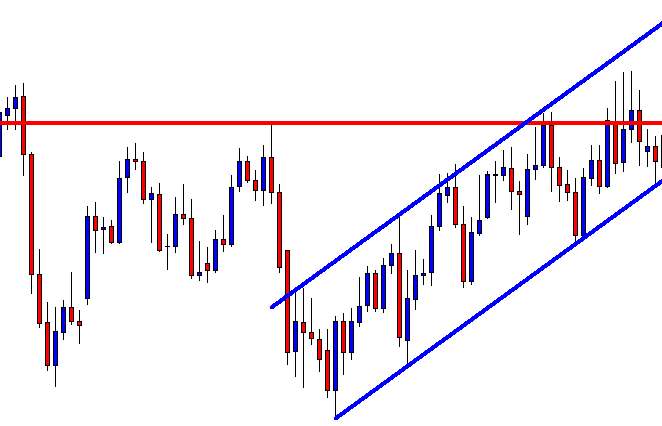
We would not make a loss here, but see how the price action has been. It gets choppy. It may still offer more long entries since the support is held by the price. However, we know what else is to look for, a breakout at a significant level of horizontal resistance.

Key Points to Remember in Equidistant Channel trading:

  1. A significant level of horizontal support/resistance is to be broken.
  2. If there is no horizontal support/resistance, an anti-trend line is to be broken.
  3. The signal candle is to be a strong trend reversal candle.
  4. In the case of having horizontal support/resistance in the middle of a channel, at least the Risk-Reward ratio is to be 1:1.
Categories
Forex Educational Library

Transmission Channels of Economic Cycles

 Abstract

The economic cycles are one essential topic studied by the economy. There is a wide variety of literature that mentions the fluctuations and long-term trends of economies. But behind these cycles and trends, there are variables that explain why the economy behaves in that way and are also affected by the state of the economy. These variables are the level of employment in an economy and access to credit by companies and individuals. When an economy is slowed, the level of unemployment increases and access to credit is restricted due to higher provisions of the banks due to a higher risk of default. It is important to analyze how these variables are found to examine which economic cycle this country is.


Some variables may be magnified or affected by economic cycles, a topic analyzed in the article Cycles and Economic Oscillations. Two of the variables that will be analyzed are employment and the financial sector. If it is possible to understand how these variables behave in the business cycle of the economy, it will be possible to understand the mechanisms of propagation of shocks. In the case of the labor market when presenting certain rigidities, it does not react immediately to changes in the economic cycle; on the contrary, it takes time to balance. There are several explanations of why real wages can be rigid.

The first theory that tries to explain why wages are rigid is the existence of long-term contracts between workers and companies. Long-term contracts provide insurance and specific parameters that must be respected by both parties so that wages can be stable over time regardless of the labor market situation. Another theory highlights the role of unions which try to ensure the employment situation of their members and the actions taken for this can generate rigidities. The last theory that deals with the rigidities of the labor market are efficiency wages. The more a person’s salary is, the more incentives they will have to develop their work better.

But efficiency wages do not explain well why wages should be rigid since companies can in some cases verify the efficiency of their workers and, accordingly, set wages. In addition, there are currently performance bonds that serve to incentivize their workers. Workers make further efforts when economic cycles are in a depression or recession phase, since unemployment increases in these cycles, which makes it riskier to lose their jobs because it will be harder to find work. Therefore, salaries will be increased when there are better employment rates because there is more incentive for workers to perform well.

The frictions of the labor market, although they generate that there is an uncoupling between the economic cycle and the labor market, also reflect the situation in which the economy finds itself because the variables of the labor market present fluctuations like the economy. Also, these rigidities generate persistence in some variables such as wages and the unemployment rate which implies that when setting monetary and fiscal policies it is necessary to keep in mind that the variables do not respond instantaneously but rather adapt slowly due to the persistence in shocks.

The difficulties of the salary to adjust to full employment and the speed with which the long-term employment flows are adjusted contribute to understanding how the product is behaving throughout the cycles. Real rigidity also helps magnify nominal rigidities, by making companies more sensitives in their utility when there are price changes. When an economy is in cycles of depression or recession, there is evidence of increases in unemployment due to lower growth which leads to more layoffs and when people try to find new jobs offer them less salary which implies a drop in productivity.


It is because of these problems that the policies of governments and financial entities should be directed to develop financial markets better and make their access easier. If there is a financial market where companies can obtain loans for the development of their activities, the destruction of employment can be avoided, which will prevent wages from falling. The credit channels will be incentivized by monetary policies that affect the volume of loans of the banks and how this, in turn, affects the aggregate demand. That the loan channels are a variable of the monetary policy that can be used in addition to the management of the interest rate by the central bank.

If there were no distortions in financial markets, the demand for funds from companies would always be covered. Due to some regulations, credit channels are not continuously available to all businesses. The companies that are most affected by these rules and behavior of banks are medium and small companies which face higher loan costs, and it is not easy to enter the capital market because there are transaction costs to issue their shares, so they also do not have access to this means of financing. In the following graph, you can see the market capitalization of several countries.

Graph 31. Market Capitalization of listed domestic companies. Data taken from the World Bank.


Credit channels are a mechanism used by monetary policy but also serve as a propagation of the economic cycle in the face of a shock. The primary source of transmission of business cycles in credit channels is the volume of loans issued by financial institutions. When there is less volume of loans due to provisions that banks have for bad credits granted, there are fewer resources to issue loans which affect the level of activity of an economy since investors cannot ask for as many resources as they would like.

On the contrary, when there are booms in the economies, credits increase as banks have fewer provisions for bad loans and can lend more. These correlations occur in most countries regardless of domestic production or the development of the financial system. It is important to mention that the provisions affect the profits of banks which also affects the incentives to lend during recessions where it is normal for many of their loans to be risky.

To carry out some projects, medium and small companies must finance using their resources or some specialized entities. Even the issuance of bonds is limited to these types of companies due to the transaction and valuation costs of their assets. These high costs faced by companies are due to information asymmetries where banks must invest part of their resources in research to the people they are willing to lend to. Besides, as already mentioned, the provisions are also costly for the utility of the banks, so the risk they face when they lend money is transferred to their potential clients. The following graph shows the percentage of domestic loans provided by the financial system. There is a relationship between higher development and a more developed and accessible financial sector.

Graph 32. Domestic credit provided by the financial sector. Data taken from the World Bank.

In addition, banks cannot always be monitoring if their clients are using their resources properly, which is called in the economy, moral hazard. Moral hazard exists when a person can have bad behaviors and has no consequences. In the case of banks, people can be irresponsible with money management and take excessive risks, so banks must monitor the behavior of people.

Finally, when the central bank increases its interest rates, the banks adjust the credits they grant depending on demand and how their balance is, and if there are no credit restrictions, there will be no additional effects to a rebalancing in the credit market. But if there are some restrictions in the credit market, increases in rates will cause banks to lend less, also affecting the utility of banks and ultimately also affecting domestic production and investment in the economy.

In other cases, it is possible that external phenomena have repercussions on the national banking system and generate a crisis. For example, if there is a decline concerning trade and a depreciation of the currency might be considered, this may place the economy in a worse equilibrium in which people start panicking. Therefore, this state of panic may drive people to try to get all their deposits out from the banks, generating an effect where the bank runs out of liquidity but with multiple obligations, which might force banks to bankruptcy. These bank failures may induce a financial system collapse, external financing cut, currency depreciates even more, and production enters a crisis.

In open economies, the ability of the government to rescue banks is limited to the availability of international reserves. In addition, when there is a crisis in an open economy with exchange rate parity, this crisis not only affects banks, it also affects such parity, so in some countries with this system of exchange rates a financial crisis and crisis of exchange can be generated at the same time.

In conclusion, economic cycles and their fluctuations can be magnified depending on the state in which some variables are found and their rigidities. The labor market can give clues about what the current state of the economy is like and in what stage it is. Besides, the financial sector also responds to these cycles, and there may be crises during periods of recession or depression if the regulations or the way banks act is erroneous. That is why it is important to analyze different areas of the economy to understand what cycle it is in, how mature is that trend and what are the lags that can be identified to forecast the behavior of domestic production of a country.

©Forex.Academy

Categories
Forex Basics

Everything you should master to Detect Trends, and more!

Introduction

In chapter 1, we’ve set the foundations of market classification, what a trend is about, and the dissection of a trend in its several phases. Then we talked about its two dissimilar wave parts: an impulsive wave, followed by a corrective wave.  We dealt with support, resistance, and breakouts. Finally, we talked about channel contractions.

In this second chapter, we’ll learn the methods available in the early discovery of trends: Trendlines, moving averages, and Bollinger band channels.

Trendlines

A trendline is a line drawn touching two or more lows or highs of a bar or candlestick chart. The convention is to draw the line touching the lows if it’s an uptrend and the tops on a downtrend. Sometimes both are drawn to form a channel where the majority of prices fit.

As we see in Fig. 1 the trendline tends to draw resistance levels or supports where the price finds it difficult to cross, bouncing from there, although not always this happens. In Fig. 1 the first trendline has been crossed over by the price, and during the following bars, the slope of the downtrend diminished.  We saw, then, that the first trendline switched its role and now is acting as price support.

When the second trendline was crossed over by the price, a bottom has been created, and a new uptrend started. After a while trending up, we might note that we needed a second trend line to more accurately follow the new bottoms because the uptrend has sped up, and the first trendline is no longer able to track them.

Fig. 2 shows two channels made of trendlines, one descending and the other ascending. The trendline allows us to watch the volatility of the trend and the potential profit within the channel. The trend, as is depicted, has been drawn after it has been developing for a long lapse. Therefore, it’s drawn after the fact.  If we look at the descending channel, we observe that during the middle of the trend, the upper trendline doesn’t touch the price highs. So, this channel would look different at that stage of the chart.

I find more reliable the use of horizontal lines at support and resistance levels and breakouts/breakdowns at the end of a corrective wave. But, if we get a well-behaved trend, such as the second leg in fig 2, a channel might help us assess the channel profitability and assign better targets to our trades. If we use horizontal trendlines together with the trend channel (see Fig 2.b) it’s possible to better visualize profitable entry points and its targets, and, then, compute its reward to risk ratio.  The use of the Williams %R indicator (bottom graph) confirms entry and exit points.

Fig. 2b graph’s horizontal red lines show how resistance becomes the support in the next leg of a trend.

As a summary:

  • A trendline points at the direction of the trend and acts as a support or as a resistance, depending on the price trend direction.
  • If a second trendline is needed, we should pay attention if it shows acceleration or deceleration of the price movement.
  • If the price crosses over or crosses under the trendline, it may show a bottom or a top, and a trend change.
  • A trendline channel helps us assess the potential profitability and assign proper targets to our next trade.

Moving Averages (MA)

Note: At the end of this document, an Appendix discusses some basic statistical definitions, that may help with the formulas presented in this section, although reading it isn’t needed to understand this section.

Some centuries back, Karl Friedrich Gauss demonstrated that an average is the best estimator of random series.

Moving averages are used to smooth the price action. It acts as a low-pass filter, removing most of the fast changes in price, considered as noise. How smooth this pass filter behaves, is defined by its period. A moving average of 3 periods smoothens just three periods, while a 200-period moving average smoothens over the last 200 price values.

Usually, a Moving Average is calculated using the close of every bar, but there can be any other of the price points of a bar, or a weighted average of all price points.

Moving averages are computationally friendly. Thus, it’s easier to build a computerized algorithm using moving average crossovers than using trendlines.

Most Popular types of moving averages

Simple Moving Average(SMA):

The simple moving average is computed as the sum of all prices on the period and divided by the period.

The main issue with the SMA is its sudden change in value if a significant price movement is dropped off, especially if a short period has been chosen.

Average-modified method (AvgOff)

To avoid the drop-off problem of the SMA, the computation of an avgOff MA is made using and average-modified method:

Weighted moving average

The weighted moving average adds a different weight to every price point in the period of calculation before performing the summation. If all weights are 1, then we get the Simple Moving Average.

Since we divide by the sum of weights, they don’t need to add up to 1.

A usual form of weight distribution is such that recent prices receive more weight than former prices, so price importance is reduced as it becomes old.

w1 < w2 < w3… < wn

Weights may take any form, most popular being Triangular and exponential weighting.

To implement triangular weighting on a window of n periods, the weights increase linearly from 1 the central element (n/2), then decrease to the last element n.

Exponential weighting is an easy implementation:

EMAt = EMAt-1 + a x (pt Et-1)

Where a, the smoothing constant, is in the interval 0< a < 1

The smoothing property comes at a price:  MA’s lags price, the longer the period, the higher the lag of the average. The use of weighting factors helps reducing it. That’s the reason traders prefer exponential and weighted moving averages: Reducing the lag of the average is thought to improve the edge of entries and exits.

Fig 3 shows how the different flavors of a 30-period MA behave on a chart. We may observe that the front-weighted MA is the one with a slope very close to prices, Exponential MA is faster following price, but Triangular MA is the one with less fake price crosses, along with simple MA: The catch is: We need to test which fits better in our strategy. The experience tells that, sometimes, the simpler, the better.

Detecting the trend using a moving average is simple. We select the average period to be about half the period of the market cycle. Usually, a 30 day/bar MA is adequate for short-term swings.

One method to decide the trend direction is to consider it a bull leg if the bar close is above the moving average; and a bear leg if the close is below the average.

Another method is to watch the slope of the moving average as if it were a trendline. If it bends up, then it’s a bull trend, and if it turns down, it’s a bear trend.

A third method is to use two moving averages:   Fast-Slow (Fast -> smaller period).

In this case, there are two variations:

  1. Moving average crossovers
  2. All the averages are pointing in the same direction.

As with the case of a single MA, a price retracement that touches the slower average is an opportunity to add to the position.

For example, using a 30-10 MA crossover: If the fast MA crosses over the slow MA, we consider it bullish; if it crosses under, bearish.

Using the method of both MA’s pointing in the same direction, we avoid false signals when the fast MA crosses the slow one, but the slow MA keeps pointing up.

When using MA crossovers, we are forbidden to take short trades if the fast MA is above the slow MA, but we’re allowed to add to the position at price pullbacks. Likewise, we’re not allowed to trade on the buy side if the fast MA is below the slow MA.

Using smaller periods, for instance, 5-10 MA, it’s possible to enter and exit the impulsive legs of a trend.  Then, the 10-30MA crossovers are used to allow just one type of trade, depending on the trend direction, and the 5-10 MA crossover is actually used as signal entry and exit (if we don’t use targets). In bull trends, for example, we may enter with the 5MA crossing over the 10MA, and we exit when it crosses under.

Bollinger Band Channel

We already touched channels that were made of two trendlines. There is another computationally friendly channel type that allows early trend detection and trading.

One of my favorite channel types is using Bollinger Bands as a framework to guide me.

A Bollinger Band is a volatility channel and was developed by John Bollinger, which popularized the 20-period, 2 standard deviations (SD) band.

This standard Bollinger band has a centerline that is a simple moving average of the 20-period MA. Then an upper band is drawn that is 2 standard deviations from the mean and a lower band that’s 2 standard deviations below it.

I tend to use two or three 30-period Bollinger bands. The first band is one SD wide, and the second one is two SD apart from the mean. A third band using 3 standard deviations might be, also, useful.

Fig 6 shows a very contracted chart with 3 Bollinger bands to show how it looks and distinguishing periods of low volatility.

During bull trends, the price moves above the mean of the Bollinger band.  During bear markets, the price is below the average line of the bands.

On impulsive legs of a trend, the price goes above 1-SD (or below on downtrends), and it continues moving until it crosses the 2-SD line, sometimes it even crosses the third 3-SD line. Price beyond 2 SDs is a clear sign of overbought or oversold. On corrective legs, the price goes back to the mean. During those phases volatility contracts, and is an excellent place to enter at breakouts or breakdowns of the trading range.

Below Fig. 7 shows an amplified segment of Fig 6, with volatility contractions circled. We may observe, also, how price moves to the mean, after crossing the 2 and 3 std lines.


Grading your performance

According to Dr. Alexander Elder, the market is testing us every day. Only most traders don’t bother looking at their grades.

Channels help us grade the quality of our trades. To do it, you may use two trendlines or some other measure of the channel. If you don’t see one, expand the view of the chart.

When entering a trade, we should measure the height of the channel from the bottom to its top.  Let’s say it’s 100 pips.  Suppose you buy at ¾ of the upper bound and sell 10 pips later. If you take 10 pips out of 100 pips, your trade quality is 10/100 or 1/10. How does this qualify?

According to Elder’s classification, any trade that takes 30% or more of a channel is credited with an A. If you make between 20 and 30%, your grade will be B. Between 10 and 20% you’re given a C and a D if you make less than 10%.  So, in this case, your grade is C.

Good traders record their performance. Dr. Elder recommends adding a column for the height of the channel and another column for the percentage your trade took out of the channel.

Monitor your trades to see if your performance improves or deteriorated.  Check if it’s steady or erratic.  The information, together with the autopsy of your past trades, helps you spot where are your failures: Entries too late? Are you exiting too soon? Too much time on a losing or an underperforming trade?  A trade against the prevailing trend?


The next chapter will be dedicated to chart patterns.


Appendix: Statistics Overview

Statistics is a branch of mathematics that gives us information about a data set. Usually, the data set cannot be described by an analytical equation because they come from unpredictable or random events. As traders, we need basic knowledge, at least, of statistics for our job.

We can express statistical data numerically and graphically. Abraham de Moivre, back in the XVII century, observed that as the number of events (coin flips) increased, the shape of the binomial distribution approached a very smooth curve. De Moivre thought that if he could find the mathematical formula for this curve, he could solve problems such as the probability of 60 or more heads out of 100 coin flips. This he did, and the curve is called Normal distribution.

This distribution plays a significant role because of the fact that many natural events follow normal distribution shapes.  One of the first applications of this distribution was the error analysis of measurements made in astronomical observations, errors due to imperfect measuring instruments.

The same distribution was also discovered by Laplace in 1778 when he derived the central limit theorem. Laplace showed the central limit theorem holds even when the distribution is not normal and that the larger the sample, the closer its mean would be to the normal distribution.

It was Kark Friedrich Gauss, who derived the actual mathematical formula for the normal distribution. Therefore, now, Normal distribution is also named as Gaussian distribution.

Although prices don’t follow a normal distribution, it’s is used in finance to extract information from prices and trading statistics.

There are two main measures we use routinely: The center of our observations and the variability of the points in our data set from that mean.

There’s one main way to compute the center of a set: the mean. But it’s handy to know also the median if the distribution isn’t symmetrical.

Mean: It’s the average of a set of data. It’s computed adding all the elements of a set and divide by the number of elements:

Mean = Sum(p1-Pn)/n

Median: The median is the value located in the middle of a set after the set has been placed in ascending order. If the set has a symmetrical distribution, the median and the mean are the same or very close to it.

The variability of a data set may be calculated using different methods. Two main ways are used in financial markets:

Range: The easiest way to measure the variability. The range is the difference between the highest and lowest data of a set. On financial data, usually, a variant of the range is calculated: Average true range, which gives the average range over a time interval of the movement of prices.

Sample Variance(Var): Variance is a measure of the mean distance of the data points around its mean. It’s computed by first subtracting the average from all points: (xi-mean) and squaring this value. Then added together and dividing by n-1.

Var = 𝝈2 =∑ (x-mean)2 / (n-1),

whereis the symbol for the sum of all members of the set
By squaring (xi-mean), it takes out the negative sign from points smaller than the mean, so all errors add-up. The division by n-1 instead of n helps us not to be too much optimistic about the error. This measure increments the error measure on small samples, but as the samples increase, its result is closer and closer to a division by n.
If we take the square root of the variance, we obtain the standard deviation (𝝈 – sigma).

 Volatility: Volatility over a time period of a price series is computed by taking the annualized standard deviation of the logarithm of price returns multiplied by the square root of time expressed in days.

𝝈T = 𝝈annually √T


References:

New Systems and Methods 5th edition, Perry Kaufman

Trading with the Odds, Cynthia Kase

Come into my Trading Room, Alexander Elder

History of the Gaussian distribution http://onlinestatbook.com/2/normal_distribution/history_normal.html

https://en.wikipedia.org/wiki/Volatility_(finance)

Further readings:

Profitable Trading – Chapter 1: Market Anatomy

Profitable Trading Chapter III: Chart patterns

Profitable Trading – Computerised Studies I: DMI and ADX

Profitable Trading – Computerized Studies II: MACD

https://www.forex.academy/profitable-trading-computerized-studies-iii-psar/

Profitable Trading (VII) – Computerized Studies: Bands & Envelopes

Profitable Trading VIII – Computerized Studies V: Oscillators