Categories
Forex Fundamental Analysis

Everything You Should Know About ‘Retail Sales YoY’ Macro Economic Indicator

Introduction

The computation of gross domestic product takes into account the consumption by households. In the households’ consumption, the retail sales data is considered to be the best leading indicator. Retail sales account for the majority of consumption by households. Retail sales are estimated to account for up to 70% of the US economy. It is, therefore, important for forex traders to understand how it affects the economy and the currency.

Understanding Retail Sales YoY

Retail Sales: the definition of retail sales is the purchase of finished goods and services by the end consumers. As an economic indicator, retail sales are used to measure the changes in the value of the goods and services bought at the retail level. This change can be monthly (retail sales MoM) or over the previous twelve months (retail sales YoY).

Retail Sales YoY: covers the retail sales made to consumers for the preceding 12 calendar months. It measures the rate of change in the value of purchases made by households.

How Retail Sales YoY is Measured

The data collected for the YoY retail sales cover all retail outlets from physical stores to e-commerce. It also includes data from the services sector, such as hotels and restaurants. According to the US Census Bureau, retail sales are divided into 13 categories, which include: e-commerce retailers, department stores, food and beverage stores, health and beauty stores; furniture stores; hospitality, apparel, building stores, auto dealers, and gas stations.

In the US, the measurement of the annual retail sales is done using the Annual Retail Trade Survey (ARTS). The ARTS is aimed at giving the estimates of the national total annual sales, sales taxes, e-commerce sales, end-of-year inventories, purchases, total operating expenses, gross margins, and end-of-year accounts receivable for retail businesses. This survey is conducted annually.

The retail sales YoY tends to be influenced by the seasonality of the economic activities since it covers more extended periods. These seasons including the holiday shopping seasons account for about 20% of the retail sales YoY. As a result, retail sales YoY cannot be expected to provide the most current and up-to-date retail data.

How Retail Sales YoY can be used in Analysis

As aforementioned, the retail sales account for about 70% of the GDP, making it a vital leading indicator.

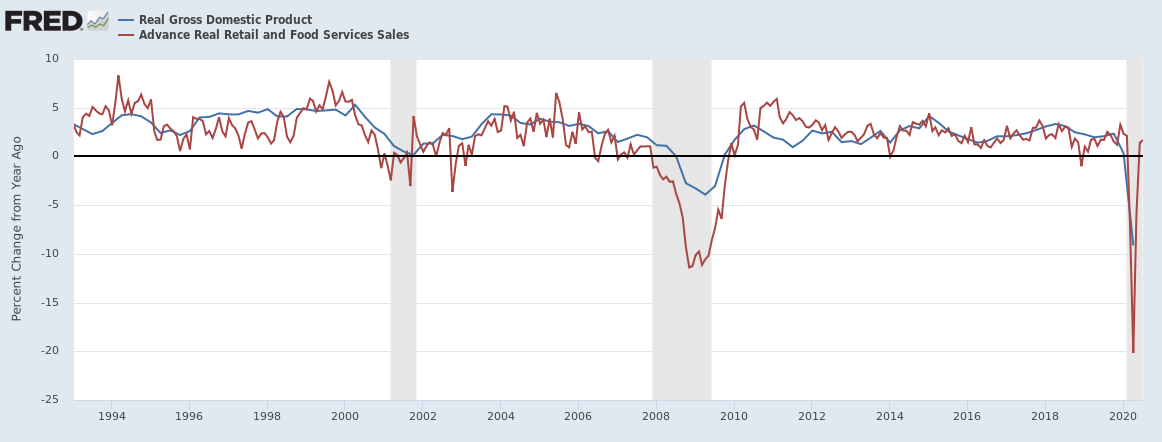
Consumer spending drives the economy. An increase in retail sales implies that more money is circulating in the economy. This increase could be a result of increased wages, which increases the disposable income, increase in the rate of employment; and accessibility to loans and credit. All these factors increase the aggregate demand within an economy. The increase in demand leads to an increase in aggregate supply. This increase leads to the creation of more employment opportunities due to the expansion of businesses. Therefore, a steady increase in the retail sales YoY signifies that the economy has been steadily expanding over the long term.

Source: St. Louis FRED

Declining retail sales YoY is an indicator that the economy might be contracting. The decrease in retail sales implies that there is less disposable income within the economy, either as a result of low wages or job cuts. Subsequently, there will be reduced demand for the finished goods and services in the economy, which will, in turn, compel producers to cut the output to avoid price distortion. The reduction in the production will force them to scale down their operations, leading to more unemployment. Thus, a continually decreasing retail sales YoY could be an indicator of a looming economic recession.

Since the retail sales YoY are spread out over 12 calendar months, it provides a comprehensive outlook for the central banks to monitor the effectiveness of their monetary policies. In the US, the Federal Reserve Board uses the accounts receivable data in monitoring retail credit lending.

Monitoring the retail sale YoY enables the Federal Reserve to keep an eye on the rate of inflation. A continually increasing retail sales YoY, if left unchecked, could lead to an increased rate of inflation beyond the target rate. Thus, to ensure this does not happen, the central banks consider this data when making the interest rate decision.

Conversely, since a continually decreasing retail sales YoY forebode a possibility of a recession, this data encourages governments and central banks to implement expansionary fiscal and monetary policies. These policies, such as cutting the interest rates, are meant to reduce the cost of borrowing and increase access to credit hence spurring demand within the economy.

Impact on Currency

As established, an increase in the retail sales YoY is synonymous with an increase in economic activities and an expanding economy. A country’s economic growth leads to an increase in the value of its currency. Thus, increasing retail sales YoY results in currency appreciation.

Conversely, the declining retail sales YoY forebodes a looming recession and a possible interest rate cut in the future. More so, this decline signifies an increase in the unemployment levels and a contracting economy. All these factors contribute to the depreciating of a country’s currency.

In the forex market, the retail sales YoY is a low-level economic indicator. It is overshadowed by the MoM retail sales data, which represents the more recent changes observed within the economy.

Sources of Retail Sales YoY Data

In the US, the retail sales YoY data is released monthly by the United States Census Bureau, along with the monthly updates. A comprehensive breakdown of the US retail sales YoY can be accessed at St. Louis FRED website. Statistics on the global retail sales YoY can be accessed at Trading Economics.

How Retail Sales YoY Data Release Affects The Forex Price Charts

The most recent retail sales YoY data was released on August 14, 2020, at 8.30 AM ET. A more in-depth review of the data release can be accessed at the US Census Bureau website.

The screengrab below is of the retail sales YoY from Investing.com. On the right is a legend that indicates the level of impact the fundamental indicator has on the USD.

As can be seen, the retail sales YoY data release is expected to cause low volatility on the USD.

In the 12 months to July 2020, the retail sales YoY in the US increased by 2.74%. This increase is higher compared to the previous increase of 2.12%. In theory, this increase should appreciate the USD relative to other currencies.

The screengrab above shows the simultaneous release of the monthly retail sales data and the retail sales YoY data. It is to be expected that the monthly retail sales data will dampen any impact that the retail sales YoY would have had on the price action.

EUR/USD: Before the Retail Sales, YoY Data Release on 
August 14, 2020, Just Before 8.30 AM ET

As we can see from the above 15-minute EUR/USD chart, the pair was trading in a weak uptrend. This trend is proved by the 15-minute candles crossing above the slightly rising 20-period Moving Average.

EUR/USD: After the  Retail Sales, YoY Data Release on 
August 14, 2020, at 8.30 AM ET

After the news announcement, the pair formed a 15-minute bullish candle. This candle indicates that the USD weakened against the EUR. Subsequently, the pair continued trading in a renewed uptrend as the 20-period MA rose steeply.

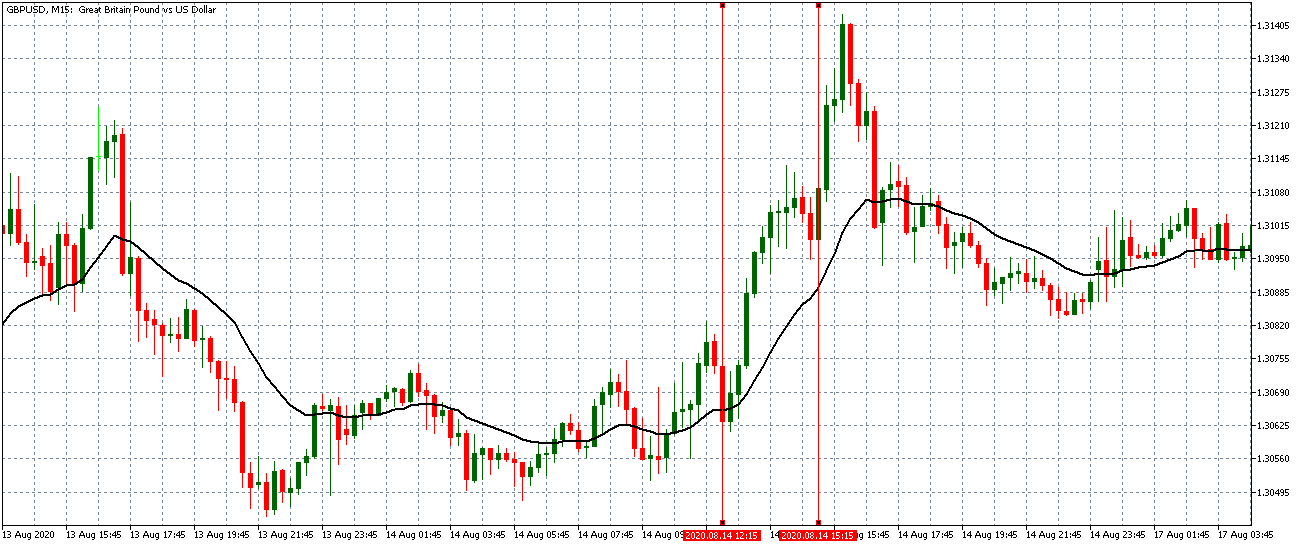
GBP/USD: Before the Retail Sales YoY Data Release on 
August 14, 2020, Just Before 8.30 AM ET

Before the data release, the GBP/USD pair was trading in a steady uptrend. This trend is evidenced by a steeply rising 20-period MA, with bullish candles forming further above it.

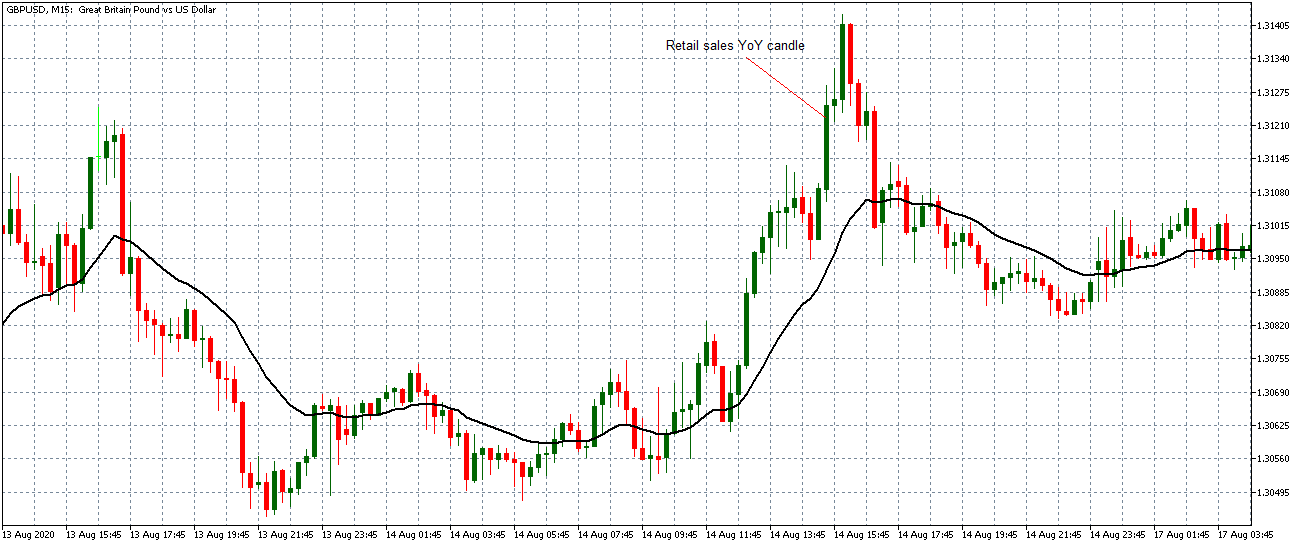
GBP/USD: After the  Retail Sales, YoY Data Release on 
August 14, 2020, at 8.30 AM ET

Similar to the EUR/USD, the GBP/USD pair formed a long 15-minute bullish candle after the news release. The pair continued to trade in the previously observed uptrend before peaking and slowly flattening.

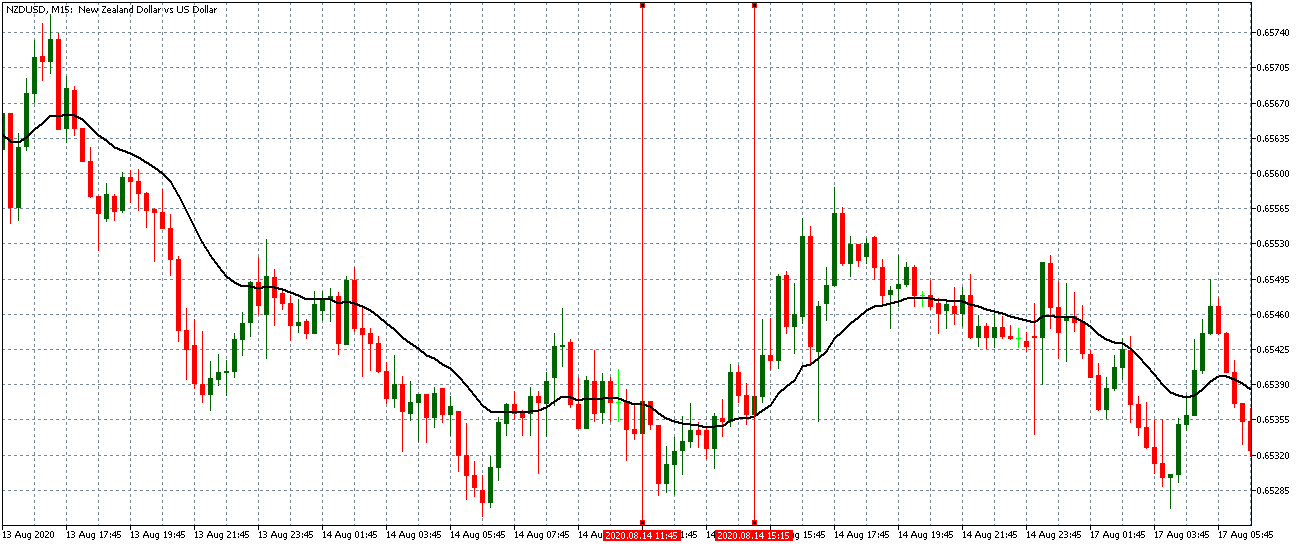
NZD/USD: Before the Retail Sales, YoY Data Release on 
August 14, 2020, Just Before 8.30 AM ET

NZD/USD: After the  Retail Sales, YoY Data Release on 
August 14, 2020, at 8.30 AM ET

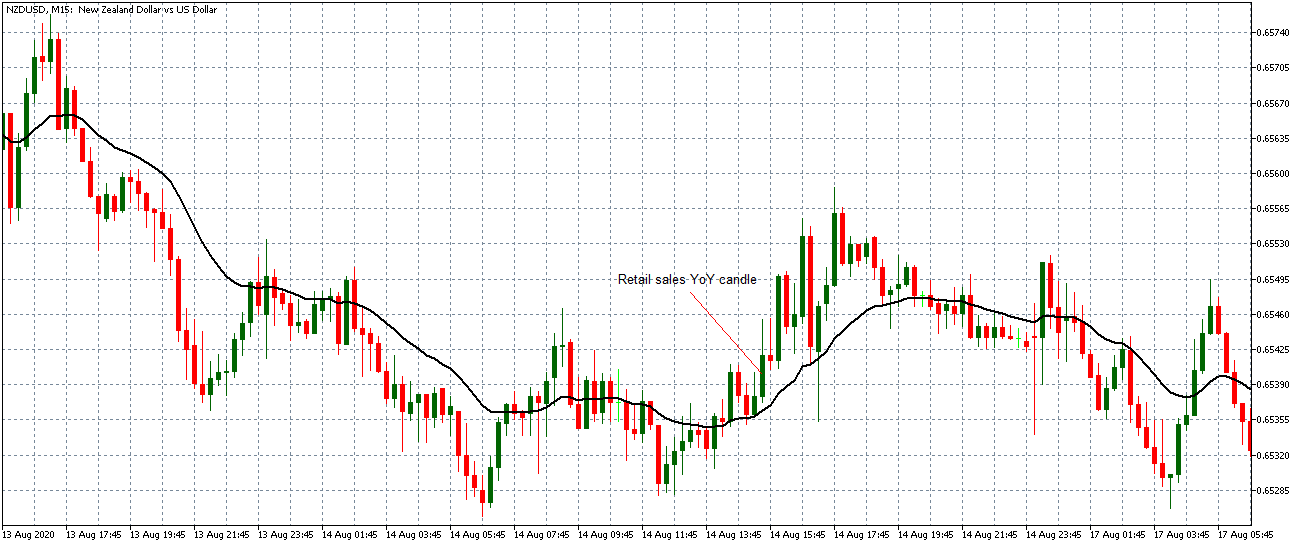
Before the retail sales YoY data release, the NZD/USD pair was trading in a similar trend as the EUR/USD pair. The 15-minute candles were crossing above a flattening 20-period Moving Average. After the news announcement, the pair formed a  long 15-minute bullish candle as did the EUR/USD and GBP/USD pairs. Subsequently, the pair traded in a renewed uptrend as the 20-period MA rose steeply with candles forming further above it.

Bottom Line

The retail sales YoY provides vital long-term data about the economic outlook of the households and their consumption patterns. In the forex markets, however, the retail sales YoY data is overshadowed by the retail sales MoM data, which is release concurrently. From this analysis, the increase of the retail sales YoY data for July 2020 had no impact on the price action since the markets reacted to the negative monthly retail sales data.

Categories
Forex Market Analysis

Daily FX Brief, September 30 – Major Trade Setups – Traders Set to Trade Monday! 

Happy Monday, Folks! 

A stellar week for the U.S. dollar index had price halt just shy of YTD highs at 99.37. Up 0.67% and recording its second week in positive territory, the next port of call, aside from 99.37, sits at 99.62, a robust weekly resistance level that draws history as far back as March 2015.

The main highlight of the week was U.S. House Speaker Pelosi opening a formal Trump impeachment inquiry over a controversial phone call between himself and his Ukrainian counterpart. Data was largely ignored. 

Consumer confidence declined in September, following a small slump in August. The Index presently holds at 125.1, falling from 134.2. Headline U.S. durable goods orders rose +0.2% m/m in August, topping the consensus view at -1.1%, according to the U.S. Census Bureau on Friday. U.S. personal consumption expenditures, according to the Bureau of Economic Analysis, fell 0.1% m/m, unable to meet consensus at 0.3%.

Economic Events to Watch Today

Let’s took at these fundamentals


EUR/USD – Daily Analysis

Europe’s shared currency ended the week down 0.70% vs. the U.S. dollar. The week booted off undergoing heavy losses, beaten by dark flash PMI numbers and later pulled by resurgent dollar demand. 

Technically, weekly price trades very south of support at 1.0873, while daily run meets with the buying pressure at 1.0851-1.0950. The 4 hourly flow re-entered a descending channel creation (1.1109/1.0993) and is poised to make way for the essential figure 1.10 this week possibly.

Concerning macroeconomic figures, headline U.S. durable goods orders grew +0.2% m/m in August, beating the forecast of -1.1%, according to the U.S. Census Bureau on Friday. U.S. personal consumption expenditures, as per the U.s.s Bureau of Economic Analysis, fell 0.1% m/m, unable to meet consensus at 0.3%.

Technically, the H4 candles left 1.09 unchallenged Friday, sporting several lower candlestick shadows before rotating back within the descending channel formation (1.1109/1.0993). Aided on the back of daily demand highlighted above at 1.0851-1.0950, the pair certainly has scope to shake hands with September’s opening level at 1.0989, closely followed by the key figure 1.10 and channel resistance, this week.


Daily Support and Resistance 

S3 1.0814

S2 1.0872

S1 1.0895

Pivot Point 1.0931

R1 1.0954

R2 1.099

R3 1.1049


EUR/USD – Trading Tips

Consider staying bearish below 1.0936 and bullish above the same to capture quick take profits of 50 pips on either side. The market may trade sideways over neutral German CPI. However, the sharp variation in number can bring changes in the market. 


USD/JPY – Daily Analysis

Last week, the USD/JPY was closed at 107.929 after placing a high of 108.178. Overall the movement of this pair showed a Bullish trend Last week.

Geopolitical issues were also cooled down a bit due to Saudi ‘Arabia’s decision about a ceasefire in Yemen. Moreover, the impeachment inquiry of Trump was also a headline last week for political anxiety in Washington but had a lesser effect on the U.S. Dollar Index. U.S. Yields rose after a decrease in Global Political & Economic tensions and gave strength to U.S. Dollar against Japanese Yen last week.

On Friday, few reports showed that U.S. President Donald ‘ Trump’s administration was considering the option to delist Chinese companies from US Stock Exchange, and it was also planning to limit the U.S. investors’investors’ portfolio flows in Chinese companies. These reports cause a slowdown in the upward trend of USD/JPY.

On the other hand, the speech of BOJ governor, Kuroda last week, expressed the concerns of Bank of Japan over the escalating risks to the economy. 


Daily Support and Resistance 

R3: 108.98

R2: 108.45

R1: 108.19

Pivot Point 107.92

S1: 107.66

S2: 107.4

S3: 106.87

USD/JPY – Trading Tips

The USD/JPY violated the bullish channel on the hourly chart, which was extending its support around 107.950 area. On the 4 hour timeframe, the 20 and 50 moving averages are reflecting the bearish trend in the USD/JPY. The Japanese yen may find support at 107.750 against the U.S. dollar along with resistance at 107.885. Consider staying bearish below 107.900 today as the pair is likely to stay bearish in the short term. 


AUD/USD – Daily Analysis

The Australian dollar wrapped up the week unmoved against the buck last week, unable to overthrow channel support taken from the low 0.7003. To the upside, resistance resides close by at 0.6828, with a break of the channel mentioned above possibly exposing 0.6677, the YTD low. As is painfully evident on the weekly chart, the long-term downtrend remains in full swing and has done since early 2018. 

Support at 0.6733 endures a significant fixture on the daily timeframe, as does resistance outlined at 0.6833. Likewise, the interest is the 200/50-day SMAs both fronting south. A breach of the said support can help target the market around 0.6687, followed by support at 0.6301 

Daily Support and Resistance

S3 0.6688

S2 0.6723

S1 0.6736

Pivot Point 0.6759

R1 0.6772

R2 0.6794

R3 0.6829

AUD/USD – Trading Tips

The Australian central bank is expected to deliver a 0.25% rate cut on October 01. However, the United States Durable goods Orders, Michigan Consumer Sentiment, and Personal Consumption data might consider short-term investors during the following part of the day.

The AUD/USD is trading at 0.6750 area, maintaining a short trading range of 0.6800 – 0.6750 range on Monday. The 50 periods exponential moving average is neutral but mostly suggesting a bearish bias on the 4-hour timeframe. 

Whereas, the MACD is consolidating in a green and red zone, indicating a neutral bias among traders. Hence, let’s keep an eye on 0.6759 to stay bullish and bearish below this level. 

All the best for trading. 


Categories
Forex Market Analysis

The Trade War could benefit South American Producers

DAILY UPDATE

Released: 5th April 2018.

Hot Topics:

  • The trade war could benefit South American producers.
  • The unemployment rate of European Union falls to 8.5%.
  • Climatic factor impacts on March PMI Construction.
  • The Bounce of the Stock Markets Boosts the Yen’s Crosses.
  • Indices rebound driven by possible bilateral talks between the United States and China.
  • The Canadian Dollar is showing an example of the alternation rule of the Elliott Wave theory.
  • Crude Oil Production falls to its lowest level in over a year.

The Trade War Could Benefit South American Producers.

Uncertainty due to the trade war between the United States and China continues. This time China has reacted by incorporating a 25% tariff on soybeans of US origin. It should be noted that China is the primary consumer of soybeans in the world. As a result of this increase in tariffs on American soy, it is estimated that China could turn to South American producers to meet the demand for the grain. Despite this pessimism in the economic context, the Dollar Index in the hourly chart is developing an inverted Head and Shoulder pattern as a bullish continuity configuration. The next control zone is in the range of 90.20 and 90.36, in case if we do not overcome the resistance of 90.36, we could see a potential retracement to the 89.15 area.

The Unemployment Rate of European Union Falls to 8.5%

The signs of recovery in the European economy continue. The unemployment rate of the European Union has fallen to 8.5% in February, down from 8.6% in January. According to the information provided by Eurostat, the labour market in the Eurozone has reached the lowest level since December 2008. This level of optimism has not been enough to push the Euro towards new highs. The single currency is within a range between 1.225 and 1.23, from where it could create a bottom around the levels 1.2213 and 1.224. A new bullish rally could start from here.

Climatic Factor Impacts on March PMI Construction.

The PMI of the Construction sector (MoM) plummeted sharply to 47 pts, compared to the 50.9 forecast, despite the weak data. It is the lowest level since July 2016, when it reached 45.9 pts in the context of the Brexit elections (June 23, 2016). The critical factor in the decrease in activity has been the climatic factor, remember that in March the worst snowfalls in recent years were recorded. Technically the pound is developing a pattern of Head-Shoulder, which could be contained in a more extensive setup of Head-Shoulders. This could lead to sterling up to 1.3922 in the first instance, and up to 1.3737 in the second instance. All this structure could correspond to a major degree lateral structure that takes us from the 1.373 area to reach new highs around 1.45.

The Bounce of the Stock Markets Boosts the Yen’s Crosses.

Yesterday, although tensions in the dispute of tariffs between the United States and China, the Bank of Japan (BoJ) disbursed 833 billion yen (about US $ 7.8 billion) in the purchase of Exchange-Traded Funds (ETFs). This level of expenditure is the highest level since September 2017, the month in which the BoJ spent 830 billion yen. This action earned the yen to start a turn in its trend; this can be seen both in the chart of the USD-JPY and EUR-JPY which have begun to show bullish patterns. For the USD-JPY pair, the closest key resistance level is 108; in the case of the EUR-JPY cross, the control level is 131.71, a level that if exceeded could lead to the price to exceed 133.5 with a maximum extension of 134.5 in the short term.

Indices Rebound Driven by Possible Bilateral Talks Between The United States and China.

Through his Twitter account, President Trump stressed that the United States is not in a trade war with China. The Trump administration indicated that it is willing to negotiate with China on the escalation of tensions between the two countries. The most significant problem as mentioned by the American President in his account on the social network is that the deficit in the American trade balance is $500 billion, which according to his words “When you’re already $500bn DOWN, you cannot lose.” With the fears of a commercial war between the Trump administration and the administration of Jinping, the indices began to recover confidence. They realised a V-turn pattern is taking the Dow Jones to close above the 24,000 pts in a day. It started lower in the global indexes. The level of resistance to control is between 24,800 pts and 24,982 pts, an area from where in case of breaking up, could take us to levels close to 26,000 pts. The key support levels are 24,034 and 23,330 pts, which coincide with the base of a bearish channel.

The Canadian Dollar is Showing an Example of the Alternation Rule of the Elliott Wave Theory.

The Loonie has made a false rut beginning a downward cycle. It is developing a long-term bullish channel as a long-term bearish formation and is reaching a zone of 1.31 and coinciding with the upper guideline of the channel. Once started, this bearish cycle has been developing five clear movements. In this case, we will highlight the corrective formations or consolidation. According to the Elliott Wave theory, the alternating rule states that after a simple corrective structure, a complex structure should be presented and vice versa. By looking at the time chart of the USD-CAD, we can see this application. The conclusion that this case leads us to is to suspect that a recession is approaching, and that could take the price to levels around the area of the complex corrective structure and then return to develop new minimums in the long term.

Crude Oil Production Falls to Its Lowest Level in Over a Year.

The production of crude oil from the countries belonging to OPEC has fallen to the lowest level in a year and a half. This is mainly due to the problems plagued by the policy of Venezuela, where production decreased by 100,000 barrels per day since February, reaching 1.51 million barrels per day according to the survey conducted by Bloomberg News. The overall level of the output of the 14 OPEC member countries fell by 170,000 barrels to 32.04 million barrels per day in March. OPEC has helped stop production as of January 2017 with the aim of boosting the price of oil, which has been currently consolidating above $60 a barrel. Structurally in the hourly chart, we observed a Head-Shoulder formation that did not reach the technical target bouncing upwards. As long as oil does not lose levels below $60.2, the dominant trend continues to be bullish.

©Forex.Academy

Categories
Forex Educational Library

FOMC Statement- March 2018

The information received by the Federal Open Market Committee (FOMC), since its meeting in January, has shown signs of further strengthening of the labour market and economic activity has been growing at moderate but solid rates. Job gains have grown strong in recent months, and the unemployment rate has remained at low levels. Recent data shows that the growth rate of household spending and business fixed investment has grown in 2018 at moderate rates after a large growth at the end of 2017.

On a twelve-month basis, overall inflation and inflation for items other than food and energy has remained below 2%. The economic outlook has improved in recent months due to the good results evidenced throughout 2017, and since the tax reform approved at the end of the same year.

The committee expected that with gradual adjustments in the monetary policy stance, the economy would continue to behave positively in the medium term and labour market conditions would remain robust. Regarding inflation and its annual base, the committee expected that in the short term this indicator would be close to 2% and that the bank’s goal would be met.

Due to the behaviour of the labour market, the main sectors of the economy and inflation, the committee decided to raise the target range of federal funds from 1.5% to 1.75%. The committee was explicit in that the monetary policy stance would remain accommodative as long as it was necessary for inflation to return to 2%.

This decision was in line with market expectations, so there was no strong reaction from the market. In the projections of the path of the interest rate, there is still no unanimity on what the next steps of the Federal Reserve will be as some expect a stronger policy, so they expect four increases during 2018. For other analysts, the path will continue the road stipulated so they expect only three increases during the current year.

The following graph shows the main projections of the committee. This graph shows economic growth above the natural long-term rate and the rates expected since the December meeting has improved. The unemployment rate also shows a very positive behaviour and is below the long-term rate. Regarding the different inflation measures, inflation is expected below the bank’s target for 2018, but very close to the target level, and for the next two years, an optimal inflation rate is expected according to the bank’s mandate.

Graph 82.Economic projections of Federal Reserve Board members and Federal Reserve Bank presidents, March 2018. Retrieved 23rd March 2018 from https://www.federalreserve.gov/monetarypolicy/files/monetary20180321a1.pdf

In the press conference, the president of the Federal Reserve Jerome Powell expressed that the decision to raise the target range of the interest rate marks another step in the normalisation of monetary policy, a process that has been underway for several years. But in his statements, some caution was evident and showing that the path of the interest rate considered only two more hikes in 2018.

Job gains averaged 240,000 per month in the last three months, which is a very positive rate and makes it possible for new workers to be absorbed. The unemployment rate remained at low rates in February, standing at 4.1%, while the rate of labour market participation increased.

According to Powell, that is a positive signal given that the economically active population is getting older, so this leads to the participation rate to the downside, but with the new entries this negative effect is offset by the entry of new workers.

Also, the president of the Federal Reserve has concluded that there are certain specific factors that have contributed to the greater economic growth observed in recent months and these are:

  • Tax reform
  • Ongoing Jobs Gains
  • Foreign growth is strong
  • Overall financial conditions remain accommodative

Regarding inflation, Powell was clear that inflation was still below 2% regardless of what measure was used. According to the president of the Federal Reserve, this was due to unusual price reductions that occurred in late 2016 and early 2017. But for Powell, as the months passed in 2018, these unusual events would disappear, and inflation would be very close to 2 %.

In his statements, the president of the Federal Reserve specified that, if the rates rose too slowly, this would increase the risk that monetary policy would have to adjust abruptly in the future if a shock should occur in the economy. At the same time, the committee wanted to prevent inflation from remaining below the target which could reduce the chances of acting quickly in the face of a recession in the US economy.

Finally, Powell pointed out that the reduction in the balance sheet that began in October was progressing smoothly. Only specific conditions of the economy could curb the normalisation of the balance sheet of the Federal Reserve. President Powell was emphatic that they would use the balance sheet in addition to the interest rate to intervene in the economy if a deep economic recession were to occur.

In conclusion, the federal committee decided to raise the federal funds rate as expected by the market due to the good performance of the economy which continued to grow at high rates and above the long-term level. Although inflation was not at the desired level, according to the committee, this was due to transitory effects that would fade over the months, and thus inflation would be in the target range.

As already mentioned, the economy showed good signs due to the labour market, so the bank decided to raise rates, but the committee remained cautious about the future of the economy because it was not ruled out that a recession would occur. According to the statements made at the press conference, some indecision was evident on the part of the committee as they evaluated the two possible scenarios against the interest rate.

If they raised it too quickly they could slow down the economy and thereby affect the labour market, which would lead to a drop in inflation, which would lead to a complex economic scenario as future increases would not be possible, and this would restrict the use of the monetary policy. On the contrary, If the committee raised it too slowly, a scenario could be generated where any economic shock, whether internal or external, could also affect the economic growth of the United States and limit future increases in the interest rate.

The market is still undecided if the FED will make two or three more rate hikes during the current year. Some analysts question why the Federal Reserve continues to raise rates if the inflation rate still shows no stability. For them, the central bank should be more cautious in its monetary policy because they could be in the second scenario where the economy still needs an accommodative policy so that the medium term could be limited future increases in the rate as well as the normalisation of the balance sheet.

Categories
Forex Educational Library

Federal Reserve Press Releases – June to December 2017

Released: 15th January 2018

By: Sebastian Alarcon

Federal Reserve Press Releases are issued after the meetings that take place between the different entities, and in these press releases, the decisions taken by the reserve are detailed, such as the results of the voting, which of the presidents of the banks voted, and what are the expectations for the following meetings.

At the June meeting, it was observed by the Federal Open Market Committee (FOMC) that the labour market continued to strengthen and economic activity continued to improve moderately. Salaries and new jobs grew moderately, but solidly since the beginning of 2017, which led to a decline in the unemployment rate. In the months prior to June, there was an increase in household spending as well as fixed investment in businesses. In the annual inflation from May 2016 to May 2017 there was a deceleration in prices and the price indicator (excluding food and energy) remained below the 2% reserve target.

At the June meeting, inflation expectations remained below 2% in the short term, but it was estimated that in the medium term, the objective would be met. In view of the expectations of the labour market and the behaviour of inflation, the committee decided to increase the target range of the federal fund’s rate from 1 to 1.25%. The monetary policy stance remained accommodative to continue supporting the good behaviour of the labour market and inflation.

The committee at the May meeting continued with the expectation of implementing normalisation in the bank’s balance sheet during the year. This program would gradually reduce the holdings of Federal Reserve securities by decreasing the reinvestment of the capital payments of those securities. The board of governors of the federal reserve voted unanimously to increase the interest rate to 1.25% on June 15, 2017.

In the July meeting, the results of the reports presented to the FOMC in June were shown, it was evident that the labour market continued to strengthen as well as economic activity. As in the June press release, the unemployment rate continued to fall, household spending and fixed investment in businesses continued with a positive trend.

The negative aspect of the report was the behaviour of inflation which decelerated in the 12-month period. The expectations of the agents on inflation change in this report to the downside. In the short term and even in the medium term it is not so clear to the objective of 2%. Given this behaviour of inflation, the committee decided to leave the interest rate of federal funds at 1.25%.

In the expectations of the committee, no problem was expected in the development of economic activity so that monetary policy was not going to have many changes in their projections. In the short term they expected to have stable interest rates and below the long-term objective to continue with the positive trend of the labour market and economic growth.

As for the balance sheet of the bank, the reserve had not yet begun its normalisation program but expected to start soon, depending on whether the economy followed that positive path. The board of governors voted unanimously to maintain the interest rate at 1.25%.

At the September meeting, it was concluded that throughout the year the labour market and economic activity had strengthened moderately. The unemployment rate, although it did not continue decreasing, remained stable and with a good performance. The fixed investment in business accelerated showing good signals which contrasted with household spending, which remained stable. Inflation grew slightly, but so far this year it has slowed down remaining below 2%.

The many hurricanes that happened by this date devastated multiple communities and generated millionaire expenses which affected the economy in the short term, but according to the federal reserve, there is historical evidence that is almost null on the effect of these events in the long-term path of the economy. For this reason, the committee was still expecting a rebound in economic activity in 2017 and monetary policy would not have major problems given the projections drawn at the beginning of the year. Gasoline (petrol) and other items could accelerate inflation after these events, so in the medium-term inflation was expected to close at about the 2% reserve target. The committee continued to monitor the economy but noted that the potential risks of the economy had not materialised, so they were very optimistic by the end of the year.

In view of the events and behaviour of inflation, the committee decided to keep interest rates at 1.25%. It was established that in October 2017 the committee would begin the normalisation of the balance sheet of the reserve.

At the November meeting, the committee continued observing the positive behaviour of economic activity and the labour market throughout the year, despite a series of hurricanes affecting various communities in the middle of the year. The number of new employees fell due to these events affecting the unemployment rate in September but decreased in the following months.

Household consumption and fixed investment in businesses continued with the positive trend that they have maintained throughout the year. Gasoline prices increased in the wake of hurricanes, thus increasing inflation in the United States, but with stable prices for goods other than fuel, food and energy. In the following months, the consequences of hurricanes will continue to be felt in economic activity according to the federal reserve. The committee concluded based on the figures presented by the economy that the best thing for the moment was to leave the interest rate unchanged at 1.25% voting unanimously.

Finally, in the December report, the federal reserve observed a strong labour market and a strong acceleration in economic activity. On average, despite natural disasters, wages and new jobs had a positive trend and the unemployment rate remained at low levels even below the long-term rate. In November it was observed that total inflation without food or energy stays below 2%, which is a sign of deceleration compared to the previous year.

Unlike the previous meetings, the committee observed the situation of the economy and the labour market and decided to increase the interest rate of the federal funds to 1.5% on December 13. The vote was unanimous to raise rates on the board of governors, and the districts that voted at this meeting were Boston, New York, Philadelphia, Cleveland, Richmond, Atlanta, Kansas City, Dallas, and San Francisco.

In conclusion, in the press reports delivered to the public the federal reserve shows a summary of economic activity, the labour market and the behaviour of inflation which are the most important variables when establishing monetary policy. During 2017, a robust economy was observed despite some natural disasters and a healthy labour market with good dynamics. The negative point during the year was the behaviour of inflation which slowed down compared to the previous year, but this was not enough for the federal reserve to raise the economy’s intervention rate. In total there were three increases during 2017 showing positive expectations from analysts and the board of governors on the future of the US economy. In addition, since October, the normalisation program has started in the balance sheet of the federal reserve, which means that the reserve will get rid of several assets that it has on its balance sheet, which will take liquidity out of the market, after applying this accommodative policy to recover the economy from the crisis of 2007.

©Forex.Academy

Categories
Forex Educational Library

International Trade: Types of agreements and movements against it.

Abstract

Globalisation is a process that has been observed since the early 1980s and this has seen an improvement in the general welfare of people, but in some countries, it has seen an increase in inequality. Globalisation brought with it greater trade, the mobility of people and capital, although there are different types of trade agreements which imply different policies depending on their type. After several decades of international trade and its consequences, protectionist movements have grown in some areas of the world that have focused on the negative impact that trade has made on countries.

With globalisation as a worldwide event, a series of exchanges appeared not only in the economic field but also in the social and cultural realms, as discussed in the article Globalization. In the economic sphere, one way to trade similar to other countries are agreements to reduce taxes on imports or even eliminate these tariffs so that free competition is what determines which products consumers will prefer. The following graph shows how the world and its economies have globalised.

Graph 38. (18th December 2014). 38 maps that explain the global economy. Retrieved December 10, 2017, from https://www.vox.com/2014/8/26/6063749/38-maps-that-explain-the-global-economy

The first free trade agreement signed between the United Kingdom and France on 23 January 1860, was named the Cobden-Chevalier treaty, after the British and French chief promoters of the treaty. Free trade agreements consist of regional or bilateral trade agreements to expand the market of goods and services among participating countries. As stated in the previous paragraph, the agreements include the elimination or substantial reduction of tariffs for imports between participants so that they compete under market conditions without any other friction. These agreements are directed by the World Trade Organization or by a treaty between countries.

Free trade treaties do not necessarily lead to economic, social or political integration between the participants. But there are some deals such as the European Union or Mercosur (a South American trade bloc) which were created to promote trade. They include clauses on fiscal policy, the free mobility of people, and common political bodies. These latest clauses that go beyond a simple commercial agreement are not considered under free trade agreements, where only economic aspects prevail.

The main elements of a free trade agreement are:

  • Elimination of the barriers that affected trade between the areas that sign the treaty
  • Promotion of better conditions for fair competition
  • Improving investment opportunities for local and foreign people
  • Improving property rights on patents and innovations
  • Cooperation between countries that in some cases goes more to that of the economic part
  • Establish effective processes to stimulate national production and more loyal competition between countries.

Free trade agreements started to be signed between countries to put an end to economic protectionism because policies that try to protect local production reduce the well-being of people since they will have less quantity of goods to choose from, as well as having higher prices. The reason being that when local production does not face more efficient competition, they can establish higher prices.

Formally, free trade agreements propose an expansion of markets through the elimination of customs duties and any other policy that affects exports and imports in a market. It also seeks to eliminate the subsidies that some sectors have since in some cases there are productions that are competitive, but only because of state subsidies, which affects free competition due to that interference of the state in the market.

Agreements that go beyond the economic aspect focus on border controls of immigrants, the way in which there is parity between exchange rates and the establishment of a third party that mediates when there are commercial conflicts. Sometimes, the agreements are signed by more than two countries of the same region to try to compete together with other regions of the world and thus also protect their borders.

Classification of Commercial Treaties:

  • International cooperation: Several countries establish an agreement through which they pursue certain common objectives in terms of solidarity aid between themselves and without changing the legal aspects of their countries.
  • Partial scope agreement: Treaty whereby countries participating in the treaty decide to develop a clear reduction of trade restrictions to favour trade between the signing countries.
  • Free trade agreement: This treaty eliminates commercial barriers within the zone that delimit participating countries seeking better yields and efficiencies of their economy.
  • Customs Union: It has the characteristics of a free trade agreement added to the inclusion of tariffs for countries that are not part of the agreement to encourage the consumption of products from countries of the alliance.
  • Common market: It is one step ahead of the customs union that includes the free flow of people and capital.
  • Economic Union: It is the most comprehensive agreement in the category of commercial agreements at an international level since it means total harmonisation between the systems of the participating countries. The states modify their legal system and economic policies so that there is a unification of the member countries. A clear example of this type of agreement is the European Union.

The models and economic flows of recent years have exposed the benefits of international trade showing how these type of agreements improve general welfare due to the presence of a greater variety of products, more accessible prices and better conditions for the movement of people. But as it is usual, this type of economic change uncovers agents or people who feel that they lose with the implementation of these policies.

For example, local producers often feel that they are not as competitive to foreign producers, so they can go bankrupt or reduce their profit margins. Also, many times companies take advantage of this free circulation of capital to establish their businesses in countries where costs, such as taxation or labour, are lower.

It is because of this feeling in the face of trade that there are winners and losers that in recent years have emerged protectionist movements and even processes to get out of economic unions. The current president of the United States, Donald Trump, has made statements on the implementation of protectionist policies to encourage production in the United States and thus economic growth in the short term.

Another example of protectionist measures is the exit of the United Kingdom from the European Union, which is not only a political process, but will have economic consequences as well. The departure of the United Kingdom from the European Union has its origins in 1975 where political groups wanted to end this Union. In 2016, a referendum was held to determine the exit of the United Kingdom from the European Union, but it was not a uniform result since Scotland, Northern Ireland and Gibraltar voted for permanence. The important demographic weight of England and the large participation in this country were decisive for the result to be given. Noteworthy also, was the fact that the decisive factor that favoured the Brexit success was the vote of the elders. The polls show that only 19% of people between 19 and 24 years supported Brexit, while the vote among pensioners was 59% favourable to the EU departure.

The economic consequences that resulted from the referendum result were the immediate release of British bond yields to the minimum, the devaluation of the currency to levels not seen since 1985, as well as social problems such as racist attacks by the English population.

Although the referendum was not binding on the British government, it was clear that it would have been difficult for the parliament not to follow what the population demanded, so parliament began the process to remove the European Union’s agreements on the part of England.

People in favour of holding the referendum argued that the European Union had changed a lot in recent decades and had more control over the daily life of the British, there was no confidence in the Brussels bureaucracy, they wanted more control of immigration and greater security. In addition, they maintained that belonging to the European Union was an obstacle to economic development where the United Kingdom gave more than what it received from the economic union, added to the excessive European regulations that conditioned the way British companies could compete.

Since the accession of the United Kingdom to the European Economic Community in 1973, there were movements to limit interference on internal policies. For example, in 1985 the Schengen area, consisting of 26 countries, was created to abolish its internal borders, but the United Kingdom remained on the sidelines. It was also integrated in 1993 into the single market that promoted the free movement of goods and people as if the member states were one country, but did not adopt the Euro and continued to have its own currency.

The lands that were in favour of the permanence of the United Kingdom argued that the benefits of belonging to the European Union were the simple sale of goods and services to other countries. And that the free mobility of people allowed incoming flow of new capital which allowed better economic growth and it energised all aspects of the life of the British.

The single market is the great pillar of the European Union, and the central point of this is the free market without commercial tariffs. But not only is it an open market alliance, it also implies the free movement of goods, people, and capital. Therefore, the departure of the United Kingdom implies social, economic and even political consequences to countries within the European Union.

Although the conditions of Brexit have not been negotiated, some speculate that an economic crisis could be unleashed, a decrease in foreign investment and even local investment would be affected. A short-term recession could follow, and it could be profound, but that will not be grasped until after the negotiations conclude and an agreement is reached about the future relationship of the United Kingdom with the European Union. In the following graph, you can see the possible consequences that Brexit would have depending on how the negotiations end.

Graph 39. (2nd February 2016). Here’s how horrific the economic fallout from a Brexit would be. Retrieved 10th December 2017, from http://www.businessinsider.com/hsbc-research-eu-referendum-brexit-consequences-2016-2

But the consequences will not only concern the United Kingdom, but the European Union will also be affected because its attractiveness as a trading partner will no longer have the same image and may weaken its commercial power. Besides, some countries within the trade agreement could follow in the footsteps of Brexit which could threaten the European Union, its policies, and its common currency.

In conclusion, there are currently several menaces on protectionism and anti-global policies in the world that threaten economies and financial markets. There is a general frustration with the political elites which has led to voting for people and unexpected events such as Brexit and the election of Donald Trump in the United States which has led the political nonconformity to the economic sphere.

Even though a few decades ago all the theories and economic advances were centred on globalisation and greater commercialisation in the world, protectionist currents are now gaining strength.  Mainly they are due to slow growth in many economies, a social advance that in some cases has stalled and a political change due to the general discomfort of people concerning the elites. When a country begins seeking to protect itself economically and socially, it will trigger a reaction in other countries that recognise the same threats with globalisation and the free mobility of people, which generates a chain effect.  That is what we are currently witnessing.

 ©Forex.Academy
Categories
Forex Educational Library

Money and Monetary Policy

Introduction

Coming from the Latin word that defined the Roman coin denarius. Money is, in general terms, the preferred means for the exchange (charge vs. payment) of goods and services, likewise cancellation and/or acquisition of rights or obligations.

It can be associated with other functionalities or uses:

MONEY AS A MEDIUM OF EXCHANGE.

Money facilitates any exchange of goods and services among economic agents and reduces transaction costs. Any economic system with a high degree of specialization and division of labor uses money as a medium of exchange or payment of goods produced and services provided by different individuals or persons.

An economic system that excludes money as a medium of exchange of these transactions, involves the application of mediation type barter, time banks

The following properties are required to achieve the present functionality:

  • Homogeneity: The units must be identical or close.
  • Divisibility in units small enough to be able to exchange any good.


MONEY AS A STORE OF VALUE.

To be able to recognize it as such, money must satisfy the characteristics of durability, allowing people to keep or accumulate wealth through savings.

Money brings the advantage of its liquidity, understanding this in its broadest possible terms, i.e., the temporary capacity that offers any good to be converted to money, without losing its value in commercial terms over time.

Time can affect the value of money in terms of purchasing power and its relation with market prices in its three temporalities: past, present, and future.


MONEY AS A UNIT OF ACCOUNT.

Environment-related to the setting of market prices of goods and services, as well as the control of accounts (accounting).

The monetary unit defines how to measure the expression of the value or market price. Each economic zone shall define its official monetary unit ; $; £

MONEY CLASSIFICATION:

There are several kinds of money varying in liability and strength. When there was ample availability of metals, metal money came into existence later it was substituted by the paper money. According to the needs and availability of means, the kinds of money has changed.

COMMODITY MONEY

Commodity money is generally accepted as means of payment or exchange and is purchased or sold as an ordinary asset. Gold and silver have been the most common precious metals used as money. The value of this kind of money comes from the value of the resource used. It is only limited by the scarcity of the resource.

Some features: Durability; divisibility; transportable; homogeneity; limited offer…

Ex: gold coins, bread, metal, stones, tea, camels…


FIAT MONEY

A term used to denote a specific form of currency, not bound to any metal supporting it. A significant amount of the paper currency available all over the world is fiat money.  Fiat money is backed by national governments as the recognized official medium of payment. Fiat money does not hold any inherent worth of its own, and they do not have the support from any form of reserve, as well. It is operating solely on faith, like the sterling used in Scotland. Nowadays, Fiat money is the basis of all the modern monetary systems. The real value of fiat money is determined by the market forces using demand and supply.

The fiat currency is also sanctioned by the Government for payments of taxes or other legal, financial obligations.


FIDUCIARY MONEY

Is conventionally maintained on a trust. The fiduciary normally retains the assets for a certain beneficiary, who could even be an executor of a will. Payments of fiduciary money could also be made in commodity money like gold or fiat money. Bank Notes and Checking Accounts are examples of the conventional forms of fiduciary money which, in this case, are provided by Banks.

Fiduciary money can be obtained from banks in the form of credible promises. These promises are eligible to be transferred and do perform the functions of conventional money.

The present-day world attaches higher importance to the token money whose variations are fiduciary money and fiat money, which differ significantly from commodity money.

Ex: Bank Notes, checking accounts…


COMMERCIAL BANK MONEY:

It´s possible to describe a commercial bank like an entity that essentially deals with loans and deposits from major business organizations and corporations. Are the most important components of the whole banking system.

The Central Banks and its functions

A Central Bank is a public entity, autonomous and independent of the Government, responsible for the monetary policy of a country.

There´re seven examples of important Central Banks around the world:

Among its functions we can highlight:

  • Establishing the purposes and instruments of monetary policy and implementing.
  • Setting the official interest rate.
  • Centralizing and controlling economic operations abroad, especially making the purchase and sale of foreign currencies that are necessary Managing the country´s Foreign Exchange and gold reserves.
  • Supervising the financial system to ensure its proper functioning and that there are no problems that may affect the economy as a whole.
  • Authorizing the issuance of bills and coins in exclusivity à Controlling the nation’s entire money supply.
  • Acting as a bank of commercial Banks and Government bank.

Since it is responsible for Price stability, Central Banks must regulate the level of inflation controlling the money supply, through the use of monetary policy. A Central Bank performs open market transactions that either inject liquidity into the market or absorb extra funds, directly affecting the level of inflation.

Money Creation

The majority of money in the modern economy is created by commercial banks when making loans.

Money creation in practice differs from some popular misconceptions — banks do not act solely as intermediaries, lending out deposits that savers place with them, and they do not ‘multiply up’ central bank money to create new loans and deposits, either.

The amount of money created in the economy ultimately depends on the monetary policy of the central bank. In normal times, this is carried out by setting interest rates. The central bank can also affect the amount of money directly through purchasing assets or ‘Quantitative Easing.’

Quantitative Easing (QE) is an unconventional form of monetary policy where a Central Bank creates new money electronically to buy financial assets, like government bonds. This process aims to directly increase private sector spending in the economy and return inflation to target.

The aim of quantitative easing is to encourage spending, keeping inflation on track to meet the Government’s inflation target.

QE works, i.e., when we buy gilts, it pushes up their price and so reduces the yield (the return) that investors make when they buy gilts. This encourages investors to buy other assets with higher yields instead, such as corporate bonds and shares. As more of these assets are bought, their prices rise, pushing down borrowing costs for businesses, encouraging them to spend and invest more. We also buy a smaller amount of corporate bonds, which makes it easier for companies to raise money which they can then invest in their business.

Money creation processes by the aggregate banking sector making additional loans


Limits to broad money creation

  • Banks themselves face limits on how much they can lend. 3 Constraints:
  1. Market forces constrain lending because individual banks have to be able to lend profitably in a competitive market.
  2. Lending is also constrained because banks have to take steps to mitigate the risks associated with making additional loans.
  3. Regulatory policy acts as a constraint on banks’ activities to mitigate a build-up of risks that could pose a threat to the stability of the financial system.
  • Money creation is also constrained by the behavior of the money holders: households and businesses. Households and companies who receive the newly created money might respond by undertaking transactions that immediately destroy it, for example by repaying outstanding loans.
  • The ultimate constraint on money creation is monetary policy. By influencing the level of interest rates in the economy, the monetary policy affects how much households and companies want to borrow.

That occurs both directly, through influencing the loan rates charged by banks, but also indirectly through the overall effect of monetary policy on economic activity in the economy. As a result, the Central Bank is able to ensure that money growth is consistent with its objective of low and stable inflation.

 Money Offer

The total amount of existing money, also called money supply, in an economy consists of cash in the hands of the public and the deposits held in the banks.

That amount of money grows or decreases as a result of bank credit and preference for the public’s liquidity, which together determine the value of the monetary multiplier.

The money supply, M, is, therefore, the result of the expansion of the base money, M0, due to the effect of the monetary multiplier m:

In the money multiplier process, the key is in a very important proportion: the ratio between the reserves of the banks (they correspond to their deposits in the central bank) and the deposits of the public in the banks plus other liabilities.

Banks want to keep that ratio at a certain level, partly to have liquidity with which to deal with withdrawals of funds from their customers and operations with other banks, but, above all, because their central bank, usually, requires them to maintain this relationship above a minimum level.

Depending on the central bank they have different names:

  • ECB → Mandatory minimum reserves
  • FED → Required or mandatory reserves

Therefore, banks keep a slightly higher proportion than the mandatory minimum, so as not to run the risk of breaking that coefficient. Although,  they are not interested in keeping a liquidity level too high because it would mean a loss of return that’s obtainable if they’re able to spend that excess liquidity to buy profitable assets.

Then, when the volume of reserves of banks increases above the mandatory minimum ratio, bank entities may grant credit to the private sector and the public sector. The opposite occurs when their volume of reserves is decreased.


An example to clarify this issue:

Let’s assume that the proportion desired by the Central Bank in a certain country is 2%; that is, for every 100 monetary units in deposits, banks need to hold two units in liquid assets.

Imagine that yesterday all banks fulfilled that proportion, and, today, the volume of liquid assets on a certain bank has increased by 100 monetary units. Now, its coefficient is higher than the 2% desired, therefore, the bank will be interested in placing all or part of that surplus, awarding, for example, a credit to the private sector.

How will the maximum amount be known? If the numerator has increased by 100 monetary units and the quotient has to remain 2%, the denominator is allowed an expansion of up to 5,000 monetary units. The process of creating money and the process of creating credit have been launched, the final result of which is a high multiple of the initial operation.

We should understand that the amount of money in circulation varies at every moment, due to the thousands of simultaneous operations of creation, and destruction. It is interesting to realize that Central Banks control this creation process, and for this purpose, it needs a mechanism to increase or reduce the reserve account of the banks and a mechanism to regulate the creation of credit when the reserves grow, as previously commented. It is here when the so-called Monetary Policy is applied.

Each central bank has its own objectives. As is the case of the ECB, whose sole objective is price stability through a low and steady inflation rate of less than or equal to 2% per annum. On the contrary, the FED pursues two objectives: price stability without a quantified inflation level, and maximizing employment, together with the sustainability of long-term interest rates.

The implementation of the monetary policy requires the use of one or several instruments for the creation and destruction of reserves, thus, establishing the initiation of a process of creation or destruction of credit and money.

Although they manage a wide set of tools, they can be summarized into three:

  1. A mechanism for withdrawing and conferring credit from and to the banks. This is the case of the periodic liquidity auctions by the European Central Bank.
  2. Open market operations: buying or selling public debt to banks. When a central bank purchases government bonds from banks, it injects liquidity into the system, and the opposite happens when the central bank sells public doubt to the banks. This is one of the main tools currently used by the FED. Remember the explanation of QE.
  3. And last but not least is the required minimum reserve ratio, where its decrease releases liquidity in banks and increases the amount of money. The opposite holds when there is an increase in the coefficient. It is important to take into account the limited widespread use of this tool. That’s because it usually causes large distortions on the bank’s liquidity.


Interest rate

The interest rate is a variable that is present in almost all decisions of households, companies, financial entities and Governments. These decisions refer to actions or consequences that take place at different times of time and therefore, the interest rate represents the price of time. We could interpret it as the prize that is demanded to delay the enjoyment of something from today until tomorrow or the premium that you have to pay to advance that enjoyment from tomorrow to today.

Although there are many types of interest, let’s focus on interest rates of assets and liabilities and financial operations; so we would be dealing with the returns obtained when lending or placing wealth in a financial asset or the cost of Debt.

As already mentioned, central banks usually use two instruments to increase or decrease the circulation of liquid assets or reserves held by banks:

  • The granting of credit to banks →
  • Open market operations →

Central banks usually manage these instruments through a very short-term interest rate. Following the examples of the previous central banks, it is known that the ECB periodically announces an interest rate of the main financing operations that serves as a guide to the banks to the banks for the weekly credit auctions. The extent of that interest rate and its expected future changes will be a useful indicator of the expansive or contractive nature of monetary policy. An increase in that interest rate is indicative of a tightening of monetary policy, that is, a liquidity contraction and a higher cost of central bank credit, as well.

In the FED’s case, this decision sets the federal funds rate, indicating the interest rate at which it is willing to buy public debt to the banks to provide them with liquidity or,  to sell it, thus, withdrawing liquidity. Therefore, that rate and its expected or announced changes will also imply changes in the sign of monetary policy.

However, the central bank controls the short-term interest rate, but families, companies, and Governments are mainly affected by the longer-term rates. This means that monetary policy has a limited, but real, effectiveness on financing conditions.

Therefore, a better understanding of the role of monetary policy in setting interest rates establishes:

  1. In very short terms, interest rates are usually controlled by the rate that the Central Bank uses to implement its monetary policy. If, as an example, we say that the eurozone banks are receiving ECB weekly credits at 2%, a logical assumption will be that the next week’s interest rates will be close to 2%, except if excesses or significant liquidity deficiencies
  2. manifest the Monetary authorities can also influence the longer-term rates, announcing their purposes about future interest rates. That would be the case, for example, when they announce they will keep their interest rates very low for one year.
  3. Authorities may also influence long-term nominal rates if they announce a feasible and credible inflation target.

Central Banks, at best, can only control nominal rates, because the expected rate of inflation will depend on the expectations of economic agents.

In a simplified way, the likely evolution of the relationship between short and long-term types in a country is as follows:

If we take as starting base a situation of a balanced performance of the economic activity, with normal market returns and subsequently, the economic activity accelerates, along with inflation expectations, its likely outcome will be a rise of the long-term interest rates.

Under these conditions, it is likely that the central bank decides to practice a restrictive monetary policy, and therefore, a rise in the interest rates in a very short time.

This monetary policy will end up moderating production and prices. As the markets anticipate this result, the long-term rates will fall again and the central bank will be able to reduce the restrictive nature of its monetary policy by returning to equilibrium.


Inflation shows the upward or downward movements of thousands of prices, which implies the difficulty in identifying the continuous and sustained changes in the set.

However, the accuracy shown is relevant because a price variation may arise from many possible causes. In the same fashion, it happens on the movements and one-time changes in many prices,  and, also, on the seasonal changes. But beware: a continued and sustained rise in the overall level of prices will not happen without any visible cause.

Who is worried about inflation?

  • Governments
  • companies
  • workers
  • customers

Why?

  • A rise in domestic prices not compensated by the depreciation of the currency produces a loss of competitiveness with other nations.
  • Price raises may alter the distribution of income and wealth, damaging agents who have not been able to anticipate or protect against that. It is for this reason that countries suffering from high and variable inflation also experience episodes of malaise and social conflicts.
  • Inflation can extend over time, generating expectations that often auto-fulfill.
  • It is a non-democratic and regressive tax on money.
  • If inflation is large and variable, it may generate large inefficiencies.
  • Stopping inflation, once installed, is usually difficult and costly.

What is the cause of inflation?

If we take supply and demand as our base assumption, many possible causes can be identified, some on the demand side, such as the increase in consumer income and others on the supply side, such as an increase in the productive factors or the tax levied on the product.

Please note that a significant rise in prices will reduce the purchasing power of money,  which leads to a monetary concentration.  That will, in turn, raise interest rates and slow down the growth of production and prices. However, this will not happen if the growth of money supply is accelerated, which reduces the real interest rates, and, consequently, founds the increase in aggregate demand (consumption, investment, public expenditure, exports, and imports).

Faced with this reality, the following we may state the following:

  • If inflation is not accompanied by growth in money supply, a larger growth on some of the components of aggregate demand or costs (labor, raw materials) will generate a one-time price increase.
  • The creation of an adequate money supply is a necessary condition for any sustained growth of the general price level.

In addition, it can also be a sufficient condition for inflation since if economic agents receive more money than they need to finance their transactions, they will spend it, and in that process, they will generate an increase in the demand for goods and services and a rise in prices.

  • Not all changes in money supply cause a rise in prices: Companies whose sales grow will need a larger balance of money in their possession, money the company won’t expend so that it won’t produce price increases.
  • Therefore, the following approach arises:

Inflation is always a monetary event caused by the excessive growth of the amount of money concerning what is necessary to finance the real growth of the economy. That explains why Central Banks are committed to controlling inflation: because they control the amount of money.

To understand the relationship between Central Banks and inflation, it should be conceded that usually, the monetary authority of a country establishes the objective of its monetary policy in terms of the desired inflation rate (*). This rate of inflation that is usually low, stable and positive, will be the one that the monetary authority tries to achieve in a relatively long term and in this way avoid an erratic monetary policy. Sometimes they include a goal regarding the rate of growth of the gross domestic product, trying to match the potential growth rate of the economy (y*), compatible with a complete use of resources, so that below (left) it, costs tend to be reduced by the pressure of unemployment and above (right), costs tend to increase due to over-use of resources. Therefore, observing the following table, it is understood that point A is the one desired by the monetary authority, as previously mentioned.

If the economy is at point E, the Central Bank will practice an expansive monetary policy and keep interest rates low. When approaching B, it will probably raise the interest rate, with the objective of preventing the economy from moving to the right of y* (before arriving at A) given the slowness of the effects of monetary policy.

In C the monetary policy of the Central Bank will be clearly restrictive, in an attempt to return to A.

In D, the Central Bank will be faced with several alternatives: If it pursues the objective of inflation the action will raise interest rates with the consequent accentuation of the recession. Establishing here an observation beacon for monitoring the reaction of economic agentsI.e. The fear that trade unions might push for higher wages increases the likelihood of an interest rate increase. This explains the reason for the reaction of the Central Banks to the rise in costs such as oil or ad valorem taxes even if they produce one-time price increases  → The fear that that may turn into wage increases, even more so if they use automatic indexing on wages.

An inflation like C is attacked by the use of a restrictive monetary policy, and a reduction of the rate of growth in production is the first parameter to be affected, which will shift to F, and solely after a while, it will end up achieving the objective: A.

Inflation is maintained around the desired level * through an expansive monetary policy but at a very moderate level, and it must be accompanied by other measures such as:

  • The prohibition for the central bank to finance the public deficit, thus avoiding the excessive growth of the amount of money.
  • A monetary exchange rate policy compatible with the monetary restriction
  • Salary moderation as a countermeasure, to avoid more rigorous monetary restrictions and its negative effects such as unemployment and recession before inflation can be reduced.
  • Credibility and perseverance in government policy, because if Government’s announcements lack these attributes in the eyes of the economic agents, the moderation of inflation will be a lot more difficult.


Value: To be able to add the production of heterogeneous goods and services and express them in a common monetary unit: Pound Sterling, Dollar, Euro.

Final: To avoid the problem of the double accounting of goods that become part of the production of other goods and services, such as raw materials and intermediate products. GDP equals added value.

Of Production: Not of sales.

Of goods and services: But only the remunerated ones, so leisure, study, bricolage… and the legal ones are excluded.  Underground economy and the illegal activities are not included: drug trafficking …

In a country: Region or city. It will depend on what you want to cover.

During a given period: (one quarter, one year …). Transactions carried out with goods produced in the past are not included.

At market prices: (sale to the public) including net indirect taxes (VAT).

To understand GDP, it is necessary to know other concepts related to:

There are three procedures to calculate the GDP of a country:


Kind regards


©Forex.Academy 

Categories
Forex Educational Library

Transmission Channels of Economic Cycles

 Abstract

The economic cycles are one essential topic studied by the economy. There is a wide variety of literature that mentions the fluctuations and long-term trends of economies. But behind these cycles and trends, there are variables that explain why the economy behaves in that way and are also affected by the state of the economy. These variables are the level of employment in an economy and access to credit by companies and individuals. When an economy is slowed, the level of unemployment increases and access to credit is restricted due to higher provisions of the banks due to a higher risk of default. It is important to analyze how these variables are found to examine which economic cycle this country is.


Some variables may be magnified or affected by economic cycles, a topic analyzed in the article Cycles and Economic Oscillations. Two of the variables that will be analyzed are employment and the financial sector. If it is possible to understand how these variables behave in the business cycle of the economy, it will be possible to understand the mechanisms of propagation of shocks. In the case of the labor market when presenting certain rigidities, it does not react immediately to changes in the economic cycle; on the contrary, it takes time to balance. There are several explanations of why real wages can be rigid.

The first theory that tries to explain why wages are rigid is the existence of long-term contracts between workers and companies. Long-term contracts provide insurance and specific parameters that must be respected by both parties so that wages can be stable over time regardless of the labor market situation. Another theory highlights the role of unions which try to ensure the employment situation of their members and the actions taken for this can generate rigidities. The last theory that deals with the rigidities of the labor market are efficiency wages. The more a person’s salary is, the more incentives they will have to develop their work better.

But efficiency wages do not explain well why wages should be rigid since companies can in some cases verify the efficiency of their workers and, accordingly, set wages. In addition, there are currently performance bonds that serve to incentivize their workers. Workers make further efforts when economic cycles are in a depression or recession phase, since unemployment increases in these cycles, which makes it riskier to lose their jobs because it will be harder to find work. Therefore, salaries will be increased when there are better employment rates because there is more incentive for workers to perform well.

The frictions of the labor market, although they generate that there is an uncoupling between the economic cycle and the labor market, also reflect the situation in which the economy finds itself because the variables of the labor market present fluctuations like the economy. Also, these rigidities generate persistence in some variables such as wages and the unemployment rate which implies that when setting monetary and fiscal policies it is necessary to keep in mind that the variables do not respond instantaneously but rather adapt slowly due to the persistence in shocks.

The difficulties of the salary to adjust to full employment and the speed with which the long-term employment flows are adjusted contribute to understanding how the product is behaving throughout the cycles. Real rigidity also helps magnify nominal rigidities, by making companies more sensitives in their utility when there are price changes. When an economy is in cycles of depression or recession, there is evidence of increases in unemployment due to lower growth which leads to more layoffs and when people try to find new jobs offer them less salary which implies a drop in productivity.


It is because of these problems that the policies of governments and financial entities should be directed to develop financial markets better and make their access easier. If there is a financial market where companies can obtain loans for the development of their activities, the destruction of employment can be avoided, which will prevent wages from falling. The credit channels will be incentivized by monetary policies that affect the volume of loans of the banks and how this, in turn, affects the aggregate demand. That the loan channels are a variable of the monetary policy that can be used in addition to the management of the interest rate by the central bank.

If there were no distortions in financial markets, the demand for funds from companies would always be covered. Due to some regulations, credit channels are not continuously available to all businesses. The companies that are most affected by these rules and behavior of banks are medium and small companies which face higher loan costs, and it is not easy to enter the capital market because there are transaction costs to issue their shares, so they also do not have access to this means of financing. In the following graph, you can see the market capitalization of several countries.

Graph 31. Market Capitalization of listed domestic companies. Data taken from the World Bank.


Credit channels are a mechanism used by monetary policy but also serve as a propagation of the economic cycle in the face of a shock. The primary source of transmission of business cycles in credit channels is the volume of loans issued by financial institutions. When there is less volume of loans due to provisions that banks have for bad credits granted, there are fewer resources to issue loans which affect the level of activity of an economy since investors cannot ask for as many resources as they would like.

On the contrary, when there are booms in the economies, credits increase as banks have fewer provisions for bad loans and can lend more. These correlations occur in most countries regardless of domestic production or the development of the financial system. It is important to mention that the provisions affect the profits of banks which also affects the incentives to lend during recessions where it is normal for many of their loans to be risky.

To carry out some projects, medium and small companies must finance using their resources or some specialized entities. Even the issuance of bonds is limited to these types of companies due to the transaction and valuation costs of their assets. These high costs faced by companies are due to information asymmetries where banks must invest part of their resources in research to the people they are willing to lend to. Besides, as already mentioned, the provisions are also costly for the utility of the banks, so the risk they face when they lend money is transferred to their potential clients. The following graph shows the percentage of domestic loans provided by the financial system. There is a relationship between higher development and a more developed and accessible financial sector.

Graph 32. Domestic credit provided by the financial sector. Data taken from the World Bank.

In addition, banks cannot always be monitoring if their clients are using their resources properly, which is called in the economy, moral hazard. Moral hazard exists when a person can have bad behaviors and has no consequences. In the case of banks, people can be irresponsible with money management and take excessive risks, so banks must monitor the behavior of people.

Finally, when the central bank increases its interest rates, the banks adjust the credits they grant depending on demand and how their balance is, and if there are no credit restrictions, there will be no additional effects to a rebalancing in the credit market. But if there are some restrictions in the credit market, increases in rates will cause banks to lend less, also affecting the utility of banks and ultimately also affecting domestic production and investment in the economy.

In other cases, it is possible that external phenomena have repercussions on the national banking system and generate a crisis. For example, if there is a decline concerning trade and a depreciation of the currency might be considered, this may place the economy in a worse equilibrium in which people start panicking. Therefore, this state of panic may drive people to try to get all their deposits out from the banks, generating an effect where the bank runs out of liquidity but with multiple obligations, which might force banks to bankruptcy. These bank failures may induce a financial system collapse, external financing cut, currency depreciates even more, and production enters a crisis.

In open economies, the ability of the government to rescue banks is limited to the availability of international reserves. In addition, when there is a crisis in an open economy with exchange rate parity, this crisis not only affects banks, it also affects such parity, so in some countries with this system of exchange rates a financial crisis and crisis of exchange can be generated at the same time.

In conclusion, economic cycles and their fluctuations can be magnified depending on the state in which some variables are found and their rigidities. The labor market can give clues about what the current state of the economy is like and in what stage it is. Besides, the financial sector also responds to these cycles, and there may be crises during periods of recession or depression if the regulations or the way banks act is erroneous. That is why it is important to analyze different areas of the economy to understand what cycle it is in, how mature is that trend and what are the lags that can be identified to forecast the behavior of domestic production of a country.

©Forex.Academy

Categories
Forex Educational Library

The Potential of Emerging Economies

 Abstract

Some countries have valuable domestic productions such as Germany, Japan, the United States, Canada or France among others. But there is another group of countries that are representative and are called emerging economies. This group of countries are those that grow more than the average but that their level of nominal and per capita internal production does not reach that of the developed countries. Although they are not considered developed countries, they are important countries given the size of their market, and their progress in economic and social matters. Examples of these are countries such as India and Brazil. That is why, for the world economy to grow in general, it is important that the emerging countries do well.


Just as there are countries that largely determine the behavior of most of the world’s economies such as the United States and China there is another group of economies that are important because of their growth potential, such as emerging economies. Emerging markets are countries that have made steady progress towards the development and growth of developed countries as can be seen in some indicators of social development, capital markets and clear laws and regulations on transactions. Emerging markets are not as advanced as developed countries in economic and social indicators, but they maintain more developed economies and legal structures than other countries that are lagging in terms of development.

Emerging market countries generally do not have the levels of efficiency in the production of goods and services that developing countries have mainly. Another difference is the regulatory framework of the markets that also explain some of these inefficiencies since the legal framework in some countries is not well established so there is some distrust on the part of investors when they are going to invest in a country of this group.

But the positive aspect of the emerging countries is that because of this progress faster than the developed countries, the returns on investments are in most cases higher. This faster growth is because there is a greater field of improvement in these economies because in many cases there are nascent industries or markets that have not yet been fully developed, making it easier for these countries to grow faster than developed countries when the inefficiencies are solved.

Something that is always linked to the rates of return on investments is the risk that investments face. These risks are linked to political instability, problems or delays with the local infrastructure, the volatility of the local currency or liquidity problems which represents a risk for the investments since when there is little liquidity in a market it is difficult to get returns from the investments due to the little demand.

A problem to identify countries that are classified as emerging is that there is no unanimity in the classifications since some banks have identified certain countries as emerging while there the international monetary fund has another list of countries which makes it difficult to know which are the countries in this category to follow them up. The countries most agents consider as emerging are Brazil, Chile, China, Colombia, Hungary, Indonesia, India, Malaysia, Mexico, Peru, Russia, South Africa, Thailand, and Turkey.

As mentioned in the article China and its economic predominance China has grown more than the other emerging countries so it is expected that China will soon enter the group of developed countries due to the surprising rates to which it has been growing in the last decades. Even with the change of economic model China will continue to grow at high rates and will continue to achieve social achievements. Each analyst agent has the authority to enter the level of emerging markets to any country, as well as to lower their rating to countries on the border.

The main databases that analyze emerging markets consider annually how is the environment to do business in each country and show the positive and negative aspects in the main areas in terms of infrastructure and logistics. In recent years since the global recession of 2007, there has been great volatility which has led some developed countries to see their rating downgraded as Greece, a country that has had major economic problems in the last decade.

Emerging markets, although they are sensitive to the low growth of powers and trading partners such as the United States, China, Japan, and some European countries, also have attractive and large markets for investors, which means that emerging countries are also considered engines. of the world economy.

The indexes that measure the countries that should be in the emerging category measure:

  • Size of the market and the growth rate: This is a sample of the domestic production of a country, the stability of its financial institutions and the size of its population.
  • Market accessibility: Regulation of business, market risk, security problems, how has foreign investment behaved in recent years. How safe it is to do business in that country.
  • Market connectivity: Infrastructure in ports, roads, efficiency in customs procedures. If a country does not have good roads it will be more expensive, and it will take longer to transport goods from one place to another.


As mentioned earlier, the last few years have been years of low growth for emerging countries due to the global situation where raw materials saw their price fall, which affected the income of some emerging countries. But this low growth is general and has spread to most countries, which is explained by such a globalized economy where if there is a group of countries that stop growing or enter recession like Brazil they generate a problem in countries that are business partners as they stop consuming and ends up affecting the exports of several countries.

Until 2016, growth has been stagnating in emerging countries and some of the reasons for this are the slowdown in China which affects the price of raw materials, the instability of oil prices and the symptoms of an economy weakened in the United States, where a business cycle is observed to be terminated. Some analysts see China as one of the leaders of this group so if this country stops growing at the rates it was used to, it will generate a big impact on emerging countries’ indicators.

The other two important countries in the emerging countries are the United Arab Emirates and India which had the highest growth in 2015 and has had several reforms to improve business rules and has a market of great potential due to its size. As for Latin America in the last decade, it has offered opportunities to investors thanks to good rates of growth and political and social stability.

Since 2016, Brazil, which was among the five most important countries in emerging markets, stopped being due to the recession in which it started generated by corruption factors and reductions in the prices of raw materials. But the problems of corruption are a widespread problem throughout the region which added to the crisis of commodity prices since 2014, poverty and mismanagement of the economy have caused high growth rates that had at the beginning of the century no longer the same.

Another country that is important among the emerging countries is Mexico, a country that has managed to stand out above most of the countries in Latin America thanks to its large amount of exports and an attractive exchange rate that encourages exports even more. Mexico has a developed manufacturing sector that supplies the United States market. In addition to its manufacturing sector, it has other developed industries that are competitive thanks to low production costs where labor is almost as competitive in terms of costs to Chinese labor. Thanks to the development of its industries, Mexico has managed to develop a good infrastructure network such as railroads that allow transporting the merchandise without problems and in a short time.

Thanks to these advances in emerging markets, the global situation has changed, and the poverty rate has been greatly reduced, but a large percentage of the population still lives in poverty. It is important that emerging countries manage to follow this path of growth and progress so that the global economy advances at good rates and manages to reduce some problems such as poverty. Emerging economies are called to lead global economic growth in the coming years, but not only depends on them with an economy as globalized as we have now, because if countries like the United States and China stop growing or the emerging countries faces to Recessions, they will not be able to grow at their potential rates.

But emerging economies have everything to follow their good path and continue to grow at good rates, developing their institutions and advancing in legal aspects since their societies are established under laws that are fulfilled, the level of wealth and consumption has been raised, investment has increased in recent years, in most of the years of the last decade its economic growth is going at an excellent pace. In addition, emerging countries have higher rates of growth often give better returns on investment than other countries, but we must also be cautious because these rates of return involve greater risks than other risks that developed countries may have as political risks.

Although emerging markets are countries that grow more than the average, they have some difficulties in managing their own expansion. In some countries, policies have been erroneous to encourage the population to increase their savings rate. In terms of demographics in emerging market countries, there is a big difference with developed countries. In emerging countries, the population is younger than in the developed countries and has been growing at high rates, which in a few years, will mean that these countries will provide labor to more countries and avoid some problems when the population ages as large pension liabilities.

In the following charts you can see the population pyramids of the group of developed countries of the G7 (Canada, France, Germany, Great Britain, Italy, Japan and the United States) and countries leaders among the emerging that are green in the second graph that were carried out by a study of the BBVA Bank in the year 2013.

Graph 33. (2013, October 24). Emerging Trends in Developing Countries. Retrieved December 1, 2017, from https://www.slideshare.net/BBVAResearch/emerging-trends-in-developing-countries

Graph 34. (2017, September 20). Emerging and growth-leading economies. Retrieved December 1, 2017, from https://en.wikipedia.org/wiki/Emerging_and_growth-leading_economies

Graph 35. (2017, September 20). Emerging and growth-leading economies. Retrieved December 1, 2017, from https://en.wikipedia.org/wiki/Emerging_and_growth-leading_economies

A problem that arises with demographic explosions is the rise of inequality in the middle and lower classes. To prevent this inequality from rising when economies grow, the quality of life of the lower classes should grow at the same rate as the economy does. As previously mentioned, the economic development of the emerging countries has reduced poverty within its population, but the same has not happened with the rates of inequality which at best have remained stable.

The challenge for governments so that growth does not stagnate is to create a richer middle class that can consume more and that this could be one of the most important components in domestic production. Also, if the middle class grows, they will also use the financial sector of a country more, which will generate another engine for growth. That is why it is not good to have high rates of inequality in emerging countries because this can generate growth in the short term, but it will be a big problem in the long term.

The advantage of the emerging countries is that they start from a low base of middle and low class so that wealth can grow in great magnitude given the field of great improvement that exists in these economies. But it is not enough to encourage domestic consumption. Emerging countries should attract foreign investment to finance local projects and there should be more liquidity in the economy, which favors confidence indicators in the economy.

To attract investment, countries must open their doors to companies from all countries, establishing transparent property rights and opening capital markets to foreign investors. If the financial market adopts international standards, it will generate confidence among investors and the country’s risk premium will be reduced by making local investments more profitable because the financing costs will be reduced.

Although the population is young in emerging countries and can be the workforce used by other countries, it is important that there exist incentives in the countries to retain their skilled labor and thus benefit from these local workers. If countries have problems of employability, workers will look for other countries to work in and, in some cases, with better wages than if they decided to stay in their country of origin. So, governments must worry about creating jobs that require qualified people, which sounds logical, but it is difficult to adopt due to the immediate need of some countries to create jobs regardless of the qualifications of their workers.

In conclusion, the countries of emerging economies have a competitive advantage and it is the wide field of improvement that they have in their main indicators such as employability, inequality, foreign investment, industrial development among others, which attracts capital from all over the world thanks to their generous returns where investors expect economies to grow steadily and significantly in the coming years.

Many multinationals have been in these economies recognizing the potential of these markets that have a large size as in Brazil, China, India, and Mexico. In addition, they take advantage of some advantages such as cheaper labor than in developed countries, in addition to other factors such as natural resources that provide inputs for some industries.

 ©Forex.Academy
Categories
Forex Educational Library

Problems and Crisis in the Economy

 Abstract

The economy fluctuates in some studied cycles and it is normal that it revolves around long-term trends showing its productive capacity. It is therefore normal to see a crisis in some countries cyclically and the authorities must intervene so that crises do not become persistent. But there have been crises of great magnitude such as the crisis of the 1920s, 2000s and 2007. The latter was a financial crisis that had its causes in the measures taken by the central bank and the government to solve the stock market crisis in the United States in 2000. But it was a crisis that spread to most countries in the world due to globalization in investment, so people in all countries saw the crisis originated in the United States.


Throughout history in the economy, there have been several global crises that have emerged in different countries and each has a different explanation. This article will mention some problems that have arisen in the economies and that can still be presented in the future. The first issue to be discussed is the crisis that occurred in 2007, which originated in the United States.

The starting point to understand why occurred one of the biggest crises in history we should analyze the historical price of housing in the United States. There have only been two periods in the recent history of a drastic increase in the price of housing in the United States. The first period was in the 1940s during the Second World War and was due to the low construction activity in this period and an increase in demand when the war was over.

The second episode of a drastic price increase was the first decade of the 21st century, but this second episode cannot be compared to the phenomenon of the Second World War. Construction costs were declining, and demand grew, but not of great magnitude. In the following graph, you can see the magnitude of the increase in the prices of new homes in the United States.

Graph 19. (2011, January 22). Median and Average Sales Prices of New Homes Sold in the US 1963-2010 Monthly. Retrieved November 8, 2017, from https://commons.wikimedia.org/wiki/File:Median_and_Average_Sales_Prices_of_New_Homes_Sold_in_the_US_1963-2010_Monthly.png.

As the price growth was so fast, the prices could not sustain this trend and ended up decreasing close to 30% which led to the entire US economy collapsing along with other countries that also saw as the housing market was in imbalance. The effect on the economies was magnified because part of the income of the families came from this market since they had these investment instruments, so the price reduction ended up affecting household consumption.

To explain this crisis, we must first analyze the reason for the volatility in the price of housing. The prices increased drastically first because of very low interest rates that gave liquidity to the market, making the loans more affordable and second, due to the total euphoria of the consumers who had the belief that real estate prices would never fall. again. The nominal interest rates were low since inflation was low, so the central bank had no incentive to increase these rates and since the housing price did not directly enter the inflation indicator, it did not generate inflationary pressure.

A fact that would have prevented this housing bubble would have been to include the sale prices in the consumer price indicator and thus the FED would have had to increase the rates to control inflation since the only thing considered in the indicator of prices is the value of the leases, but these did not rise proportionally to the sale prices. Another element that fueled the bubble was the regulatory change made by banks to approve the granting of mortgage loans. The following graphs show inflation and the real interest rate of the United States during the crisis.

Graph 20. Inflation, consumer prices. Data taken from the World Bank

Graph 21. Real interest rate. Data taken from the World Bank

This regulatory change made easier to access a mortgage loan, which encouraged consumers to take loans and increased bank profits. Consequently, loans were granted to people who were likely to default on their loans. But the banks did this knowing the possible consequences because with the creation of financial instruments recently banks were able to take out new and risky loans from their balance sheets and passed them on to investors who did not know the type of mortgages they had within these financial products.

This is a problem of moral hazard since the banks were less careful in the loans they granted since in principle the risk of nonpayment was no longer theirs. When the market stopped rising, some households saw that the market price of their homes was lower than what they owed to the bank, so they stopped paying their loans and the banks began to seize the real estate, but going into loss due to the decrease in prices and the costs of having to keep a property for sale. In addition, many banks leveraged lending that is to borrowed money that was not theirs since they were indebted to other financial institutions so when people stopped paying and investors who had financial instruments some banks were insolvent.

The banks that survived the crisis remained in a weak position, so they had to take some measures such as lending less and increasing the requirements or selling liquid assets such as bonds and stocks, thus incurring losses. The result of this was the significant decrease in the loans granted which ended up having repercussions on private consumption which is the main compound of most of the economies in the world, expanding what started as a financial crisis and affected the price of the shares as panic was generated after the sale of shares by financial institutions what ballasted the values of the stock market.

The financial crisis that began in the United States spread and ended up affecting most advanced economies and emerging market countries due to trade. This is the main problem of globalization because with the opening of the markets of goods consumers spend part of their income on foreign goods and as consumption in the United States was depressed, also the demand for foreign goods was affected which ended for affecting production in the other economies, especially those that depend most on international trade. In addition, as mentioned above the financial instruments created were obtained by investors around the world, which is why it also affected the purchasing power of investors around the world.

Central banks used monetary policy to lower interest rates while government entities used fiscal policy to encourage consumption and replace private demand with public demand while consumption and investment recovered. But in some countries, the nominal interest rate was close to zero, so the banks did not have maneuver margin, so they had to wait until the fiscal policy stimulated the economy almost by itself. The only thing the central bank could do was to buy assets from banks that were weak so that the cost of lending would not rise, and they could continue giving loans for investment and consumption.

Once the crisis of 2007 is analyzed, another problem will be analyzed, such as the high debt of the countries. To understand why high and growing debts are generated, one can start from the assumption of an economy with a balanced budget. At a given time, the government decides to lower taxes by keeping public spending constant generating a budget deficit.

When a government faces a budget deficit, it can ask the central bank to finance it. In this specific case, what the government does is sell bonds to the central bank or private investors. If the government decides to reduce taxes for a certain period, to rebalance state accounts, the public sector must create a primary surplus, which can be achieved by raising taxes or reducing spending. The longer the government waits to raise taxes or the higher the real interest rate at the time of paying off debts, the higher the tax increase will have to be in the year to prevent the debt from increasing further.

Also, to pay interest on the bonds in each year that continues to have a deficit every year should have a primary surplus and thus not alter the level of existing debt. The longer a government waits to raise its taxes and create a surplus in its accounts, the stabilization will be more difficult because the tax increase will have to be much greater over time as the debt will increase. If this problem is not solved in the short term the debt will have high levels as a percentage of GDP and a debt crisis will be unleashed as interest rates increase and so will the government’s main debt, which will be a vicious cycle.

It is at this point that the idea of failing to pay the doubt to lower taxes or to increase public spending begins to seem attractive. But if this happens the government will have difficulties to finance itself in the future since the investors will not have credibility in the government and will ask for higher risk premiums within the interest rates of the bonds, so it will be a problem in the long term. In addition, this measure can affect the consumption of households by affecting their wealth as some will be holders of bonds that the government does not pay.

Many times, the correction in the debt does not arrive in time since the governments are reluctant to accept that the debt is becoming a serious problem or because there is political interest in maintaining certain policies such as tax reduction to win elections and not affect economic groups. important in the voting. In summary, governments can take three measures to correct deficits, the first is to increase taxes or reduce costs, the second is to finance through the central bank or stop paying the debt, but all these measures have their negative effects on both the balance of the government as in the consumers.

The last problem of the current economy that will be dealt with in the article will be high inflation. In the past, when the authorities could determine the monetary policy of central banks, this authority was used to print money to finance their spending. When the authorities did this, higher inflations were generated that ended up affecting consumers and investors through very high inflation rates. Currently what the rulers can do is request cooperation with the central bank so that the government issues bonds and the bank buy them with new money, that is, printing banknotes by the central bank which will have the same effect as if the government issue new money.

The phenomenon explained above is called monetizing the debt and it is not the main policy used by the government and the central bank, but there is a possibility that can occur. If this type of financing is used, hyperinflations that are large increases in inflation could be generated and become a repetitive one since inflation is indexed in certain goods of the economy, so if inflation is very high in a period, is likely to be in the next period very high

Hyperinflation would be generated if the nominal amount of money increased and is maintained indefinitely causing an increase in effective and expected inflation. When inflation overflows the fiscal deficit will also be affected since the purchasing power of people will be reduced and the collection of taxes from the government will take more time. In addition, taxes are collected on past nominal income and their real value decreases with inflation over time.

To curb hyperinflation governments must have a stabilization program that contains a fiscal reform and carries out a credible reduction of the budget deficit. Also, show and promise that the central bank will not monetize more the public debt of the state. If the problem of inflation is very large, a drastic measure that some countries have taken is to take the dollar as the national currency to reflect the fact that it does not have control over monetary policy.

©Forex.Academy

Categories
Forex Educational Library

Globalization and its Risks

Abstract

Globalization is an inevitable process that has been accelerated with the current means of communication and transportation, which help to trade more due to better access to foreign products. Globalization is not only economic, it also covers social and cultural aspects. But since globalization is a process that involves several aspects of society many people see it as a threat to local customs and producers, so they prefer to put some barriers to this process. But it is a process already in development that will be almost impossible to stop so the best thing that each country can do is take advantage of this for their benefit by being more competitive.


Globalization is a process that has spread to different areas in all countries, from cultural to economic aspects. For many economists, globalization has allowed the economic development of many countries to be driven by dependence on international trade and technological advances that not only stay in one country but also expand rapidly as well as new knowledge. But beyond the benefits of globalization, there are many people who question the effect that globalization has on different cultures in the world.

For many people, the values of their culture are very important to value and exchange them for more global ones, which is why some people are still reticent to see a total globalization of all aspects. There is a great debate that persists over time about how, and how much, politicians should intervene in this process of globalization and preserve their own identity or how much the economy of foreign goods should be protected.

Globalization has been formally defined as the phenomenon of acceleration and intensification of economic interaction between people around the world, companies, and governments of the countries involved in this effect, although today there is no country that has not been influenced for globalization. But globalization not only involves economic interactions, political and cultural effects have also been evident, which has led to the study of all areas of society and to encourage debate about the positive and negative effects of globalization.

The globalization of the production and distribution of goods and services has been well received by some people who can now access foreign goods of better quality and in some cases at better prices than local production. But the opponents of globalization show their concern about the local producers of each country and their standards of living after the expansion of international trade. In addition to increasing trade and allowing access to new products, globalization allows the exchange of cultural features, customs such as music and other determinants of daily life such as music and literature.

Exposure to the exchange of goods and services brings changes in the customs, values and local traditions of a country. This is also a point of debate since some believe that globalization eliminates the traditions of a country making it universal but at the cost of the loss of knowledge and traditional customs of a country which is not positive for some aboriginal and indigenous communities that can see this change in their traditions as something threatening.

One of the criticisms, in general, is the Americanization of culture and economy. The most powerful companies belong to the United States, as well as the richest people and in turn, many traditions and festivities that come from North America are exported and celebrated in other countries. This has been a high point and a great debate since many people, especially in underdeveloped and poor countries, see this Americanization as a threat, criticizing consumerism and certain values that are handled in that country. But this leader of globalization, as seen in the United States, has several elements that make it the leader of said globalization.

The first element that makes the United States one of the predominant countries in recent decades is the size of its market which represents about 300 million people. This makes it attractive for multinationals as well as generating economies of scale which means that as companies increase their production costs per unit produced are reduced making their operation more profitable. An important aspect of this large market is the wealth of the population since there are countries with similar or larger population sizes such as China and India, but the wealth between these three nations is not compared since the United States has about 25% of global production.

In addition to the importance of the United States market is the element of language because most people in North America speak English and it is a universal language that allows transactions to be made easily. It is not the only country that has contributed to the process of globalization, but it is one of the predominant countries in this process. The following graph shows the magnitude of the US market in urban areas

US market in urban areas

Graph 22. Urban population. Data taken from the World Bank.

The people who are in favor of globalization argue that contrary to what some people think, globalization supports local cultures through technology by allowing better communications through computer telephones and other elements that facilitate the exchange of opinions. In addition, they preach that through television and other visual artifacts, cultural elements can be displayed so that people who see it within each country feel more identified with their culture.

Another positive aspect of globalization is the new awareness of people that are currently being created – better educated with a broader knowledge and a global notion of different cultures. This type of people are the drivers of current economic processes, they have a more cosmopolitan than rational thinking, speak several languages, travel internationally and they have more developed skills with better education standards, so they have better living standards than the people who lived before.

Globalization in the economy is the most known and studied fact by people since it is vital to understand how this effect has an impact on people’s daily lives. Economic globalization involves the reduction or elimination of business and trade barriers between countries, which will encourage exports and imports to increase in each country. Therefore, globalization is the economic unification of different countries including the different types of investments that occur in each country. It is crucial that each country is seen as a piece of a puzzle and that each country will be very important for the good economic development of all countries.

Globalization is not a new phenomenon. It goes back more than  2000 years, during which time trade, traditions, ideas, and other elements have been exchanged between different countries and empires. In the last 200-300 years this unifying process has accelerated, leading to greater specialization in the production of goods and greater interdependence among economies. But what is not clear is that the pace of unification of the economies has not been constant, but has increased rapidly since the end of the Second World War. The following graph shows how trade in goods and services has increased in recent years, where globalization has accelerated.

 Exports of goods and services

Graph 23. Exports of goods and services. Data taken from World Bank.


Some of the consequences that globalization has left are:

  • The relaxation of government controls to let the market act independently thanks to the forces of supply and demand.
  • Efficiency in means of transport and communication which helps to make business faster and easier.
  • New technologies that contribute to the quality of life of people. Technological advances have been achieved thanks to the dynamism of trade and skilled labor which has contributed to the progress being made less and less time.
  • Greater dynamism in investments since resources can be easily moved from one country to another without the need to be in several countries to make such investments.
  • Better quality of life for a large part of the population. A better quality of life is achieved with globalization and international trade, consumers can acquire a greater variety of products of good quality and at better prices due to competition between multinationals and local companies.

In addition, globalization reduces labor costs because companies can be in the country that is most beneficial in terms of costs, where there is specialization depending on production and the intensity of capital used. That is why lower prices can be seen in goods and services since with globalization countries have managed to reduce their costs by specializing in countries with economies of scale and with good competitiveness in terms of costs.

Another consequence of globalization is access to the natural resources of different countries. This is an advantage for countries that do not have access to good resources due to their geographic location that determines the climate and their access to seas or not. In addition, there are countries that have better access to mineral resources such as oil or coal. Globalization intervenes in the fact that the multinationals depending on the location and resources of each country decide to locate themselves in a certain area to extract these resources, but also generating benefits for the local communities. The negative aspect of globalization at this point is to what extent it is positive to extract and exploit natural resources of a foreign country since it can destroy nature and many projects will be made for political interests rather than the possible economic benefits.

At this point in the article, we will analyze a determinant of investments in the globalized world that currently exists. Country risk is one of the most important variables when analyzing how risky investment is in a country given its political and economic factors and its relationship with other countries. The formal definition is the risk of an investment due to specific factors common to a specific country. It can be analyzed as the average risk of investments made in a country.

A country can see its risk increase if a country faces difficulties in paying debt acquired as bonds. The factors that may affect the payment of a country’s debt depend on economic, social, political conditions or in some cases due to natural disasters such as earthquakes. Any assessment of the risk of each country will express the level of probability of suffering a loss in the value invested and depending on the level of that country risk the investors will demand a return on an investment since in the finances if greater risks are incurred, it will be claimed better returns that demonstrate that it is a good idea to invest in that asset. In the following graph, you can see the percentage of country risk that some places had in 2016.

Market Risk Premium

Graph 24. Fernandez P., Fernandez I. and Ortiz A. (2016, May 9). Market Risk Premium Used In 71 Countries In 2016. Retrieved November 17, 2017, from http://www.valuewalk.com/2016/05/market-risk-premium-used-71-countries-2016-survey-6932-answers/

Country risk analysis is a predominant component of the specialized risk management departments of banks, insurance companies, risk rating agencies, and financial system regulators. In some cases, country risk includes the risk of payment transfers, confiscation and expropriation, and risks of internal and external wars.

The debtors of these investments can be stated sovereigns, or they can be private agents such as banks and companies that issue debt to obtain financing for their commercial operations. In general, any country or private agent can issue debt and be subject to country risk assessment and each agent that issues debt will be analyzed differently because almost no company or state will face the same determinants in the risk of their investment.

The country risk can be materialized to the extent that there may be a payment crisis and the result of this is the non-payment of the debt by the agents, whether private or state. This debt default occurs especially in countries with high debt or without good access to external debt. Also in cases where the debtor is a state agent, it is determined the number of foreign reserves that a country has since these can be used as payment by the creditors at a specific time. In the following graph, you can see the external reserves of different countries.

Total reserves. Data taken from World Bank

Graph 25. Total reserves. Data taken from World Bank.

©Forex.Academy


Categories
Forex Educational Library

Cycles and Economic Oscillations

Abstract

The economy of any country has 4 main phases: Depression, recovery, boom, and recession. In each economic cycle, there will be industries that will perform better than others, depending on which variables are growing the most, what is the situation and what are the policies taken by the central bank and the government. For investors, it is important to know in what economic cycle the economy is to make decisions about what assets to buy. In addition to these economic phases, the economy of the most important countries such as the United States, China, and some of the Europeans, can affect the cycles of other economies that can be called emerging and underdeveloped.

The economy of the countries is not stable in any case, they always have oscillations that are called economic cycles. The economic cycles are the recurrent increases and decreases in the economic activity of each country and therefore also the economic sectors are facing these fluctuations in the economy. These oscillations do not occur in the same way or in its magnitude since in each period the factors that affect an economy are different. In some periods of time, its most important sectors will stop growing due to internal or external factors, shocks from external economies or natural disasters, causing the magnitude and effect in the economy to be different over time.

There are four recognizable phases in the economic cycles experienced by all economies:

  • Depression or crisis: The lowest point of the economic cycle. When the economy is in this phase it is common that the main indicators of the economy are at low rates such as employability, consumption, the price of goods decreases or remains stable (low inflation rates) and the gross domestic product of a country is far from its potential. Given this situation, it is normal for the profitability margins of companies and banks to decrease during this point of the economic cycle.
  • Recovery: Phase in which the behavior of the economy begins to improve, there is a phase of better economic growth, better levels of employment, more positive margins, greater expansion of the domestic product and an increase in the price index in response to a better demand for goods and services by consumers and businesses.
  • Boom: The highest point of the business cycle. When the economy is at this point, production is in its potential, or in some cases, above. Because the economy is at its best there is full employment and as production is at its highest point with the lowest possible unemployment there is no possibility of better economic growth. In addition, since there is full employment, wages are higher due to the low supply of labor and consumption is also largely due to these higher wages
  • Recession or contraction: It’s the Economic phase where growth stops or slows down.  Production, investment, trade, and employment rates, as well as the wages of people, stalls or, even, decreases. The margins of the companies drop again, and the revenues of the government diminish. If the recession or contraction occurs in a severe and prolonged way, it may lead the economy to a crisis, signaling the beginning of a depression.

Economic cycles can be calculated by analyzing some economic variables. The most used are the gross domestic product of a country, inflation, and unemployment among others. Keep in mind that some variables are pro-cyclical, and this means that they increase when the economy grows and decrease when the economy decreases such as GDP and inflation and there are other variables that are countercyclical which grow when the economy gets worse such as unemployment. There are others that are acyclic, and this indicates that they are not very correlated with the behavior of the economy.

As there was mentioned earlier, economic variables are never constant, they are always fluctuating around a trend. These fluctuations are common in all the economies of the world, but there are always facts that explain why these variables fluctuate in a different way in time. It is strange to see two periods in time that have the same economic factors developing so the recessions are not the same as the booms because they are generated by different factors.

Fluctuations lack periodicity, but they are recurrent. In addition, when growth is above the trend, the variables are correlated so that when the economy starts to grow, investment also increases, which magnifies booms or recessions because one variable affects the others. What the economists have found is that among all the variables, the most volatile is the investment over the product and the consumption due to the risk aversion of many investors and the expectations they have. When the economy begins to show signs of stagnation, investors are the first to change assets and invest in another country.

For the world economy, it is important to follow the economic cycle of countries that drive global growth, such as the United States, the countries belonging to the European Union and China. When these economies enter phases of depression or recession this affects the other economies because in a world as globalized as the current one if a country does not grow to its potential this will affect its domestic consumption and end up affecting products that are exported to these countries. This is the reason why global growth since 2007 has not been very good in general because there are countries that are not growing at what they should according to their potential. In the next part of the article, we will explain how the current economic cycle of the United States and then the countries of the European Union are.

During much of the 1990s, the United States economy recorded an expansionary phase that ended with the economic crisis of 2000 to 2001 generated by several factors including the crisis of technology companies. The boom of these years was also due to the formation of capital in the high technology sector, where such was the increase in investment that boosted the domestic product which in turn boosted consumption and employment. But such was the euphoria of the investors, that overvaluation was generated in the United States stock market of the main companies added to a great appreciation of the dollar. This appreciation of the dollar allowed increasing the purchasing power of the citizens which generated imbalances and causing a deficit in the current account of the balance of payments, increasing the indebtedness and high prices of some assets.

The exhaustion of the expansion was manifested by drastic drops in the margins of the companies that ended up affecting the stock market indexes and this frightened away the investors, which drastically reduced the investment. To respond to this crisis, the monetary authorities used fiscal policies (higher spending, lower taxes) and expansive monetary policies (nominal interest rates and low real rates to encourage consumption). These measures allowed consumption to replace investment as the engine of the economy but created the basis for the crisis of 2007.

The measures to recover from the economic cycle of depression in the United States economy raised the debt of government households while companies began to see their margins improve due to lower debt costs and higher domestic consumption. The dollar was also depreciated due to the decrease in rates, which encouraged exports, but this effect was paralyzed when in 2004 monetary policy stopped the depreciation. The crisis of 2007 was a subject exposed in the article Problems and crisis in the economy.

After the crisis of 2007 and its continued depression, the recovery phase began in 2009. Since 1949, the United States economy has had 11 expansion phases and 11 recession phases. The expansion phases have had an average of 21 consecutive quarters growing. The longest phase of expansion has been of 39 quarters that was from 1991 to the year 2000 with a growth in that period of 43% of the domestic product. The most significant growth was 53.7% between 1961 and 1969. On the other hand, the shortest economic cycle lasted 4 quarters between 1980 and 1981.

The current economic cycle of the United States is above average in its growth phase, growing close to 32 consecutive quarters since the third of 2009, but the growth has not been of the same magnitude as the most euphoric episodes of the past. Although each economic cycle is different, and patterns are not always repeated, there are indications that global economic cycles are slower in their recovery if the origin of the crisis was a financial crisis like the one in 2007 where several banks went bankrupt and others were weak in their balance sheets and this indicates why the growth has not been the same as in other periods of time. The growth rate has not been very high in the United States since domestic demand (Consumption and Investment) has been weak in several quarters showing the consequences of the crisis.

In conclusion, the United States is in a period of boom economic cycle and some analysts predict that as the period of growth is so long, it is likely that in 2018 or 2019 the economy stops growing and enters a period of recession in its economic cycle.

For many investors, economic cycles are a useful tool used to allocate their resources in booming or growing economies or know which sectors can grow if a country is in recession. Clearly all sectors are affected by crises, but there are some sectors that do better during these difficult times than others that depend more on the economic cycle as dependent sectors of consumption that is one of the most affected.

Now we will analyze which economic cycle Europe is in. The indicator of economic sentiment has increased in recent quarters in the euro area, which shows that investors’ expectations are positive on the general growth of the eurozone. As can be observed in the following graph, the indicator of economic sentiment is correlated with the behavior of the gross domestic product, so it is expected that in the following quarters the eurozone will continue to grow, showing that they are booming in their economic cycle.

Graph 36. (2017, October) European Business Cycle Indicators. Retrieved December 3, 2017. From https://ec.europa.eu/info/sites/info/files/economy-finance/tp019_en.pdf.

If the eurozone is analyzed by sectors, it can be seen in the figures that the industry and services sectors grew while construction and consumption have not shown higher growth, which indicates that these variables are stable. In the following graph, you can see the confidence that exists about the growth of the industry in the European area.

Graph 37. (2017, October) European Business Cycle Indicators. Retrieved December 3, 2017. From https://ec.europa.eu/info/sites/info/files/economy-finance/tp019_en.pdf.

During the third quarter, the highest levels were seen in all sectors for approximately six years. The country where you see the best performance of the economy, with even better expectations, is in Italy. Then comes France, Poland, Holland, and Spain. The expectations about Germany and England are not so good, and their indicators have remained stagnant.

The central bank’s forecasts were raised in one of its last meetings in the third quarter on production and prices in the eurozone. If we compare these forecasts with their expectations in the previous quarters has seen improvement in these which indicates that the expectations are positive and indicates that the countries of the eurozone are in their growth or boom phase.

The only exception with negative expectations is England, where the index of economic sentiment is negative. In other countries, there has been an increase in the utilization capacity in manufacturing for five consecutive quarters. In the services sector, there are positive expectations because positive symptoms are seen in domestic demand so in the following quarters should increase production, added to employment, investment and therefore the sectors that are related to these indicators.

In conclusion, the main economic zones of the world are in an expansive phase of their economies, such as the United States and the European zone, so other countries such as emerging countries and others have positive prospects, but some analysts predict that in next few years the US cycle may end and enter a period of recession which would affect the growth of the countries that trade more with this country. The most important thing is to understand that all economies move in these cycles and economic oscillations so entering a recession is not serious if governments take counter-cyclical measures to reactivate the economy. Another factor to consider is the change of the Chinese economic model, a fact that can also affect some countries that saw China as an importer of raw materials such as coal and oil. As the trajectory of the economies of China, the United States and the eurozone follow, they will determine world growth in the coming years.

©Forex.Academy

Categories
Forex Educational Library

China and its Economic Predominance

Abstract

Throughout history, there have always been countries that stand out for their developments and their economy. From the Second World War until recent years, the United States stood out for having one of the largest domestic productions of goods and services in the world. But in the last three decades, China has shown high rates of economic growth over any other country which generated a convergence towards developed countries. With this economic development has also come a social development but that is not enough because many people are still in poverty. This great growth was based on exports from its most developed sectors, manufacturing, and agriculture. But its growth policy has changed in the last ten years, since its leaders wanted to base growth on greater domestic consumption and that most of the population would benefit from this change, which had consequences not only in China but many countries that they traded with this country.

China has emerged in recent years as a super economic power fighting in recent years for being the most important country in economic terms. For some people, China is the most important country in terms of production, and for other analysts, this country still does not reach the first place. Regardless of that ranking, China is the largest exporter in the world and therefore has the highest national reserves in the world. The global crisis of 2009 interrupted the steady growth rate that China had had thanks to its exports, which showed the country’s dependence on its trading partners.

As a result of the global economic slowdown and its consequent slowdown in trade, China’s growth slowed to less than 7% in 2015, one of the worst performances of that economy in the last two decades. In 2016, the slowdown in the economy continued to grow at relatively low rates for that economy. The result of this was the growing indebtedness of the companies reaching very high levels compared to the rate of China’s gross domestic product. Domestic consumption was also affected in addition to a devaluation of the yuan against the dollar which ended up causing a flight of capital that deeply affected the economy of the Asian country.

Despite the economic development and its high growth rates in recent decades in China, there are still many challenges related to the problem of population aging, reduction of the workforce and large differences in the quality of life between the city and the city. countryside. It is true that poverty has declined, but it is still a high rate of around 10% that translates into 120 million poor people, which worries investors and the government because to continue with an optimal path of growth, poverty is an obstacle that has not yet been overcome.

China’s economy is very diversified, but the manufacturing and agricultural sectors predominate. Agriculture employs about a third of the active population and contributes about 9% of the gross domestic product. This is a consequence of China being the most populated country in the world and for that reason, it is one of the main agricultural producers and consumers in the world. In terms of livestock, China is also the largest market in the world in its production to respond to the needs of its population. Mining is also an important sector of the Chinese economy since it has good access to these resources and has large reserves of coal, gold, iron, oil, and gas.

The manufacturing and construction sectors contribute almost half of the production in China. The Asian country has become one of the favorite destinations for the transfer of global manufacturing units because of the amount of labor that makes it cheaper in compared with other countries, although as mentioned before it has been reducing the supply of labor what has been reflected with an increase in the salaries.

But to better understand how China became a super economic power that competes with the United States to be the country with the highest production in the world, it is necessary to understand the relationship between politics and the economy in the Asian country. China is a socialist republic with a one-party system governed by the communist party that has as its principles or aims to maintain a stable and high rate of growth and social stability that allows having a good coexistence within its population. The following graphs show the gross domestic product per capita and nominal respectively between the United States and China.

Chinese Economy Growth Rate

Graph 26. Gross domestic product per capita, PPP. Data taken from World bank

Chinese Economy Growth Rate

Graph 27. Gross domestic product. Data taken from World Bank

In 1993 a Marxist economy with liberal laws and policies was introduced. In 2001, China entered the world trade organization and with that began the investment in private property, establishing state interests in own assets and new contract laws. By making a structural analysis of the Chinese economy you can see certain clear characteristics that differentiate it from others and that is why it has achieved economic success:

  • High savings rate: In China, there is a savings rate of 51% and an investment rate of 43%. The economies that save the most are the economies that grow the most in the long term since with this saving, investments are financed without having to resort to bank loans. In the case of China, the high savings rate can also be explained due to the uncertainty of private companies and citizens to access bank financing since this type of financing has public companies as a priority.
  • Excess capacity: China being governed by a single party has had certain extreme policies such as the regulation of prices in public services and in some cases on land, which has promoted different sectors such as manufacturing and heavy industry reduce their costs and focus more the profits to invest, but has been pushed to the limit so there is excess capacity due to excessive investment.

Another explanation that China converged to the level of the developed countries was its decision to open its borders in 1960 with the free world moving out of the sphere in which it found itself with the Soviet Union. When China decided to open its economy to the entire world, it modified its economic and political system, as previously mentioned, by leaning towards a one-party system.

Beginning in the 1980s, China changed its economy from self-sufficiency to an export-based economy, being a key change for the growth rates it would reach years later. But China knowing that not only could depend on exports due to the excessive dependence of other countries, so it was also building its internal consumption sector so that in the future it would have more alternatives to base its growth.

The Chinese economy is essentially industrial. In the early 1970s, agriculture and livestock accounted for about 30% of China’s gross domestic product. In recent years this has changed, and the most predominant sector is construction and services. Although the primary sector has lost weight in the economy, it continues to provide employment to around 40% of the population, being a very important sector for the Chinese economy. There are also large deposits of minerals, so in 2007 it was the third-largest mineral extraction country in the world.

One of the main products extracted by China is coal and it is the third country that imports most oil in the world, so when China’s economy has problems in its growth it stops demanding oil, affecting the price of this and its producers like Russia, the United States and members of the OPEC.

Analyzing the growth of China’s domestic product in recent years, the industrial sector continues to grow, but not at high rates as it did previously, so we can observe a convergence of China with advanced economies as this is a sign of the consolidation of the Asian country as a world power because the countries that see their industry growing at high rates are usually developing countries.

Another figure that demonstrates China’s current dominance in the economy, as well as the convergence of its economy to advanced economies, is its weight in world production, representing 17% of world production surpassing United States production, which by 2014 represented the 16% of world production. This has been a positive surprise for economists who predicted 30 years ago that China would remain in the group of low middle-income economies. It is important to clarify that China has a higher gross product than the United States in total, but if the per capita gross domestic product is analyzed, the United States continues to have more production than China due to the poverty that exists in China.


An important test that faced the Chinese authorities was the global recession of 2007 where Chinese exports fell between 15% and 18% generating unemployment of 23 million people but managed to recover their growth path, unlike other countries that still have persistent problems since 2007. For some economists is a mystery that is worth studying because China has managed to survive the last major global economic crisis maintaining high growth rates being a country that has tried not to monetarily intervene much the economy.

But in recent years the authorities have tried to take China towards a new economic growth model. The growth model of the Chinese economy that has been based on exports, the development of industry and investment in about 40 years could become a model based on domestic consumption and services, but as mentioned in the paragraph previous always thinking about better standards of life of the population. A clear example of this change in the economic model is the decline in China’s exports of goods and services, as shown in the following graph.

Chinese Economy

Graph 28. Exports of goods and services. Data taken from World Bank.

The main news has always been based on the growth and predominance of China, but little has been said about social development. China has improved the living standards of its population as few countries have done in history. But the Chinese authorities want to change their economic model to maintain a balanced and sustained growth in the long term. That is why we have seen some adjustments in the world economy today as the crisis of the mining energy sectors worldwide. Oil and other raw materials have suffered serious price crises that have affected the economies of countries such as Venezuela, Russia, Colombia and other countries that received most of their income from these sectors of extraction of raw materials.

China’s current figures are 40% of the domestic product is dedicated to investment, industrial production represents about 50% of production, but services and consumption have low rates compared to developed countries, group to which China has already entered in recent years due to the behavior of its economy.

The structure of the economy that has given positive results to the Chinese economy has caused some friction with other countries since China has produced more than it has consumed and the excess of this has gone to exports. But many countries believe that the exchange rate in relation to the yuan is undervalued so that exports are more competitive than it should be, and this leads to China having trade Surpluses.

The change that the authorities want is to increase the weight of consumption in the economy to the detriment of savings and investment, decrease the weight of exports offset by domestic demand and an increase in the weight of services in domestic production to the detriment of the Industrial production. To support these changes and to encourage greater consumption, China must continue promoting social development, especially in education and health to reduce these items and increase population savings rates.

For economists the fiscal structure must also change to encourage consumption, that is, they must seek taxes on other items than private consumption to reach the objective in the economic transition. If the business tax is increased, the fiscal effect will be compensated so that imbalances in the national accounts are not generated. Likewise, the financial system must refocus its credits since to sustain growth before they were based more on loans for public companies and investments, but with the change of model, they should focus more on loans to people to increase their consumption.

The exchange rate also plays a fundamental point in the change of economic model. As mentioned above, the exchange rate favors the yuan, which is undervalued, which favors exports, but ends up affecting the consumption of people, since to consume foreign goods it becomes more expensive. If the exchange rate is appreciated, this generates an income effect, increasing the purchasing power of consumers and reducing the competitiveness of products of Chinese origin.

But these changes have been taking place since 2010. Since that year, imports have grown more than exports, the trade surplus has been falling and the yuan has appreciated, but to a lesser extent than the other effects. There has also been a clear interference by the government in the economy to generate structural change such as increases in the minimum wage, subsidies for consumption and a progressive extension of the social security system.

All this structural change of the Chinese economy will influence the whole world mainly of the companies and countries that benefited from the Chinese industrialization and the products that it was exporting. Raw materials will also be affected as one of the largest importers in the world is changing its model which will drag prices down. But new developing sectors will also be opened and new opportunities in financial services, consumer goods and other sectors that are related to the new economic model will be opened.

For foreign companies, the main reason to invest in China was the low production costs due to a large amount of labor, but currently, the attractiveness is in the size of its market. But with the change of model, new conflicts have also been generated with foreign companies in China, where the government has tried to favor local companies, following the restrictions of foreign investments in numerous sectors, which is why the fear of economic nationalism has also arisen of the Chinese state.

But here the question arises whether, with the change of model and the emergence of some global problems of this change, China managed to maintain those high growth rates. The consensus among economists is that the good performance of the Chinese economy will continue but not the rates that had been registered for more than 30 years. The factors on which China’s economic growth has been based will continue to operate in the long term, such as:

  • Abundant and qualified workforce.
  • Growth model open to foreign relations.
  • Greater liberalization of the economic system.
  • Political and social stability.
  • Process of gradual and prudent reform that avoids a strong shock in the economy and its agents.

In conclusion, China has been a unique case in the development of economies due to its political model that has allowed the development of economic policies based on the industrialization of the country, a large number of exports and important social development but still lacking to improve because of a large number of people who are poor. This is seen in the domestic product per capita where China has not managed to surpass the United States as the largest economy in the world because there are still millions of people who are not considered in economic development. China is currently in an economic transition where domestic consumption is the priority to continue with the social process that it has already achieved in the past.

©Forex.Academy

Categories
Forex Educational Library

Expectations about the Economy

Abstract

There are a great many intertwining variables that influence the current state of the economy at any given time; such as unemployment, wages, internal production, investments and many more. But with all of them, it is the expectations of people, and investors that generate certain effects, that explain the behavior of some of these variables and which will affect future conditions. For example, if people expect future interest rates to be higher, they will consume or ask for more loans in the present because in the future it will be more expensive to consume. But without rising interest rates, consumption varies today due to expectations. Another example is the expected interest rates in a country, depending on these expectations the investors decided where to place their capital without waiting for this to happen.

The economy in its short-and long-term models must consider the expectations of consumers, companies and all representative agents within an economy. To consider the subject of expectations first the interest rate variable must be introduced. Interest rates expressed in units of a national currency are referred to as nominal interest rates and these rates appear in newspapers and financial pages. Interest rates expressed in a basket of goods are called the real interest rate and are called that because it is beyond inflation and reflects the cost of acquiring goods that will be consumed by people, what is truly important.

There is an equation that establishes that the real interest rate equals (approximately) the nominal interest rate minus the expected inflation. That is why in some media, although they mention a decrease of the interest rates it is said that the interest rate is still contractionary or it may be that the nominal is lower one year than another, but that does not indicate that loans are cheaper than the previous year, so you should consider real interest rates. The interest rate directly affected by the monetary policy is the nominal interest rate. The interest rate that affects spending and production is the real interest rate. Given this difference, it will be possible to see in the news that they contradict the potential effects of monetary policy on the economy and financial markets. In the following graph, you can see the real interest rate of some countries.

Expectations about the economy

Graph 6 Real interest rate. Data were taken from the World Bank.

To summarize the issue of interest rates it should be clarified that the nominal interest rate indicates how many euros must be returned in the future to obtain a euro today and the real interest rate tells us how many goods must be returned in the future to obtain a good today. Nominal interest rates will affect investment decisions between bonds, stocks, and money, while the real interest rate will affect project investment decisions. In the short term, an increase in the growth of money leads to a decrease in both nominal interest rates and the real rate, in the medium term, an increase in the growth of money will not affect the real interest rate, but if it raises the nominal interest rate.

The bonds issued by a country are differentiated in two aspects: their risk of default and the time of their pay. There are some bonds that have better coupons than others, which are riskier by defaults and that ends up affecting the price of bonuses. But for economic purposes, this part of the article will focus on the bond term. Bonds with different times of paid have different prices and different interest rates that will be called yields. The yields of short-term bonds, usually a year or less, are termed short-term yields and, if the bonds are more than one year, they are called long-term yields.

The interesting thing about analyzing the bonds is to determine the curve of the yields and the relationship between short-term and long-term rates. The price of a one-year bond varies inversely with the nominal interest rate at one year that is in effect at the present. The price of a two-year bond depends both on the interest rate to a current year at the present, as well as the expected interest rate for the following year. The interesting thing about analyzing bond prices is that bond yields contain the same information about future interest rates as the bond yield curve fully reflects the agents ‘ expectations of the economy of a Country.

To begin the analysis, a term performance must be defined; The term yield of a bond to N years, or in other words the N years interest rate is the constant annual rate that makes the current price of the bond equal to the current value of the future interests generated by this. By examining the yields of the bonds at different times, we can deduce the expectations of the financial markets on future short-term interest rates. For example, if you want to see the expectations of the financial markets in one year you should observe two-year bonds which have included expectations about the interest rate that will be at the end of the year and observe bonds to a year of maturation.

When the yield curve has a positive slope is when long-term interest rates are higher than the short-term, financial markets expect short-term interest rates to increase in the future. When the yield curve has a negative slope long-term interest rates are lower than those of the short-term, but markets expect this situation to change and short-term interest rates fall in the future. To observe market expectations during the crises of 2000, 2007 and others, it is interesting to observe the curves of the bonds of the countries that reflect the expectations of the financial markets and the decisions that were expected to be taken by the banks Central. It is important to note that the interpretation of performance curves only focuses on expectations and in most cases the decisions of banks and market agents are unpredictable. In the following two graphs you can see the bonus yield curve. In the first graph, you can see a bond of Colombia and in the second is the types of curves of yields.

Curva de Rentabilidad TES Tasa Fija

Graph 7.   (2017, October 10) Curva de Rentabilidad TES Tasa Fija, retrieved October 10, from https://www.grupoaval.com/wps/portal/grupo-aval/aval/portal-financiero/renta-fija/tes/curva-rentabilidad

Estrategias con bonos

Graph 8. Roca E. (2013 September 23).  Estrategias con bonos. Retrieved October 10, 2017, from https://www.rankia.com/blog/erre/1963186-estrategias-bonos

Leaving the issue of bonds aside, the behavior and expectations of consumers and businesses will now be analyzed. These two market agents always respond to their expectations about the future. In economic models, you have a consumer who is extremely far-sighted about the future so consumers will always be thinking about what affects their consumption in the following periods. While not all consumers are like that, in reality, it is a simplification that helps to understand the formation of expectations and how they would respond to an external shock.

To understand consumption decisions, it is essential to take an intertemporal perspective because what a consumer spends and borrows today will impact their future consumption. It is assumed that individuals are rational but in the models, it is assumed that the individuals are identical to simplify the models. According to the theoretical models, consumers are very sensitive to variations in income. An explanation of this is that credit is not available to the whole population so if income disappears or decreases it will have an immediate effect on consumption as there would be liquidity restrictions. Or in another example, before the tax rate reduction is announced soon, consumers can anticipate a future increase in their income because consumption will increase at the present. These effects on consumption depend a lot on the type of agents that there are because in some countries there are more wealthy people and they do not have liquidity restrictions when compared with another country where much of the population have problems to access to credit or income is very low.

Consumption probably varies more than the current income. For example, if you have the expectations that the decrease in your income is permanent your consumption will fall in the same proportion. But if the consumer believes that the effect is transient, they will adjust their consumption less. In a recession, consumption does not adjust to the same magnitude in which the income decreases because when a rational consumer knows that it is a temporary shock and the economy will end up retaking its natural level of production. The same happens during the expansions since the rent can increase but it is not proportional to the increase of consumption because it is a momentary shock.

It should be considered that consumption probably varies, although the current income does not vary. Presidential elections, changes in Congress, or changes in people’s expectations of the performance of the economy or international relations can affect consumption without the income being affected. Even some recessions are exacerbated by people’s expectations of a crisis greater than that which exists

It will now be analyzed how companies make their decisions depending on the expectations they have. As mentioned earlier in this article investment decisions by companies depend on the real interest rate differently from the way people do in considering the nominal interest rate. Corporate decisions also depend on household consumption, sales, and expectations. A company when it is going to invest in machinery and capital to develop its activities more efficiently must make a comparison. The companies must first calculate the expected value of the benefits that the acquisition of that machinery would bring, and then compare this to the costs incurred in buying that machine.

In short, if the company believes in its expectations that the benefits in the future will be greater than the costs of its investment, then it will decide to invest. The higher the actual and expected real interest rate, the lower the expected value of benefits and this will reduce the investment the company makes. The sum of the real interest rate and depreciation is called the cost of capital use and they have adversely affected the investment decision of the companies.

If a company experiences an increase in sales that is believed to be permanent, the expected value of the benefits will also increase what will lead to an increase in investment. But it’s similar to what happens to consumption, the investment does not respond in the same magnitude as sales as the investment is not continuous as can be the consumption. Once a new technology has been implemented, the company has no incentive to continue investing beyond a certain equilibrium point. That is why it can be concluded that investment is much more volatile than consumption, although they respond in the same way to external factors such as recessions and economic booms.

If monetary expansion leads financial investors, businesses, and consumers to revise their expectations of future interest rates and future production, monetary expansion has an influence on economic output, but if the expectations do not change, central banks will not have good tools to affect production as they have small effects on the economy. If a change in monetary policy does not surprise the agents of the economy, expectations will not change and production along with other variables are not affected. The effects can be deeper or not in expectations, but it does not mean that expectations are random and erratic. Economists assume that there are rational expectations in their models and on this basis monetary policies are formulated.

Forex Academy

Categories
Forex Educational Library

Short-Term Economics

Abstract

It is true that the long-term is more important than the short term in the economy, but there are variables that it is important to analyze in the short term such as the internal consumption of people, investment, the trade balance, the exchange rate, and others. When people are analyzing the short term, it can be concluded why an economy is behaving in a certain way since variables that are constantly changing are analyzed. Even fiscal and monetary policies are based more on the short term because they have to correct the failures that exist in economic cycles so that the crises are not so deep and that the booms do not turn out to be negative, as in some cases it has been presented euphoria in the stock market.

In an economy there are different agents such as companies, consumers or the state and each of them makes their decisions in different ways. Therefore, if someone wants to understand how the demand for goods behaves it is necessary to decompose the aggregate production (gross domestic product) from the point of view of the different goods produced and the different buyers. When GDP is decomposed several important components can be seen.

The first component of the gross domestic product is consumption. It represents the goods and services purchased by consumers ranging from food to luxury goods. In all countries, this is the most predominant component of the gross domestic product. The second component is the investment which considers the investment in capital and the residential investment. The third component is public expenditure which represents the goods and services purchased by the state, but this component does not consider the transfers made by the state nor the interest paid by the public debt. In the chart below, you can see the spending of three countries as a percentage of the gross domestic product.

Expense

Graph 11. Expense. Data taken from the World Bank

To find the purchase of domestic goods and services should be subtracted imports and added exports. The subtraction between exports and imports is called the trade balance. If exports are higher than imports, it is said that the country has a trade surplus. If exports are lower than imports, the country is said to have a trade deficit. With what has been mentioned so far, we have analyzed some sources of purchases or sales of goods and services. To analyze the production, it must be considered that companies may have inventories from previous years or that they do not sell all their products in the current year. The difference between goods produced and goods sold in a year is called inventory investment. This investment is usually small and can be positive or negative. The following two graphs show exports and imports respectively from four countries.

Exports of goods and services

Graph 12. Exports of goods and services. Data taken from the World Bank


Imports of goods and services

Graph 13. Imports of goods and services Data taken from the World Bank


Consumption decisions depend on many factors, but the main one is available disposable income after paying taxes and other compulsory expenses. It is normal that, if disposable income increases over a long period of time, the demand for goods increases. The effect of income on consumption is called the marginal propensity to consume and this effect may be different between countries. In conclusion, consumption depends on income and taxes.

As for public expenditure is determined by the fiscal policy of each state. It is directly affected by taxes since these are the main source of income for a state. As states do not behave as companies or consumers cannot establish rules about this component since it involves policy, so it is not easy to analyze how the fiscal policy of countries

The production depends on the demand which depends on the rent. So, an increase in public spending causes an increase in production and this leads to an increase in income-generating an impact on demand and this again affects production and so on. Given the above, it is important to analyze what effects each component of GDP has since all variables are related to each other. But despite the models that indicate how each variable affects production is impossible for governments to reach the level of production they want because there will always be external shocks, or the expectations of agents will not respond as expected.

In the next part of the article, we analyze the determinants of the demand for money. In the economy, there are several types of instruments such as bonds, shares and bank deposits. Also, people could decide to have all their wealth of money which would be more comfortable since they would not have to make transactions nor go to the bank, but that also means that they will not receive any interest in this so the decision to have cash or does not depend on the yields of the various instruments. The determinants of the demand for money will be our number of transactions and the interest rate. The interest rate serves to intervene in the economy by the central bank affecting consumer decisions.

The demand for money from the economy is no more than the sum of everyone’s money demands. For everyone, the demand for money increases in proportion as income increases and the demand for money has an inverse relationship with the interest rate. The higher the interest rate set by the central bank the higher the opportunity cost of having money in the pocket and the better it would be to have bonds or deposits in the bank.

The money supply will now be analyzed. In economies, there are two sources of supply. The first, bank deposits that are offered to the public and the second source is the cash offered by the central bank. When there is an increase in the national income this leads to the demand for money increases, but not the supply, which generates an increase in the interest rate to balance supply and demand. So, when the central bank increases the money supply generates a decrease in the interest rate to reach equilibrium in the money market by increasing the demand for money. It is important to keep in mind that these interest rates that are modified are in the short term.

In current economies, central banks change the money supply by buying or selling bonds in open market operations. If a central bank wants more liquidity in the economy, it buys bonds and pays them by creating money and if it wants to remove liquidity it sells bonds to collect money from the economy. With these open market operations, the economies succeeded in modifying the short-term interest rate. This short-term, as well as long-term rate, affects the investment of the economy as consumers and companies take these rates into account in their decisions. The higher the interest rate both short and long term will be more expensive for the company to borrow and will postpone this decision. In the equilibrium of the goods market, a rise in the interest rate will cause a decrease in production.

In current economies, governments and central banks combine fiscal and monetary policies to have deeper effects on the economy and take it along the path they believe is right, but they do not always agree on their policies. When there are recessions in the countries is when the banks and governments agree to get the economy out of this state. At other times when the bank takes an expansive monetary policy the government may have a contractive fiscal policy this depends on the expectations of each and what the objective of each agent.

After the implementation of these policies the adjustment in the economy is not immediately and each agent takes time to adjust their decisions, so when taxes rise consumption takes time to show the effects or the same when the monetary policy is changing when the central bank lowers its interest rates consumption does not respond immediately because the economy has transmission channels that are not updated in a quick way. In addition, in each country, the transmission time of the policies can vary because each consumer or company in each country acts differently so it cannot take an estimated transmission time globally.

Now we will discuss the trade balance issue. Nowadays the world is totally globalized and so is the economy. Globalization brought with it greater competition for local companies and specialization of economies, taking advantage of their competitive advantages thanks to their geographical location or climate. Exports represent important percentages in the domestic production of a country. Imports are also positive if consumer welfare is analyzed as they will have more variety of products and will be able to choose better goods. This decision of consumers and companies sometimes buying foreign and non-local goods obviously affect local production.

In the decision to buy inland or foreign goods is fundamental the price of goods in the choice of which to buy. The comparison of foreign and local prices is a relative price and is called the real exchange rate. This rate is the important one to know because the agents prefer local or foreign goods as it indicates the relative terms of exchange, but in goods not in currency. The real exchange rate is an index number i.e. it does not transmit direct information, but it can indicate whether in a country with the passing of time the goods became more expensive or not with respect to other countries what matters is the variation of this exchange rate.

A rise in the real exchange rate means a real appreciation and a reduction in the rate is called real depreciation. But globalization consists not only in the exchange of goods and services but also the opening of financial markets. This opening also affects the trade surplus or deficit of countries. If a country is in a trade deficit, it means that a country is buying more from the rest of the world than it sells to them and therefore must borrow from international agencies to balance its accounts. The investment decision of the financial markets will depend on the differential of the interest rate between countries, the political risk and the growth prospects of the regions among other risks. In the following chart, you can see the net inflow of capital at current prices in dollars.

Foreign direct investment, net inflows

Graph 14. Foreign direct investment, net inflows. Data taken from the World Bank


In conclusion, the real rate affects the composition of consumer spending on domestic and foreign goods, although in the first instance it should not affect the total level of consumption. The same can happen with investment, the real exchange rate can influence the decision of companies to buy local or foreign capital, and for the financial markets enter other variables that will decide which is preferred by the investors like the difference of interest rate.

 ©Forex.Analysis
Categories
Forex Education Forex Educational Library

Long run Macroeconomics

Abstract

Long term is what really matters for economists. It is not enough a decade of continuous growth if an economy does not have adequate policies to perpetuate that growth. So, the models in general in macroeconomics are about the long term. As mentioned in other articles, the economy fluctuates permanently along a trend and it is normal to present crisis in certain periods of time. But to ensure production growth constantly over time, government policies must focus on variables such as savings rate, capital accumulation, human capital development among others that offer the ability to maintain stable growth.

In the long term of the economy, the interannual fluctuations of economic activity predominate. When recessions happen, causes consumers to be pessimistic and when the economy is expanding, consumers are optimistic and their behaviors demonstrate. But if you look to the past in long periods of time the panorama changes, and fluctuations are not important but the long-term growth is. What matters, in the long run, is the historical aggregate production, so the objective of this branch of macroeconomics is to determine which factors affect long-term growth, why some countries grow more than others and why there are more inequalities between countries. In the following graph, you can see the growth of some countries.

GDP PER CAPITA

Graph 1 GDP PER CAPITA. Data taken from the World Bank.

The reason why growth is important is that this determines the standard of living and determines whether it has improved this in time. Because of this, what matters to macroeconomics is not only aggregate production but production per person as this approximates each person’s standard of living. Economists do not ignore the fact of inequality, but studies and models try to approach reality so it is necessary to have these variables that even though they are not entirely true, they approximate to reality. At this point, there are several variables that try to measure the quality of life of people as their consumption, necessities unmet, among others, which measure the overall well-being

When you compare production per person you should adjust by purchasing power parity, in other words, the prices are adjusted in real terms to be able to compare a basket of goods that can be bought in each country, otherwise, these indicators would be affected by exchange rates. One of the great conclusions that can be seen after seeing the growth of different countries is that in general welfare in all countries has increased and in some countries, growths have converged at similar rates, but there are others in which the Growth seems to have stagnated as in Africa and some countries in South America

To analyze growth in countries, economists have used long-term models, initiated by Robert Solow at the beginning of 1950. The models consider aggregate production and try to have variables that affect production such as capital and workers in an economy. The way in which these two factors are related to the models is affected by technology, as an economy with a higher technology will be more efficient with the factors it has and thus will reach greater aggregate production. With such simplified models, graphics are very similar to reality, and it is also concluded that growth rates stop increasing in certain periods of time and by the characteristic of declining yields. What indicates declining yields of the factors is that the larger the accumulation of these factors, they cease to be so productive because the economy is saturated with these and are no longer as necessary as in the beginning.

With these concepts clear it is valid to ask yourself the question why an economy grows and which factors promote the growth. With long-term macroeconomic models, it is concluded that increases in worker output are due to increases in capital per worker, technological improvements or more skilled workers. The education is a very interesting explanation because it explains the great growth after the Second World War as technological innovations made production more efficient in all countries and the knowledge of people also had an expansion during this period. In conclusion, what determines long-term production is the relationship between production and capital as the amount of capital determines production. In graph 2, the gross capital formation is a variable of physical capital.

Gross capital formation

Graph 2 Gross capital formation. Data taken from the World Bank

Another important aspect of the long-term growth of economies is the saving rate of each economy. It has been seen in data that the most saving economies grow more in the long run and an example of this are the Asian economies that have high savings rates and thus grow more than the average of countries. Similarly, technological progress helps to grow constantly more than in the past. But here arises another concern, what determines the rate of technological progress? The answer is the projects that are carried out in an economy and the way the economy is organized, its rules and the institutions.

Governments can influence the saving rate in various ways. In the first place, they can change public savings, in other words, to have a surplus in the government budget. Moreover, governments can use taxes to influence private savings, for example, they can grant tax privileges to people who save to make more beneficial the saving. But at this point arises a problem and is that consumption suffers when there are higher rates of savings and the desire of an economy that grows is that people consume more so there should be a limit on savings rates because an economy with excessively high rates is also not ideal for economists. But if you take an economy with zero savings to invest in capital, the economy will have zero capital and consumption will also have the same value, so it is better than the saving rate is positive but not excessive as consumption will also be null and that is not the ideal of the economy. In graph 3, a gross saving rate can be observed in which the most developed countries are the ones with the highest savings rates.

Gross savings

Graph 3 Gross savings. Data taken from the World Bank

There is empirical evidence that most countries are below the optimum savings level and are therefore below their optimal capital level and their consumption is not the maximum they could get. But the savings rates that are considered in these initial models are only used to acquire physical capital, but as mentioned previously, economies have another capital that is also very important which is human capital. An economy that has many skilled workers will be much more productive than another that does not have the same types of workers. Human capital has increased as much as physical capital in the last two centuries. It is known that at the beginning of the first Industrial Revolution, 30% of the workers knew how to read and now that percentage is located at 95%. Graph 4 shows the difference in the rates of children enrolled in tertiary education.

Gross enrolment ratio

Graph 4 Gross enrolment ratio. Data taken from the World Bank

After having introduced the distinction within the capital of an economy it can be concluded that the level of production of an economy depends on physical capital, human capital, and technology present in an economy. An increase in the physical capital per worker and an increase in the average level of qualifications per worker would lead to an increase in production per worker. A problem is that the population today is so educated and the yields of this are also decreasing the most children now know how to read, write and have the possibility of going to college so it is no longer so representative the education as it was in the last century. Savings also influence human capital as an increase in savings in this capital increases production per worker.

Considering another important variable in long-term growth the technological progress will be exposed. Technological progress helps economic growth at least in the short term because it makes the economy more efficient and allows new objects to be produced at higher speeds. But it is not a permanent effect because after the economy is accustomed to these innovations, its effect on growth disappears. Technological progress reduces the number of workers needed to achieve a certain amount of production, in other words, it allows to produce more without having to increase the factors already exposed.

Technological progress has made great strides throughout history from finding sources of energy to the understanding of the human body. In modern economies, most of the technological progress comes from investment in research and development, which is commonly denoted (R&D). According to some estimates, countries allocate between 3% and 5% of GDP and modern companies allocate large resources to this in order to be at the forefront of the market. For a company to have incentives to invest in research and development there must be clear rules such as proprietary rights and patents that guarantee companies to receive returns on investment in R&D. In Figure 5, the difference in research between countries can be seen.

Researchers in R&D

Graph 5 Researchers in R&D. Data taken from the World Bank.

There is data showing that the recorded growth from 1950 to the present has been generated by the technological process rather than the accumulation of physical capital, but without the latter being negligible for economic growth. Throughout history it has been seen that the poorest countries have less physical capital initially but then converge their growth rates with the most developed because they implement the technological progress of the most advanced countries, in other words, they take advantage of the progress of developed countries and as the technological levels converge, the production per worker is also converging. This is one of the central ideas about technological progress, as the most advanced countries are on the technological frontier and must innovate more, while lagging countries can mimic the technology of the advanced countries and close the gap between them without having to innovate. While this occurs in some countries, not all are able to do so due to inefficient policies and institutions.


©Forex.Academy

Categories
Forex Educational Library

Limitations On Monetary Policy

 Abstract

Macroeconomics currently has different models to analyze how markets behave, which relationship has different indicators and what effect the application of certain policies could have. But the problem with the theory is that it does not consider all the variables that really affect, and a principle of the models is the simplicity and because there are variables that behave differently than would be expected. This mainly occurs with the expectations of people because it is a variable that cannot be controlled and can behave very differently than would be expected.

In the last century, various models have been developed to explain economic behavior, but it is still far from perfection. When central banks see an increase in unemployment, they try to give a stimulus to the economy with the help of the interest rate or with an increase in the amount of money. But when those incentives are considered, the banks use macroeconomic models to see the possible effects of their measures, although there is no perfect model to indicate the real effects. The problem is that in the diversity of models that exist each one shows different magnitudes in the effects of the interventions so that the banks do not know with certainty what can happen in the economy.

Given this uncertainty about the effects of economic policy, some analysts believe that central banks should not intervene so much in the economy to avoid possible unwanted effects. In general terms, central banks should limit themselves to avoiding prolonged recessions, curbing dangerous expansions, and avoiding inflationary pressures. The higher the unemployment or the inflation the measures of the bank should be stronger but neither aspires to a perfect effect since this does not exist.

One of the main reasons why the effects of monetary policy are uncertain is a topic discussed in the article Expectations in the economy. Expectations and their interaction with central bank policies distort the effects of policies, because not only the variables of the present matter but the expectations of the future as well. For a central bank policy to be efficient and have the desired effects their policies must be credible by the agents of the economy to change the expectations of these.

But another problem facing monetary policy apart from the expectations of consumers, investors and other players, is the political interests of the authorities of the countries. Politicians do not always do the best for the economy as they always avoid making difficult decisions and always do what they are represented by votes. Another problem is the alternation in the power of different ideologies that do not allow economic and monetary policies to be lasting over time. All the above is to highlight the limitations of monetary authorities and because despite the development of economic theory it has not been possible to perfect predictions about the effects of monetary policy.

One of the issues that banks should deal with is inflation. Inflation has four costs recognized by economists:

  • An increase in inflation leads to an increase in the nominal interest rate and therefore the cost of opportunity to have money so that people prefer money in the bank and this leads to having to go more often to the bank.
  • Inflation generates fiscal distortions. For example, when a company must pay capital and income taxes if there is a high inflation rate it may end up paying more because of this effect.
  • Inflation variability generates that year after year no one knows exactly what the inflation rate will be affecting certain assets such as bonds.
  • Inflation causes an effect called monetary illusion that causes people to make systematic mistakes because they value different real and nominal purchasing power changes.

But inflation also has positive aspects. The creation of money by banks and which is the cause of inflation is a way in which the state can finance its spending, for example, it is an alternative to borrowing from the public or raise taxes. It is also positive because when an economy is in a recession the central bank can take expansionary measures and thus help the economy. But if the economy has 0 inflation, or it is very low, monetary policy will be hard to implement and therefore it will be difficult to return production to its natural levels by the bank. In many countries, the main objective of central banks is to achieve an inflation rate between a pre-determined range for each bank that is supposed to be good for the economy. In the following graph, you can see the inflation rate of different countries including Venezuela that is having serious problems in its economy.

Inflation, consumer prices

Graph 9. Inflation, consumer prices. Data taken from the World Bank.

Another way aside from the interest rate to control production fluctuations is the fiscal deficit. It is true that the fiscal deficit helps in the negative cycles, but it must also be considered that fiscal deficits have a negative impact on capital accumulation in the long term. For the debt not to advance continuously when there are expansions in the economy it should be intended to have fiscal surpluses to clean up national accounts. Due to the problems generated by an increase in the debt generated by the fiscal deficit, it is important that investors and citizens are monitoring the fiscal deficit of countries as this can end up affecting the growth in the medium and long-term.

As mentioned before the policy plays an important role in the monetary decisions and the course of the economies so that the healthiest thing for the countries would be to limit their interference in the decisions of the Central Bank and other policies aimed at limiting the fiscal deficits because to not lose support a government may be able to borrow beyond what is necessary and healthy by affecting long-term growth where those governments will no longer be.

European Union.

The next part of the article will be based on the monetary integration of Europe and the details of this integration. The decision to adopt a single currency such as the Euro is the most extreme way to set the exchange rate between countries in a region. When the central bank worries about the exchange rate and tries to fix a stable exchange rate there are many problems for the parity to remain so by unifying several countries under a currency these problems are eliminated as losses of reserves, but other problems arise. In the next graphic shows the members current of the European Union.

Top 30 maps and charts that explain the European Union

Graph 10. Buczkowski A. (2017, March 27). Top 30 maps and charts that explain the European Union. Retrieved October 16, 2017, from http://geoawesomeness.com/top-30-maps-charts-explain-european-union/.

The European countries managed to establish a single currency because throughout history they had had some concerns that led them to take this measure. The first factor is the openness of European economies since they are so exposed to trade, so they are also more exposed to fluctuations in the exchange rate than other countries in the world. The greater proportion of exports or imports in national income the economy is more sensitive to changes in the exchange rate. Secondly, Europe has historically great fluctuations that have led to economic crises and conflicts between them. And the last factor determining the monetary union in Europe was the common agricultural market. This market for its operation needed a stable exchange rate so that helped in the decision to unify the currency.

Then introducing the causes of Europe’s monetary union will now discuss how monetary policy is managed. Europe’s monetary policy is managed by the European Central Bank which, together with the central banks of all the Member States of the European Union, constitutes the European system of central banks. This system is independent of other institutions such as national governments. Monetary policy decisions are centralized in the European Central Bank so that European monetary policy is unique, but its application is decentralized in the national central banks who are responsible for carrying out operations of an open market in their countries.

The governing bodies of the European Central Bank are the Governing Council and the Executive Committee. The Governing Council is composed of the six members of the executive committee and the governors of the national central banks of the countries that are part of the eurozone. This body is responsible for monetary policy and sets out the guidelines for its implementation. The council normally meets twice a month on Thursdays. The executive committee implements monetary policy and gives instructions to the national central banks. The governing bodies of the European Central Bank agree on the policy to be implemented by voting and win the decision that has the most votes. The governors of the national central banks have the same weight in the votes regardless of the economic importance of each country.

The basic task of the European Central Bank is to manage the monetary policy of the European Union and the main priority of this policy is the stability of prices. The bank has established that price stability is defined as an inter-annual increase in euro-zone price indices of less than 2% but positive. Due to this, the central bank decides its corrective measures based on the deviations of the expected inflation with respect to the desired path. To achieve the price target, the central bank has two strategies, the first is related to the money supply and consists of announcing the benchmark for the growth of money. The second strategy consists of an economic analysis of different economic indicators such as economic activity, labor costs, financial assets among others and with this analysis are fixed the interest rates.

A major problem facing the central bank when making decisions is the economic fluctuations of each member country of the European Union. The asymmetric economic cycles have their origin in different specializations of each country and that causes asymmetric perturbations since the most developed sectors in each country face different offers and demands. There is evidence that, with the European Union, many regions have reduced the possibility of being affected by asymmetric shocks thanks to economic integration, but this effect has not been seen in all countries.

An important factor that reduced the costs of monetary union is the existence of interregional labor mobility, since if the demand for a product in one country is reduced and the labor force in another increase the labor force can move freely to the country where it has this more developed sector. But despite good labor mobility, some economists argue that Europe is not an optimal monetary union since country governors vote for measures favorable to their respective countries or otherwise the measures end up affecting more a country that is in a recession than a country that is well economically.


©Forex.Academy

Categories
Forex Educational Library

Labor Market and its Implications

Abstract

One of the aspects that matter most to people about economics is the labor market. It is of special interest because much of the population is active in this market, so it is important to analyze how it behaves, which variables are more important to determine wages. In addition, what problems imply some policies that in the first instance try to protect workers, but end up affecting it as it is the minimum wage. Likewise, unions represent certain frictions in the labor market that, consequently, have undesirable negative effects.


The labor market in the economy is one of the most important issues in the economy. To analyze how the job market behaves some concepts must be clear

  • Active population: Sum of people who are working or looking for work.
  • Inactive population: People who do not work and do not seek work.
  • Activity Rate: Active population/working-age population. In Europe, as well as most developed countries the rate of activity has increased over time due to the inclusion in women’s labor market, although this fact does not occur in all countries.
  • Unemployment rate: unemployed/active population. The unemployment rate can reflect two different realities. It can reflect an active labor market where there are large numbers of layoffs, but also of hiring. Or it can reflect a stagnant job market where there is little movement. To find out what is behind the aggregate unemployment rate, workers ‘ movements need to be analyzed and this data can be obtained from quarterly surveys conducted in the countries.

The following charts show the rates of participation of men and women respectively in the labor market

Labor market and its implications

Graph 15. Labor force participation rate, male. Data taken from the World Bank

Labor force participation rate female


Graph 16. Labor force participation rate, female. Data taken from the World Bank.

It’s important to keep in mind that many times the surveys carried out and the numbers given by the media do not reflect the reality, because in some cases people looking for work stop looking because they do not find and take these people as an inactive population and this reduces the unemployment rate which politicians use to say that the economy has a good performance which is not true. So, to have a complete picture of job creation and destruction and to know if it is true the unemployment rate is better to review workers ‘ movement surveys.

The job market like any other market has a price variable, which is the salary. Salaries are determined in many ways, sometimes they are determined by collective bargaining between companies and workers, but these negotiations do not cover all workers. Some negotiations are bilateral between a businessman and a private worker. Although in each country differs in the way wages are adjusted, a theory can be developed to explain how the salaries are determined.

According to economic theory, workers usually receive a higher salary than their reserve salary which is the minimum level at which workers are indifferent between working or not. That is, most people receive a salary that at least encourages them to work. Moreover, salaries depend on the situation of the labor market. When the unemployment rate decreases the wages increase because there are fewer job offers. Even when there is no collective bargaining between employers and workers, workers have some bargaining power that they can use to get better wages than their reserve wages

Some companies can pay higher salaries than others to encourage their employees or attract more skilled workers. In the negotiations the companies consider the costs of hiring an employee, the costs of firing him and how much it would cost him to maintain these. The more expensive it is for a company to replace its workers, it will be willing to pay more to keep them. But this is not the only reason to pay better salaries some companies want their workers to be more comfortable in their work and have better performance, so they decide to pay salaries that are called efficiency wages.

As previously mentioned the labor market situation also influences wages. When the unemployment rate is low it is harder to find skilled workers, so wages increase. The following charts show the unemployment rate of several countries and the growth of production.

Unemployment rate

Graph 17. Unemployment rate. Data taken from the World Bank


Gross Domestic Product


Graph 18. Gross Domestic Product. Data taken from the World Bank

Now it will be analyzed some variables that affect the wage negotiation. On the one hand, workers do not care about the level of nominal wages, but they do care about real wages as this indicates how many goods can be bought. On the other hand, companies do not care how much the salary they pay, but they care about the relationship between the salary they pay and the price of the goods they sell. As these variables are those that come into the decisions of the agents, this article must analyze what happens when they change. For example, if the price level increases in a certain proportion, workers will ask for an increase of at least the magnitude of the price increase as their purchasing power is reduced. Companies will be willing to increase maximum wages in the magnitude that increased the prices. But the decision to set wages will depend primarily on the bargaining power of each agent

Given the above, the existence of trade unions are important as they have more bargaining power than people individually. If there are unions, they will ask that the wage increase be at least the magnitude of the inflation. But if companies are the ones with the decision-making power, they will make the decision to raise wages less than inflation, as they earn a higher income by having better sales margins. Likewise, the existence of a minimum wage or unemployment insurance would alter the labor market.

If there is unemployment insurance in an economy, people will have a higher reserve salary because when they are unemployed they will have an income for a certain amount of time, so it will be harder for them to work for a low salary. This gives a little bit of bargaining power to the workers because if they don’t feel motivated by a company they will decide to quit and be unemployed for a while until they find a job that motivates them enough. Efficiency wages will also have to be higher because it is not so expensive to be unemployed for people.

Another variable affecting wage fixing is the existence of a minimum wage or protection of workers as it may be in some cases that the minimum wage is higher than the reserve salary of the people so that it will be positive for the workers but for companies will be a contracting barrier and in some cases it can increase the unemployment rate in the countries because if the minimum wage level is above the productivity of the workers and is greater than their reserve salary will be very expensive for companies to hire and decide to hire less or use machines that lower their production.

Now it will analyze the aggregate supply of goods and their relationship with the labor market. An increase in production causes an increase in employment. The increase in employment causes a decrease in unemployment and therefore in the unemployment rate, which causes nominal wages to rise as well since it is more difficult for companies to replace their workers. The rise in nominal wages causes prices to rise on the part of companies. These effects also affect the agent’s expectations if prices are expected to increase in a certain proportion in the future in the negotiations, the salary will be asked to increase in the same way.

In the demand when there is an increase in the price level this causes a reduction in production as it decreases the real quantity of the amount of money which leads to an increase in the interest rate which in turn leads to a decrease in the demand for goods and services. Production depends negatively on taxes and positively on the real amount of money in the economy and on public spending.

In some situations, in the short term, production is higher than the natural level of the economy, that is, the economy is producing beyond its capabilities. When this happens, the price level increases which leads to higher expected inflation and this ends up impacting wage negotiations. The above effect concludes with a decrease in the real amount of money which generates an increase in the nominal interest rate and this reduces the levels of production taking it to its natural level. It is normal that in the short term the growth of production is above or below the natural level, but in the long term, these imbalances are eliminated.

After analyzing the aggregate demand, the short and medium-term effects of an expansionary monetary policy will be analyzed. In principle, when a central bank emits more money to the economy, the amount of real money increases and therefore production does so in the short term. This leads to an increase in the price level which affects the price expectations. The effect of monetary expansion dissipates when production returns to its natural level thanks to the fact that price expectations adjust to this new scenario leading to higher wages in the short term.

On the other hand, inflation also affects the supply and aggregate demand for goods. An increase in expected inflation causes an increase in effective inflation since there are several channels of transmission of these expectations. A channel is the negotiation of contracts because if they expect a higher price level in the future they will set higher nominal wages, which in effect leads to higher prices in the future. Inflation is also related to unemployment since when there is an increase in the unemployment rate this causes a decrease in inflation. This occurs because an increase in unemployment causes a reduction in nominal wages, which directly leads to a reduction in the price level.

In conclusion, the labor market is very important for people because they are constantly involved in it. In some countries, there are rigidities in this market that end up affecting the whole economy as we saw in this article because it ends up affecting inflation and production. Unemployment insurance, a high degree of employee protection, forms of wage negotiations and the minimum wage are some of the rigidities that the labor market faces. When the inflation rate reaches a high level, inflation tends to be more variable and consequently, the agents of the economy are more reluctant to sign long-term contracts that are not flexible. That is why salary negotiations are done every year or even for shorter periods of time.

In the medium term, the growth of production is equal to the normal rate of growth, unemployment is equal to its natural rate and both variables are independent of the growth of the nominal amount of money. The growth of the nominal amount of money only affects inflation. That is, inflation is always a purely monetary phenomenon since, in the presence of other factors such as monopolies, unions, and strikes, fiscal deficits do not affect inflation unless they affect the nominal amount of money.


©Forex.Academy

Categories
Forex Educational Library

Expectations about the Economy

Abstract

There are a great many intertwining variables that influence the current state of the economy at any given time; such as unemployment, wages, internal production, investments and many more. But with all of them, it is the expectations of people, and investors that generate certain effects, that explain the behavior of some of these variables and which will affect future conditions. For example, if people expect future interest rates to be higher, they will consume or ask for more loans in the present because in the future it will be more expensive to consume. But without rising interest rates, consumption varies today due to expectations. Another example is the expected interest rates in a country, depending on these expectations the investors decided where to place their capital without waiting for this to happen.

The economy in its short-and long-term models must consider the expectations of consumers, companies and all representative agents within an economy. To consider the subject of expectations first the interest rate variable must be introduced. Interest rates expressed in units of a national currency are referred to as nominal interest rates and these rates appear in newspapers and financial pages. Interest rates expressed in a basket of goods are called the real interest rate and are called that because it is beyond inflation and reflects the cost of acquiring goods that will be consumed by people, what is truly important.

There is an equation that establishes that the real interest rate equals (approximately) the nominal interest rate minus the expected inflation. That is why in some media, although they mention a decrease of the interest rates it is said that the interest rate is still contractionary or it may be that the nominal is lower one year than another, but that does not indicate that loans are cheaper than the previous year, so you should consider real interest rates. The interest rate directly affected by the monetary policy is the nominal interest rate. The interest rate that affects spending and production is the real interest rate. Given this difference, it will be possible to see in the news that they contradict the potential effects of monetary policy on the economy and financial markets. In the following graph, you can see the real interest rate of some countries.

Graph 6 Real Interest Rate. Data taken from the World Bank.

To summarize the issue of interest rates it should be clarified that the nominal interest rate indicates how many euros must be returned in the future to obtain a euro today and the real interest rate tells us how many goods must be returned in the future to obtain a good today. Nominal interest rates will affect investment decisions between bonds, stocks, and money, while the real interest rate will affect project investment decisions. In the short term, an increase in the growth of money leads to a decrease in both nominal interest rates and the real rate, in the medium term, an increase in the growth of money will not affect the real interest rate, but if it raises the nominal interest rate.

The bonds issued by a country are differentiated in two aspects: their risk of default and the time of their pay. There are some bonds that have better coupons than others, which are riskier by defaults and that ends up affecting the price of bonuses. But for economic purposes, this part of the article will focus on the bond term. Bonds with different times of paid have different prices and different interest rates that will be called yields. The yields of short-term bonds, usually a year or less, are termed short-term yields and, if the bonds are more than one year, they are called long-term yields.

The interesting thing about analyzing the bonds is to determine the curve of the yields and the relationship between short-term and long-term rates. The price of a one-year bond varies inversely with the nominal interest rate at one year that is in effect at the present. The price of a two-year bond depends both on the interest rate to a current year at the present, as well as the expected interest rate for the following year. The interesting thing about analyzing bond prices is that bond yields contain the same information about future interest rates as the bond yield curve fully reflects the agents ‘ expectations of the economy of a Country.

To begin the analysis, a term performance must be defined; The term yield of a bond to N years, or in other words the N years interest rate is the constant annual rate that makes the current price of the bond equal to the current value of the future interests generated by this. By examining the yields of the bonds at different times, we can deduce the expectations of the financial markets on future short-term interest rates. For example, if you want to see the expectations of the financial markets in one year you should observe two-year bonds which have included expectations about the interest rate that will be at the end of the year and observe bonds to a year of maturation.

When the yield curve has a positive slope is when long-term interest rates are higher than the short-term, financial markets expect short-term interest rates to increase in the future. When the yield curve has a negative slope long-term interest rates are lower than those of the short-term, but markets expect this situation to change and short-term interest rates fall in the future. To observe market expectations during the crises of 2000, 2007 and others, it is interesting to observe the curves of the bonds of the countries that reflect the expectations of the financial markets and the decisions that were expected to be taken by the banks Central. It is important to note that the interpretation of performance curves only focuses on expectations and in most cases the decisions of banks and market agents are unpredictable. In the following two graphs you can see the bonus yield curve. In the first graph, you can see a bond of Colombia and in the second is the types of curves of yields.

Graph 7.   Curva de Rentabilidad TES Tasa Fija 

Graph 8. Roca E.  Estrategias con bonos

Leaving the issue of bonds aside, the behavior and expectations of consumers and businesses will now be analyzed. These two market agents always respond to their expectations about the future. In economic models, you have a consumer who is extremely far-sighted about the future so consumers will always be thinking about what affects their consumption in the following periods. While not all consumers are like that, in reality, it is a simplification that helps to understand the formation of expectations and how they would respond to an external shock.

To understand consumption decisions, it is essential to take an intertemporal perspective because what a consumer spends and borrows today will impact their future consumption. It is assumed that individuals are rational but in the models, it is assumed that the individuals are identical to simplify the models. According to the theoretical models, consumers are very sensitive to variations in income. An explanation of this is that credit is not available to the whole population so if income disappears or decreases it will have an immediate effect on consumption as there would be liquidity restrictions. Or in another example, before the tax rate reduction is announced soon, consumers can anticipate a future increase in their income because consumption will increase at the present. These effects on consumption depend a lot on the type of agents that there are because in some countries there are more wealthy people and they do not have liquidity restrictions when compared with another country where much of the population have problems to access to credit or income is very low.

Consumption probably varies more than the current income. For example, if you have the expectations that the decrease in your income is permanent your consumption will fall in the same proportion. But if the consumer believes that the effect is transient, they will adjust their consumption less. In a recession, consumption does not adjust to the same magnitude in which the income decreases because when a rational consumer knows that it is a temporary shock and the economy will end up retaking its natural level of production. The same happens during the expansions since the rent can increase but it is not proportional to the increase of consumption because it is a momentary shock.

It should be considered that consumption probably varies, although the current income does not vary. Presidential elections, changes in Congress, or changes in people’s expectations of the performance of the economy or international relations can affect consumption without the income being affected. Even some recessions are exacerbated by people’s expectations of a crisis greater than that which exists

It will now be analyzed how companies make their decisions depending on the expectations they have. As mentioned earlier in this article investment decisions by companies depend on the real interest rate differently from the way people do in considering the nominal interest rate. Corporate decisions also depend on household consumption, sales, and expectations. A company when it is going to invest in machinery and capital to develop its activities more efficiently must make a comparison. The companies must first calculate the expected value of the benefits that the acquisition of that machinery would bring, and then compare this to the costs incurred in buying that machine.

In short, if the company believes in its expectations that the benefits in the future will be greater than the costs of its investment, then it will decide to invest. The higher the actual and expected real interest rate, the lower the expected value of benefits and this will reduce the investment the company makes. The sum of the real interest rate and depreciation is called the cost of capital use and they have adversely affected the investment decision of the companies.

If a company experiences an increase in sales that is believed to be permanent, the expected value of the benefits will also increase what will lead to an increase in investment. But it’s similar to what happens to consumption, the investment does not respond in the same magnitude as sales as the investment is not continuous as can be the consumption. Once a new technology has been implemented, the company has no incentive to continue investing beyond a certain equilibrium point. That is why it can be concluded that investment is much more volatile than consumption, although they respond in the same way to external factors such as recessions and economic booms.

If monetary expansion leads financial investors, businesses, and consumers to revise their expectations of future interest rates and future production, monetary expansion has an influence on economic output, but if the expectations do not change, central banks will not have good tools to affect production as they have small effects on the economy. If a change in monetary policy does not surprise the agents of the economy, expectations will not change and production along with other variables are not affected. The effects can be deeper or not in expectations, but it does not mean that expectations are random and erratic. Economists assume that there are rational expectations in their models and on this basis monetary policies are formulated.

 ©Forex.Academy