
Introduction
In any economy, demand is one of the primary leading indicators of economic growth and inflation. Therefore, the aggregate demand data plays a vital role in predicting economic growth and possible monetary and fiscal policies. Although considered a lagging indicator, the data on new home sales provides insight into households’ changing demand and their income situation.
Understanding New Home Sales
As the name suggests, new home sales provide data on the newly built single-family that were sold or are for sale during a given period. New home sales data is also referred to as new residential sales. Sales mean that a deposit for the house has been taken or a sales agreement has been signed.
The data on new home sales is derived from a survey of a sample of houses from the building permits register. Since the data obtained is from a sample survey, it is bound to be subject to sampling variability as well as non-sampling error. Response bias, nonreporting, and under-coverage factors also influence this data. Nonetheless, the data is nationally representative.
The new home sales report shows data for the new privately-owned houses and new houses by construction stage. The report presents data that are both seasonally adjusted and those not seasonally adjusted.
- The number of units sold during the period
- The number of units for sale at the end of that period
- The ratio between the houses sold and those for sale
- The median and average sale price
How to use New Home Sales Data for Analysis
Although the new home sales data is generally regarded as a lagging economic indicator of demand in real estate, there is no dispute that broader macroeconomic trends influence new home sales. Here are some of the factors that influence new home sales.
Household income: Significant changes in the households’ disposable income will change their demand for new homes. Disposable income is the residual amount after paying taxes. These income changes could be brought about by an increase in wages, reduction in taxes, or investment windfall. If there is an increase in disposable income, households’ demand for new homes will increase. They could right away purchase already completed units or get into sale agreements for houses ongoing construction. Therefore, new home sales can be expected to increase during the period of increased household income. Conversely, a decrease in disposable income will make households cut back on non-essential expenditure, such as buying new homes. Consequently, new home sales will be expected to decline.
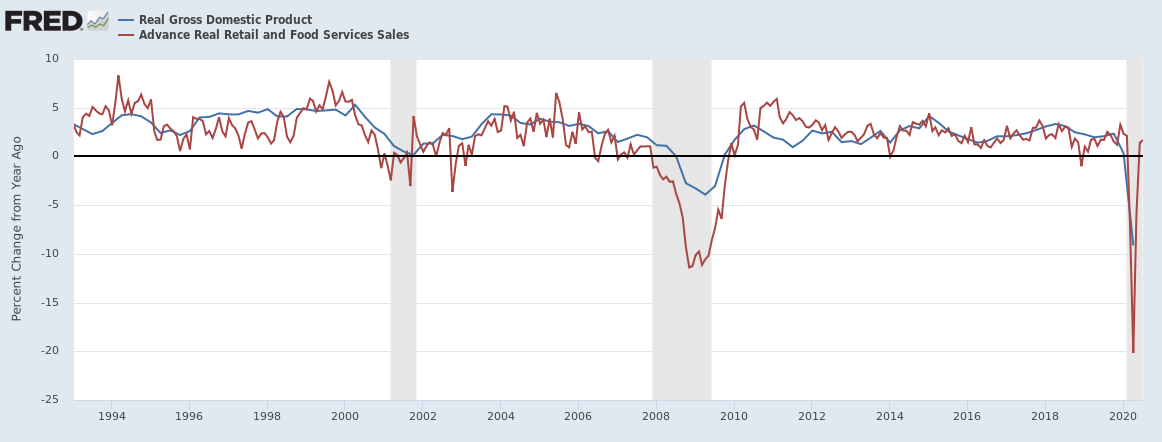
Unemployment: The rate of unemployment in the economy is directly linked to the households’ welfare. A lower unemployment rate implies that more households have income and can thus afford to put down deposits for a new home. Similarly, the unemployment rate reduction signifies that more people can afford to service a mortgage loan. Therefore, a low unemployment rate can be correlated to an increase in the demand for new houses, hence increasing new home sales.
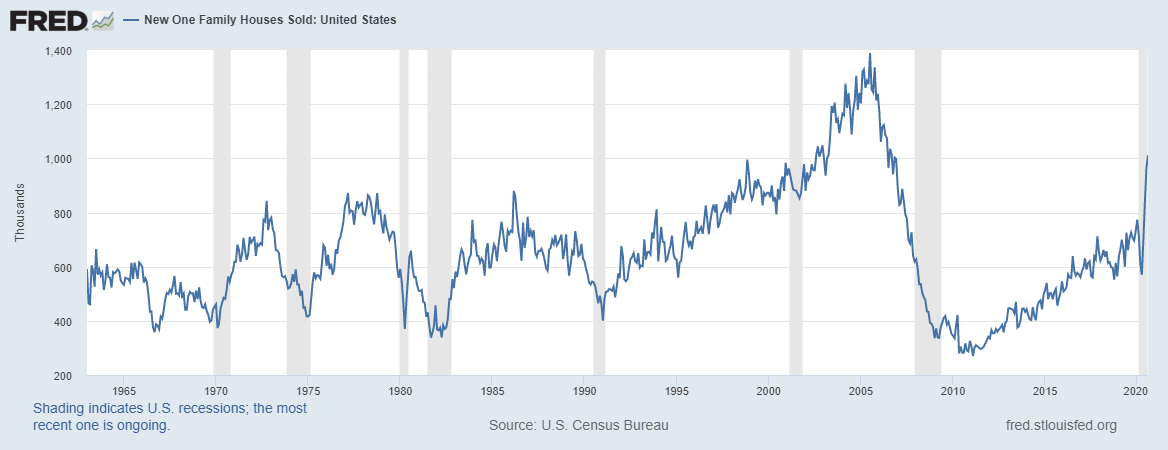
Source: St. Louis FRED
Conversely, higher rates of unemployment mean that more people are out of gainful employment. This instance forces households to prioritize their expenditures to cater to the essential items. Furthermore, higher unemployment could mean that more households do not qualify for a mortgage. Thus, a reduction in the new home sales can be expected with increasing unemployment.
Interest rate: In the financial markets, the prevailing interest rate determines the cost of borrowing – especially home mortgages. When interest rates are low, it means that more households can afford to borrow cheaply. It becomes easier for households to service debt without digging too much into their income, thus ensuring no significant changes in their welfare. Since most households can afford to borrow cheaply when interest rates are low, the demand for new homes can be expected to increase.
When interest rates are high, the cost of borrowing increases, and with it, the cost of a mortgage. Higher rates would restrict some households from servicing expensive debt without significantly impacting their welfare. Thus, with an increasing interest rate, it can be expected that new home sales will decline.
Impact on Currency
The new home sales data can impact a country’s currency in several ways. Here is how.
The new home sales can be used to show economic recoveries. Buyers of new homes could be speculative buyers – those who expect these homes’ prices to increase in the future then resell. To them, to them, new homes are an investment. Thus, the new home sales data can be taken as a sentiment about the economy. An increase in the new home sales could imply that the future economy is expected to improve. Similarly, in times of recessions, like the current coronavirus-inflicted recession, the new home sales data can be used to show market recovery. Therefore, an increase in the new home sales can be seen as a sign of economic recovery, which increases the value of the currency relative to others.
The new home sales can also be used to show when an economy is headed for a recession. Typically, recessions are punctuated with declining economic conditions, such as an increasing unemployment rate. Continually declining new home sales could indicate a looming recession as economic welfare of households is deteriorating. Furthermore, in these circumstances, expansionary monetary and fiscal policies tend to be implemented. These policies are designed to prevent the worst-case scenario from playing out. In the first quarter of 2020, such expansionary policies were witnessed globally. They were meant to prevent extreme economic shocks from the coronavirus pandemic. These policies result in the depreciating of the currency relative to other currencies.
Sources of Data
In the US, for example, the US Census Bureau conducts the survey and publishes the new home sales data for the US. An in-depth and historical review of the US’s new home sales is available at St. Louis FRED. Trading Economics publishes new home sales data for countries globally. Furthermore, you can access the forecast of the new home sales globally up to 2022.
How New Home Sales Data Release Affects Forex Price Charts
The most recent release of the US’s new home sales was on September 24, 2020, at 10.00 AM ET. The news release can be accessed at Investing.com.
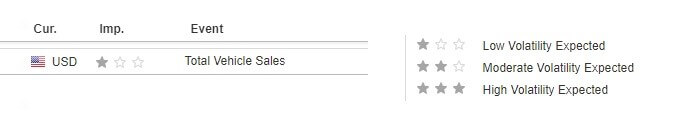
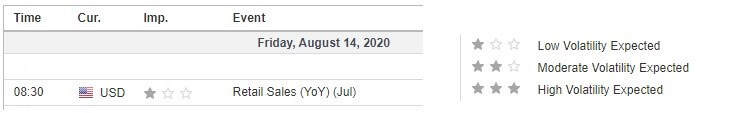
The screengrab below is of the monthly new home sales from Investing.com. On the right, we can see a legend that indicates the level of impact this fundamental indicator has on the USD.
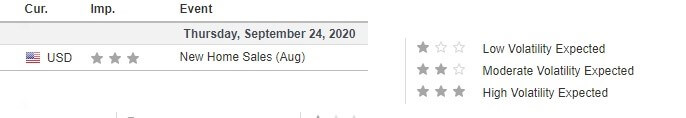
As can be seen, high volatility is to be expected.

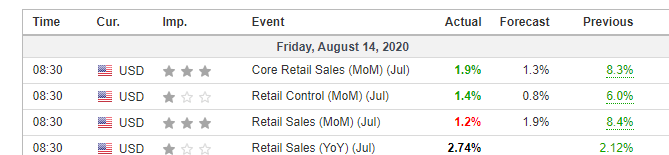
In August 2020, the new home sales were 1011K compared to 965K in July. The sales were higher than the anticipated 895K. Thus, a strong USD is expected.
Now, let’s see how this release made an impact on the Forex price charts.
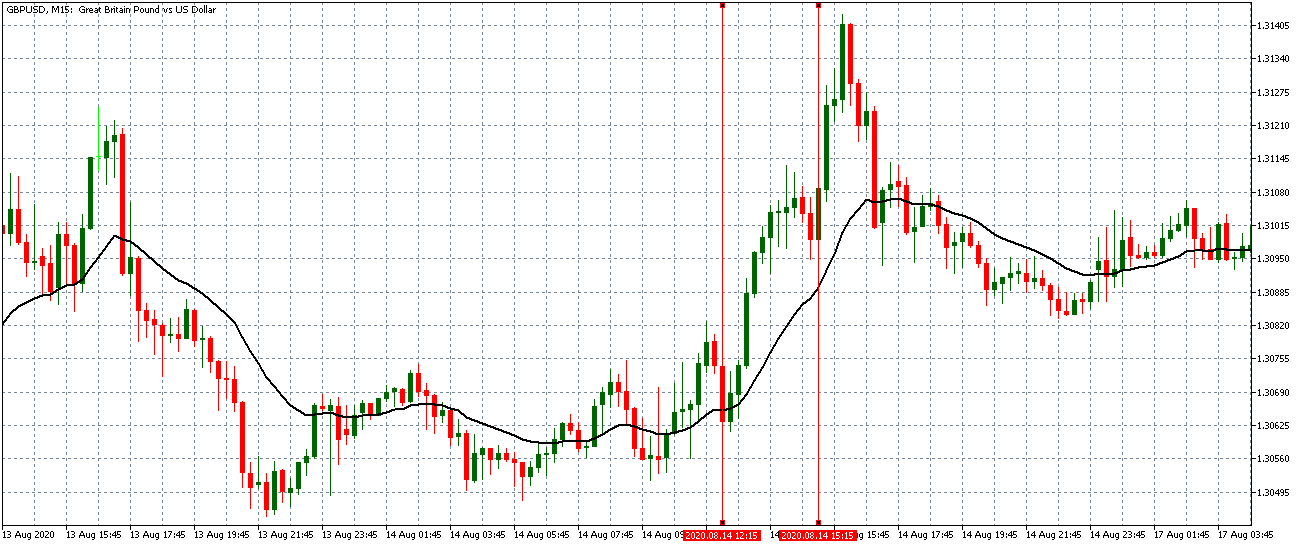
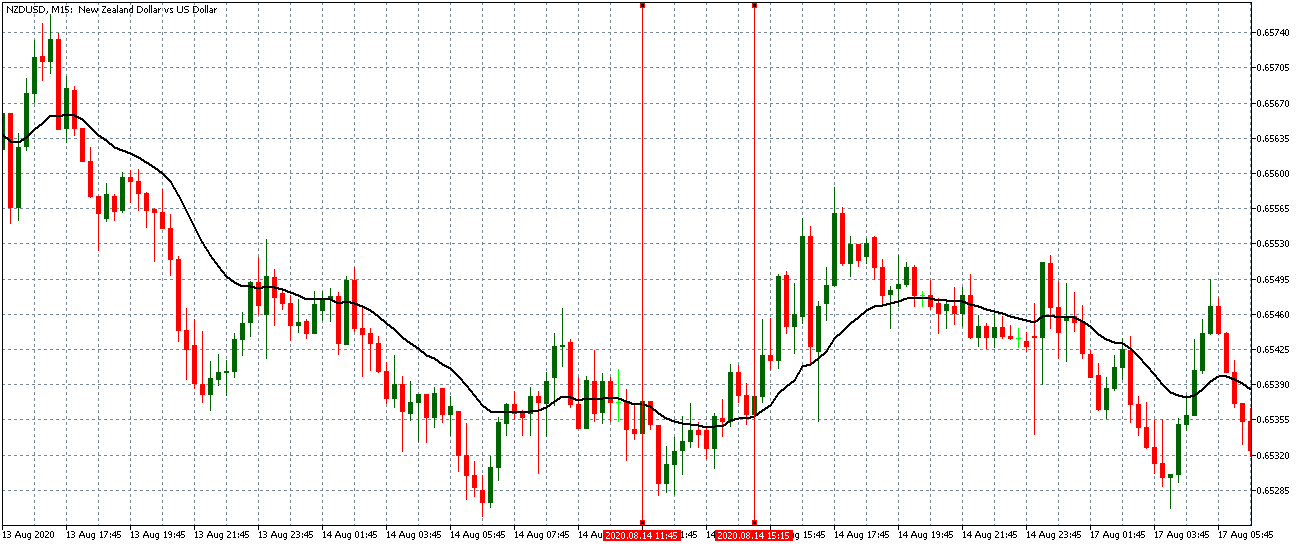
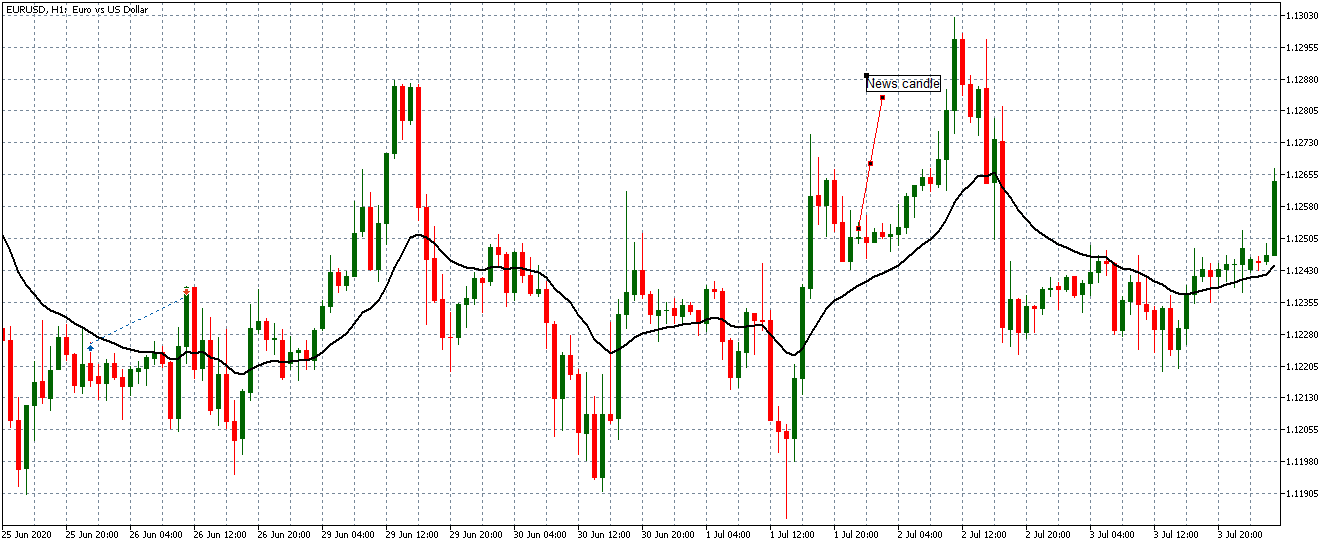
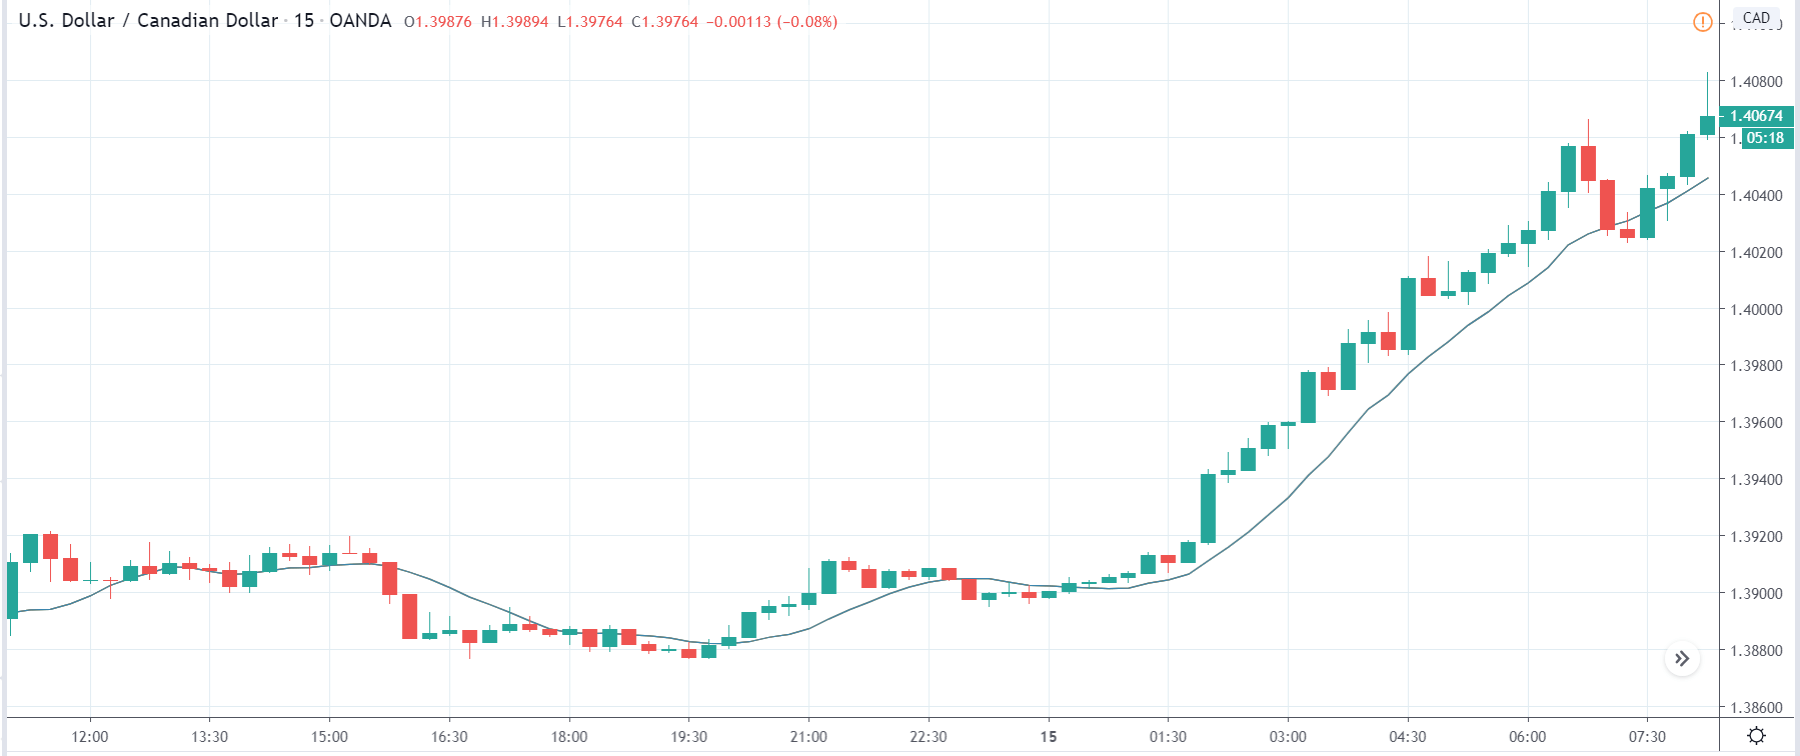
EUR/USD: Before New Home Sales Release on September 24, 2020,
Just Before 10.00 AM ET
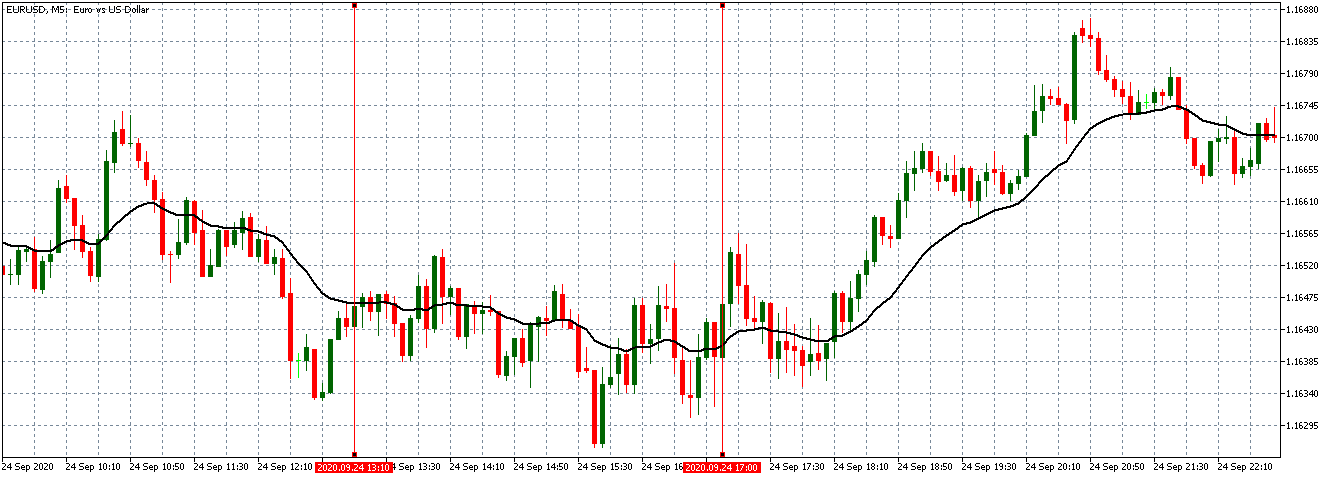
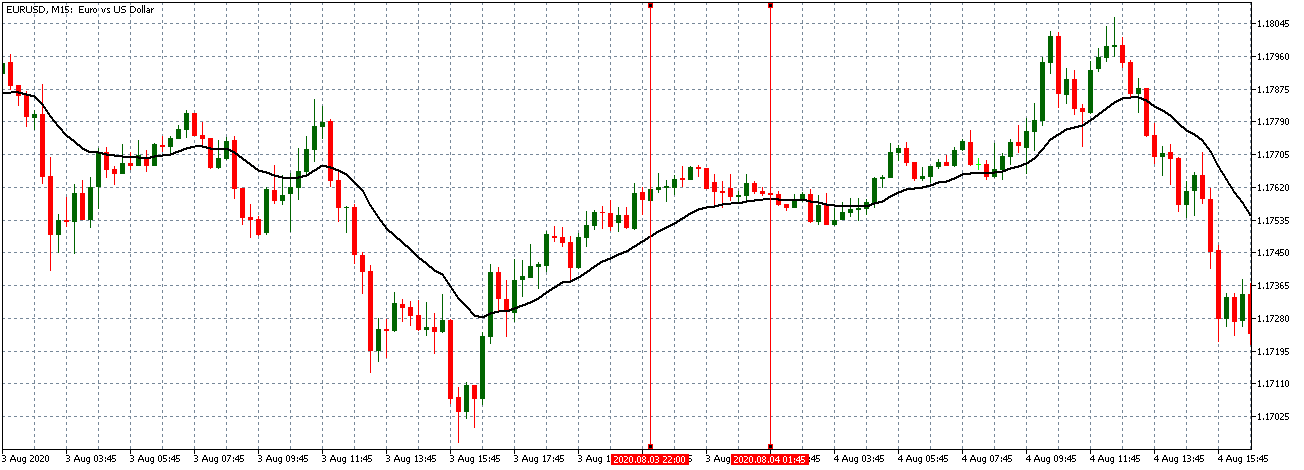
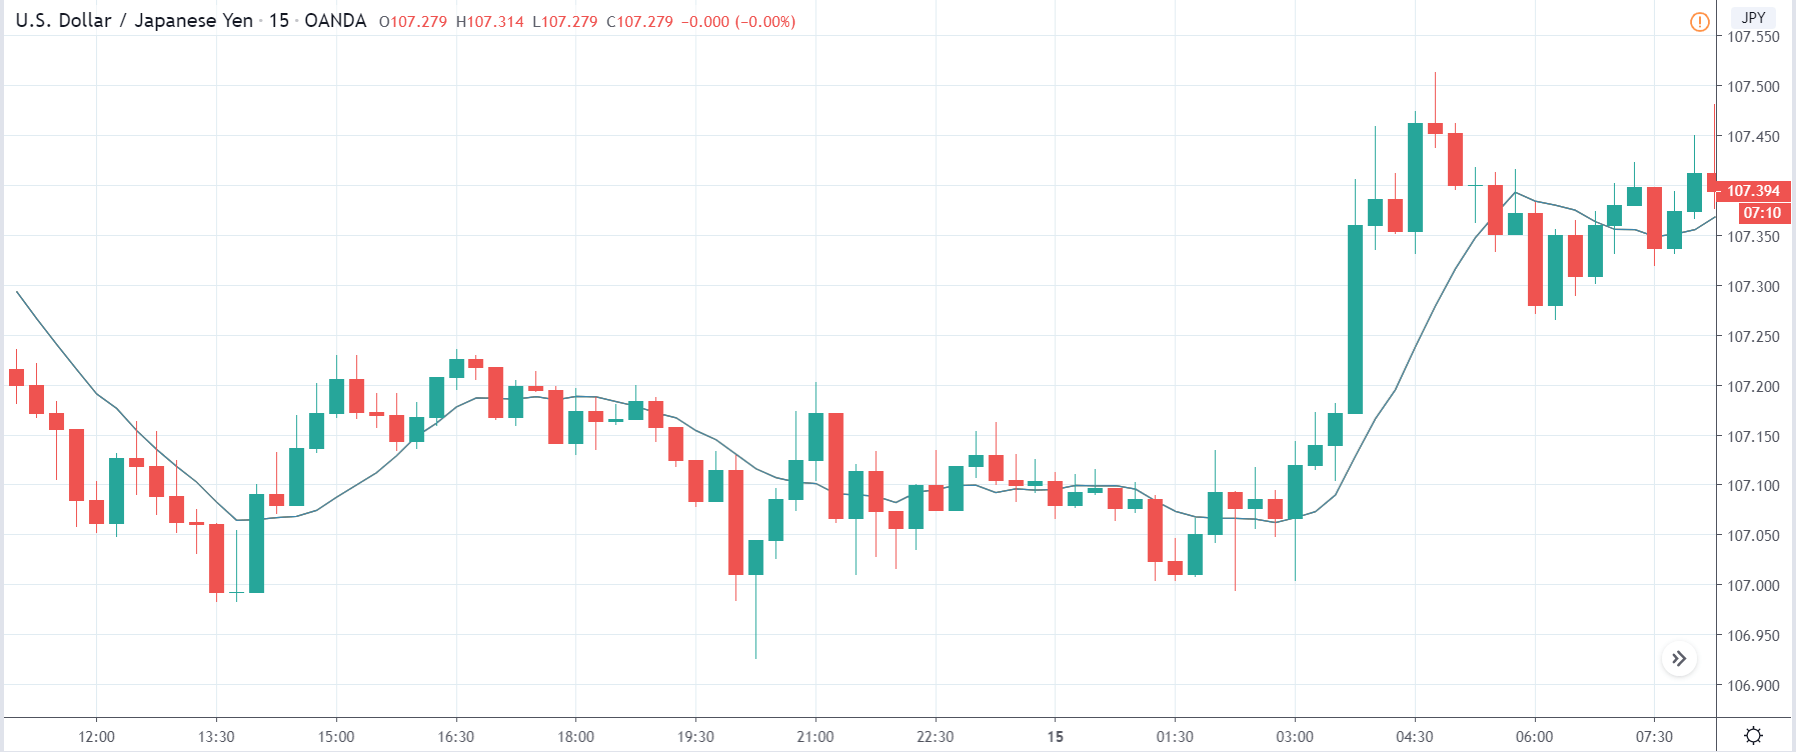
Before the news release, the EUR/USD pair was trading in a neutral pattern as the 5-minute candles formed just around a flattening 20-MA.
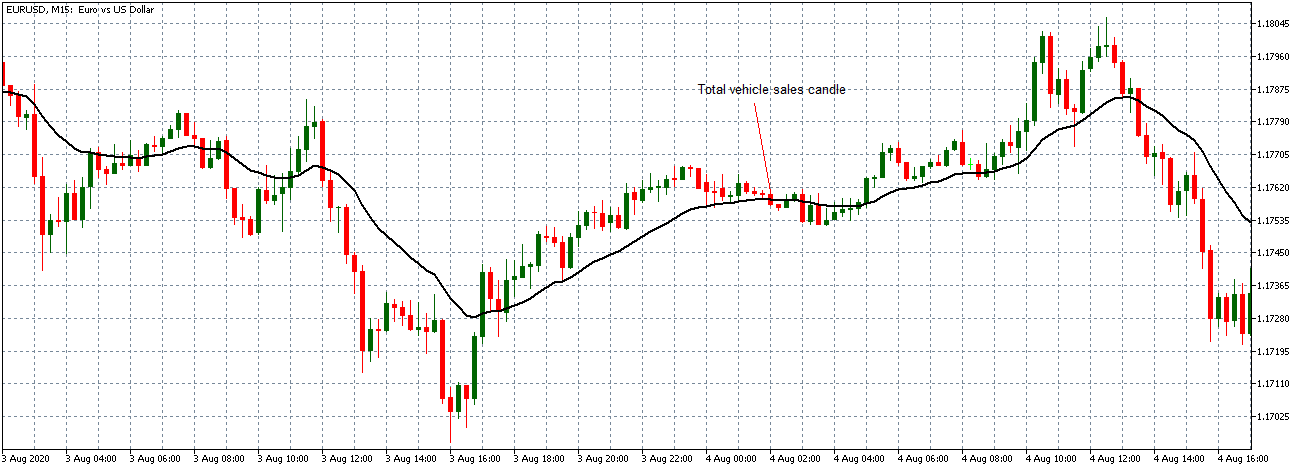
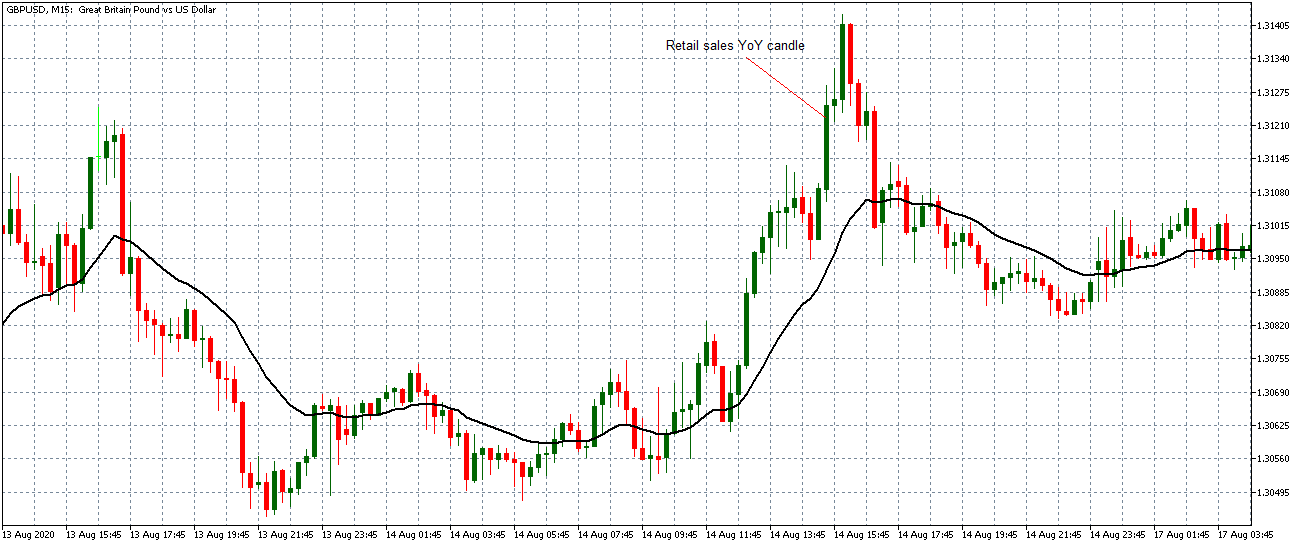
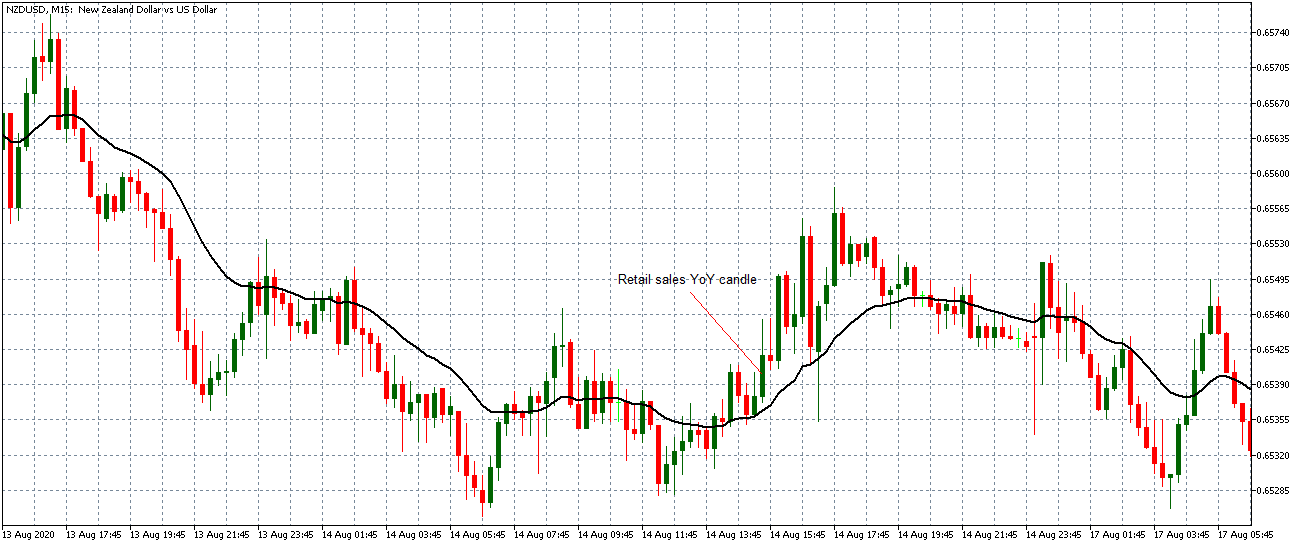
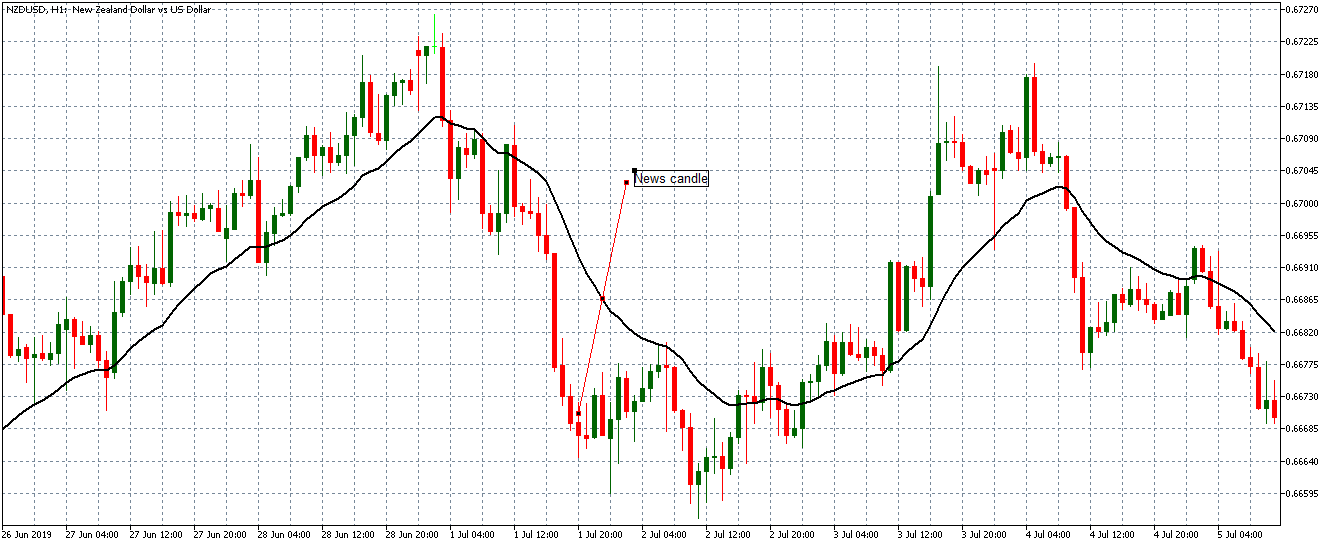
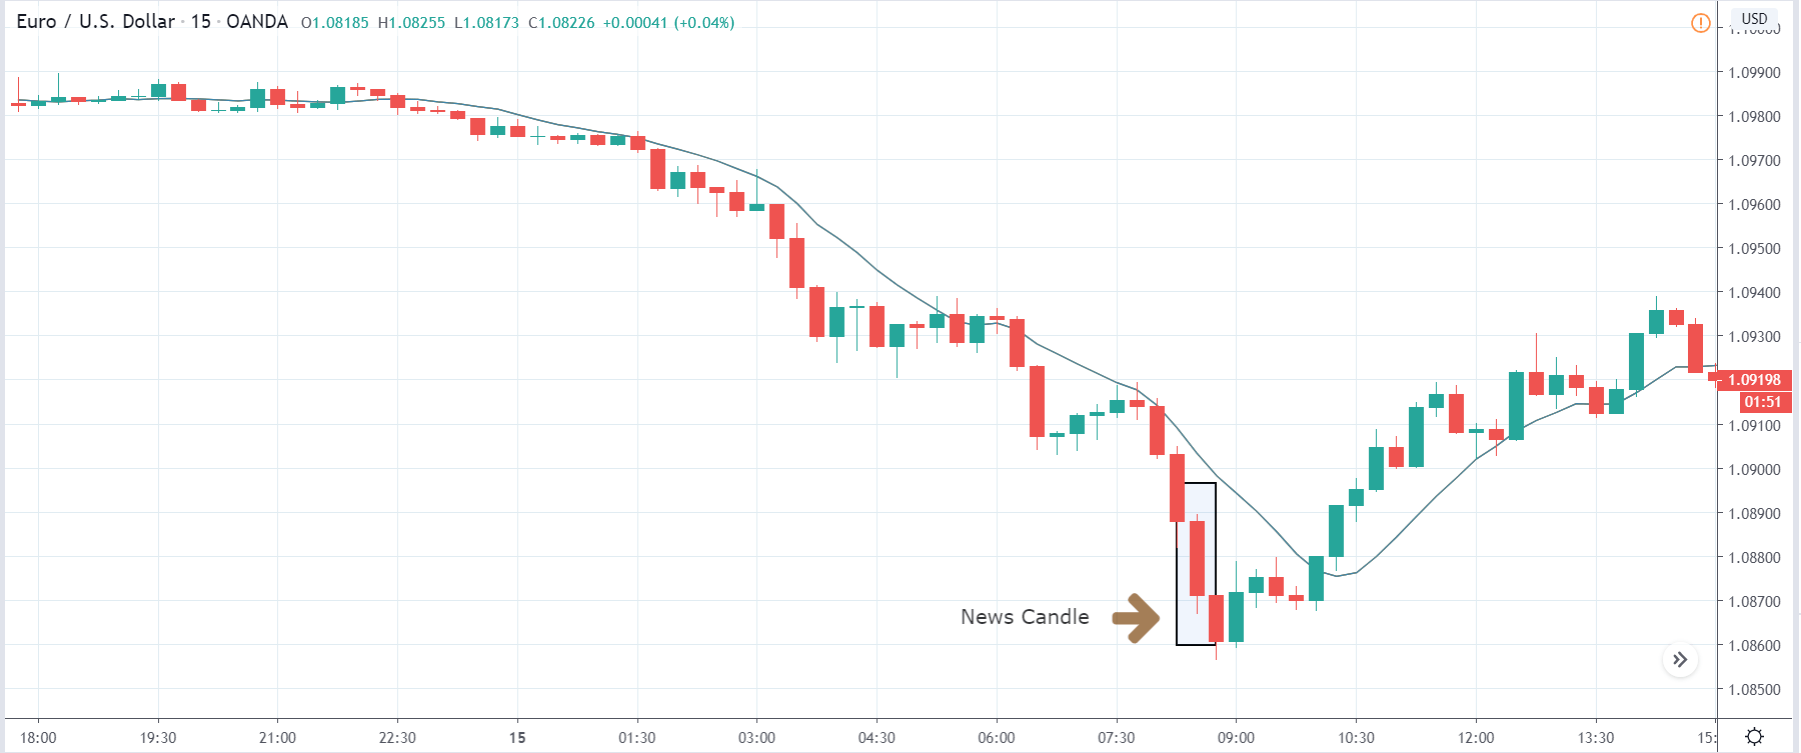
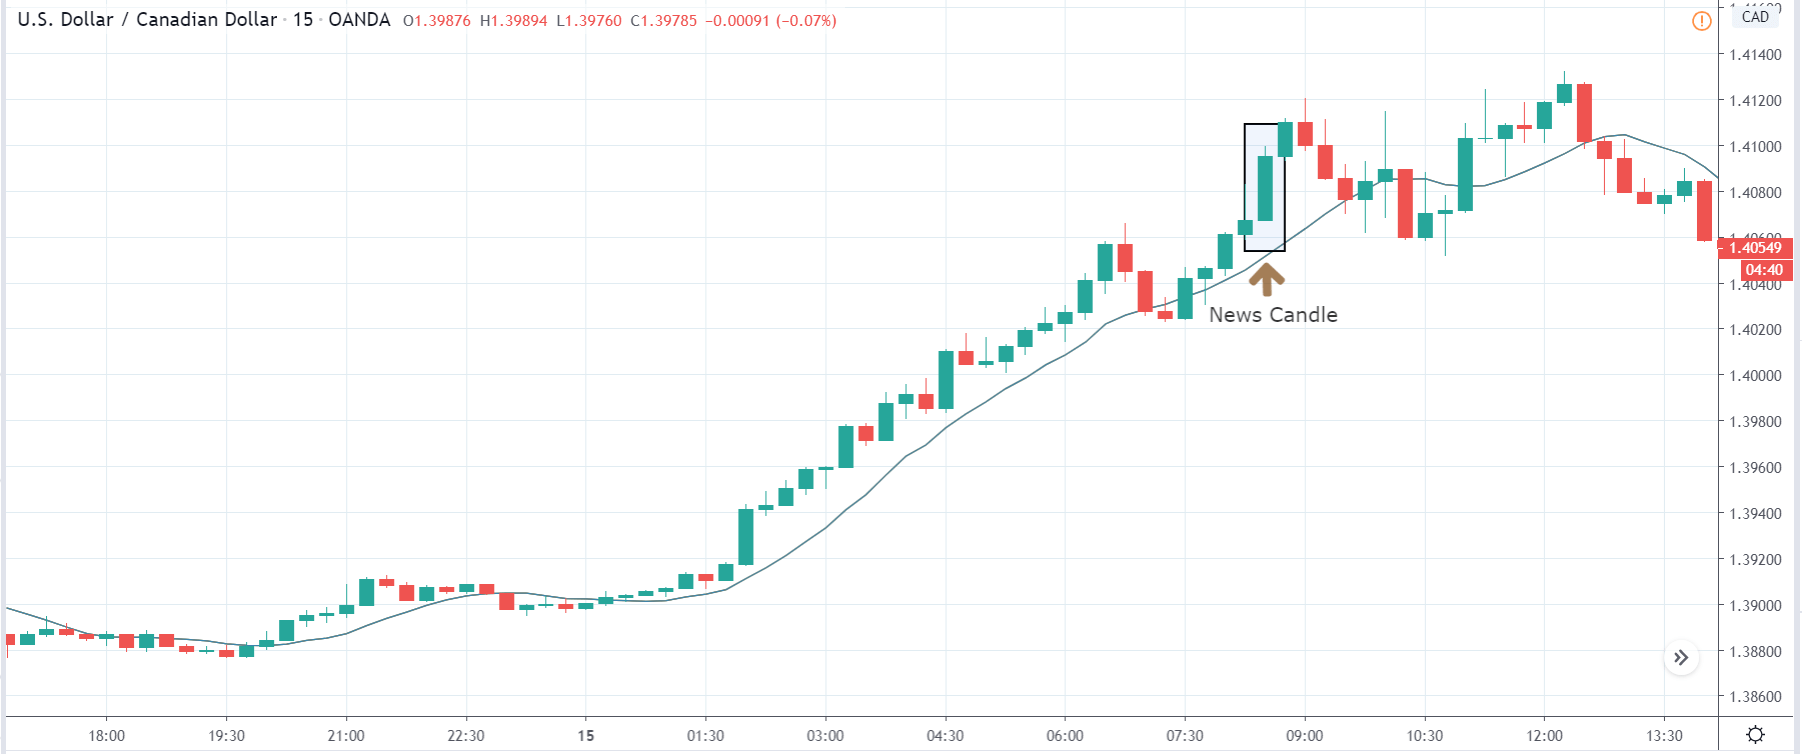
EUR/USD: After New Home Sales Release on September 24, 2020, at 10.00 AM ET
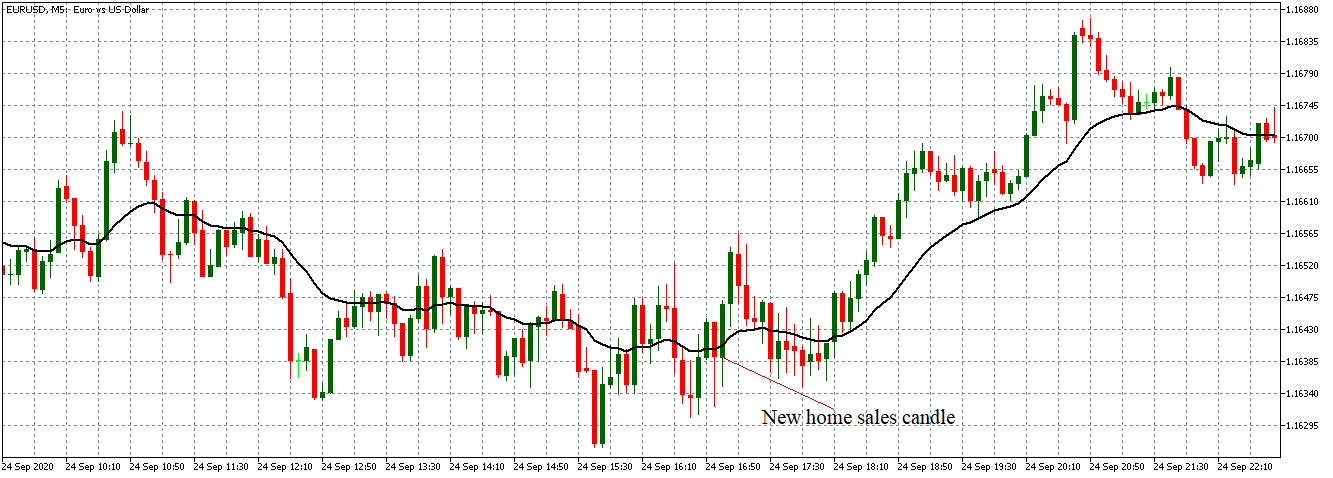
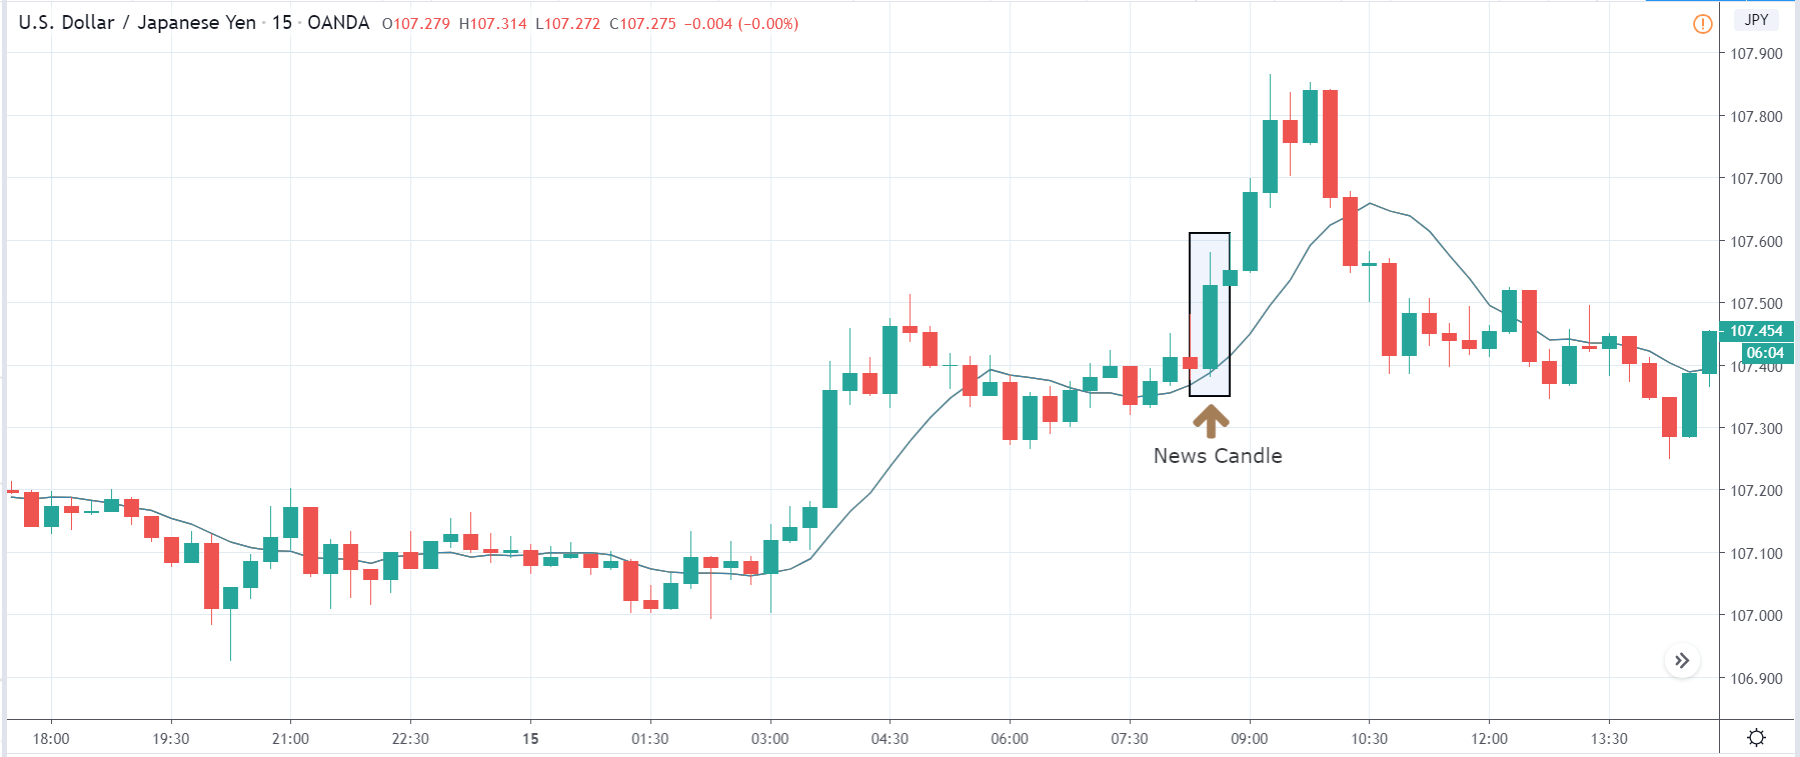
After the news release, the pair formed a 5-minute ‘hammer’ candle, indicating that the USD weakened. Subsequently, the pair adopted a bullish stance with the 20-period MA rising.
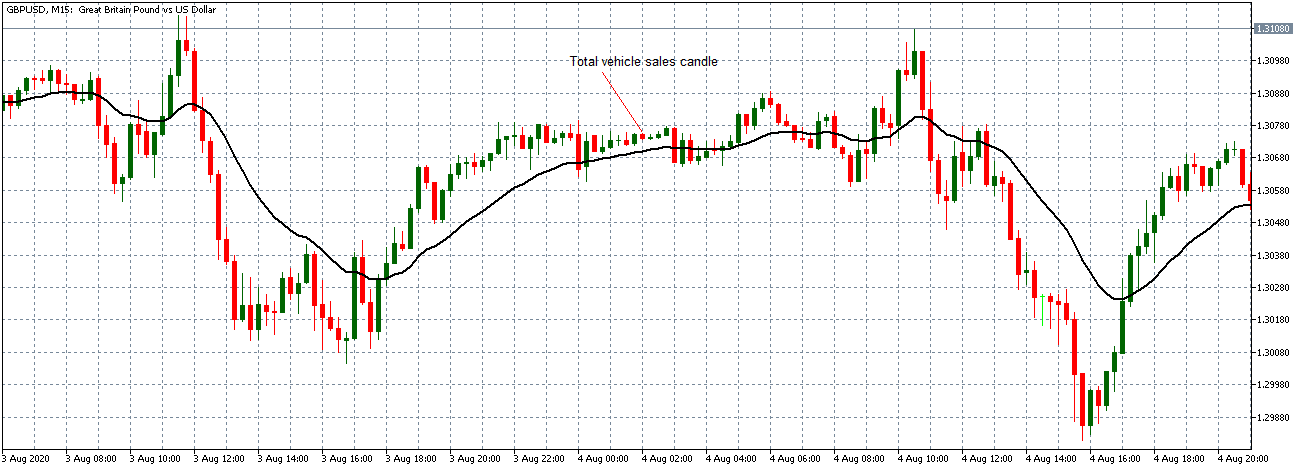
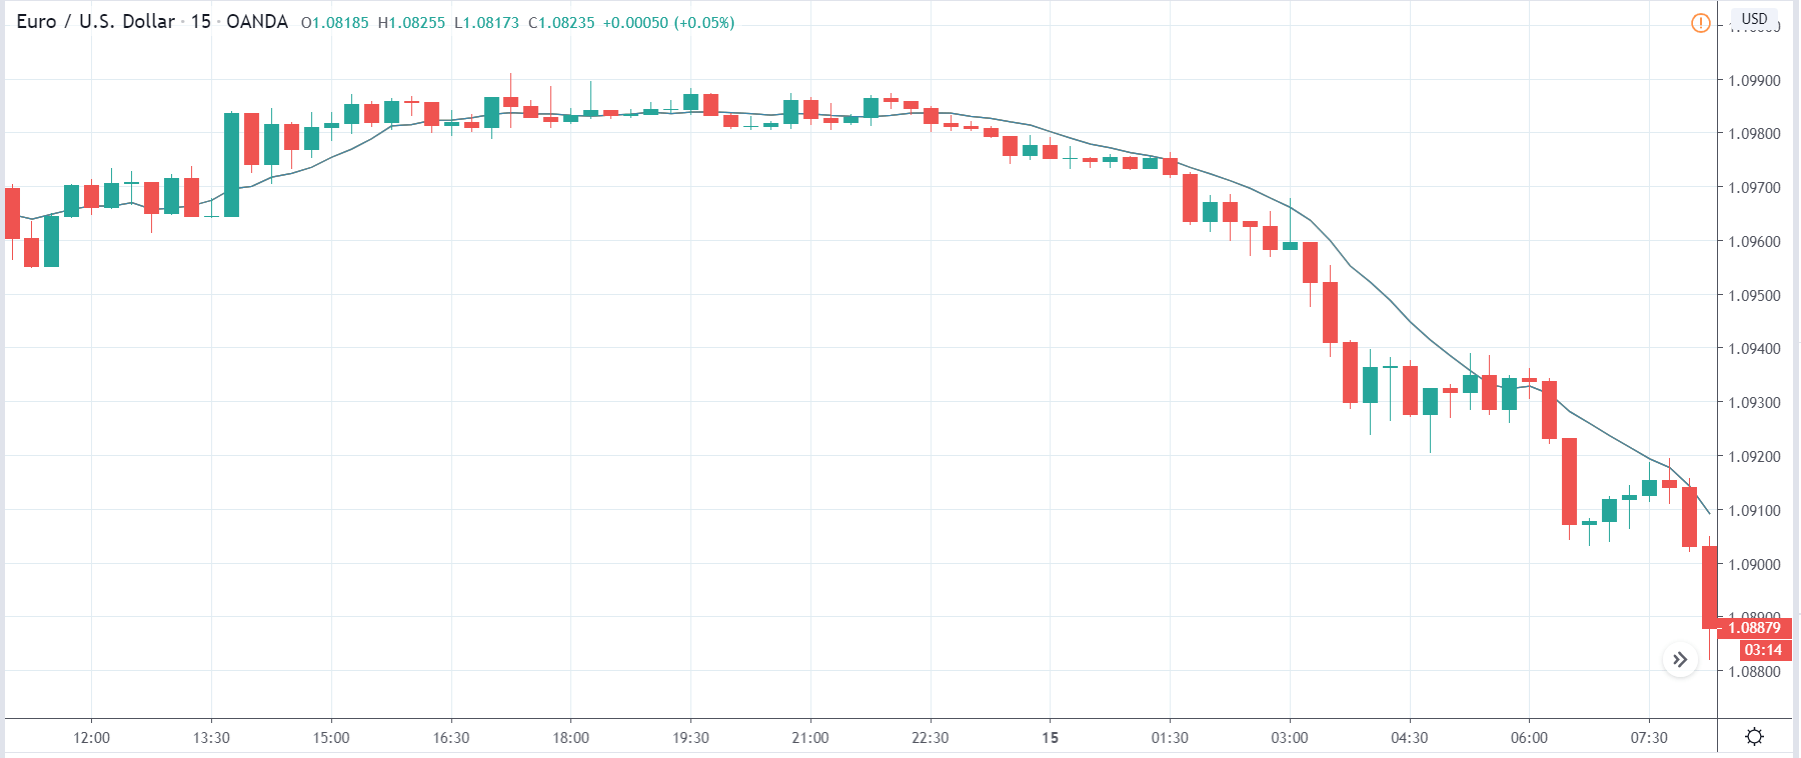
As shown by the above analyses, the US new home sales data release failed to produce significant volatility. Therefore, we can conclude that new home sales are insignificant in the forex market as an economic indicator.


