
Introduction
The computation of gross domestic product takes into account the consumption by households. In the households’ consumption, the retail sales data is considered to be the best leading indicator. Retail sales account for the majority of consumption by households. Retail sales are estimated to account for up to 70% of the US economy. It is, therefore, important for forex traders to understand how it affects the economy and the currency.
Understanding Retail Sales YoY
Retail Sales: the definition of retail sales is the purchase of finished goods and services by the end consumers. As an economic indicator, retail sales are used to measure the changes in the value of the goods and services bought at the retail level. This change can be monthly (retail sales MoM) or over the previous twelve months (retail sales YoY).
Retail Sales YoY: covers the retail sales made to consumers for the preceding 12 calendar months. It measures the rate of change in the value of purchases made by households.
How Retail Sales YoY is Measured
The data collected for the YoY retail sales cover all retail outlets from physical stores to e-commerce. It also includes data from the services sector, such as hotels and restaurants. According to the US Census Bureau, retail sales are divided into 13 categories, which include: e-commerce retailers, department stores, food and beverage stores, health and beauty stores; furniture stores; hospitality, apparel, building stores, auto dealers, and gas stations.
In the US, the measurement of the annual retail sales is done using the Annual Retail Trade Survey (ARTS). The ARTS is aimed at giving the estimates of the national total annual sales, sales taxes, e-commerce sales, end-of-year inventories, purchases, total operating expenses, gross margins, and end-of-year accounts receivable for retail businesses. This survey is conducted annually.
The retail sales YoY tends to be influenced by the seasonality of the economic activities since it covers more extended periods. These seasons including the holiday shopping seasons account for about 20% of the retail sales YoY. As a result, retail sales YoY cannot be expected to provide the most current and up-to-date retail data.
How Retail Sales YoY can be used in Analysis
As aforementioned, the retail sales account for about 70% of the GDP, making it a vital leading indicator.
Consumer spending drives the economy. An increase in retail sales implies that more money is circulating in the economy. This increase could be a result of increased wages, which increases the disposable income, increase in the rate of employment; and accessibility to loans and credit. All these factors increase the aggregate demand within an economy. The increase in demand leads to an increase in aggregate supply. This increase leads to the creation of more employment opportunities due to the expansion of businesses. Therefore, a steady increase in the retail sales YoY signifies that the economy has been steadily expanding over the long term.
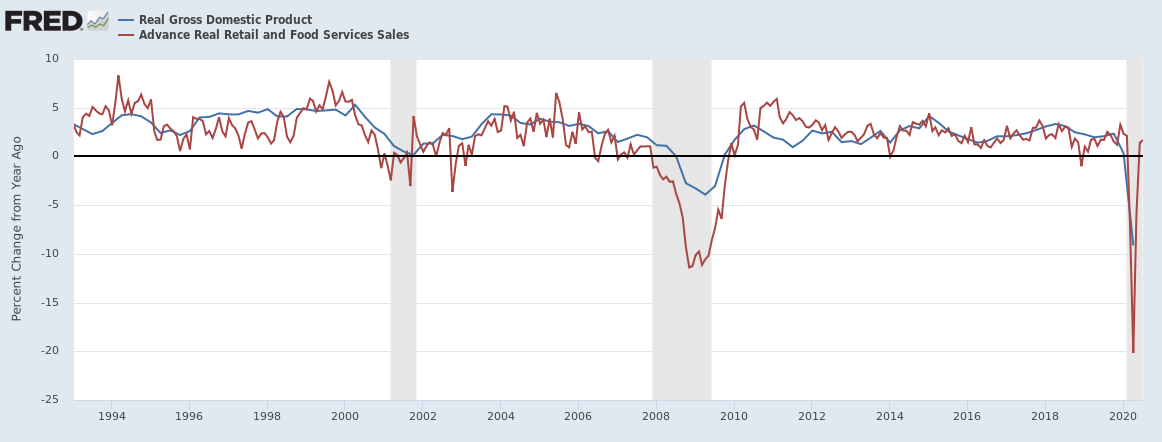
Source: St. Louis FRED
Declining retail sales YoY is an indicator that the economy might be contracting. The decrease in retail sales implies that there is less disposable income within the economy, either as a result of low wages or job cuts. Subsequently, there will be reduced demand for the finished goods and services in the economy, which will, in turn, compel producers to cut the output to avoid price distortion. The reduction in the production will force them to scale down their operations, leading to more unemployment. Thus, a continually decreasing retail sales YoY could be an indicator of a looming economic recession.
Since the retail sales YoY are spread out over 12 calendar months, it provides a comprehensive outlook for the central banks to monitor the effectiveness of their monetary policies. In the US, the Federal Reserve Board uses the accounts receivable data in monitoring retail credit lending.
Monitoring the retail sale YoY enables the Federal Reserve to keep an eye on the rate of inflation. A continually increasing retail sales YoY, if left unchecked, could lead to an increased rate of inflation beyond the target rate. Thus, to ensure this does not happen, the central banks consider this data when making the interest rate decision.
Conversely, since a continually decreasing retail sales YoY forebode a possibility of a recession, this data encourages governments and central banks to implement expansionary fiscal and monetary policies. These policies, such as cutting the interest rates, are meant to reduce the cost of borrowing and increase access to credit hence spurring demand within the economy.
Impact on Currency
As established, an increase in the retail sales YoY is synonymous with an increase in economic activities and an expanding economy. A country’s economic growth leads to an increase in the value of its currency. Thus, increasing retail sales YoY results in currency appreciation.
Conversely, the declining retail sales YoY forebodes a looming recession and a possible interest rate cut in the future. More so, this decline signifies an increase in the unemployment levels and a contracting economy. All these factors contribute to the depreciating of a country’s currency.
In the forex market, the retail sales YoY is a low-level economic indicator. It is overshadowed by the MoM retail sales data, which represents the more recent changes observed within the economy.
Sources of Retail Sales YoY Data
In the US, the retail sales YoY data is released monthly by the United States Census Bureau, along with the monthly updates. A comprehensive breakdown of the US retail sales YoY can be accessed at St. Louis FRED website. Statistics on the global retail sales YoY can be accessed at Trading Economics.
How Retail Sales YoY Data Release Affects The Forex Price Charts
The most recent retail sales YoY data was released on August 14, 2020, at 8.30 AM ET. A more in-depth review of the data release can be accessed at the US Census Bureau website.
The screengrab below is of the retail sales YoY from Investing.com. On the right is a legend that indicates the level of impact the fundamental indicator has on the USD.
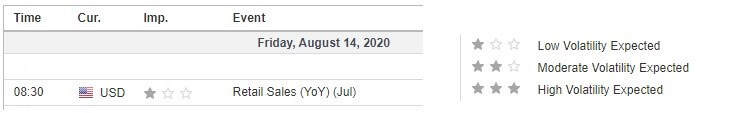
As can be seen, the retail sales YoY data release is expected to cause low volatility on the USD.

In the 12 months to July 2020, the retail sales YoY in the US increased by 2.74%. This increase is higher compared to the previous increase of 2.12%. In theory, this increase should appreciate the USD relative to other currencies.
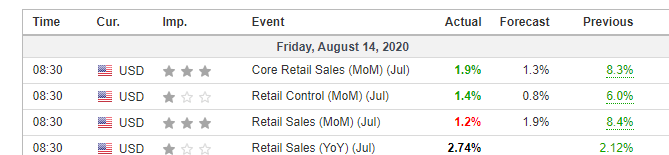
The screengrab above shows the simultaneous release of the monthly retail sales data and the retail sales YoY data. It is to be expected that the monthly retail sales data will dampen any impact that the retail sales YoY would have had on the price action.
EUR/USD: Before the Retail Sales, YoY Data Release on
August 14, 2020, Just Before 8.30 AM ET

As we can see from the above 15-minute EUR/USD chart, the pair was trading in a weak uptrend. This trend is proved by the 15-minute candles crossing above the slightly rising 20-period Moving Average.
EUR/USD: After the  Retail Sales, YoY Data Release on
August 14, 2020, at 8.30 AM ET

After the news announcement, the pair formed a 15-minute bullish candle. This candle indicates that the USD weakened against the EUR. Subsequently, the pair continued trading in a renewed uptrend as the 20-period MA rose steeply.
GBP/USD: Before the Retail Sales YoY Data Release on
August 14, 2020, Just Before 8.30 AM ET
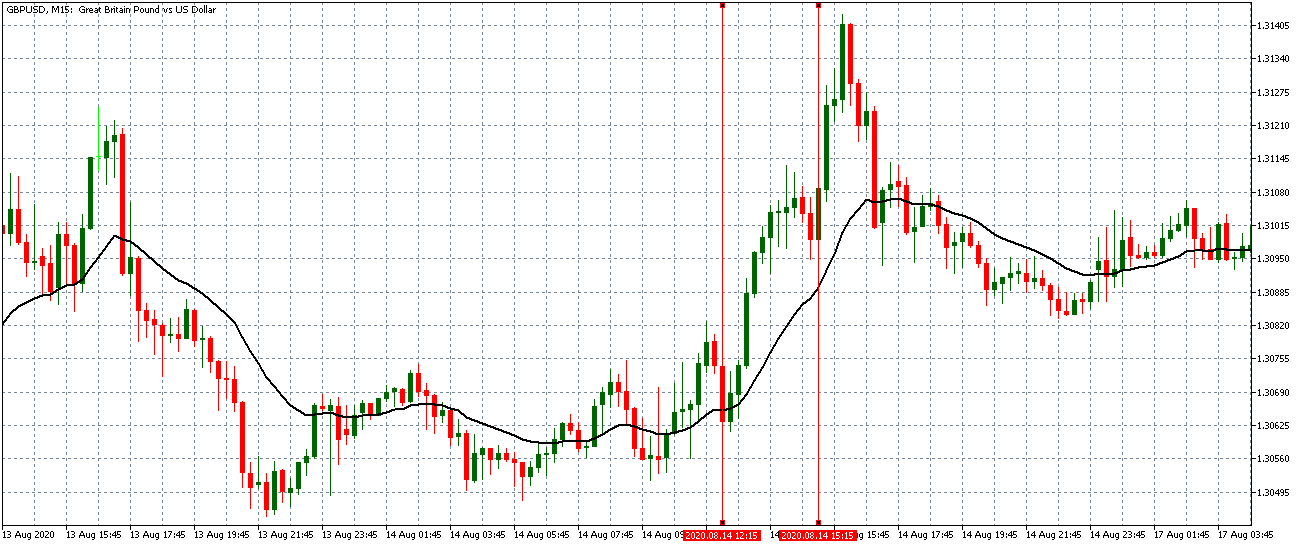
Before the data release, the GBP/USD pair was trading in a steady uptrend. This trend is evidenced by a steeply rising 20-period MA, with bullish candles forming further above it.
GBP/USD: After the  Retail Sales, YoY Data Release on
August 14, 2020, at 8.30 AM ET
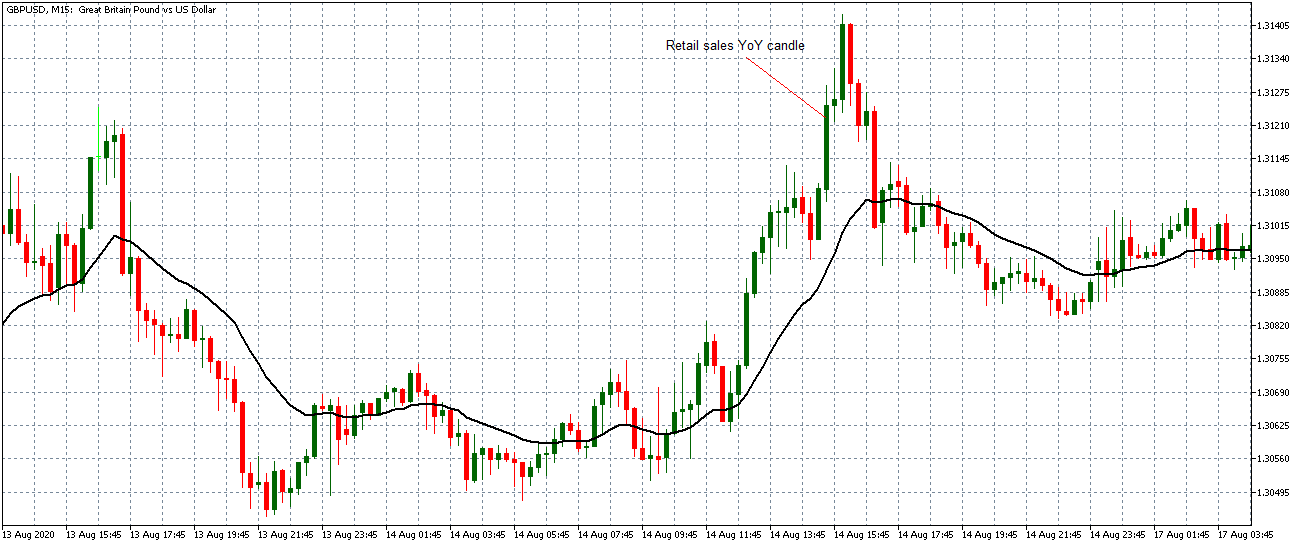
Similar to the EUR/USD, the GBP/USD pair formed a long 15-minute bullish candle after the news release. The pair continued to trade in the previously observed uptrend before peaking and slowly flattening.
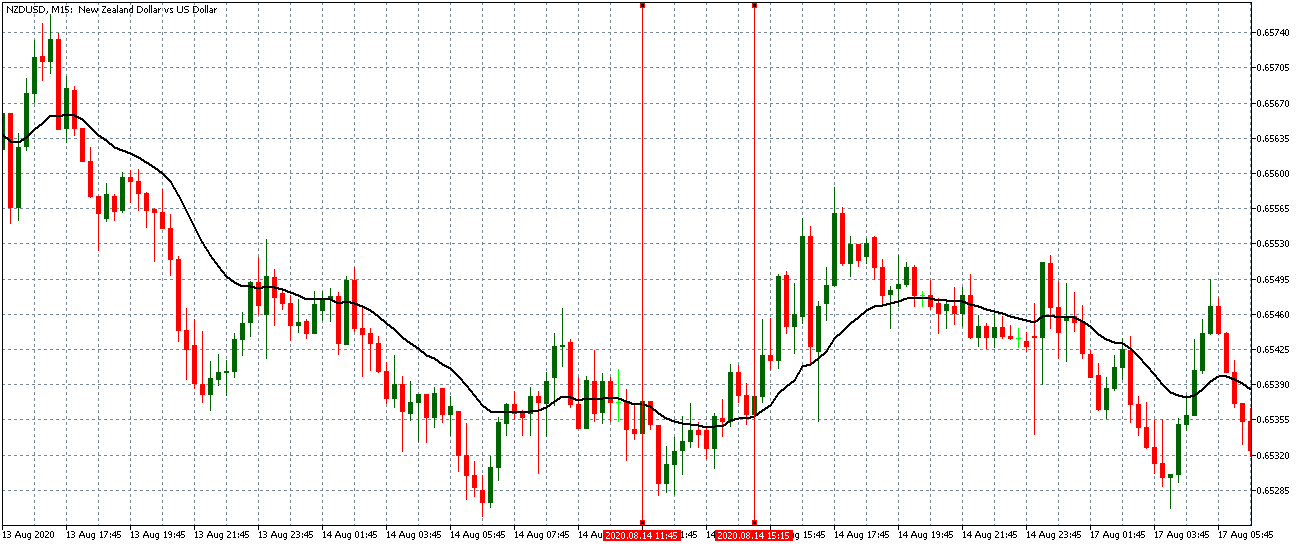
NZD/USD: Before the Retail Sales, YoY Data Release on
August 14, 2020, Just Before 8.30 AM ET
NZD/USD: After the  Retail Sales, YoY Data Release on
August 14, 2020, at 8.30 AM ET
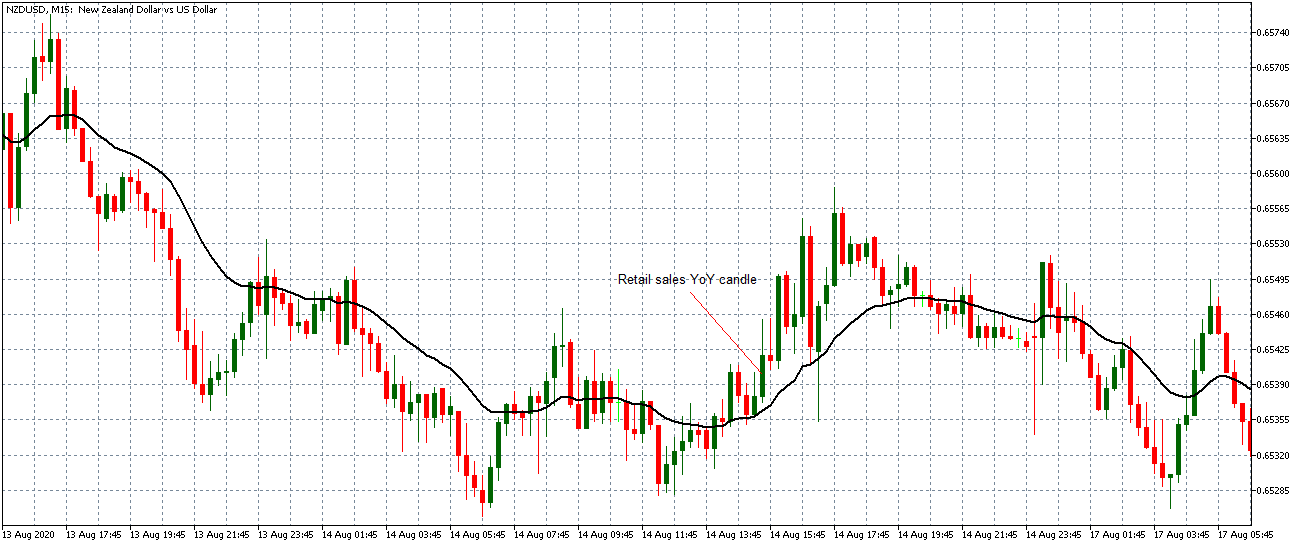
Before the retail sales YoY data release, the NZD/USD pair was trading in a similar trend as the EUR/USD pair. The 15-minute candles were crossing above a flattening 20-period Moving Average. After the news announcement, the pair formed a long 15-minute bullish candle as did the EUR/USD and GBP/USD pairs. Subsequently, the pair traded in a renewed uptrend as the 20-period MA rose steeply with candles forming further above it.
Bottom Line
The retail sales YoY provides vital long-term data about the economic outlook of the households and their consumption patterns. In the forex markets, however, the retail sales YoY data is overshadowed by the retail sales MoM data, which is release concurrently. From this analysis, the increase of the retail sales YoY data for July 2020 had no impact on the price action since the markets reacted to the negative monthly retail sales data.