Categories
Forex Fundamental Analysis

The Impact of ‘Gross Domestic Product Estimate’ Economic Indicator On The Forex Market

Introduction

In most economies globally, the GDP data is published by governments or government agencies quarterly. This would mean that analysts, economists, and households would have to wait for a full quarter to know how the economy is performing. Naturally, this long wait can be frustrating and, in some cases, inconveniencing. Therefore, having some form of estimate as to what the GDP might be can be quite useful.

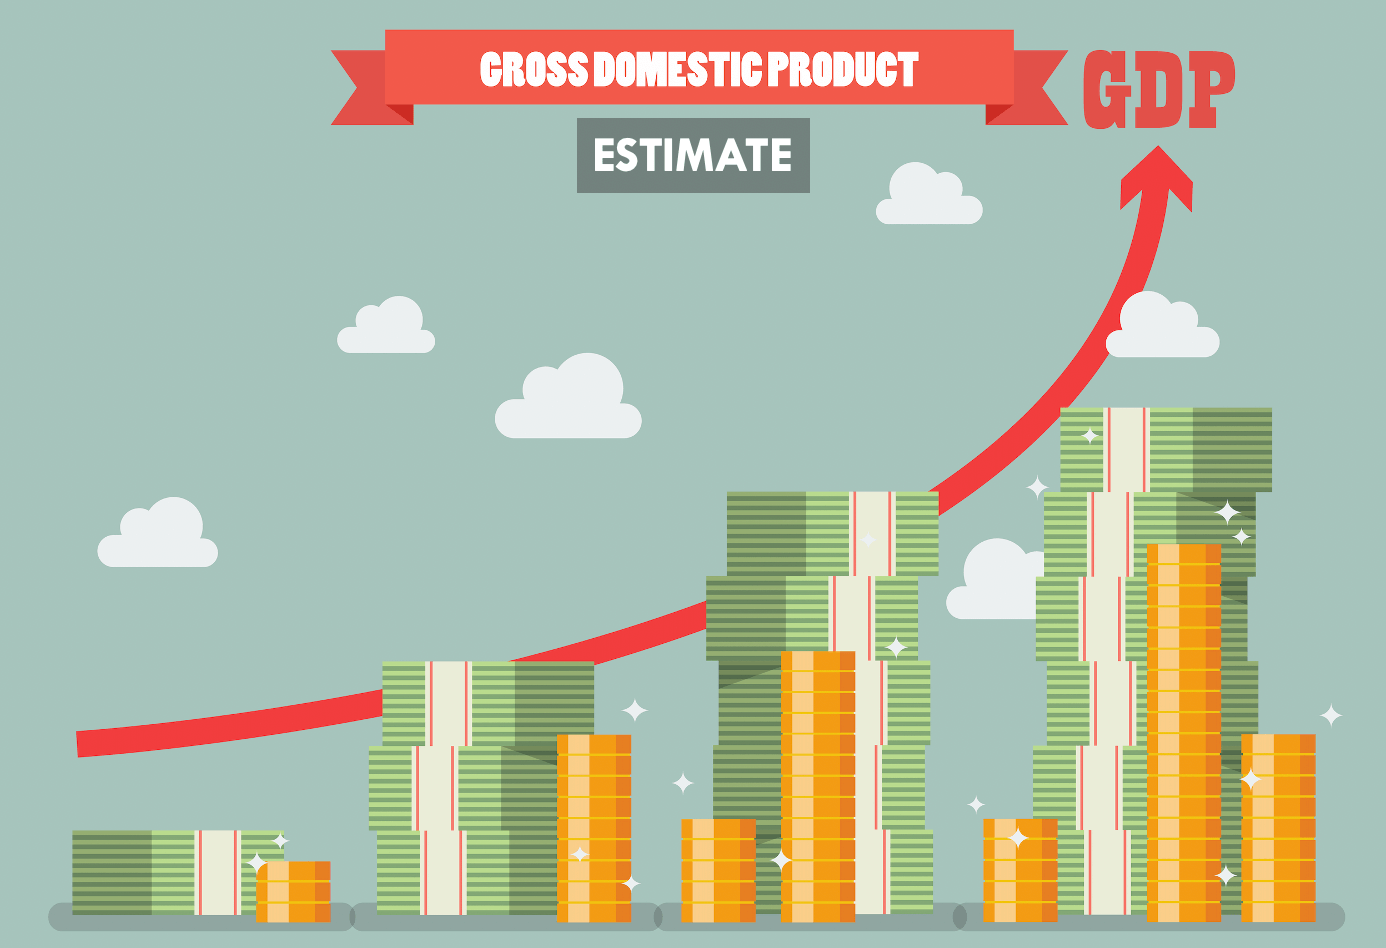
Understanding Gross Domestic Product Estimate

As the name suggests, the GDP estimate serves to estimate an economy’s GDP before the release of the official government-published GDP report.

These estimates are arrived at by surveying the industries within the country. In the UK, for example, the following industries are surveyed; production, manufacturing, mining and quarrying, agriculture, construction, private services, and public services. Most estimates adopted globally use the bottom-up methodology.

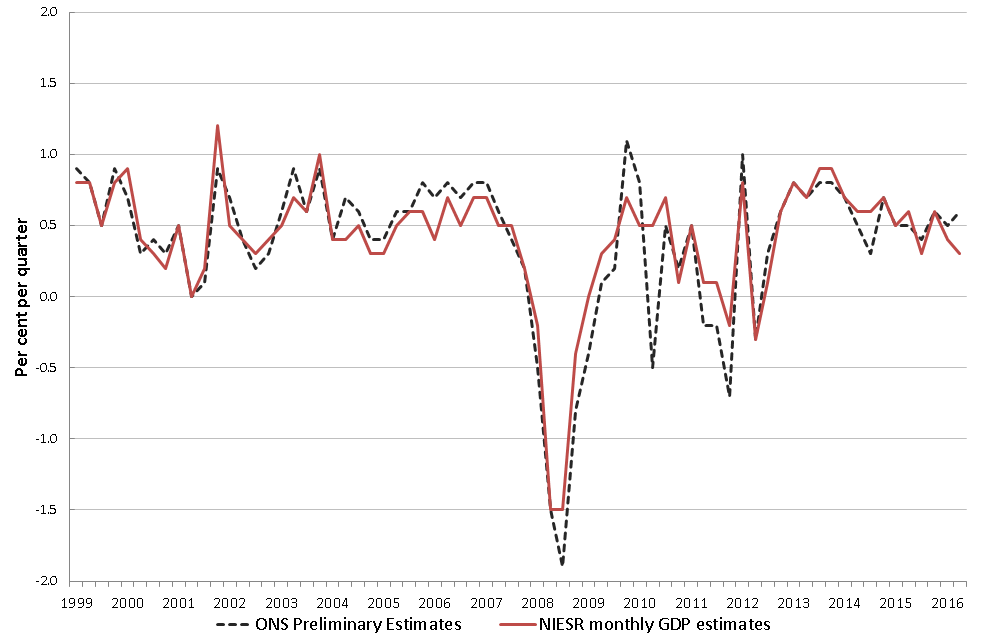
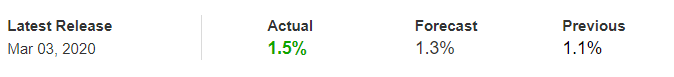
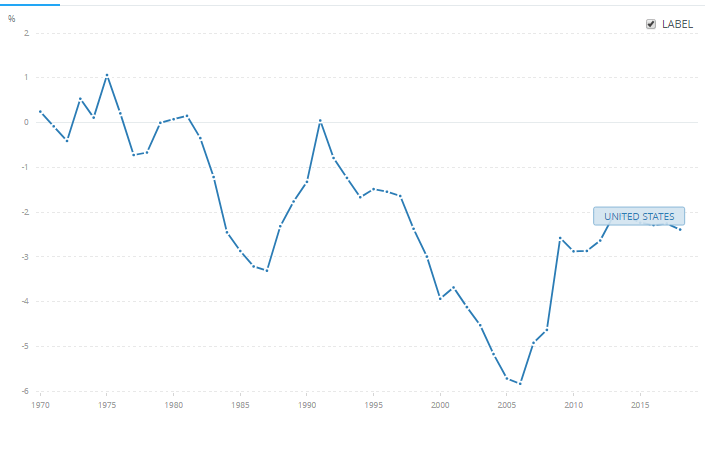
Source: National Institute of Economic and Social Research

In the UK, the National Institute of Economic and Social Research (NIESR) publishes a rolling monthly estimate of the GDP growth using the bottom-up methodology. Hence, its GDP estimate covers the preceding three months. Since the GDP estimates are published monthly, it means that NIESR releases at least four GDP estimates before the government’s publication. Using the bottom-up analysis to estimate the GDP, NIESR uses statistical models to aggregate the most recent trends observed within the GDP subcomponents. The statistical models are fed the latest trends, and they forecast the most probable outcome in these subcomponents. Note that these forecasts are only short-term.

While the GDP estimates are not always accurate to the exact decimal percentage, they provide an accurate GDP representation.

Using the Gross Domestic Product Estimate in Analysis

The GDP estimate data can be used in the timely analysis of economic performance. Here is how this data can be used.

In many countries, the macroeconomics policies are usually set more frequently than quarterly. However, since the economic performance is the centerpiece in any macroeconomic policy-making, it is vital to know the most recent GDP data. By tracking the trends of the top components of the GDP, the GDP estimates can provide the most recent data. Therefore, this will help the policymakers to implement more informed policies. Let’s see how the contrast between the GDP estimate and the actual GDP can make a difference in policy implementation.

For example, during the second quarter of 2020, governments and central banks wanted to implement expansionary fiscal and monetary policies. At this point, the only GDP data available to them is the actual GDP for the first quarter of 2020. But for most economies, the 2020 Q1 GDP showed economic growth. On the other hand, the more recent GDP estimates could show that contractions were already visible in the economy.

In this scenario, if policymakers were to use the actual data available to then – the Q1 GDP – they would have made undesirable policies. These policies would have further harmed the economy. On the other hand, if the GDP estimates would have been used to aid the policy implementation, chances are, the most suitable and appropriate monetary and fiscal policies would have been adopted. Here, the GDP estimate would have helped them make relevant policies and ensuring that these policies are implemented timely.

Furthermore, the GDP estimates can also be used to establish whether the policies implemented are working as expected. If expansionary policies are implemented, their primary goal is to spur demand and stimulate economic growth. Using the GDP estimate, policymakers can track to see if there are any changes experienced in the economy. Some aspects like inflation take a long time to adjust, but demand generated by households is almost instantaneous. Therefore, the GDP estimate can be used to gauge the effectiveness of the implemented policies. Take the stimulus packages adopted in Q2 2020 after the pandemic; they were meant to stimulate demand by households, which would lead to economic recovery. With the GDP estimate, we could tell whether the stimulus package worked or not.

When accurate, the advance GDP estimate can be a leading indicator of the actual GDP. Therefore, the GDP estimate data can be used to show the prevailing trends in the economy. For instance, it can be used to show looming periods of recession and any upcoming recoveries. Say that the trailing three months captured by the GDP estimate shows that the economy’s major subcomponents are struggling with demand and contracting. This data can be taken to mean that for that quarter, there is a higher probability that the overall economy would contract. Conversely, when the subcomponents being tracked show growth, it can be expected that the overall economy would have expanded in that quarter.

It’s not just the governments that can benefit from the GDP estimate data. The private sector as well can use the data to plan their economic activity. Take the example that the GDP estimate shows that a particular sector in the economy has been contracting for the previous three months. Investors in this sector can presume that the demand for goods or services from the sector is depressed. In this instance, to avoid venturing into loss-making businesses, investors can make informed decisions about where and when to invest their money.

Impact on Currency

When the GDP estimate shows that the short-term economy is expanding, the domestic currency will appreciate relative to others. A short-term expansion indicates that demand levels in the economy are higher, which implies that unemployment levels are low and households’ welfare is improving.

The domestic currency will depreciate if the GDP estimate shows that the economy is contracting. The primary driver of a contracting economy is decreased expenditure by households contributing almost 70% of the GDP. The decline in demand can be taken as a sign of higher unemployment levels.

Sources of Data

In the UK, the National Institute of Economic and Social Research publishes the monthly and quarterly UK GDP estimate.

How GDP Estimate Release Affects The Forex Price Charts

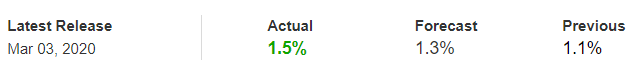
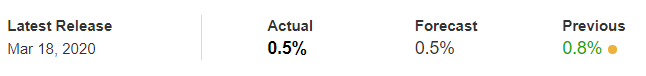
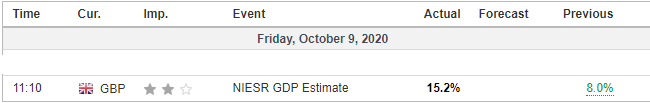
The most recent UK GDP estimate published by NIESR was on October 9, 2020, at 11.10 AM GMT and accessed at Investng.com. Moderate volatility on the GBP can be expected when the NIESR GDP estimate is published.

During this period, the UK GDP is estimated to have grown by 15.2% compared to 8.0% in the previous reading.

Let’s see how this release impacted the GBP.

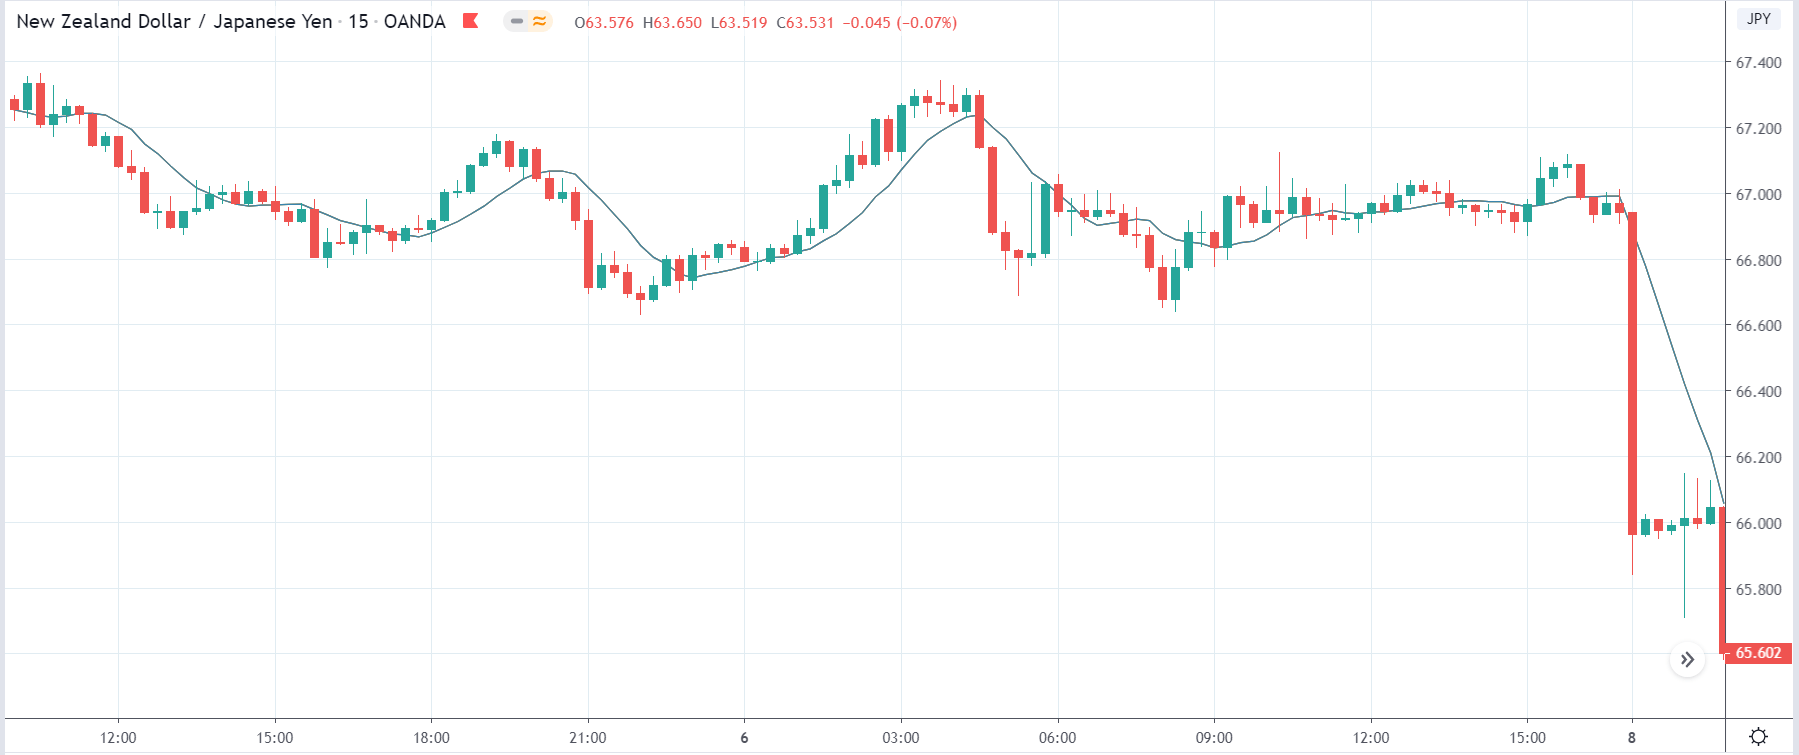
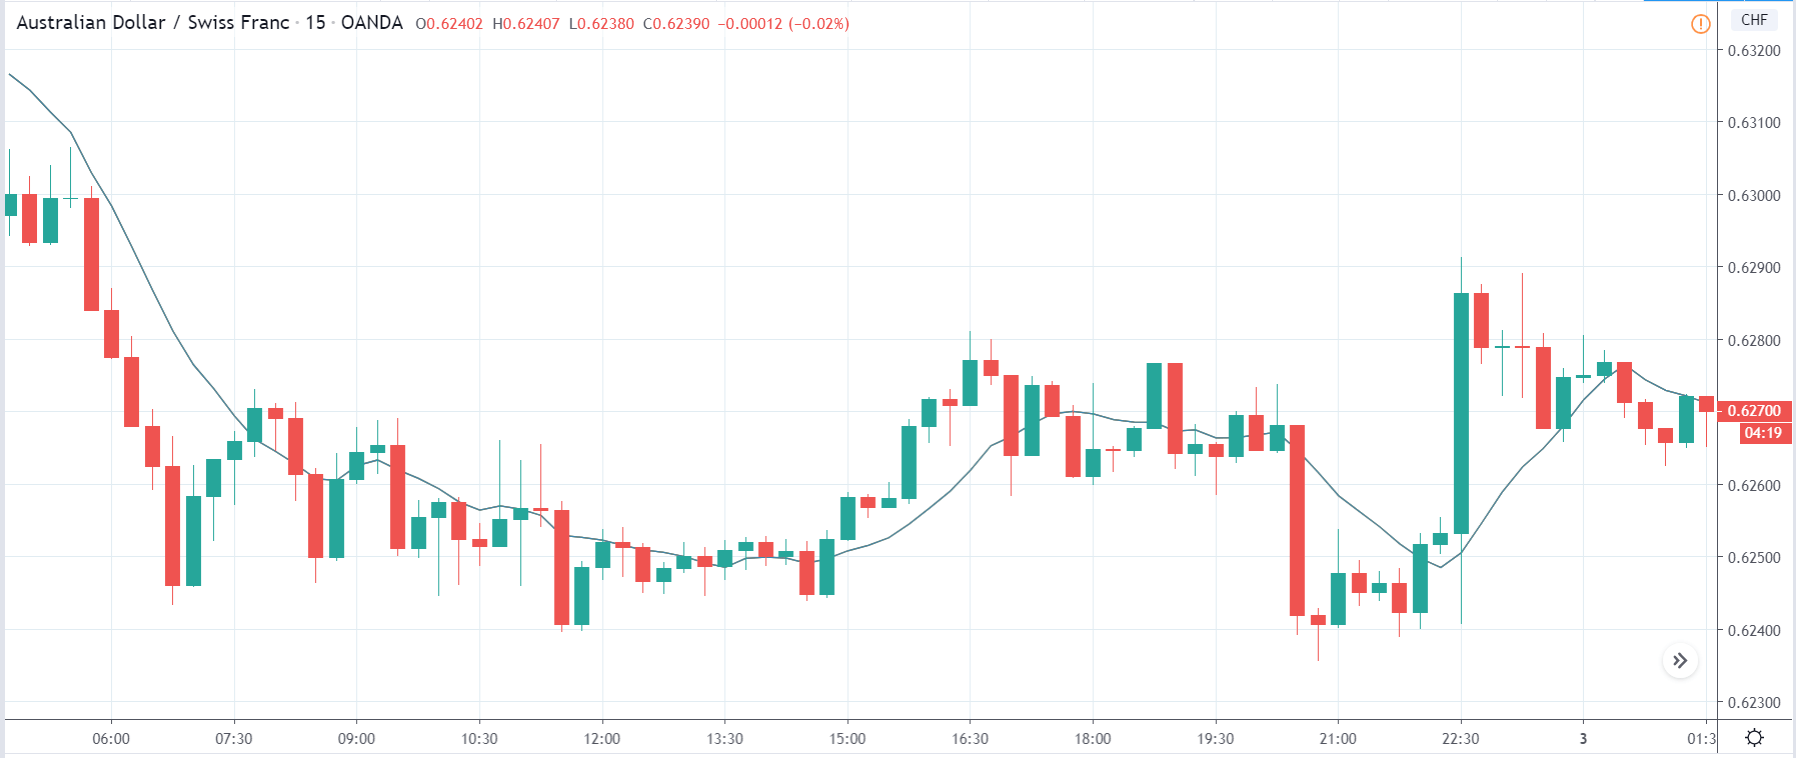
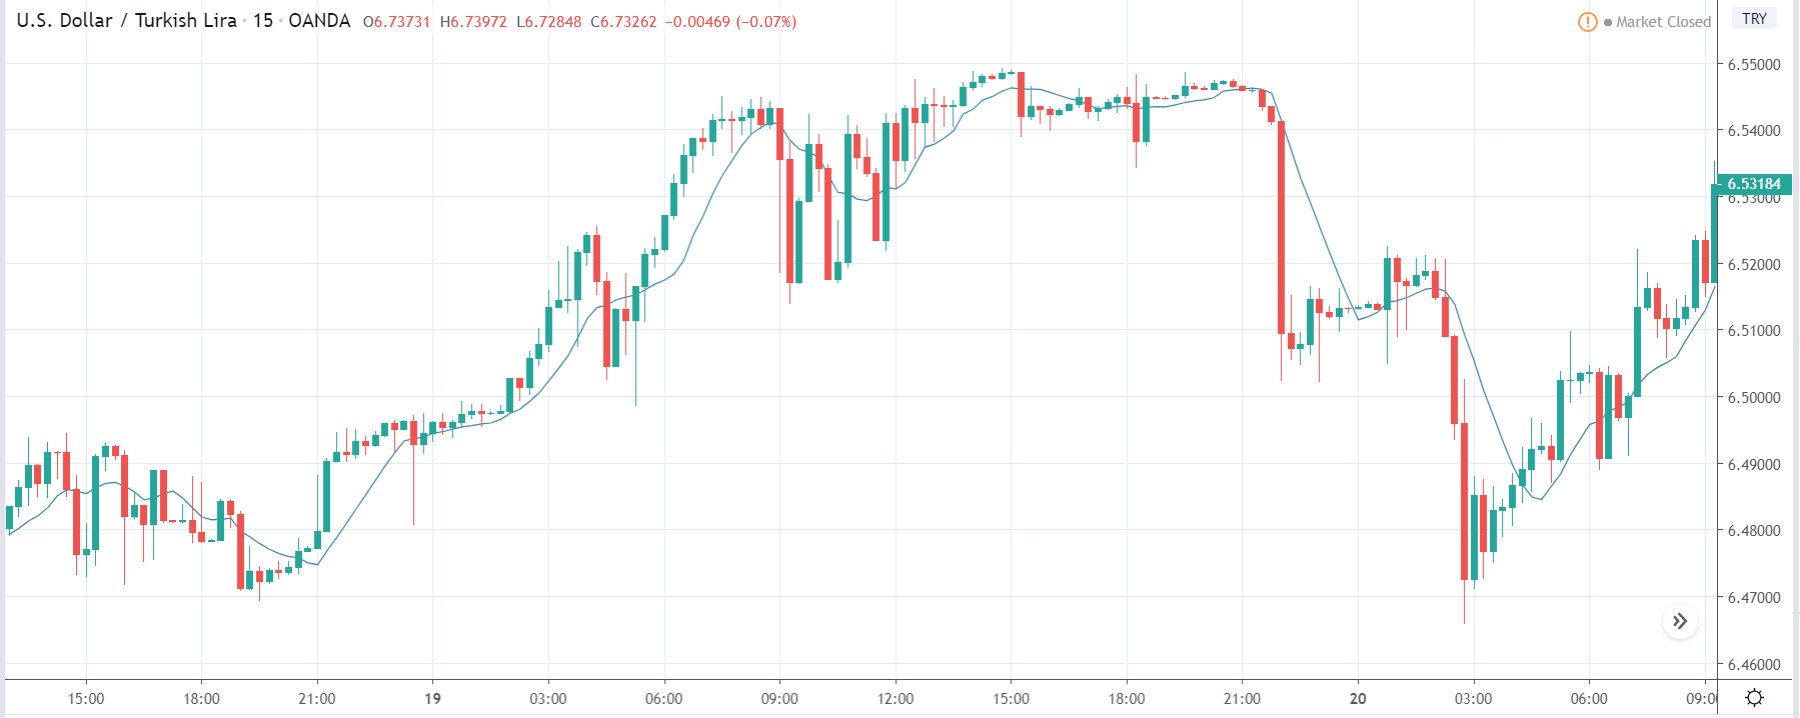
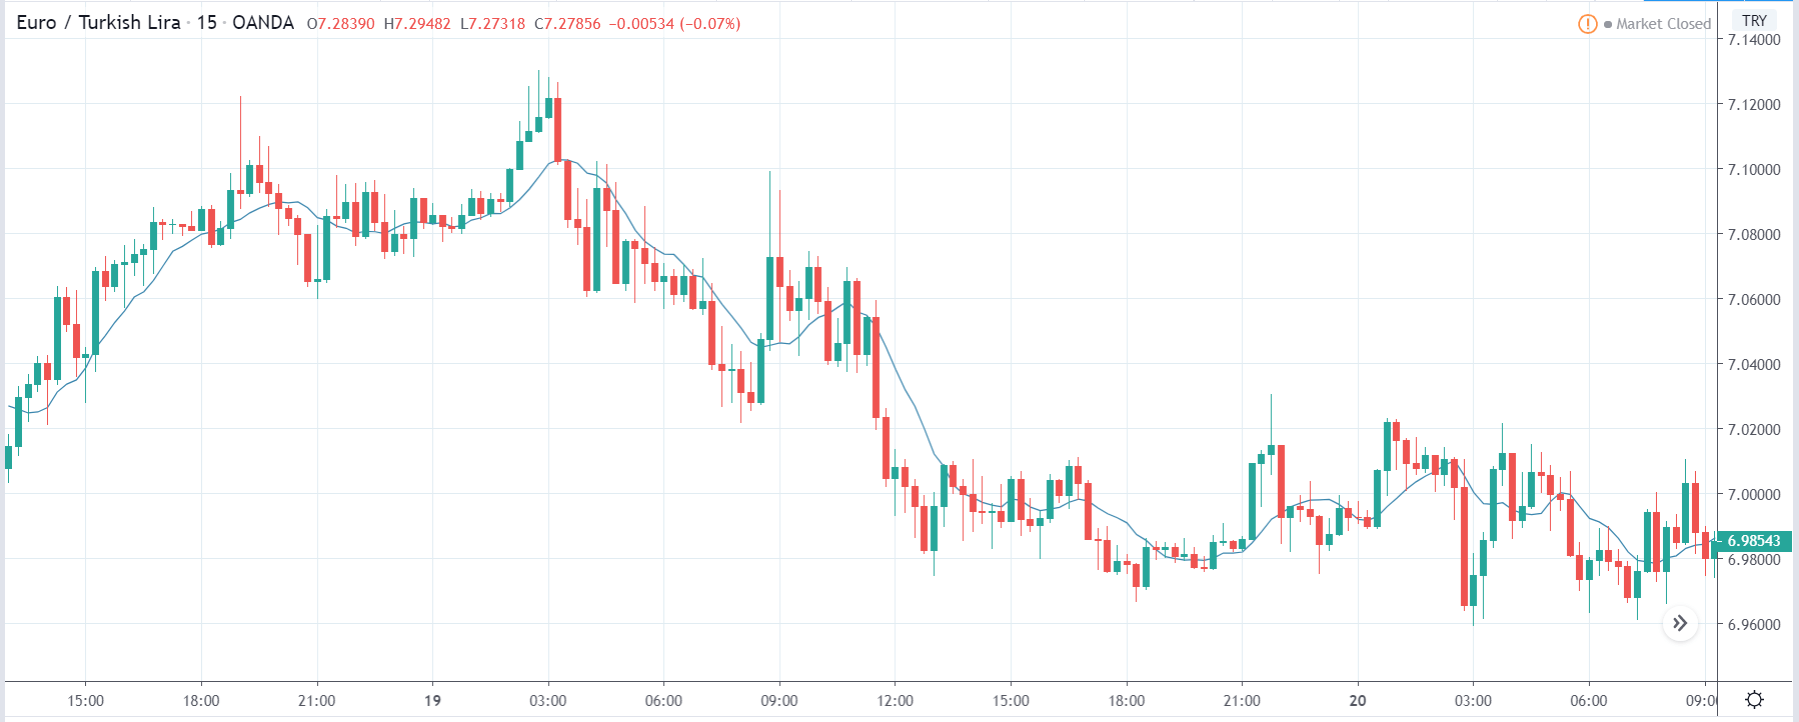
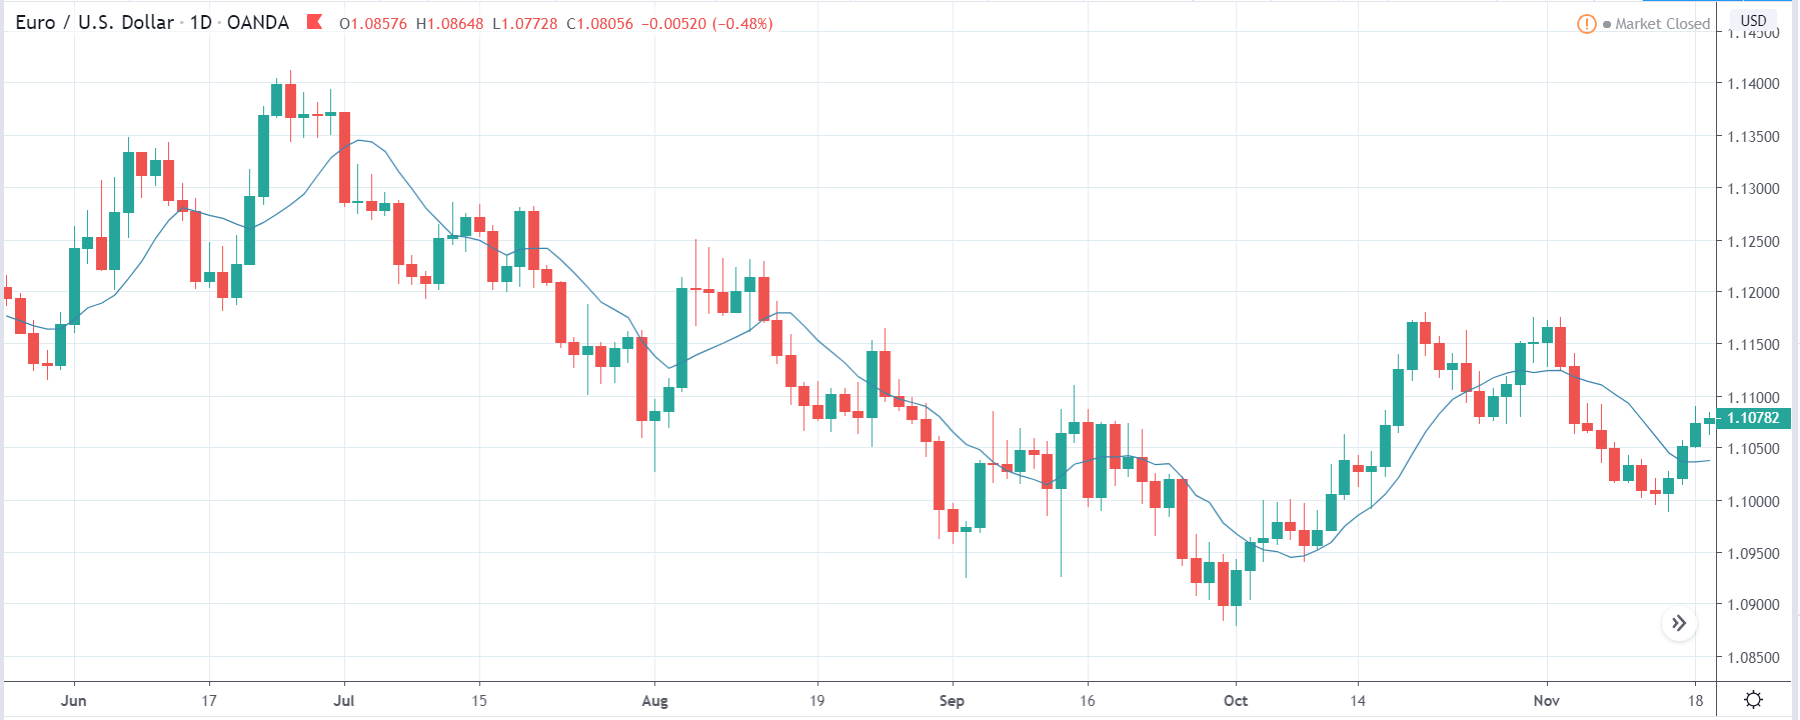
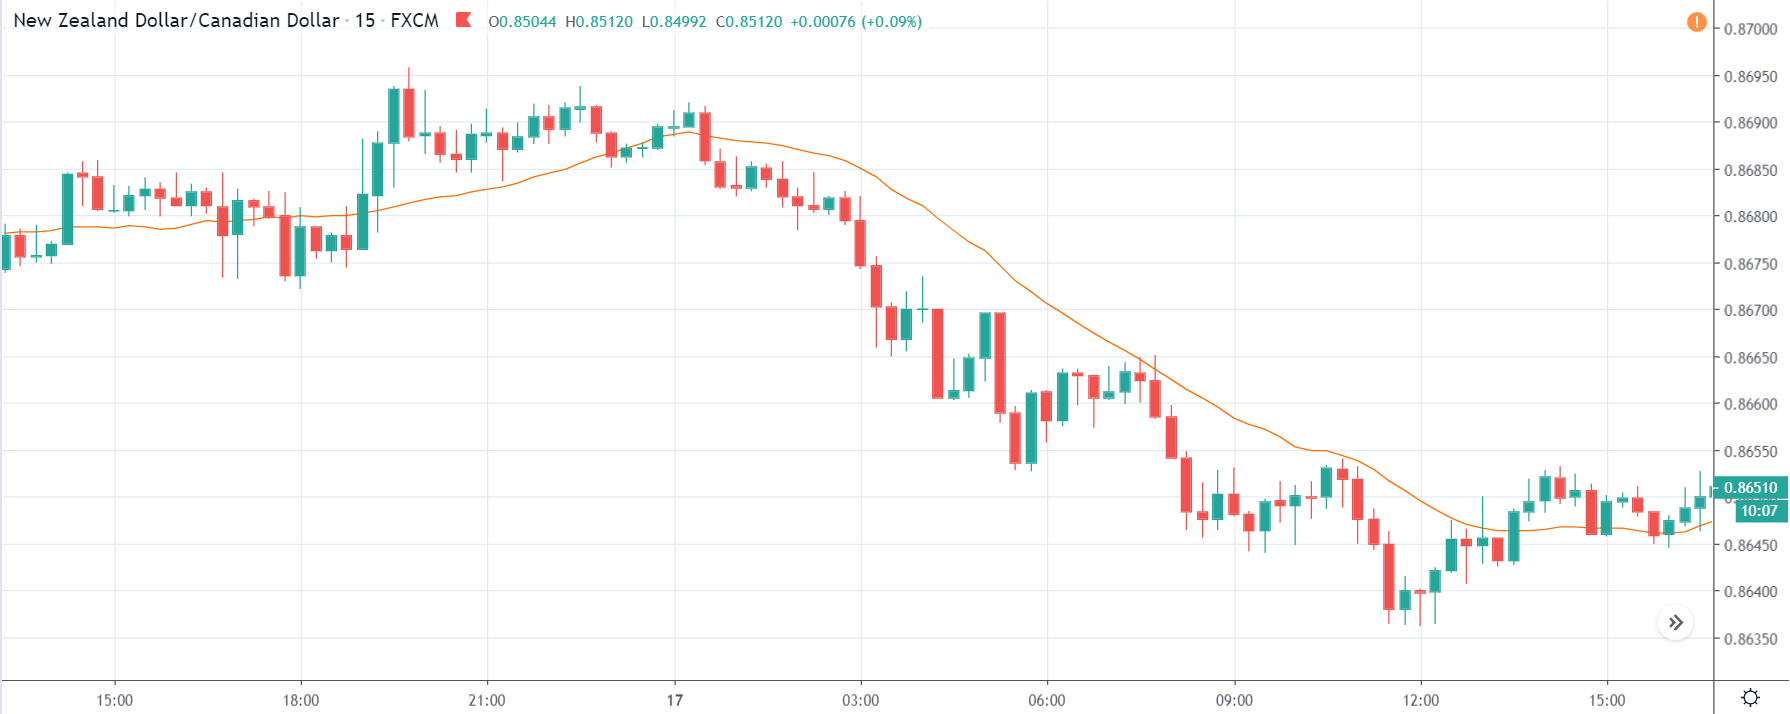
EUR/GBP: Before NIESR GDP Estimate Release on October 9, 2020, 
just before 11.10 AM GMT

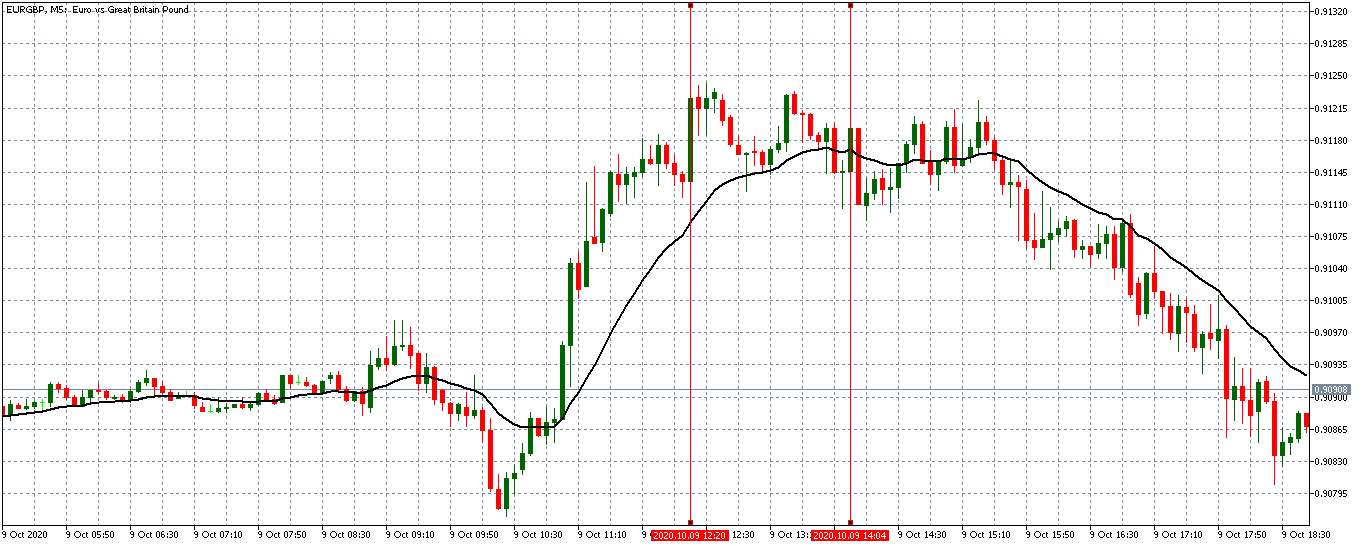
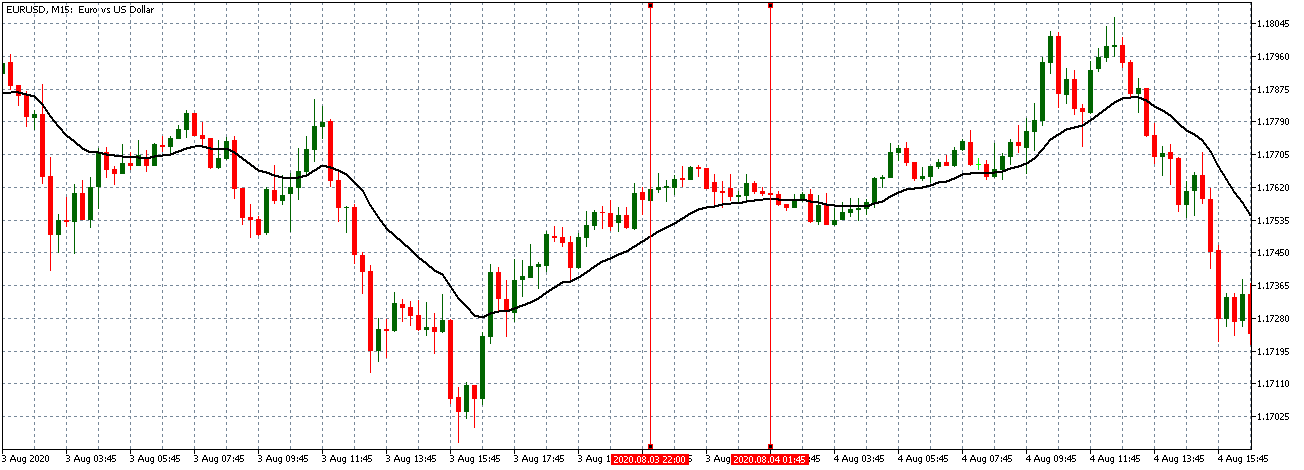
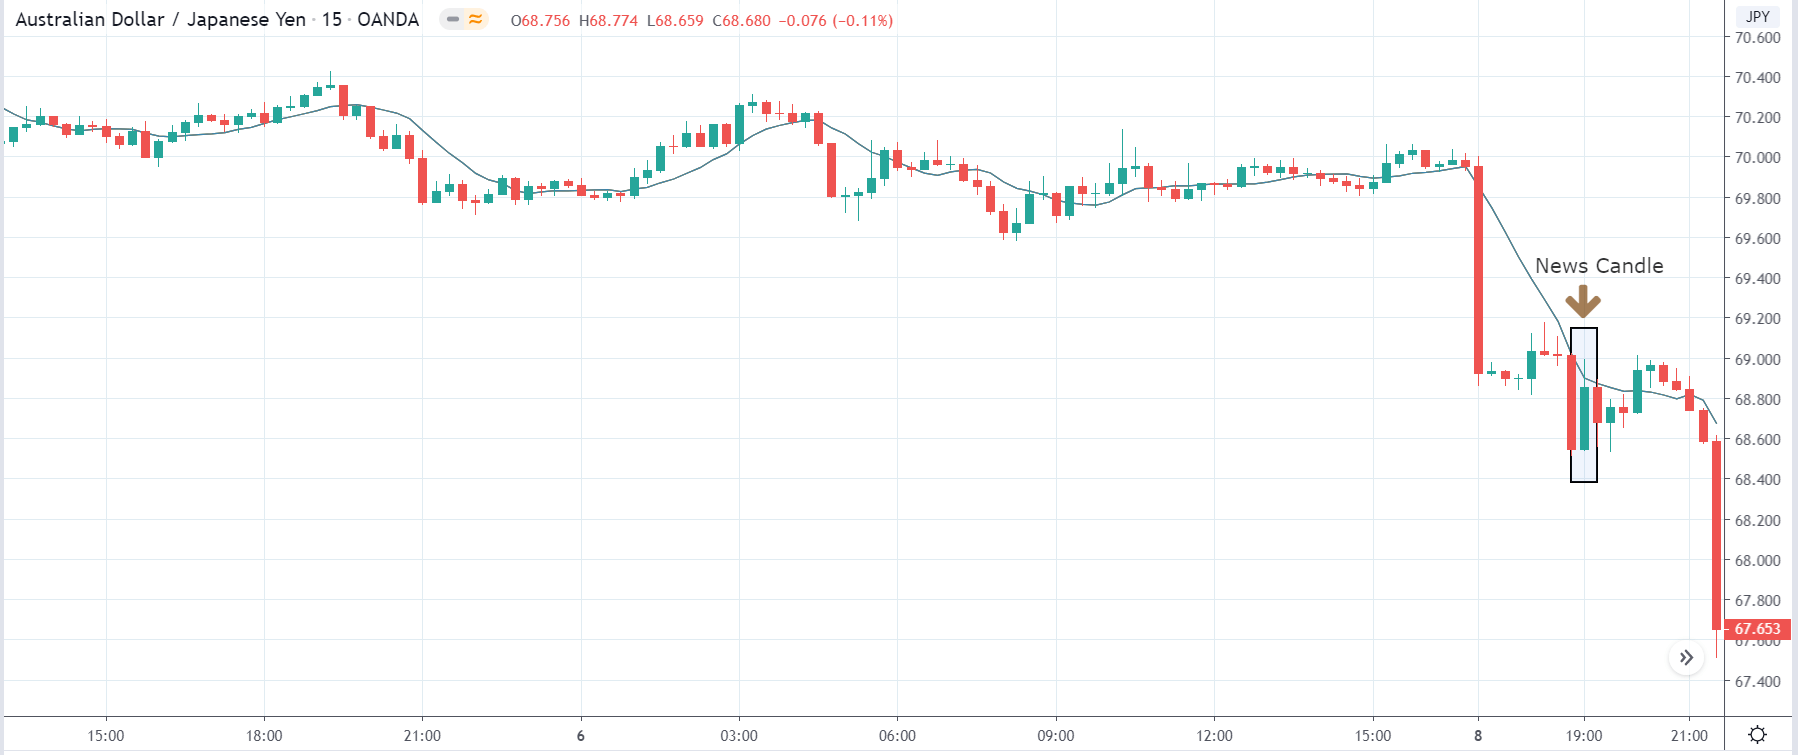
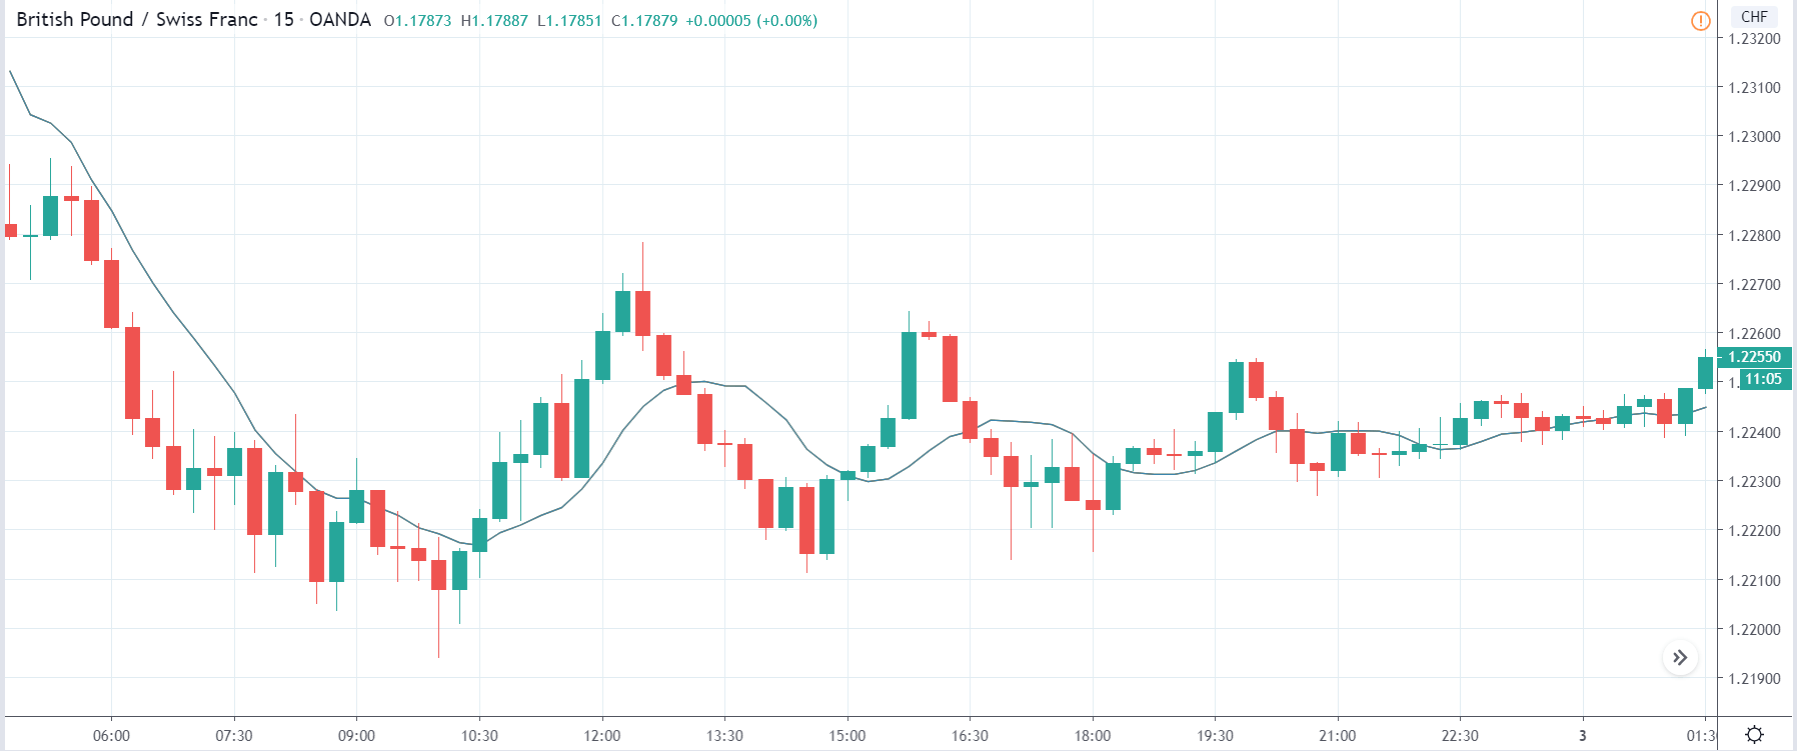
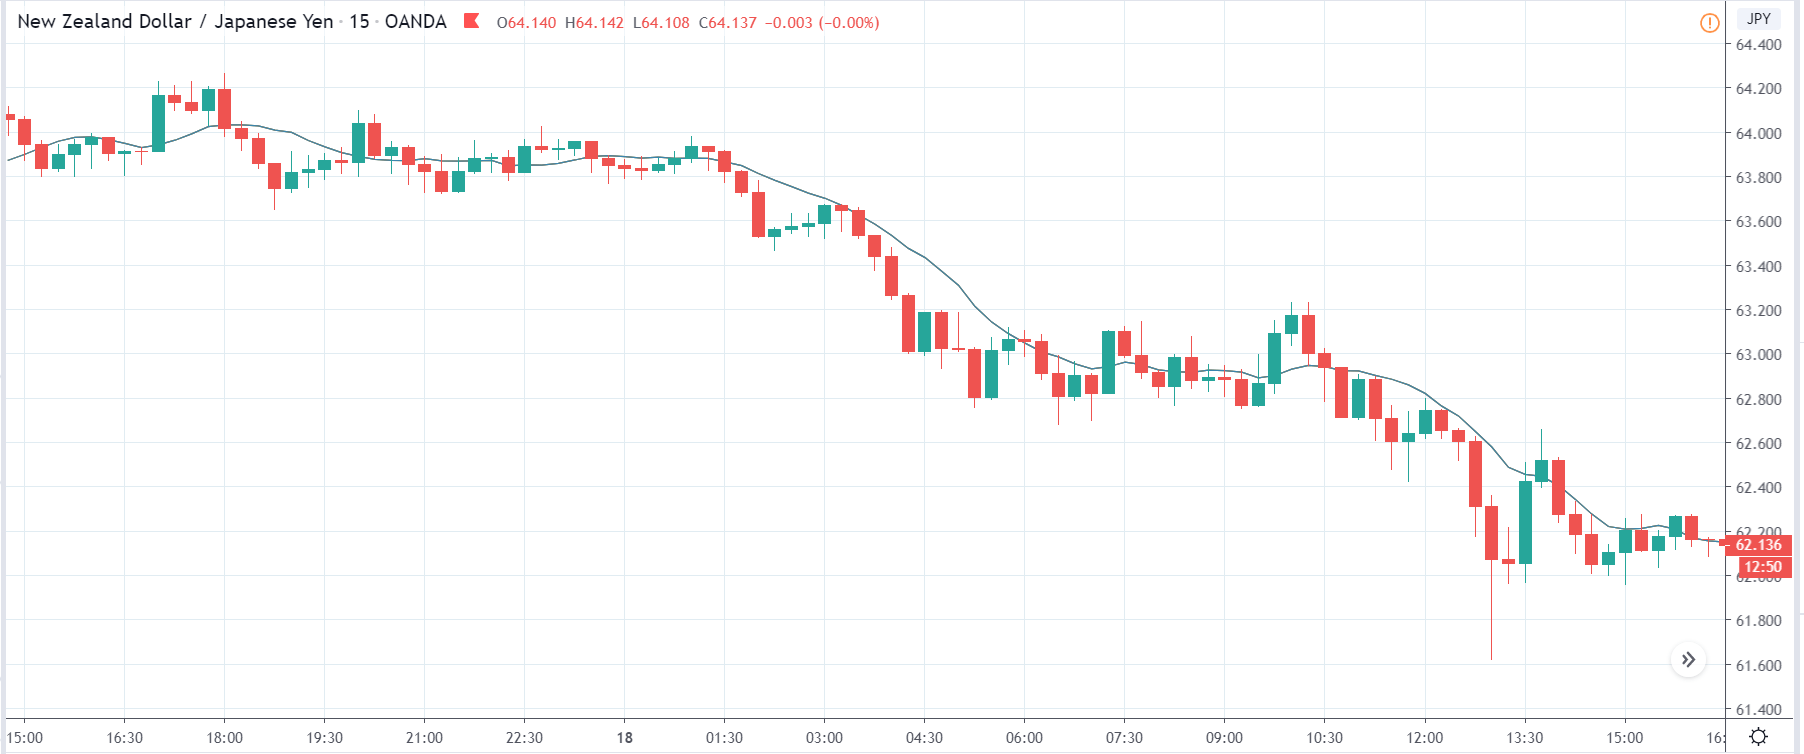
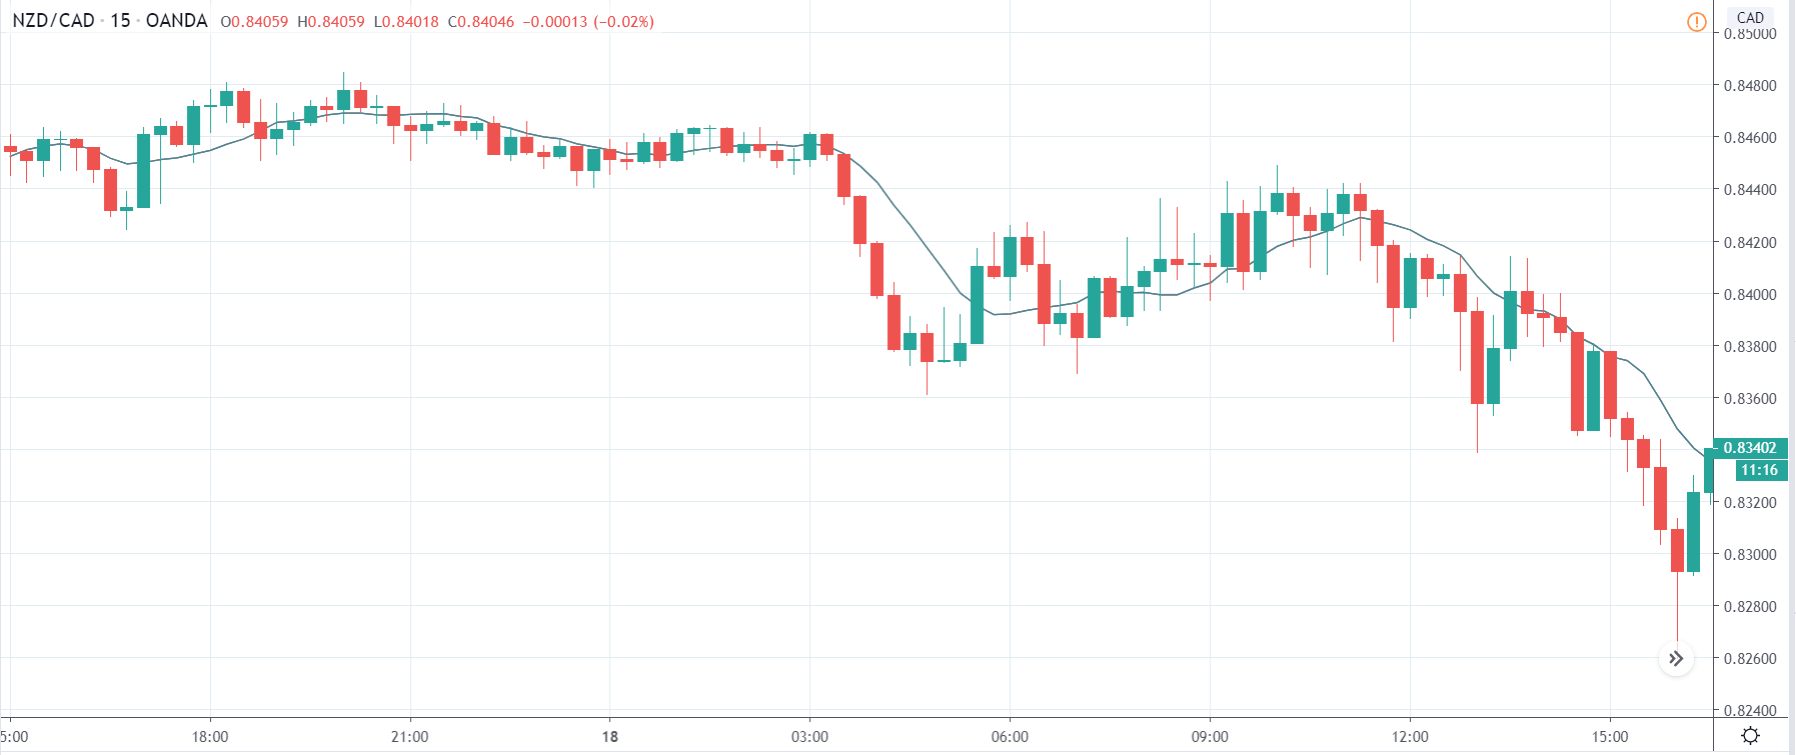
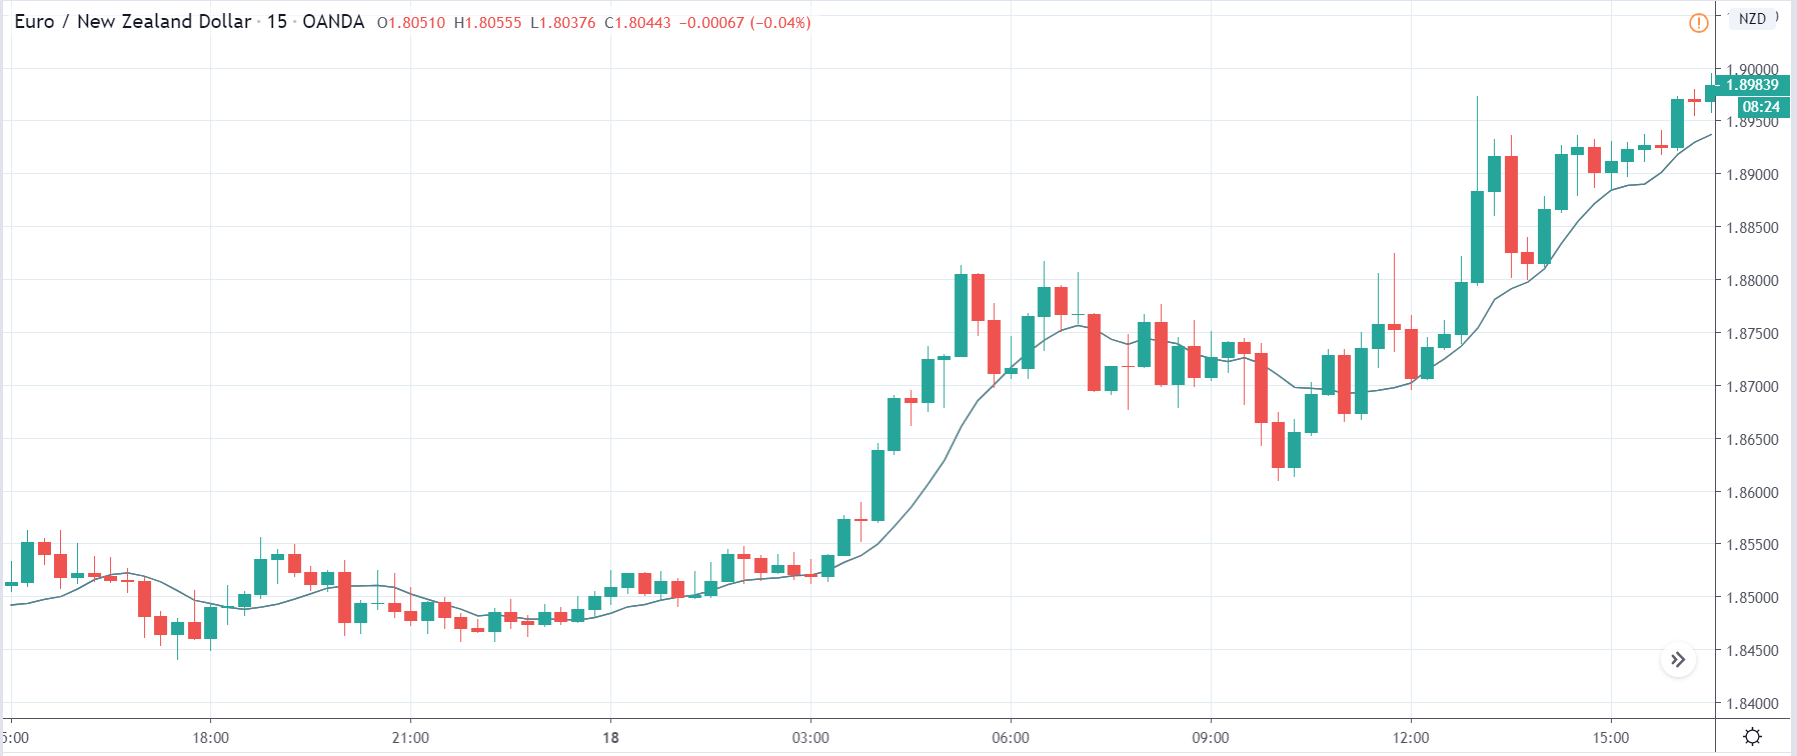
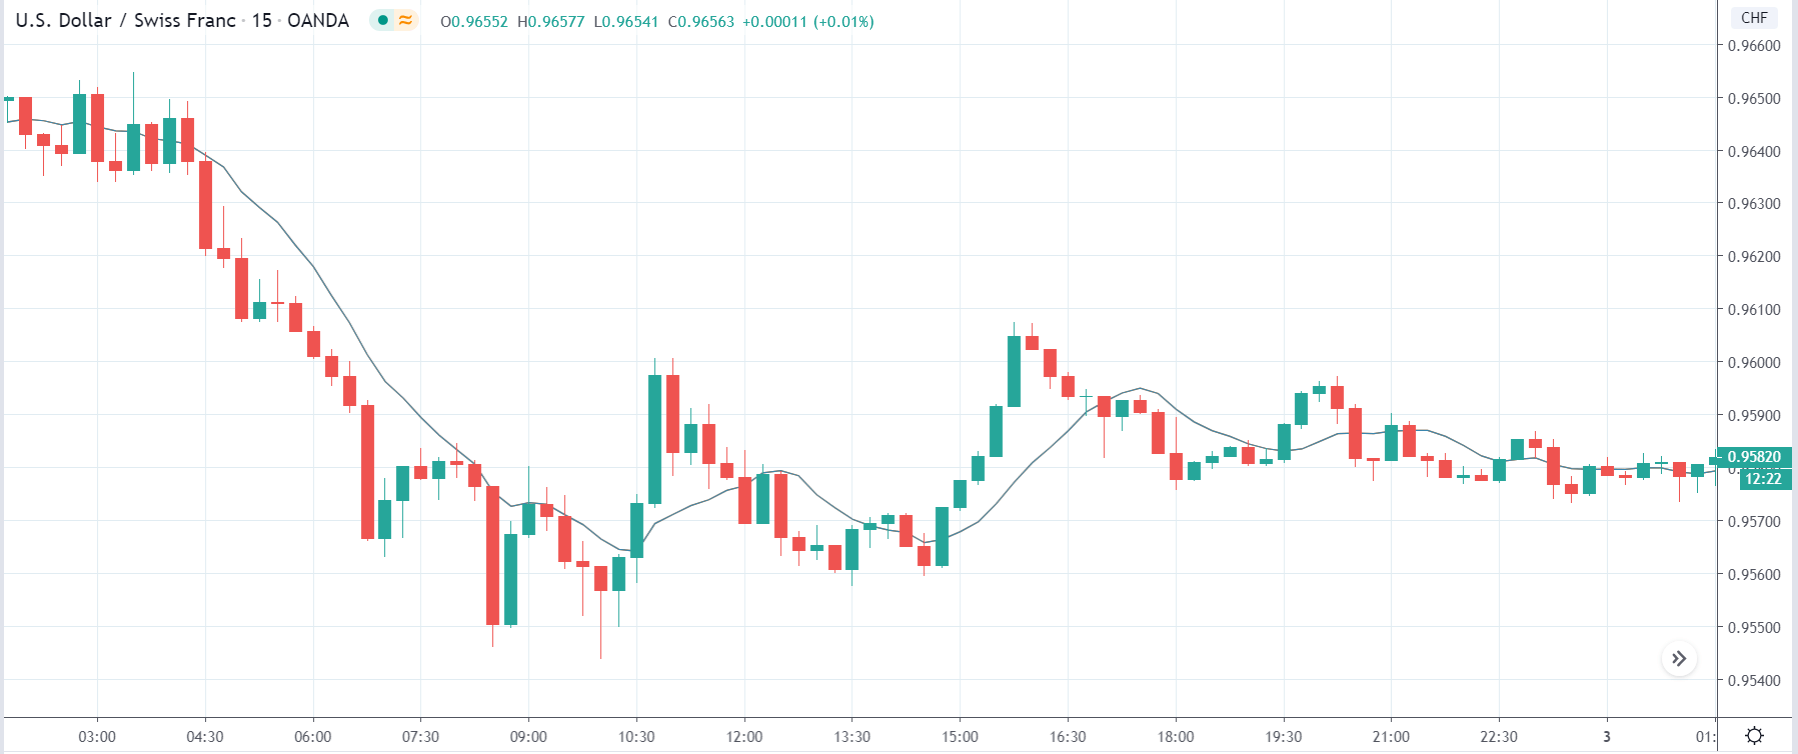
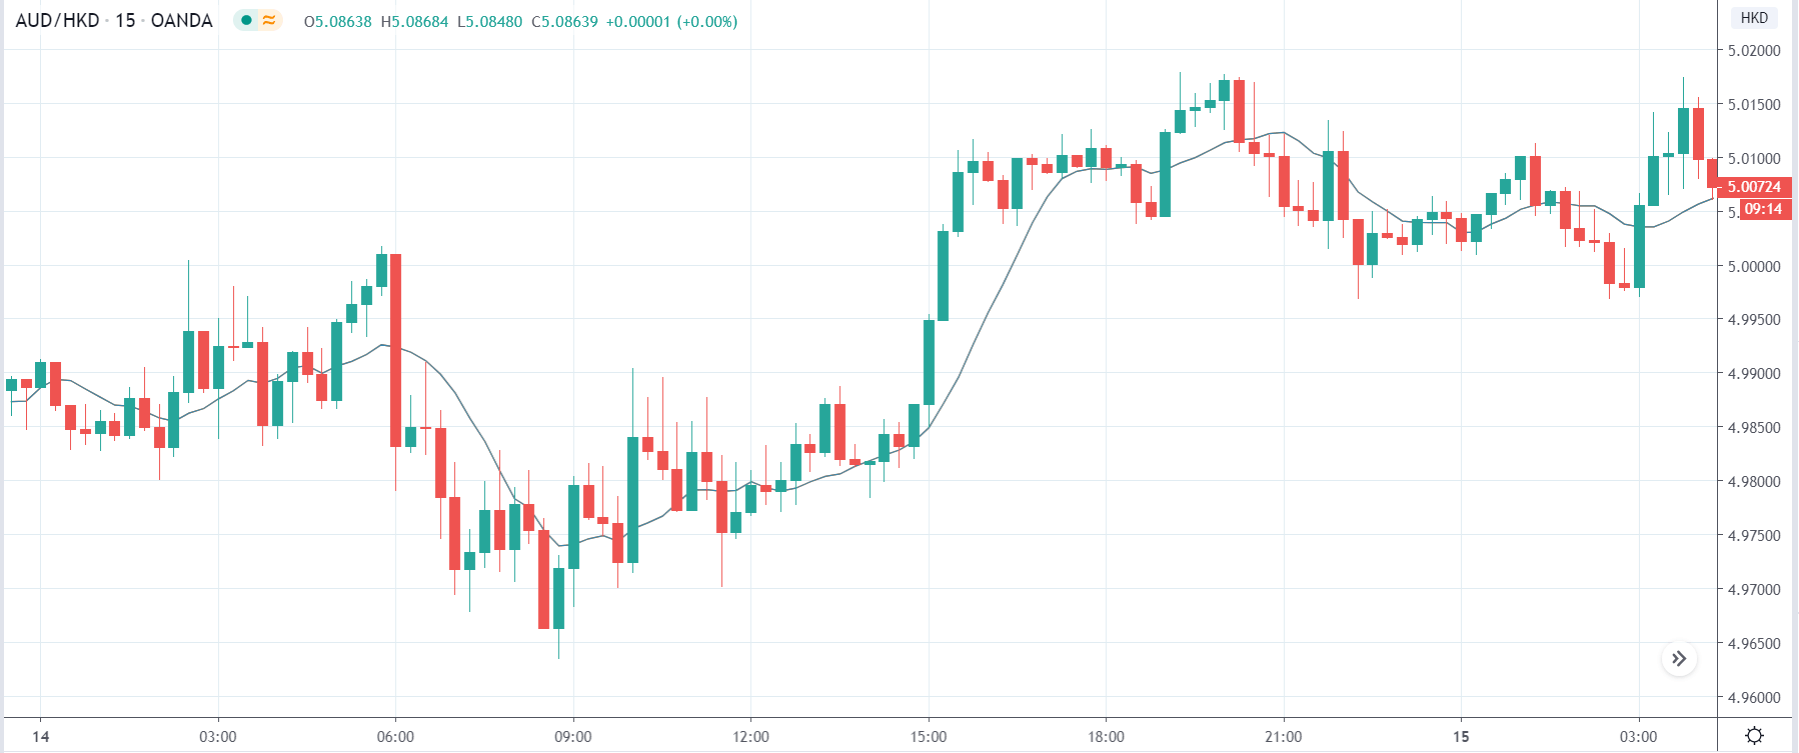
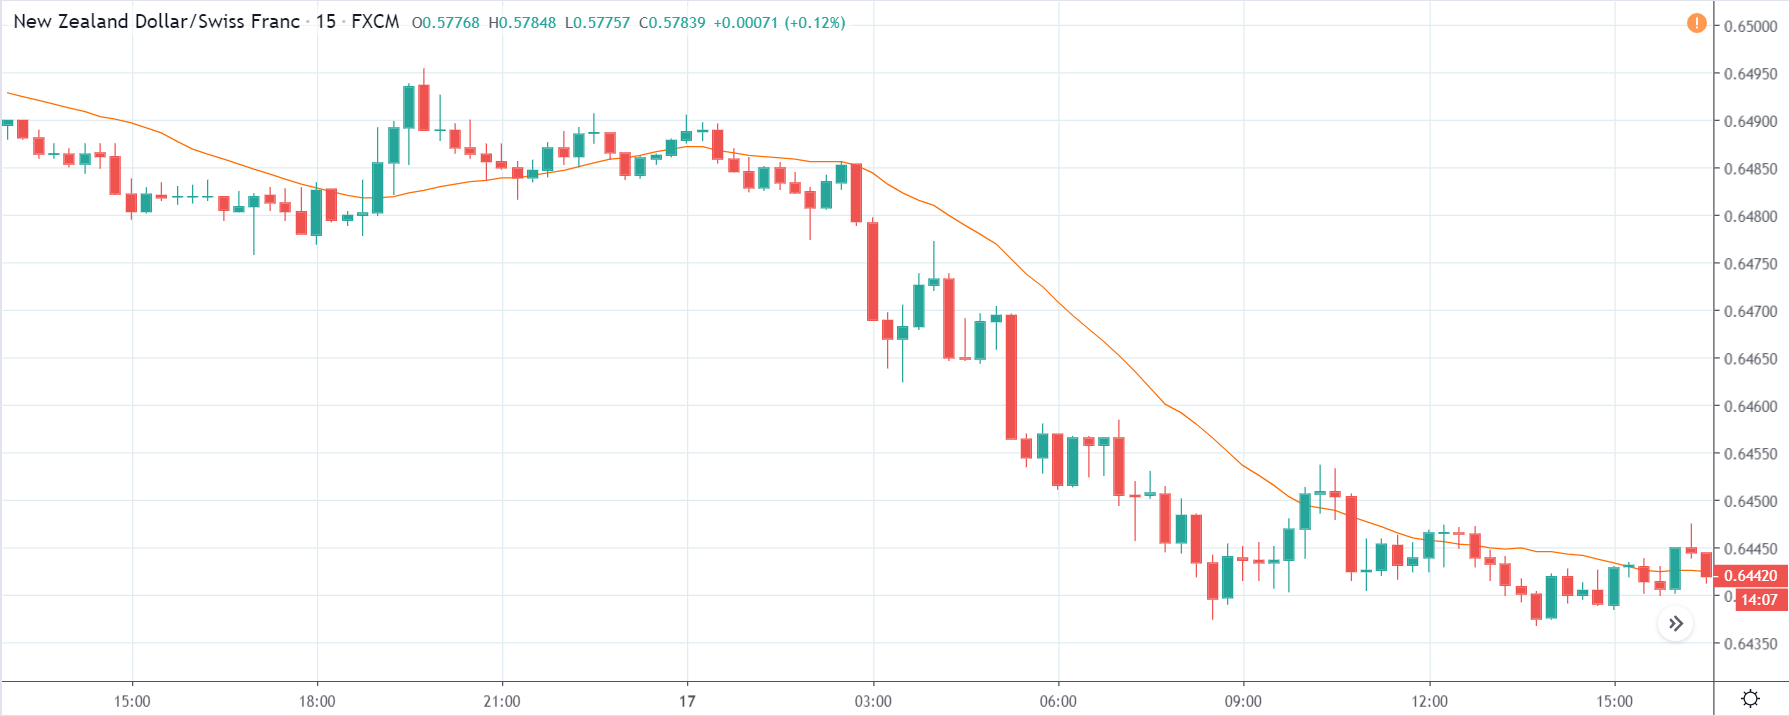
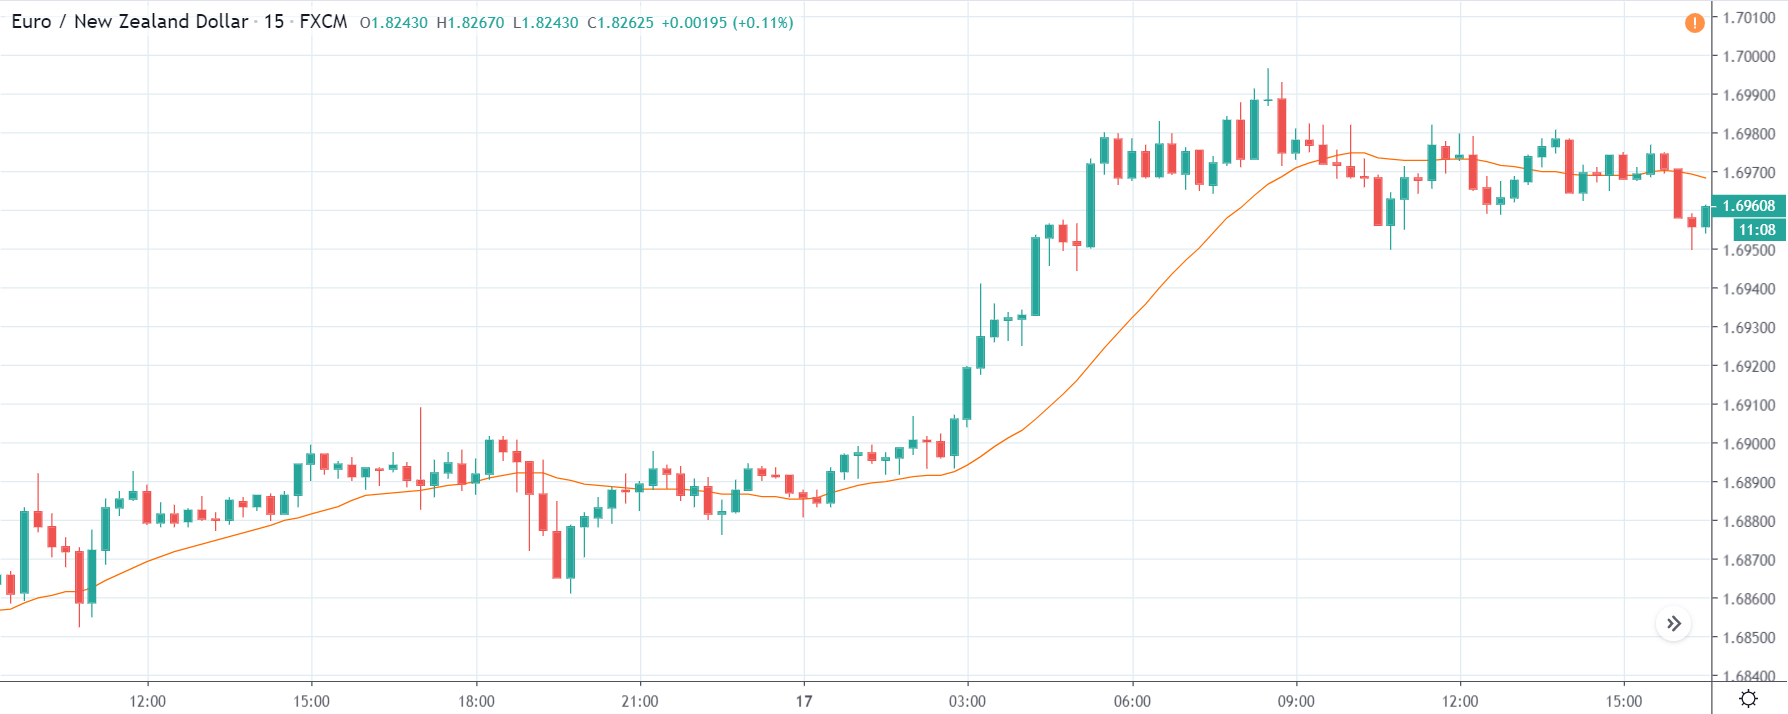
Before the release of the NIESR GDP Estimate, the EUR/GBP pair was trading in a subdued uptrend. The 20-period MA transitioned from a steep rise to an almost flattened trend with candles forming just above it.

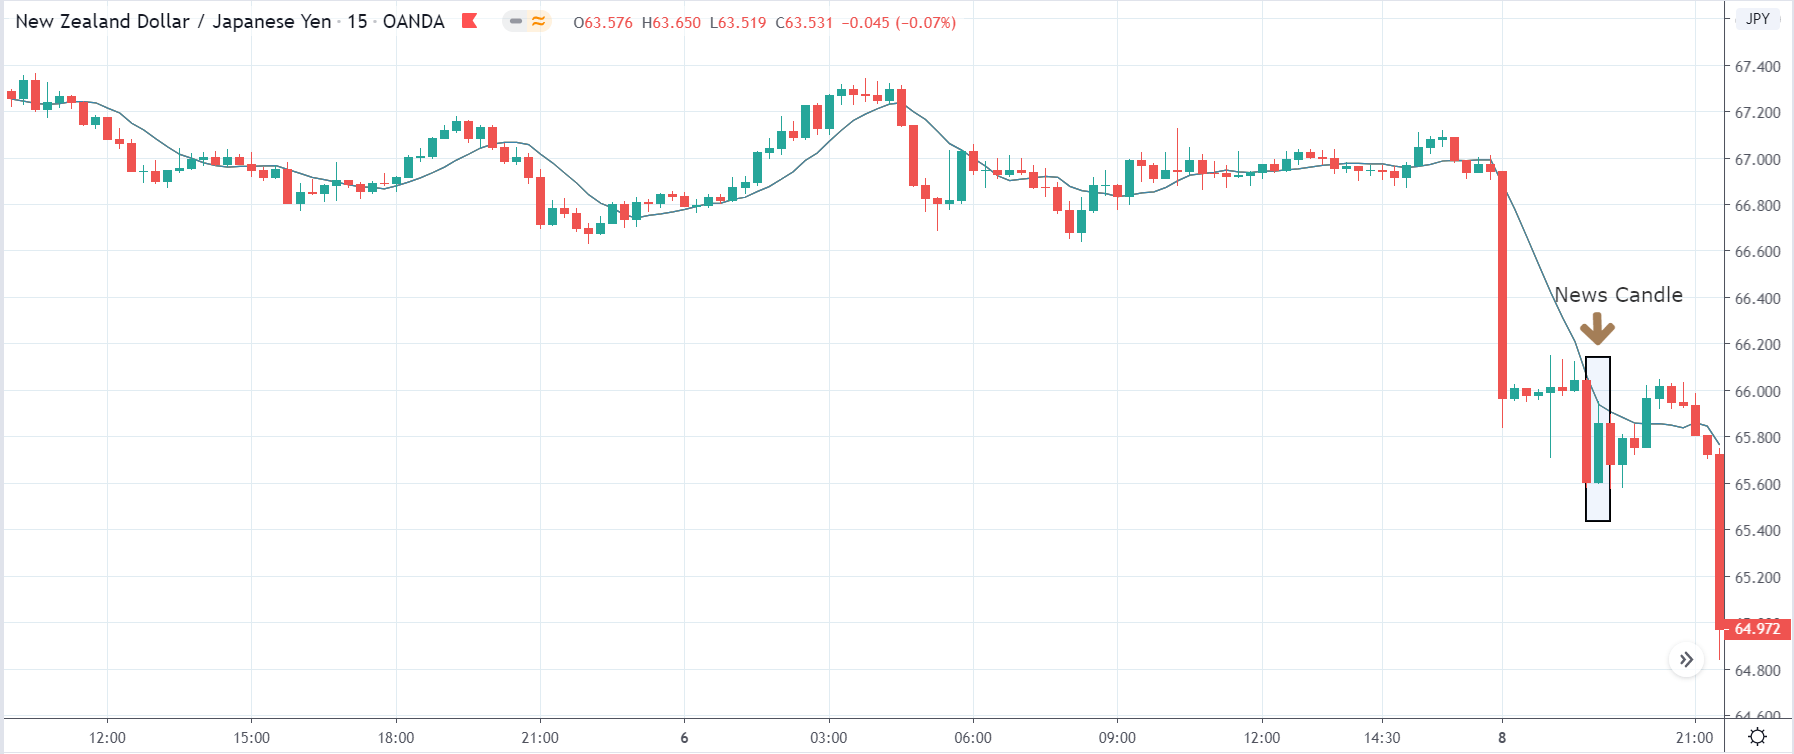
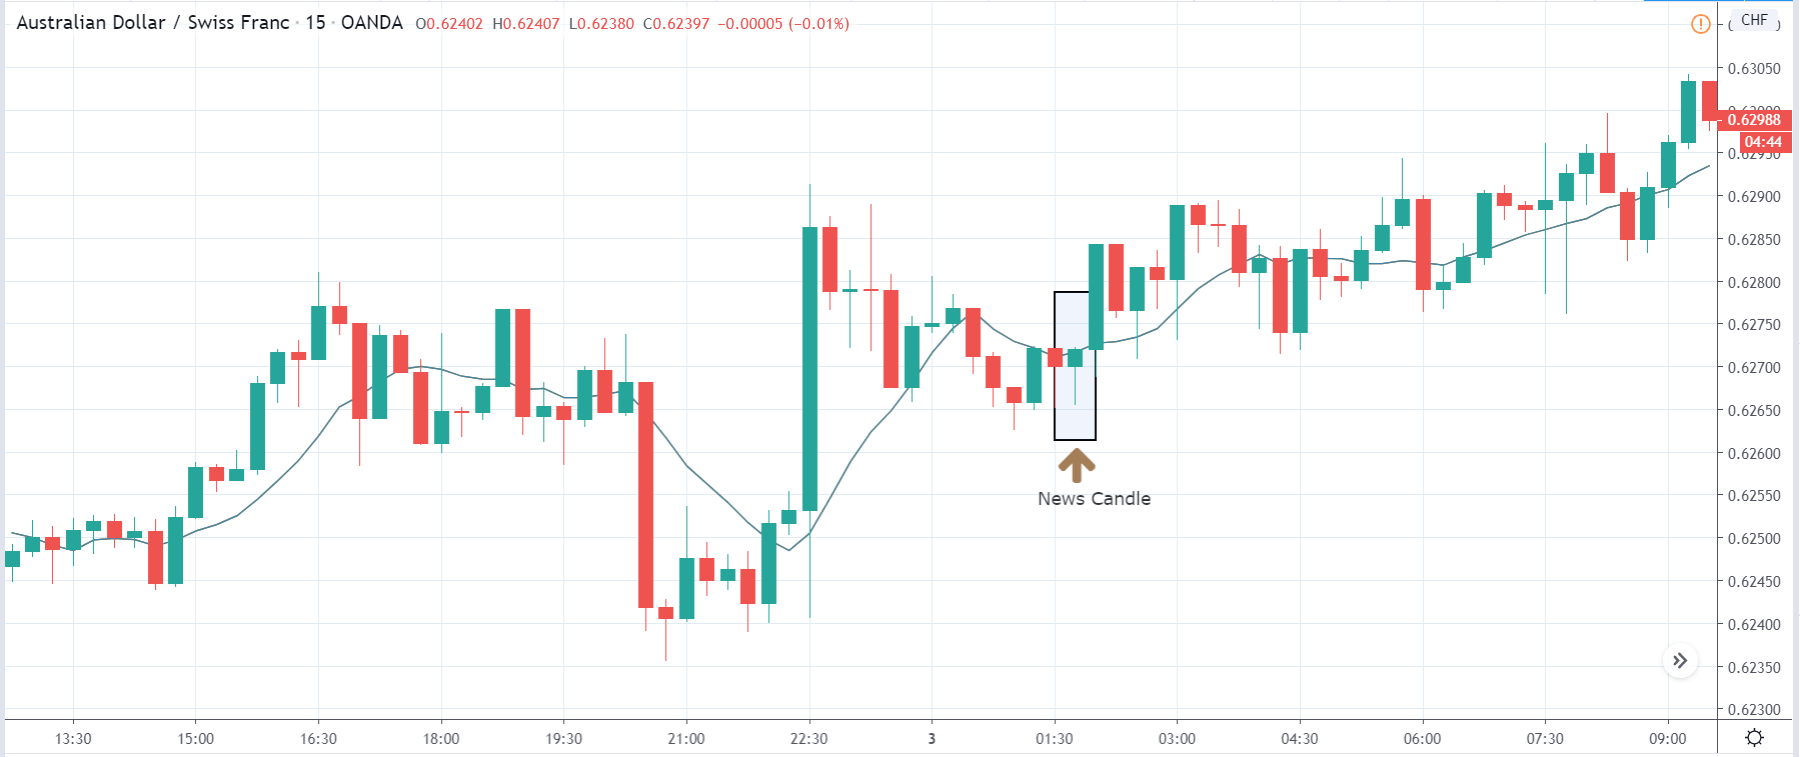
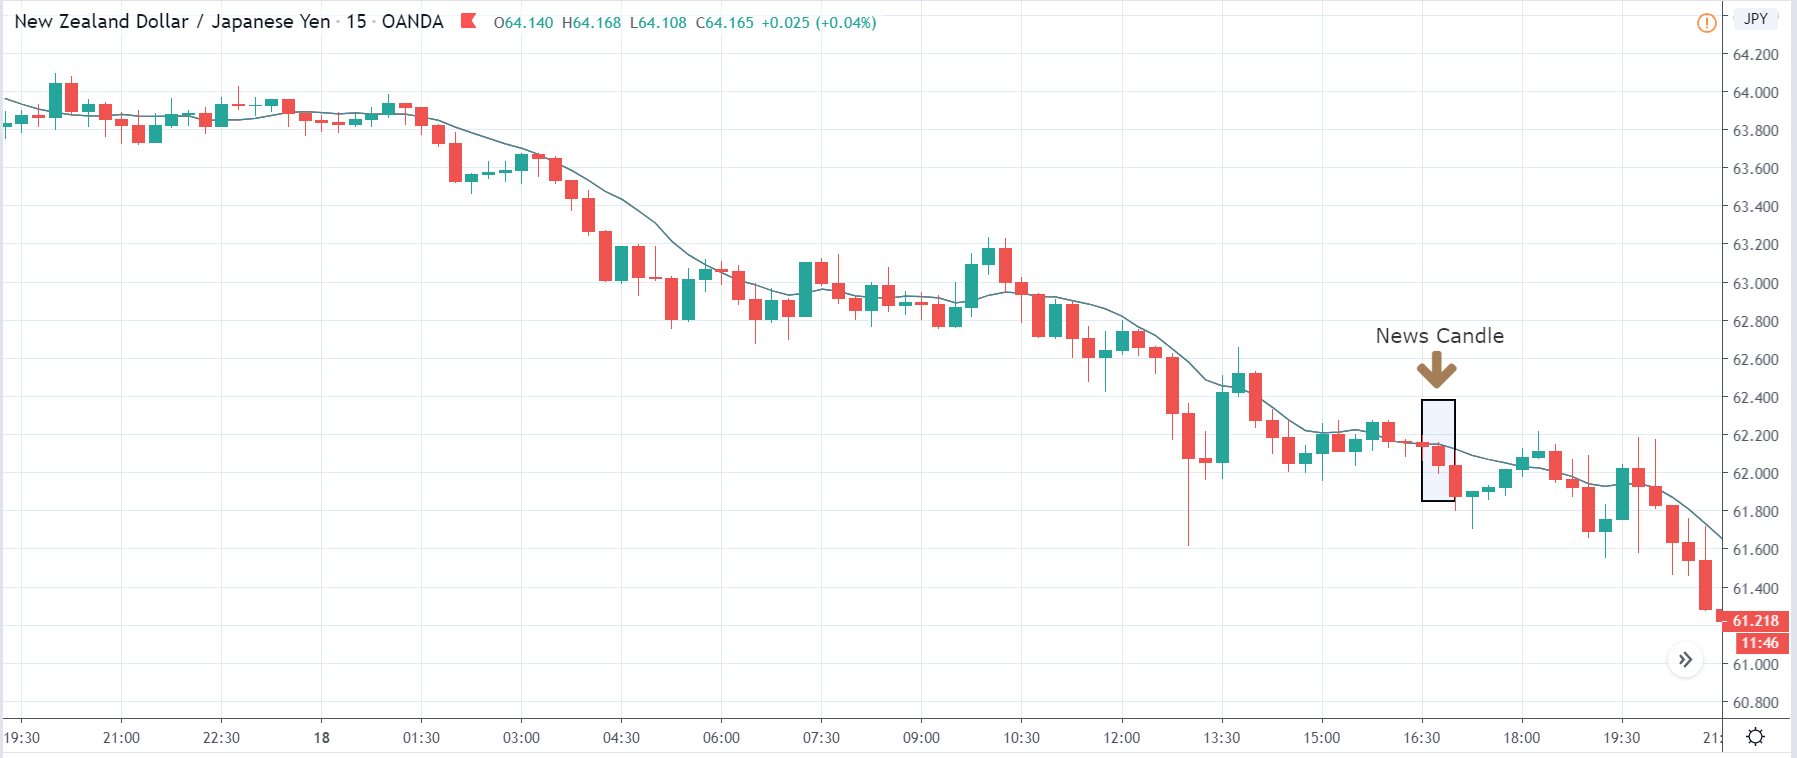
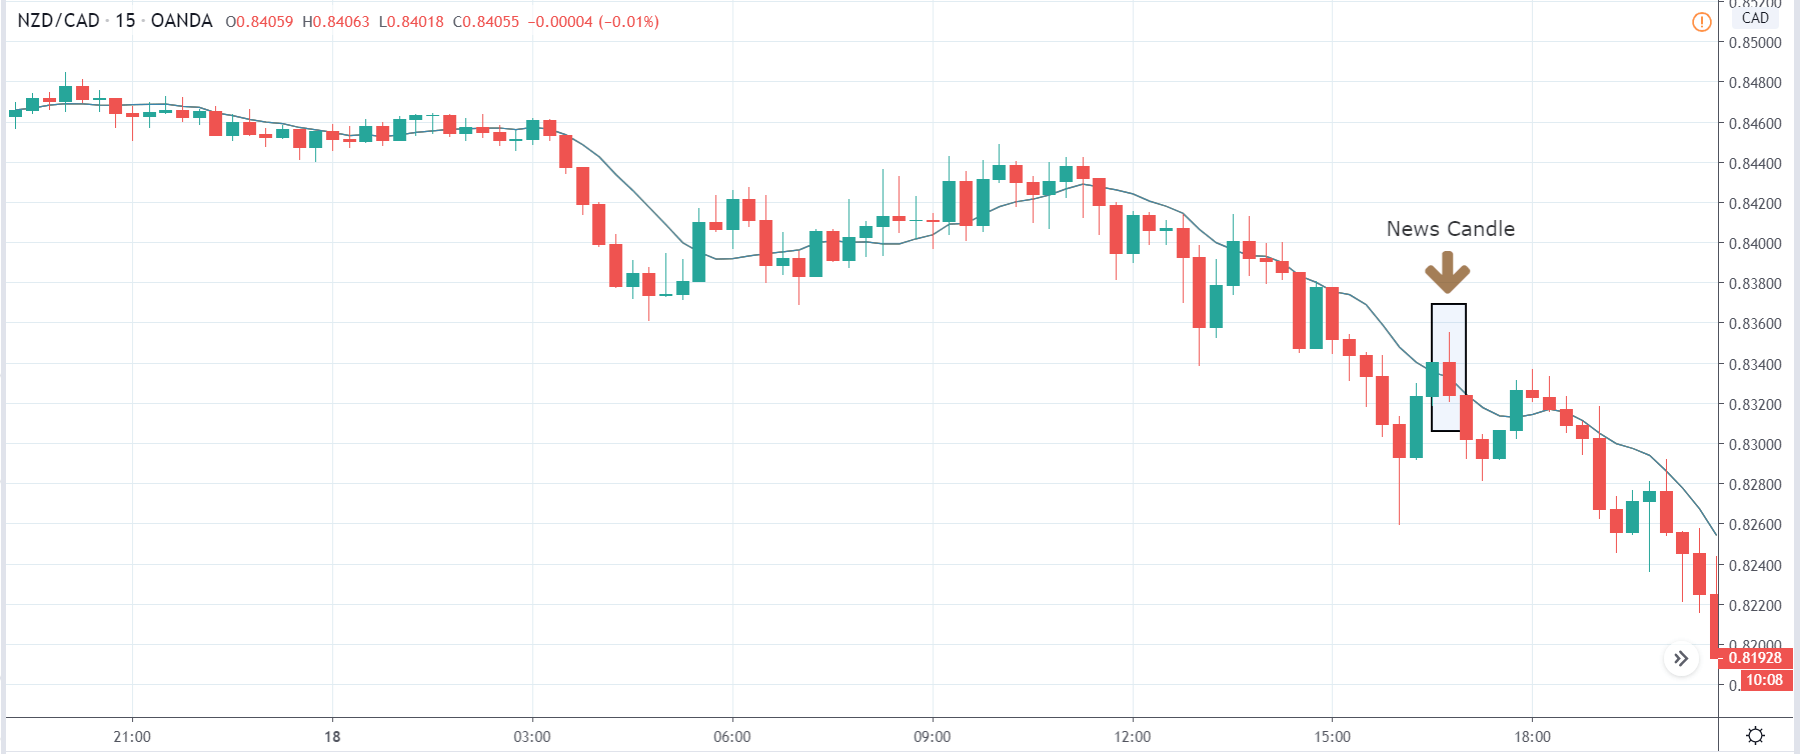
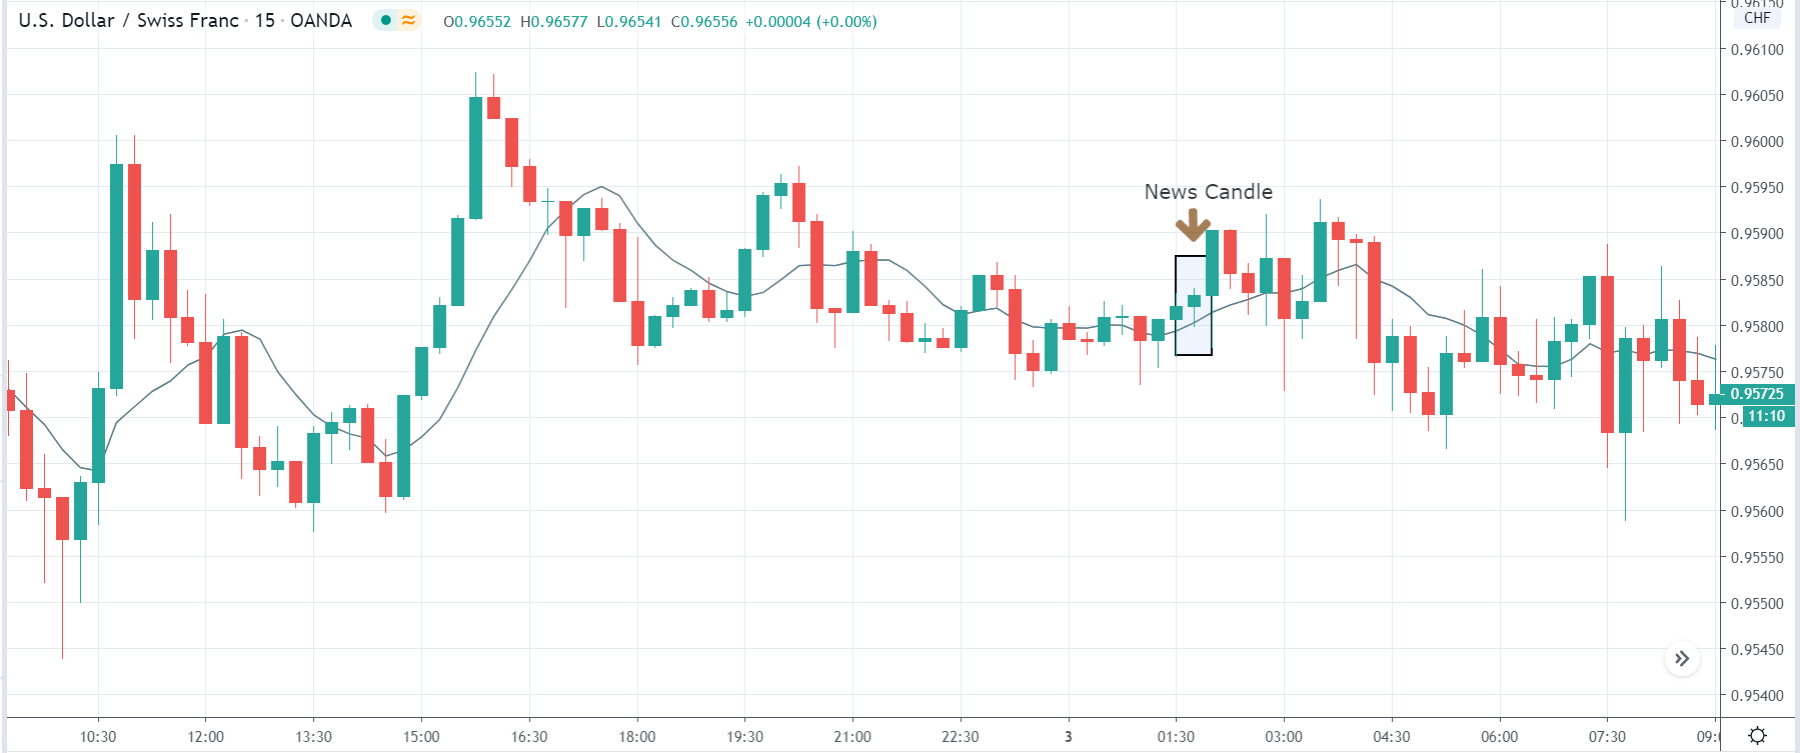
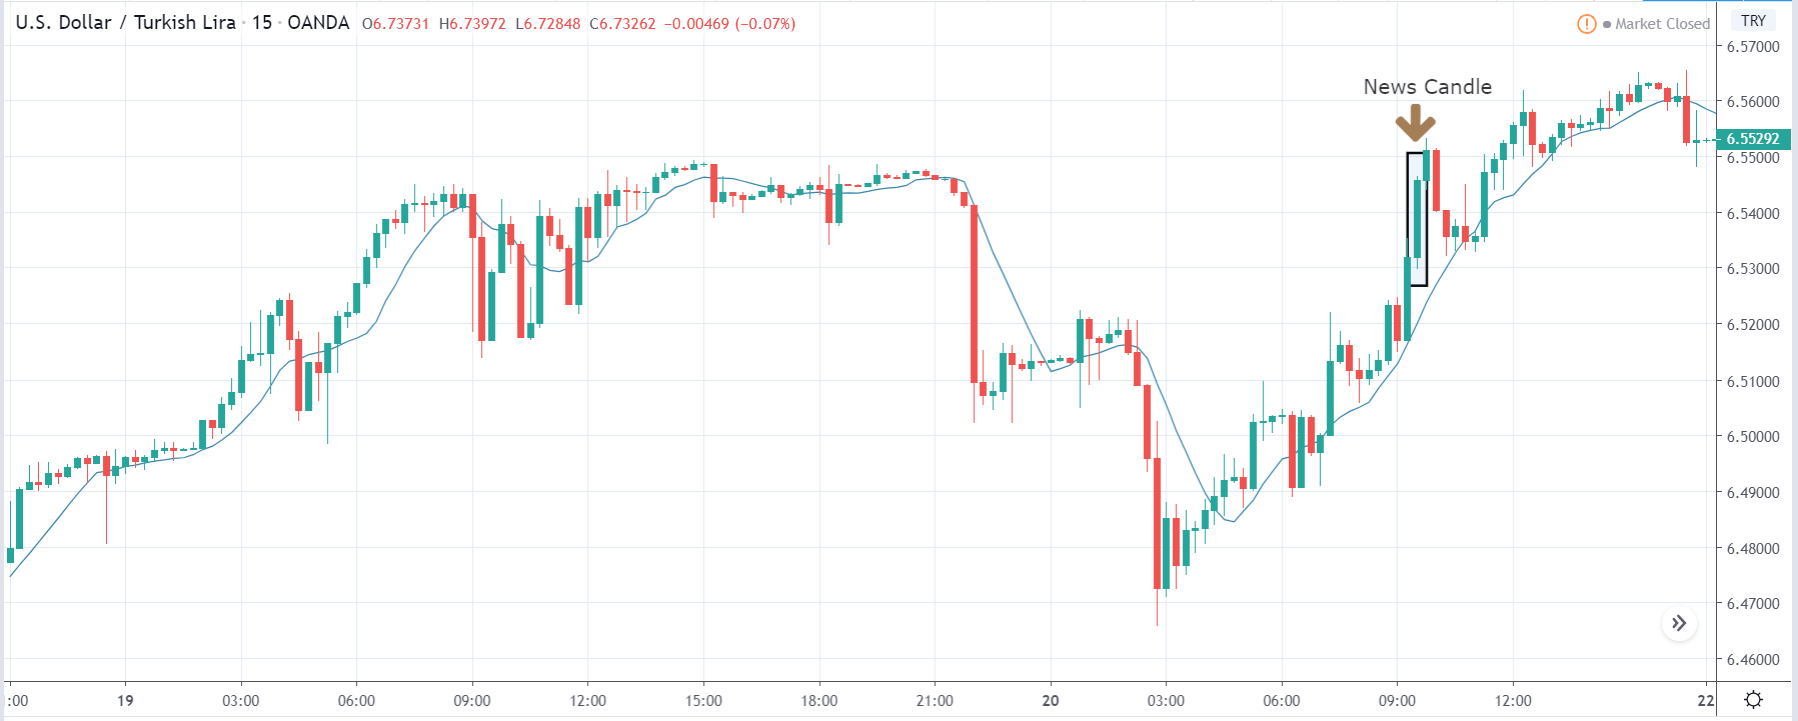
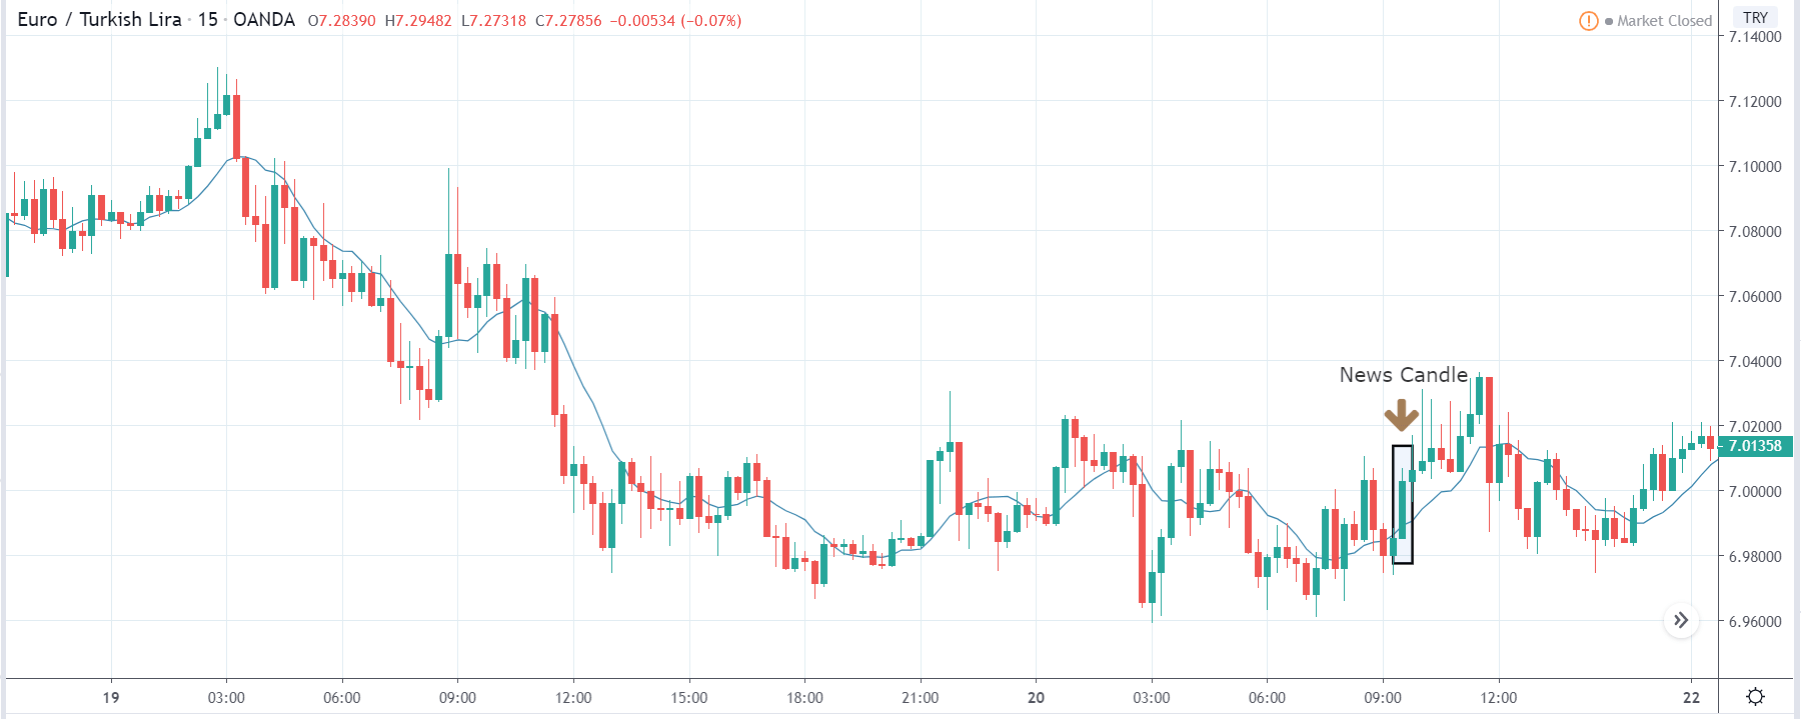
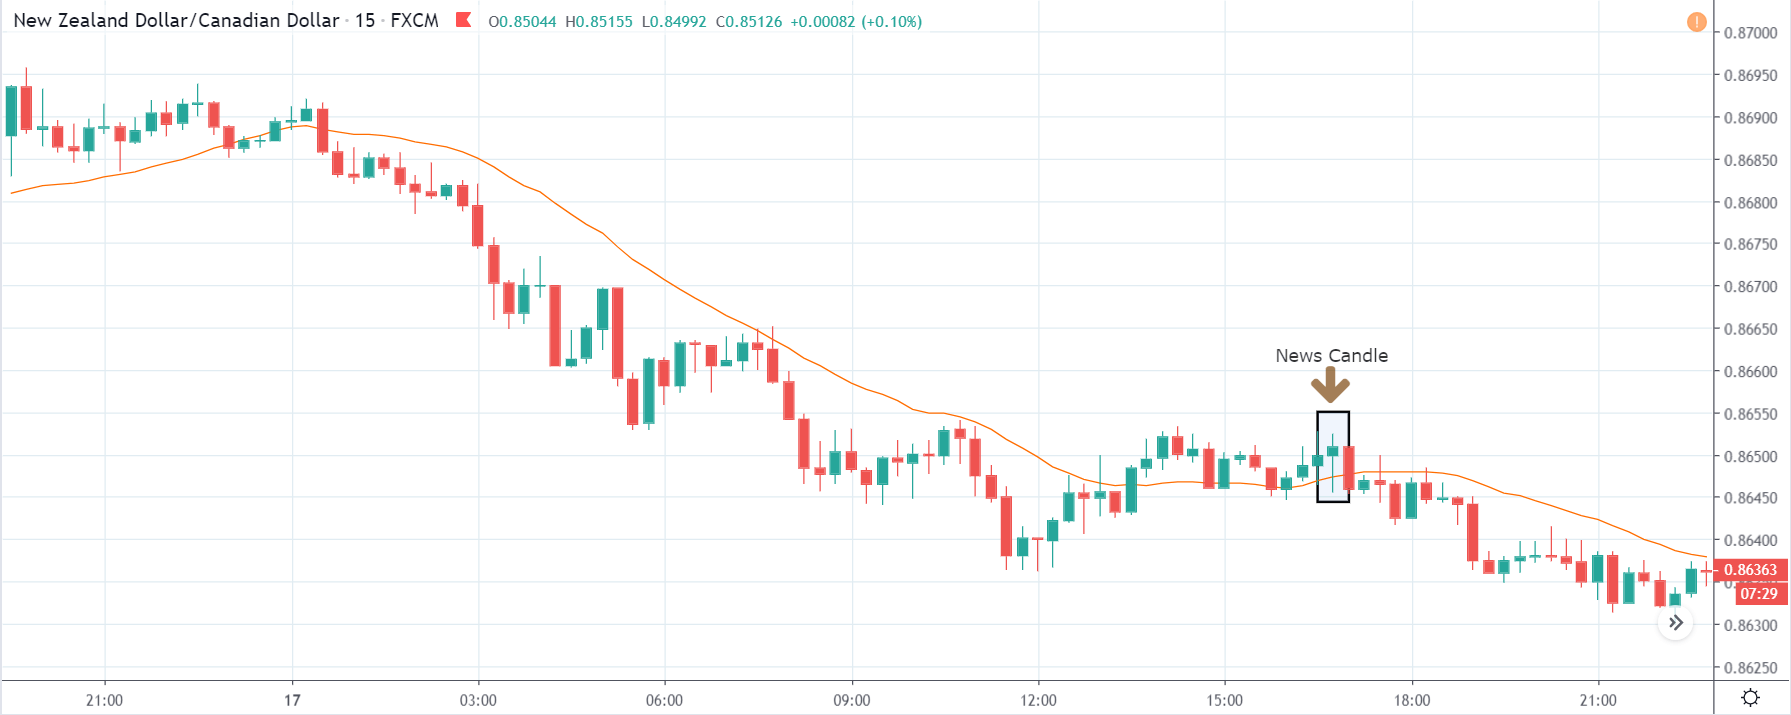
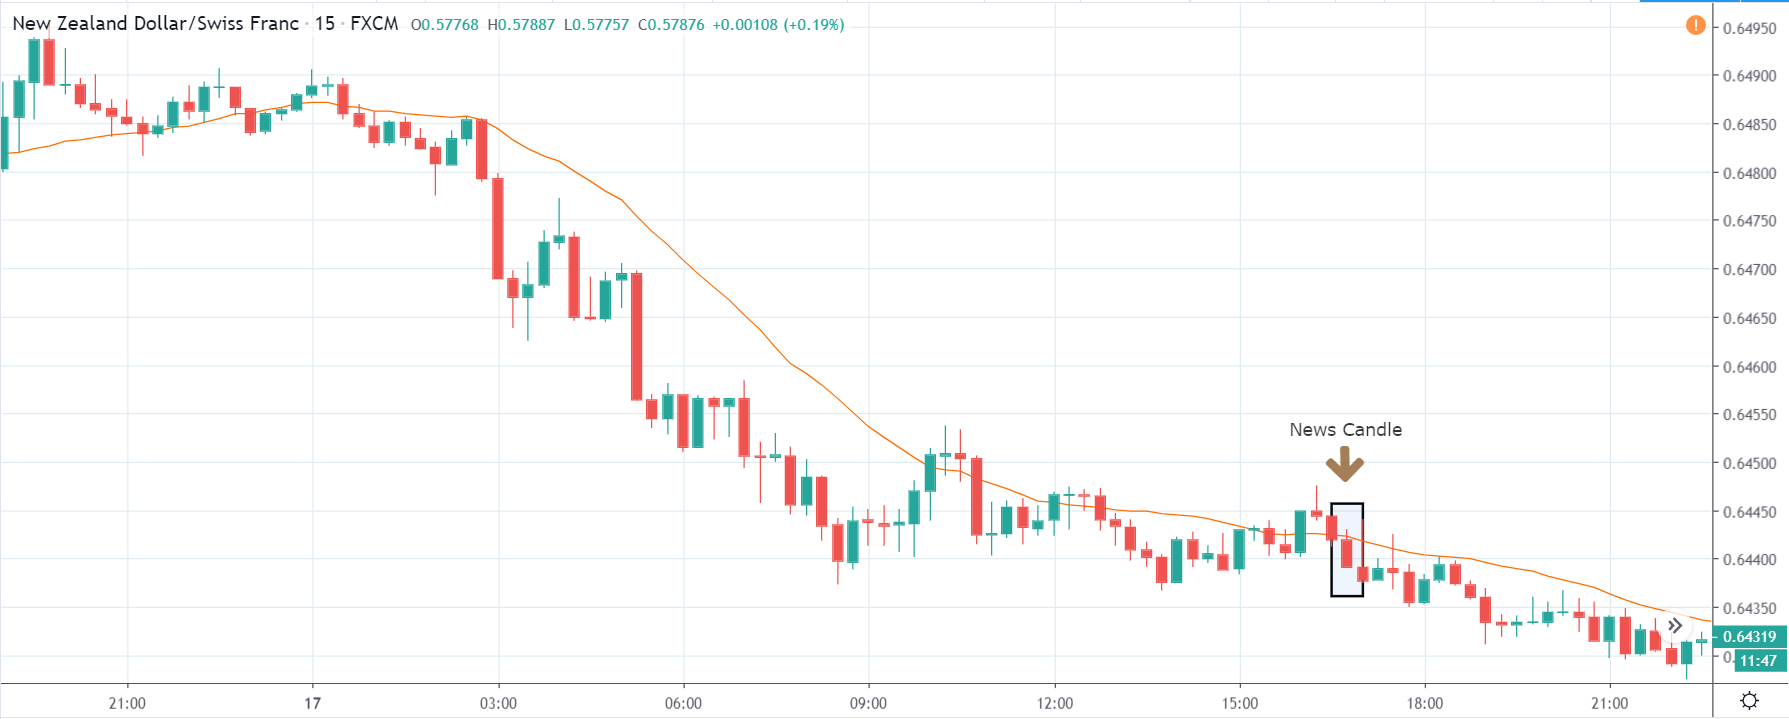
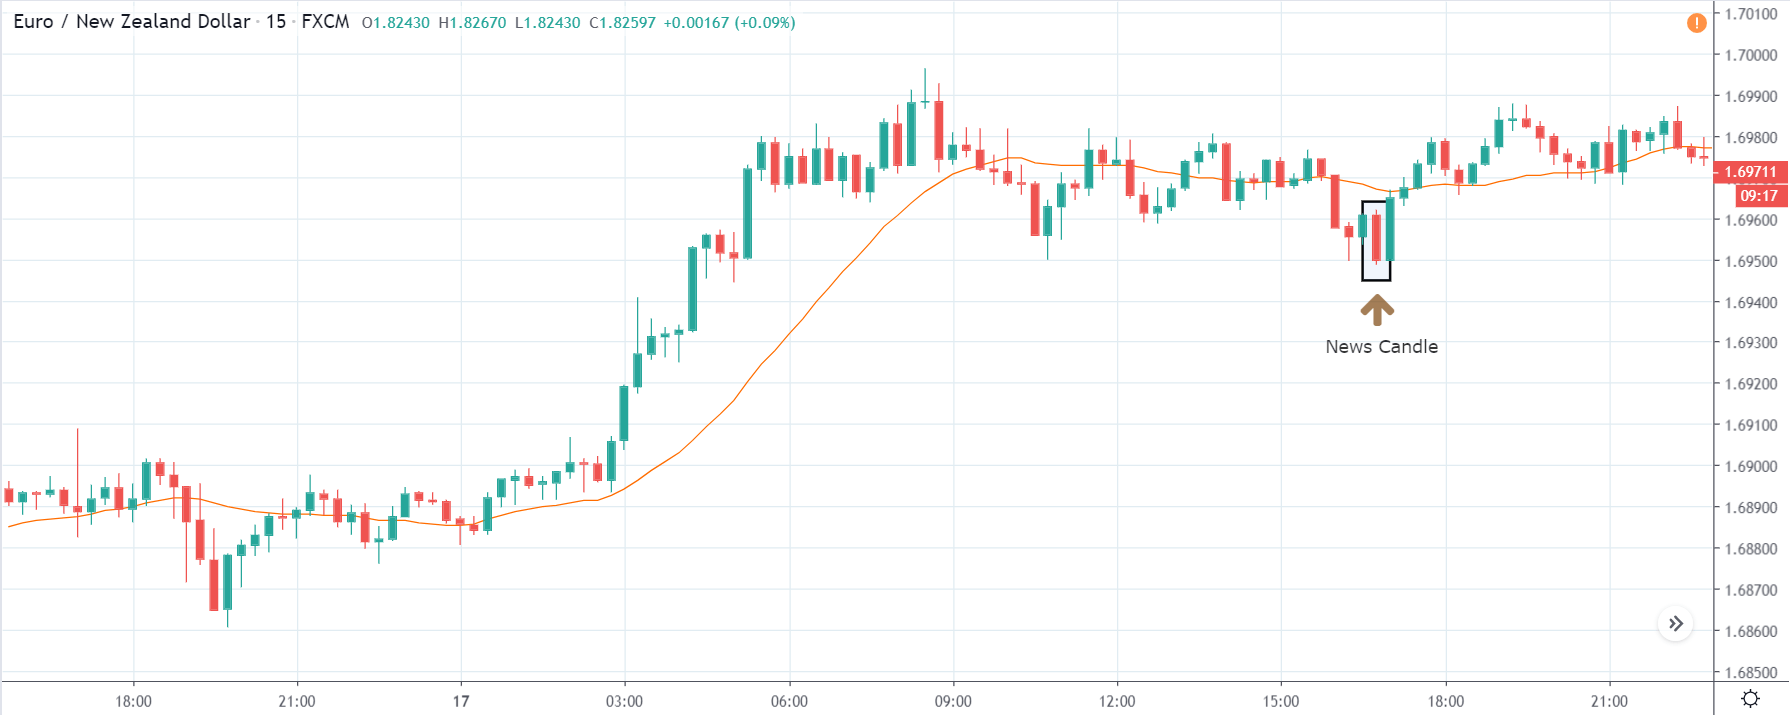
EUR/GBP: After NIESR GDP Estimate Release on October 9, 2020, 
at 11.10 AM GMT

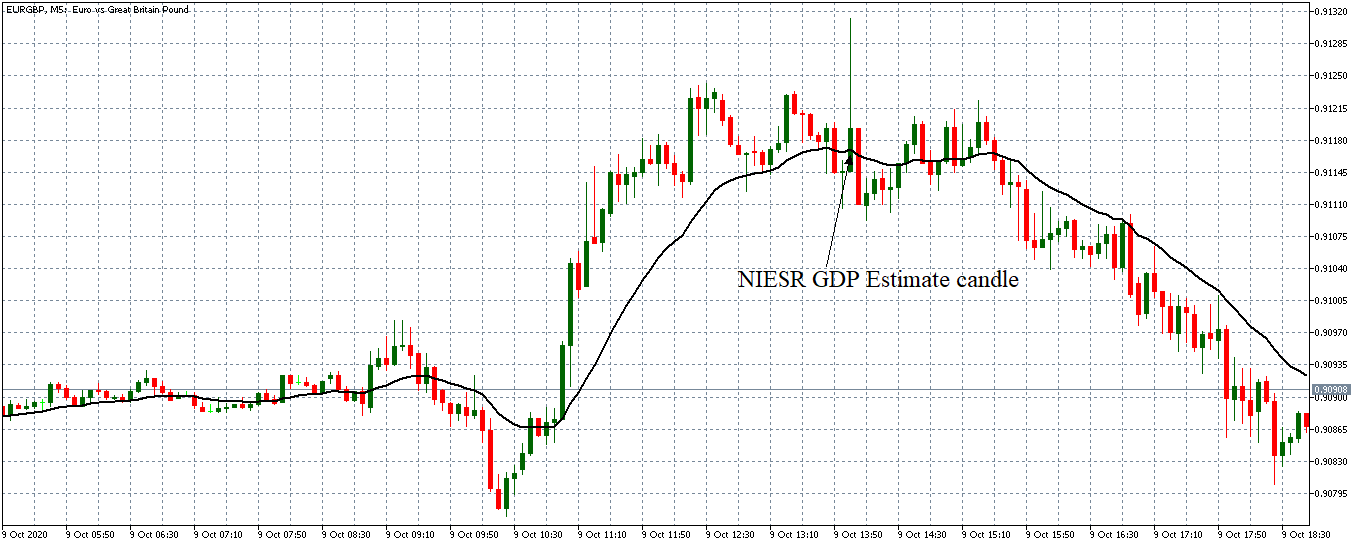
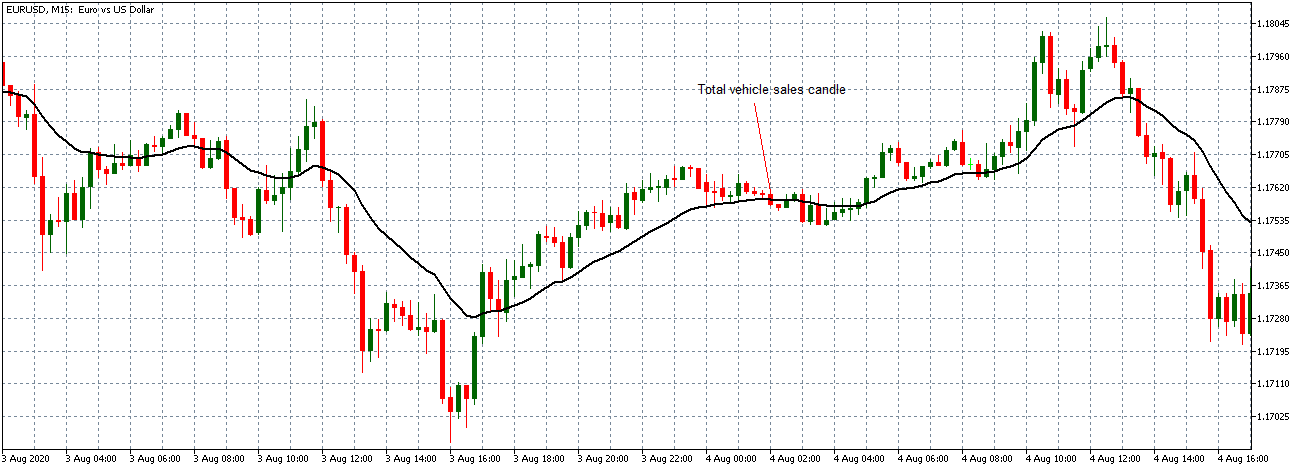
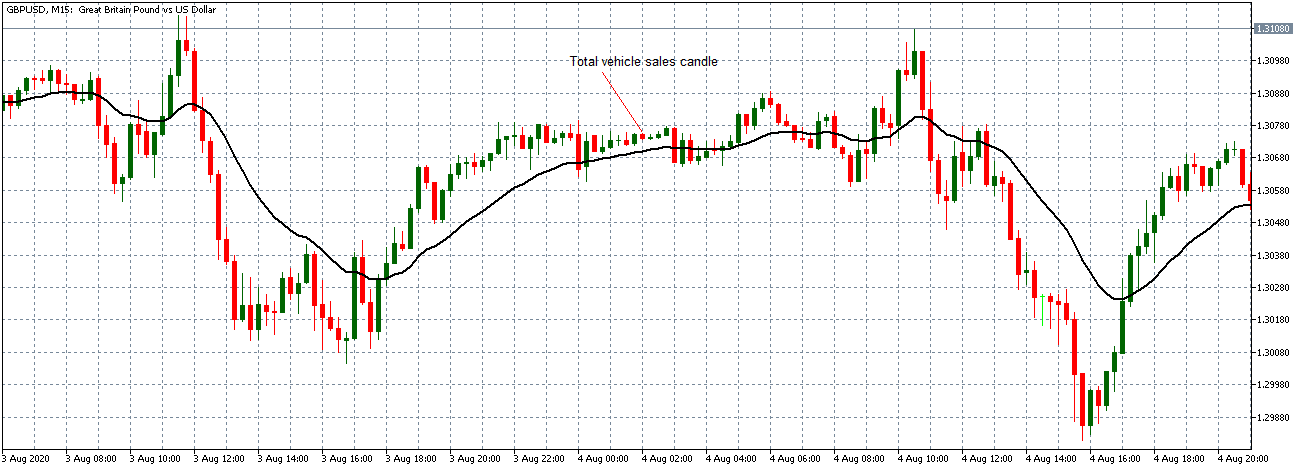
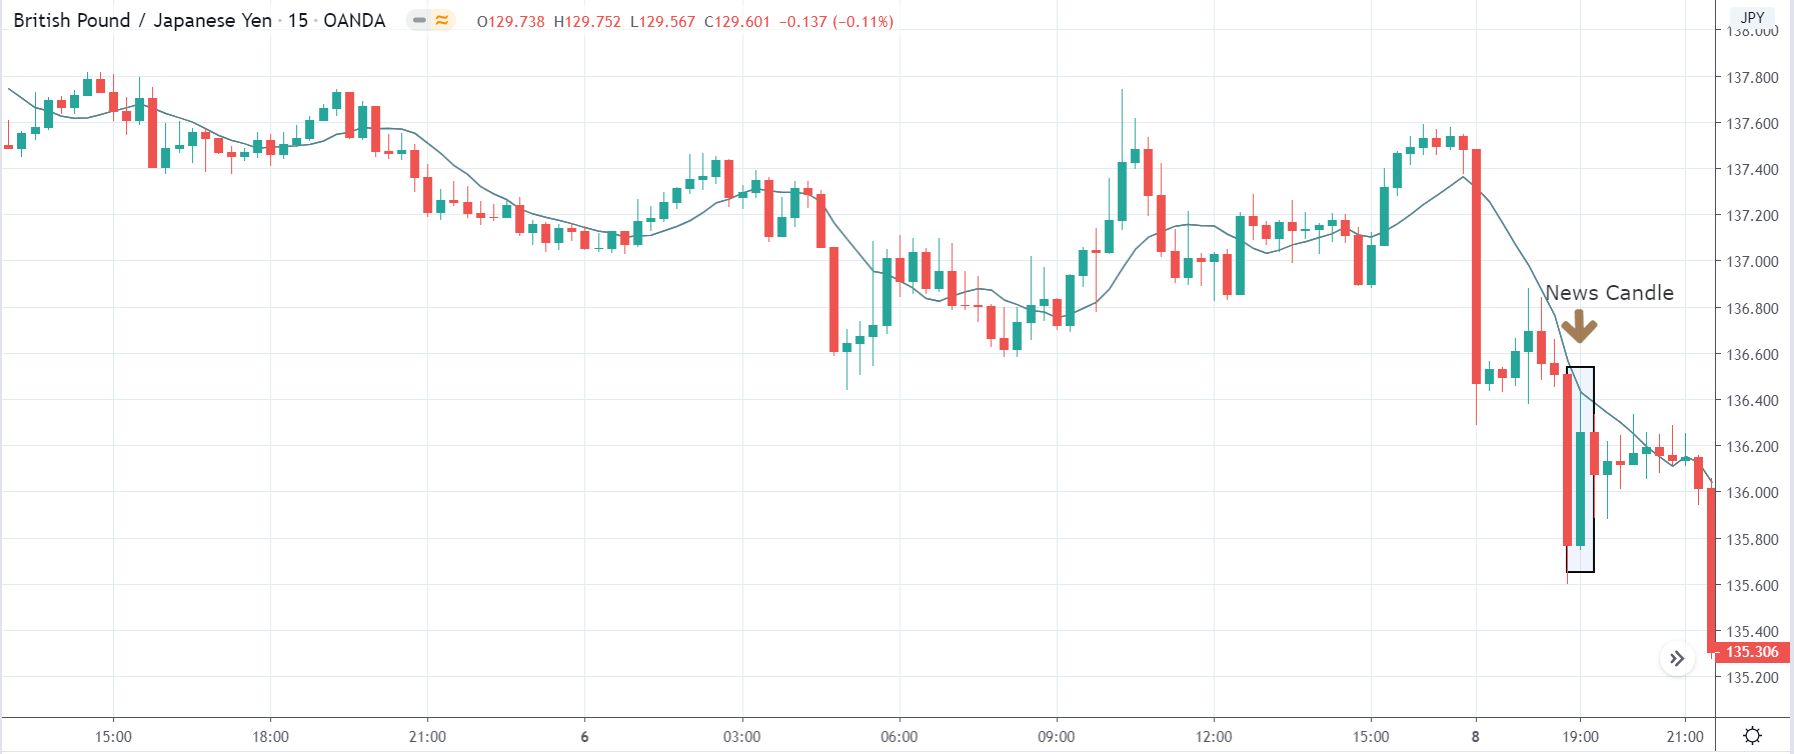
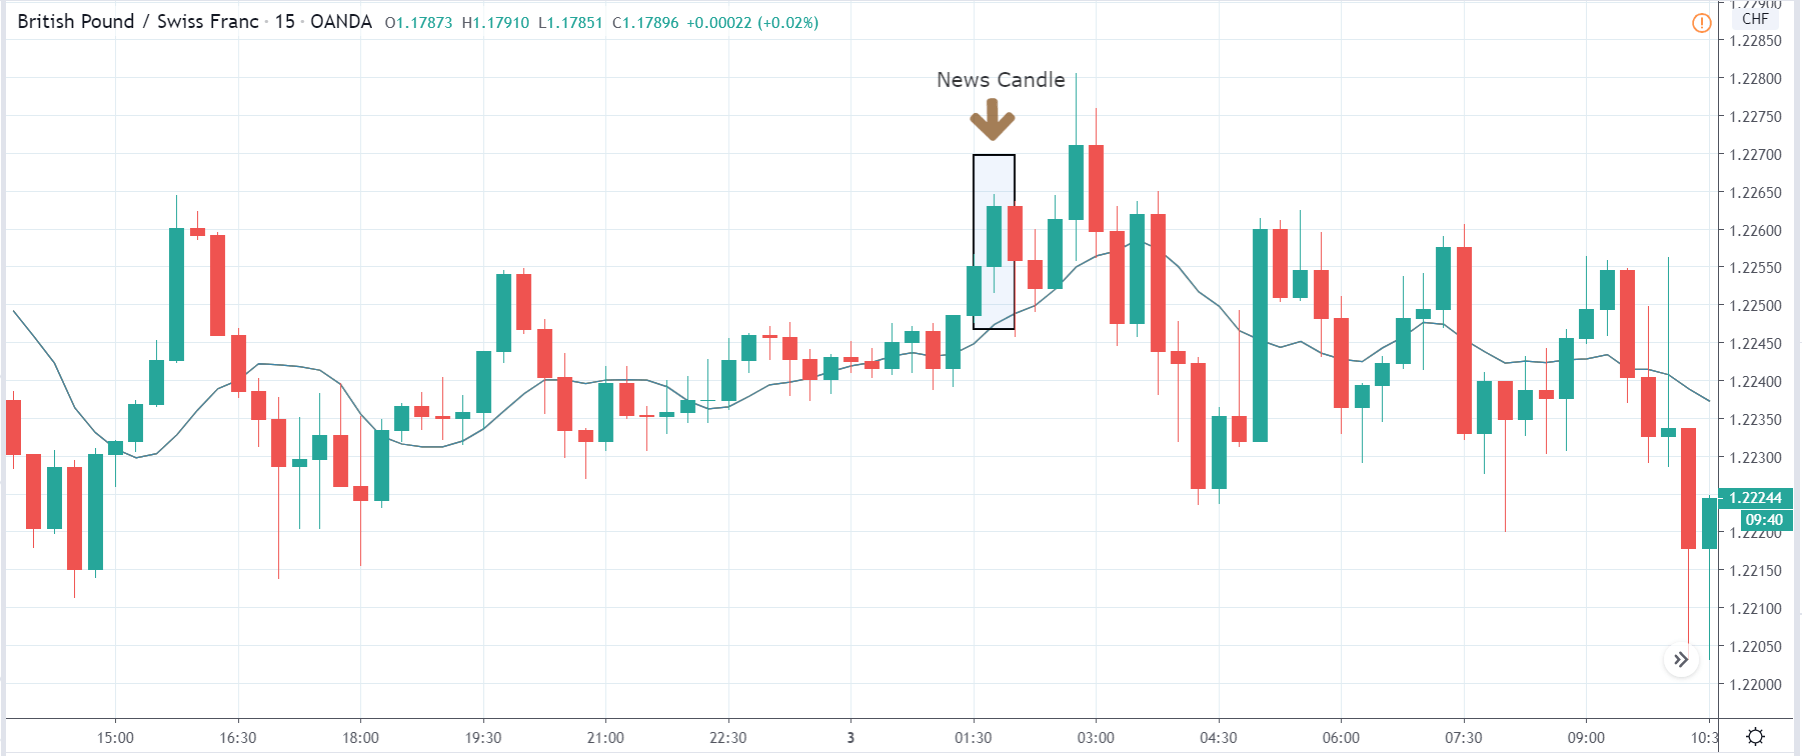
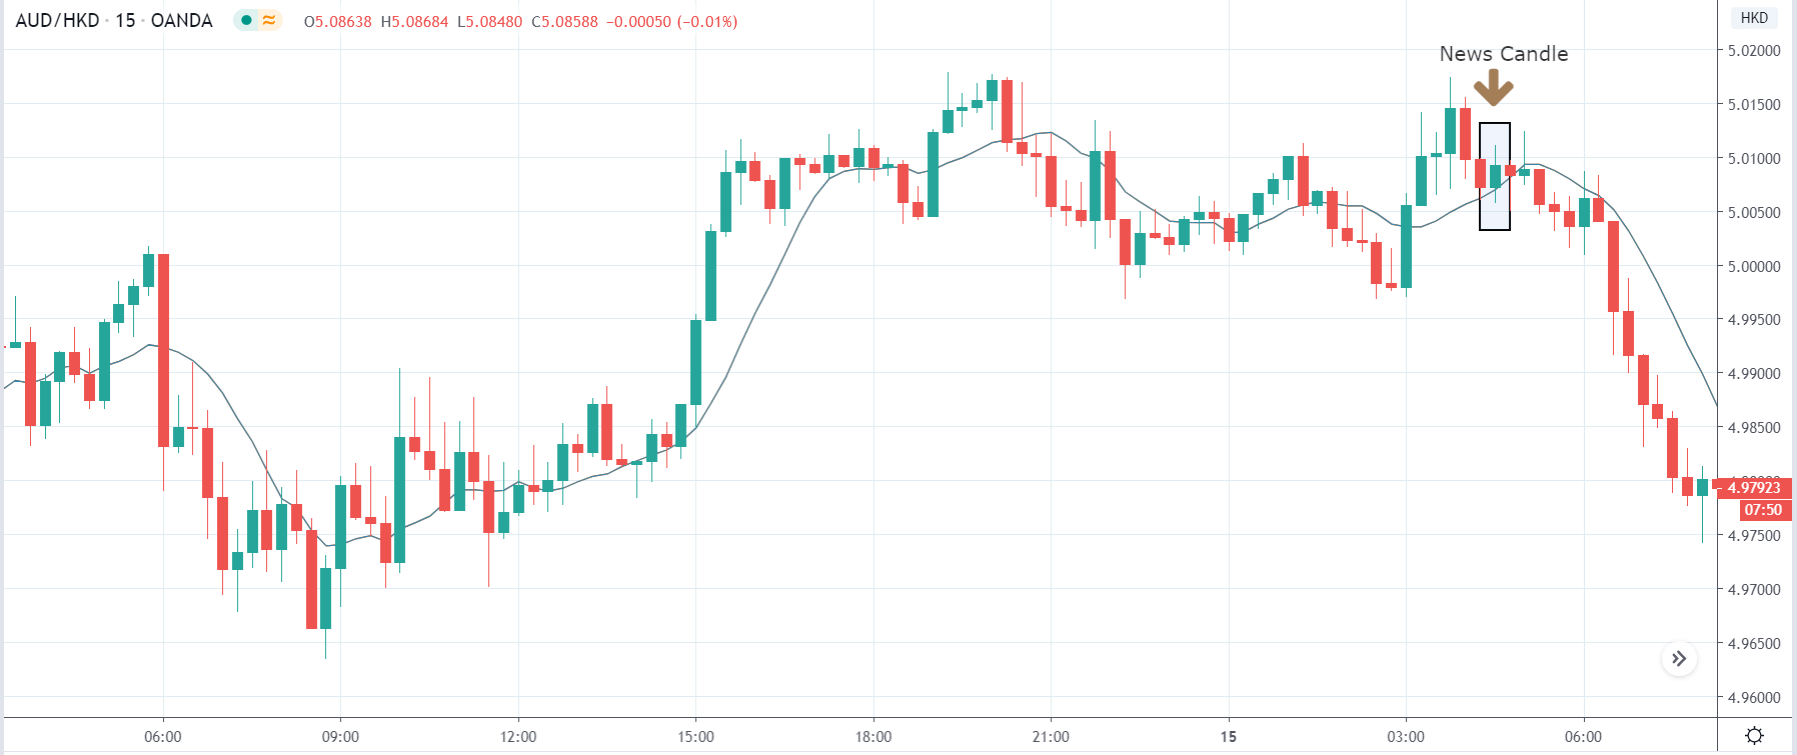
After the GDP estimate release, the EUR/GBP pair formed a 5-minute bullish ‘inverted hammer’ candles with a long wick. This candle represents a period of volatility in the pair as the market absorbed the data. Subsequently, the pair traded in a neutral trend before adopting a steady downtrend with the 20-period MA steeply falling.

Bottom Line

The GDP estimate is not just relevant to investors and policymakers; as shown by the above analyses, it can result in periods of increased volatility in the forex market when it is published. Cheers!

Categories
Forex Fundamental Analysis

The Impact Of ‘Total Vehicle Sales’ Data On The Forex Market

Introduction

Vehicle sales figures offer us much insight into the consumer demand and overall health of the economy. Changes in vehicle sales figures could also be used for predicting the near-future direction of economic growth. Understanding how vehicle sales figures can be used to infer upcoming trends in crucial economic indicators could always give us the advantage of being ahead of the market trend.

What is Total Vehicle Sales?

Total Vehicle Sales represent the overall number of domestically produced vehicles that have been sold. The reports could be monthly, quarterly, or even yearly, depending on the reporting vehicle manufacturing companies. In other words, Total Vehicle Sales is the annualized new vehicles sold count for a given month.

The automotive industry represents a vital component of the United States economy. It makes up about 3% of the total GDP and remains the largest industry in the manufacturing sector. It is responsible for employing lakhs of people in the United States and transacts in billions each year.

How can the Total Vehicle Sales numbers be used for analysis?

At first, the importance of the vehicle sales figure may not be apparent, but vehicle sales serve useful for economic analysis. A vehicle is a significant purchase for people. People buy vehicles when they are confident about their ability to make payments. It is possible only when they have considerable disposable income or procure loans at lower interest rates.

When people’s disposable income is considerable, it means the people are affluent financially and reflects the good health of the economy. On the other hand, when loans are available to more people at lower interest rates, it means there is sufficient monetary stimulus from Central Banks to promote economic growth and money is easy to come by. Such inflationary pressures stimulate economic growth and indicate that the economy is likely to grow steadily.

The increase in vehicle sales figures reinforces the positive affirmations forecasted by other economic indicators like consumer spending or interest rates. As consumer spending comprises more than two-thirds of the GDP, an increase in vehicle sales likely indicates a healthy two or three quarters that are going to continue in the economy.

Equity markets respond and perform exceptionally well around the Total Vehicle Sales figures, as the increasing figures in sales imply increasing profits for the related companies. The increase in profits due to sales is doubled down by the stock prices soaring higher, and vice-versa also holds. Hence, the vehicle sales figures are given much-deserved attention every month by the equity traders and the media. To some degree, currency markets feed off from the equity markets, but the effect is noticeable only when the changes are significant.

Vehicle purchases are considered to be discretionary spending, and when people are paying for such items, it indicates the economy is flourishing. The relation between vehicle sales and economic growth also becomes more apparent during recessions, where vehicle sales drop significantly. During the Great recession of 2007-2009, vehicle sales fell by 3 million.

With rapid development in the automobile industry, more durable vehicles that last longer, unlike older models, are coming into the market.  It means people need not buy new vehicles as frequently as before. Hence, recent trends should incorporate this factor also into the statistics.

Alongside this, there is a shift in the industry due to disruptive brands like Tesla introducing electric cars as a contrast to combustion engines. It affects the industry and the dependent oil and gasoline industries as well. Self-driving and Artificial Intelligence equipped automobiles are catching up with the people, and this could soon invalidate many traditional jobs that came as a result of the regular gasoline cars and trucks.

The current COVID-19 pandemic already cost the economies of most countries much than they could handle, and many industries suffered heavy losses. The silver lining for the automotive industry is coming from the fact that as people resume their regular life by going back to their work require a safe commute. Things are looking brighter for the automobile industry as more people are considering the safety assured through private commute over the risk involved in the public transportation system.

Impact on Currency

Vehicle Sales acts as a coincident indicator that reflects the health of the economy at the current state. The currency markets are focused more on the leading indicators before the trends pick up. Total vehicle sales prove to be more useful for the equity markets for trading on the automobile and other related industries, but currencies require more than just vehicle sales.

Hence, overall Total Vehicle Sales are a low-impact indicator for the FOREX market and are useful in double-checking or reaffirming our leading indicator predictions. Economists and business analysts will use total vehicle sales data to report current economic health, but currency traders can overlook this indicator for other macroeconomic leading indicators.

Economic Reports

The Bureau of Economic Analysis (BEA) provides monthly reports on total vehicle sales on its official website. Apart from this, the St. Louis FRED website also details the same figures historically in a more comprehensive and visually depictive way.

Sources of Total Vehicle Sales

We can obtain Total Vehicle Sales figures for the United States from BEA.

For analysis purposes, the St. Louis FRED website offers better resources and ease of access for Vehicle Sales figures.

We can obtain Global Total Vehicle Sales figures for the majority of the countries from Trading Economics.

How Total Vehicle Sales Data Release Affects The Price Charts

In the US economy, total vehicle sales data is an important leading indicator of consumer spending and consumer confidence. It measures the annualized number of new vehicles sold domestically in the reported month. The most recent data related to this was released on August 3, 2020, at 7.00 PM ET. The total vehicle sales is a combination of all car sales and all truck sales data and can be accessed from Investing.com here. The historical data of total vehicle sales can be accessed from Trading Economics here.

The screengrab below is of the monthly total vehicle sales from Investing.com.

As can be seen, the total vehicle sales data is expected to have a low impact on the USD upon its release.

The screengrab below shows the most recent changes in the monthly total vehicle sales data in the US. In July 2020, the monthly total vehicle sales were 14.5 million compared to 13.1 million in June 2020. This increase is expected to be positive for the USD.

Now, let’s see how this release made an impact on the Forex price charts.

EUR/USD: Before Monthly Total Vehicle Sales Release on August 
2020, Just Before 7.30 PM ET

From the above 15-min EUR/USD chart, the pair can be seen to be trading on a neutral trend before the release of the total vehicle sales data. This trend represents a period of relative market inactivity with candles forming near a flattening 20-period Moving Average.

EUR/USD: After the Monthly Total Vehicle Sales Release on 
August 2020, 7.30 PM ET

After the data release, this Forex pair formed a 15-minute bearish candle, indicating that the USD became stronger as expected due to the increase in total vehicle sales. The data release was, however, not significant enough to cause any market volatility as the pair continued to trade in a neutral trend with the 20-period Moving Average flattening.

GBP/USD: Before Monthly Total Vehicle Sales Release on August 
2020, Just Before 7.30 PM ET

Similar to the trend that we have observed with the EUR/USD pair, the GBP/USD was trading in a neutral pattern before the data release with candles forming around a flattening 20-period MA.

GBP/USD: After the Monthly Total Vehicle Sales Release on 
August 2020, 7.30 PM ET

After the news announcement, this pair formed a 15-min bearish candle but continued trading in the neutral trend observed before the data release.

AUD/USD: Before Monthly Total Vehicle Sales Release on August
2020, Just Before 7.30 PM ET

AUD/USD: After the Monthly Total Vehicle Sales Release on 
August 2020, 7.30 PM ET

As observed with the EUR/USD and the GBP/USD pairs, the AUD/USD traded within a subdued neutral trend before the data release. The pair formed a 15-minute bearish candle after the news release, but unlike the other pairs, it continued trading in a weak uptrend.

Although it plays a vital role as an indicator within the economy, it is evident that the total vehicle sales indicator does not cause any significant impact on the price action in the forex markets.

Categories
Forex Fundamental Analysis

Understanding What ‘GDP Deflator’ Is & Its Relative Impact On The Forex Market

Introduction

Investors and traders are continuously trying to determine which country is growing relatively faster to make currency investment decisions. Assessing growth for capitalist economies that use inflation as fuel can be tricky to understand. The differentiation between nominal and real growth, effects of inflation, and the role of a deflator are necessary to understand to arrive at correct conclusions from statistics.

What is GDP Deflator?

Most of the economies that we have today are capitalist economies and use inflation as the primary fuel for growth. Currency traders want to go “long” on currencies of countries that are experiencing relatively higher growth than other countries. Hence, a correct assessment of growth is crucial.

The broadest and most widely used measure of the growth of economies is the Gross Domestic Product (GDP). The GDP is the monetary measure of all goods and services produced within a country for a given period (quarter or year). Although, before GDP, Gross National Product (GNP) was widely used to compare growth amongst economies. GNP measures growth beyond borders and has certain limitations in its usage as a growth measure.

GDP Deflator

It is also known as GDP Price Deflator or Implicit price deflator. It measures the price changes in all goods and services produced within an economy. It measures inflation at the macroeconomic (or national) level. As prices of commodities increase over time, the GDP values are “inflated” over time.

For instance, a country that has a GDP of 10 million dollars for the year 2019 and 12 million dollars for the year 2020 would appear to have grown 20%. If the inflation rate for the duration was 10%, meaning the prices rose by 10% for all the commodities, then 1 million dollars out of 12 million dollars came purely through increased prices and not increased production. Hence, in 2020, the real GDP was only 11 million dollars. Therefore, real growth was only 10% instead of 20%.

The Nominal and Real GDP figures are vital to understand and measure the level of inflation by calculating the GDP deflator. The following formula gives the GDP deflator:

Here, the nominal GDP is the total dollar value of all commodities produced in an economy without accounting for inflation. It is a direct monetary measure of goods and services. Real GDP is the inflation-adjusted value of GDP. It strips away the effect of inflation from Nominal GDP to show real growth.

Deflators like the Real GDP also have a base year against which all other years’ figures are compared. For the United States, 2012 is the base year, meaning GDP deflator value for the year 2012 would be 100 (as nominal and real GDP would be equal due to zero inflation). Subsequent years will have higher or lower values accordingly to indicate inflation and deflation, respectively. The base year varies from country to country.

How can the GDP Deflator numbers be used for analysis?

It is essential to understand how inflation masks the real growth and leads us to make the wrong conclusions. As seen in the above example, countries may show higher and higher GDP figures, but in reality, they may have only achieved little or no growth at all. When comparing growth over several years, the GDP deflator is key to the analysis to strip away the effects of inflation. By employing the equation above, if we get a deflator score of say 110, it would indicate there is a 10 percent inflation during the observed period.

The Consumer Price Index (CPI) is the most popular and widely used indicator to measure inflation. The GDP deflator has some advantages over the CPI. As the CPI measures inflation for a fixed basket of goods and services, which does not change frequently, the GDP is a macroeconomic aggregate measure of inflation. The GDP deflator factors in any change in economic output and investment patterns. Any new change in the goods produced or change in the consumption patterns of people is accounted in by the GDP deflator, unlike CPI. The CPI basket is static and cannot account for commodities price changes that are not in the basket, whereas the deflator is all-inclusive in this regard.

It is also necessary to know that CPI includes the most commonly used goods and services that have an impact on the economy. It updates its basket as patterns change over the years. Hence, over time the GDP deflator and the CPI have similar trends and can be used interchangeably.

Impact on Currency

The GDP deflator is a basic measure of inflation that erodes currency value. It is an inversely proportional lagging indicator. High values of the deflator are bad for the currency value and vice-versa. Since it is one of the measures of inflation, it is a low-impact lagging indicator as it is not as popular and as frequent as the CPI. It is a quarterly statistic, whose effects are already priced in through more frequent inflation measuring statistics.

Economic Reports

The Bureau of EA releases quarterly reports of the GDP price deflator alongside the quarterly GDP figures on its official website for the United States. GDP and deflators are essential macroeconomic indicators, and therefore are available on the World Bank and many other international organizations like the OECD, IMF, etc.

Sources of GDP Deflator

The BEA releases its quarterly GDP deflator statistics on its official website for the public.

The World Bank also maintains GDP and GDP deflator statistics for most countries on its official website.

Deflator figures for most countries can be easily found on the Trading Economics website.

How GDP Deflator Data Release Affects The Price Charts

In the US, the GDP deflator is released by the Bureau of Economic Analysis quarterly, about 30 days after the quarter ends. It measures the annualized change in the price of all goods and services included in gross domestic product; and is the broadest inflationary indicator. The most recent data was released on July 30, 2020, at 8.30 AM ET can be accessed at Investing.com here. An in-depth review of the GDP deflator data release can be accessed at the Bureau of Economic Analysis website.

The screengrab below is of the GDP deflator from Investing.com. On the right, a legend indicates the level of impact the fundamental indicator has on the USD.

As can be seen, GDP deflator data is expected to have a medium impact on the USD after its release.

The screenshot below shows the most recent changes in the GDP deflator in the US. The GDP deflator changed by -2.1%, worse than analysts’ expectations of a 1.1% change. This change is expected to the negative for the USD.

Now, let’s see how this release made an impact on the Forex price charts.

EUR/USD: Before the GDP Deflator Data Release on July 30, 
2020, Just Before 8.30 AM ET

Before the news release, the EUR/USD pair traded in a neutral pattern. This trend is evidenced by the 15-minute candles forming on an already flattened 20-period Moving Average, as shown in the above chart.

EUR/USD: After the GDP Deflator Data Release on July 30, 
2020, at 8.30 AM ET

After the data release, the pair formed a 15-minute “hammer” candle. This trend is as expected since the USD weakened against the EUR. The data release was significant enough to cause a change in the market trend. The market adopted a steady bullish stance as the pair traded in an uptrend with the 20-period Moving Average steeply rising.

GBP/USD: Before the GDP Deflator Data Release on July 30, 
2020, Just Before 8.30 AM ET

Unlike the EUR/USD pair, the GBP/USD pair was trading in a steady uptrend before the data release.

GBP/USD: After the GDP Deflator Data Release on July 30, 
2020, at 8.30 AM ET

After the data release, the pair formed a bullish 15-minute candle. It subsequently traded in a renewed uptrend with the 20-period Moving Average steeply rising similar to the EUR/USD pair.

NZD/USD: Before the GDP Deflator Data Release on July 30, 
2020, Just Before 8.30 AM ET

NZD/USD: After the GDP Deflator Data Release on July 30, 
2020, at 8.30 AM ET

The NZD/USD pair was trading in a similar neutral pattern as the EUR/USD pair before the data release. Similar to the EUR/USD and the GBP/USD pairs, the NZD/USD pair formed a 15-minute bullish candle after the data release. Subsequently, the pair adopted an uptrend with the 20-period Moving Average steadily rising.

Bottom Line

As observed in this analysis, the GDP deflator has a strong impact on the price action, enough to alter the prevailing market trend upon its release. Forex traders should avoid having any significant open positions before the GDP deflator data release to avoid being caught on the wrong side of the news release.

Categories
Forex Fundamental Analysis

What Should You Know About ‘Loans to Private Sector’ Fundamental Forex Driver

Introduction

Private Sector has a significant and crucial role to play in the economic growth of capitalist economies. The development of private sectors can single-handedly drive the GDP and development of the country forward. Credits and loan availability to the private sector can significantly impact the pace of expansion of the country. Hence, an analysis of the loans disbursed to the private sector can offer us much insight into the country’s growth.

What are Loans to Private Sector?

Loan

It is a credit incurred by an individual or entity. The creditor is generally a financial institution or the Government. The lenders give borrowers money on certain conditions that can include terms relating to the repayment date, interest charges, or other transactional fees. A loan can be secured or unsecured. In secured loans, the loan is given out against collateral like property, mortgages, or securities.

Private Sector

It refers to the part of the economy, which is not under state or central government’s control. The private sector industries are mostly privately owned and for-profit businesses. Private sectors can produce productive jobs, higher income, productivity growth. When private sectors are complemented with the Government sector’s support, the growth rate is multiplied many folds.

Loans to Private Sector

It refers to credits provided to the private sector by financial corporations. Credit can be as loans, nonequity securities purchases, and trade credits, etc. Financial corporations here can be monetary authorities (ex: Central Banks), finance and leasing companies, lenders, pension funds, insurance companies, and foreign exchange companies.

How can Loans to Private Sector numbers be used for analysis?

Most modern economies are capitalist economies, i.e., most of the GDP is derived from the private sector that operates on profitability. Economic indicators like employment, wage growth, the standard of living, GDP, etc. are all heavily dependent on the private sector. In the United States, the private sector contributes more than 85% of the total GDP. Hence, private sector growth is almost equivalent to the country’s growth.

In capitalist economies, the private sectors are competitive, provide high employment, better income, and lie at the forefront of technological innovation in general. Due to competition amongst fellow business organizations, the benefits of working in the private sector far exceed that of the public sector.

Credit plays a vital role in the economic growth of capitalist economies. Credit serves as a crucial channel for money transmission from central authorities to the private sector. Loans can fund production, consumption, and capital formation for businesses that, in turn, generate revenue for the country.

Loans can help private businesses to expand beyond just the cash in hand and speed up their growth rate. The ease with which credit facilities are made available to the private sector will largely control the pace of economic growth. The Government and the Central Bank authorities’ support in providing credit to private industries have historically proven to be very beneficial for the state and country’s urbanization and rapid growth.

On the flip side, a decrease or lack of credit availability can significantly impact small and medium businesses, resulting in halting expansion plans, laying off employees, or in the worst close filing bankruptcy.

The public sectors can only take care of the essential services and set rules and regulations in different areas. The required development has to come from the private sector. But it is the private sector that can boost economic growth through investment, employment, competition, innovation, and better wages.

In the underdeveloped economies, the Government’s support in credit and business support to the private sector has mostly helped uplift people from poverty. In the developing economies, private sector investments have dramatically improved the standard of living for many countries like China, Japan, and India. Private sectors of developed countries already enjoy the support from the public and banking sector, which explains their high GDP and consistent growth rate.

Impact on Currency

An increase in loans to the private sector is a positive sign for the economy. It indicates more businesses are now creditworthy and are working on expansionary plans. A healthy increase in the number of loans to the private sector is good for the future economy. An increase in loans to the private sector also indicates the market is more liquid, and the currency will lose value for the same set of goods and services. Conversely, a decrease in loans to the private sector means the market is less liquid, and money is costly. Currency appreciates, but economic growth is difficult to achieve.

Loans to private sector statistics are useful for the Governments and international investors and companies to check the health of the private sectors in a particular economy. International companies open businesses where ease of doing business is high. For them, it is a useful indicator. Private Sector Loan is not a significant economic indicator for the FOREX markets. Hence it is a low impact indicator.

Economic Reports

The World Bank collects domestic credit data to the Private Sector as a GDP percentage on their official website. The dataset is annual and covers most countries. The datasets are updated once they receive the latest data from the respective countries.

Sources of Loans to Private Sector

The World Bank’s Domestic Credit to private sector reports is available here.

We can also find a consolidated list of Loans to the private sector on the Trading Economics website.

How Loans to Private SectorAffects The Price Charts?

Loans to the private sector is not a statistic most forex traders keep an eye when making their trades. The lack of interest is because it is considered a their-tier leading indicator. It is, however, essential to know how the release of this fundamental economic indicator affects the forex price charts.

The Eurozone private sector loans data is released monthly by the European Central Bank about 28 days after the month ends. It measures the change in the total value of new loans issued to consumers and businesses in the private sector. The most recent release was on July 27, 2020, 8.00 AM GMT can be accessed here. A more in-depth review of the economic news release can be accessed at the ECB website.

Below is a screenshot of the Forex Factory official website. On the right side, we can see a legend that indicates the level of impact the Fundamental Indicator has on the EUR.

As can be seen, low impact is expected on the EUR.

The screengrab below is of the most recent change in private loans in the EU. In June 2020, private loans grew by 3% as compared to the same period in 2019. This change represented a flat growth from the previous release. Based on our fundamental analysis, this should be positive for the EUR.

Now, let’s see how this positive news release made an impact on the Forex price charts.

EUR/USD: Before Eurozone Private Sector Loans release on July 
27, 2020, Just Before 8.00 AM GMT

From the above chart, the EUR/USD pair is trading on a neutral trend before the data release. The candles are forming around the flattening 20-period Moving Average. This trend is an indication of relative market inactivity.

EUR/USD: After Eurozone Private Sector Loans release on July 
27, 2020, 8.00 AM GMT

After the news release, the pair forms a 15-minute bullish candle as EUR becomes stronger as expected. However, the news release was not strong enough to cause a shift in the pair’s trend since the pair continued to trade in the previously observed neutral trend.

Now let’s see how this news release impacted other major currency pairs.

EUR/JPY: Before Eurozone Private Sector Loans release on July 
27, 2020, Just Before 8.00 AM GMT

Before the news release, EUR/JPY traded in a similar neutral trend as observed with the EUR/USD with the candles forming around a flattening 20-period Moving Average.

EUR/JPY: After Eurozone Private Sector Loans release on July 
27, 2020, 8.00 AM GMT

As observed with the EUR/USD pair, EUR/JPY formed a 15-minute bullish candle after the news release as expected. The subsequent trend does now significantly shift.

EUR/CAD: Before Eurozone Private Sector Loans release on July 
27, 2020, Just Before 8.00 AM GMT

EUR/CAD: After Eurozone Private Sector Loans release on July 
27, 2020, 8.00 AM GMT

The EUR/CAD pair shows a similar neutral trading pattern as the EUR/USD and EUR/JPY pair before the news release. After the news release, the pair forms a 15-minute bullish candle but later continued trading in the earlier observed neutral trend as the 20-period Moving Average flattens.

Bottom Line

Loans to the private sector play a vital role in stimulating a country’s economic growth. From the above analyses, the release of the loan growth data has an instant short-term effect on the EUR. The data is, however, not significant enough to cause any relevant shift in the prevailing market trend.

Categories
Forex Fundamental Analysis

GDP from Construction – Exploring The Fundamental Forex Driver

Introduction

Construction is the very first phase of an expected economic growth, which is more evident in the developing economies compared to the developed economies. New buildings, infrastructures, renovations are an indication of an expanding economy. GDP from construction is an important economic indicator to assess financial health and future economic expansion trends.

Construction

It is a part of the Secondary (Industry) Sector of an economy.  Construction refers to building and infrastructure works in all areas. The Construction Sector includes all physical making of infrastructures like bridges, transportation systems (roads, railways), dams, irrigation systems, naval ports, airports, pipelines, apartments, buildings, houses, commercial buildings, corporate structures, etc.

How can the GDP from Construction numbers be used for analysis?

The Construction Industry’s Economic Output is a significant economic indicator that is closely watched by both the private and public sectors. It is especially crucial for developing economies like China, as it is their main contributor to GDP. The GDP from Construction figures assist Central Authorities in policy reforms & economic-decisions.

Growth is essentially a process of invention of new things and discarding the old inefficient ones. Construction, in this sense, is nothing but that. It involves the erection of new buildings, renovations, expansions of the infrastructures that are currently existing. Increased GDP from Construction involves more people getting employed, better wages in the sector, and the extra demand for raw materials, etc. Hence we can say that the act of construction itself has a ripple effect on the economy.

Secondly, the GDP from the construction of corporate infrastructures or commercial structures implies that the constructed structures will be used for further economic activities. For example, a company doubling its company size is planning to double its staff and correspondingly the business that it generates. Hence, GDP from Construction figures improvement is indicative of an improvement in many other sectors.

All these improvements correlated with GDP overall also stimulate consumer confidence and encourages consumer spending, which further stimulates the economy and boosts growth. The Secondary Sector is composed of Industrial Output and Construction Output. For most countries, Industrial Output will be the dominant contributor to the GDP from the Secondary Sector.

We analyze GDP from Construction to understand the associated implications that more economic growth will be followed. For example, the construction of new power plants, or manufacturing industries, would show higher GDP from Construction this year. But the subsequent years, we will see higher GDP due to the newly added Industrial Outputs.

Hence, GDP from Construction figures can be used to assess future economic growth. Everything that is constructed is most likely to bring revenue through its usage in the future. Hence, GDP from Construction improvements can be a leading indicator for further improvements in GDP down the line.

The global Construction Industry makes up 13% of the World GDP, which is more than the Agriculture sector, which is about 7% of the World GDP. It means, overall, the global economy is improving at a rapid pace, with the Industrialization of many economies. It is forecasted to grow to 15% in 2020. China, India, and Japan are flourishing in this era with rapid Industrialization and achieving high GDP Growth Rates ranging from 5-20% in recent years.

GDP from construction can be used by investors to know which countries are transitioning from Developing Economies to Developed Economies. As GDP from Construction increases, it would be followed by GDP growth through increased Industrialization. Further down the line, the economies would transition to the services Sector as their main contributor to GDP.

Impact on Currency

The GDP from Construction is not a high impact indicator when compared to measures like GDP and GDP Growth Rates. GDP from construction does not portray the entire picture of the economy. However, it can be an essential tool for the Central Authorities to keep track of Construction Sector performance and its relative implications over the economy.

What construction is occurring can also serve as an indication of the economy type going to be built over the coming years. But, for the international currency markets, it does not serve as a useful indicator. It is a proportional and lagging indicator. Higher GDP from Construction is great for the economy and its corresponding currency, and vice-versa.

Sources of GDP from Construction

For the US, the corresponding reports are available here – GDP -BEA, GDP by Industry – BEA, and Construction – GDP. World Bank also maintains the Construction and Industrial Sector as a percentage of GDP on its official website, which can be found here – Industrial Sector (including construction) – World % of GDP. GDP from construction can also be found here – GDP Construction – World – Trading Economics.

GDP from Construction Announcement – Impact due to news release

The construction sector is one of the fastest-growing sectors today that has a great impact on the economy of any nation. Construction is one crucial sector that contributes to the economic growth of a country. The government and other regulatory authorities have always shown interest in this segment by investing significantly in various parts of the sector. Naturally, it will contribute to the GDP of a country and influence the reading released quarterly and monthly. When talking about the fundamental analysis of a currency or stock, investors make investment decisions based on the GDP and not on contributions made by individual sectors.

Now let’s analyze the impact of GDP on different pairs and witness the change in volatility due to the news release. For this purpose, we have gathered the latest GDP data of Japan, where the below image shows the fourth quarter’s GDP data released in March.

AUD/JPYBefore the announcement

We will first look at the AUD/JPY currency pair to observe the impact of GDP announcement on the Japanese Yen. In the above picture, we see the market has crashed lower due to some other news release, and currently, the price is at its lowest point. This means there is a great amount of selling pressure in the market, or sellers are dominant. In such a market situation, it is advised not to carry any position in the market before the news release.

AUD/JPY | After the announcement

After the news announcement, the price sharply moves higher and closes as a long bullish candle. This means traders sold Japanese Yen soon after the news release as it was below expectations and lower than the previous quarter. The volatility did increase to the upside for a while, but it did not sustain as the Japanese Yen was showing a lot of strength. One should trade after the market shows signs of trend continuation or reversal and not just based on the GDP data.

GBP/JPY | Before the announcement

GBP/JPY | After the announcement

The above images represent the GBP/JPY currency pair, where we see that the market has strongly moved lower as indicated by two big bearish candles before the news announcement. This means the Japanese Yen has gotten strong recently due to some other fundamental reason, and we cannot ascertain if this will continue or not. As volatility is very high, one should not take a position in the currency before the news release.

After the news announcement, volatility spikes to the upside, and the ‘news candle’ closes with a great amount of bullishness. Even though the price moves higher by a lot, it did not go above the moving average. The market has reacted adversely to the news announcement as the GDP was lower than last time and also below what was forecasted. If the price does cross moving average, this means the downtrend is still intact.

NZD/JPY | Before the announcement

NZD/JPY | After the announcement

The above pictures are that of the NZD/JPY currency pair, where we see a major crash in the market before the news announcement, which is visible in the first image. This pair also shows similar characteristics as in the above currency pairs, where the Japanese Yen has strengthened greatly. Ideally, we should be looking to sell the currency pair after a suitable price retracement.

After the news announcement, the market goes higher so much that it almost retraces the previous bearish candle, resulting in some weakness in the Japanese Yen. As the GDP data was weak, it brought disappointment in the market where traders sold the Japanese Yen and bought the base currency. Cheers!

Categories
Forex Fundamental Analysis

What Is ‘GDP from Mining’ and What Should You Know About This Economic Indicator?

Introduction

The tracking of GDP from Mining can give us many economic conclusions. GDP from Mining’s importance comes from the fact that the final output of Mining Production is the primary input for many industries. Therefore, it is the core part of the business activity related to many industries.

Fluctuations in the GDP from Mining data will eventually translate to all the industries that are dependent on Mined resources for their production process. This effect can be many-fold, and hence it is a vital economic indicator for investors, economists, and government authorities.

Mining Production

It refers to the entire process of searching for, extraction, beneficiation (purification), and processing of naturally occurring minerals from the Earth. Minerals that are typically mined can be Coal, metals like Copper, Iron, Zinc, or industrial minerals like limestone, potash, and other crushed rocks.

Coal is considered as one of the primary sources of energy across the world. Metals like Iron, Bauxite, and Copper have a wide range of usage in various industries. Limestone and other rocks are being used in cement industries, which contribute a lot to the construction and related industries.

How can the GDP from Mining numbers be used for analysis?

The developing economies are primarily achieving their growth through exports of essential commodities like Food, Minerals, etc. For example, Australia primarily exports Iron Ore and Coal, due to which the economic growth and currency value are tightly linked to the Mining of these natural resources. When the GDP from Mining starts to recede, currency devaluation and slowing economic growth are inevitable.

Developed economies are more resilient to changes in GDP from Mining, as their growth is tied to multiple sectors and are not heavily dependent on any individual sector. The availability of modern technology and skilled labor contribute to the GDP from Mining figures positively. Mining is a labor-intensive task. Hence, it is obvious that Mining lies at the heart of all industrial activities. A decrease in GDP from Mining can adversely affect all the dependent industries, and correspondingly the effects will pass onto unemployment, layoffs, wages, economic slowdown, etc.

Impact on Currency

The GDP from Mining is a low impact indicator, as the Mining Production reports are published monthly by the Federal Reserve in the United States that are leading indicators. It is a proportional and lagging indicator. Hence, changes in GDP from Mining would have already been priced into the market through monthly Mining Production reports.

Also, GDP from Mining numbers does not give us a complete picture of the economy. However, it can be an important tool for the Central Authorities to keep track of the performance of the Mining Sector and its implications for the economy. As established, the Mining Sector is a significant contributor, due to many industries dependent on its output.

Hence, changes in this sector widely affect the overall economic health, and all the dependent industries therein. In general, Higher GDP from Mining is good for the economy and its currency, and vice-versa.

Sources of GDP from Mining

For the US, the BEA reports are available here – GDP -BEAGDP by Industry – BEA. For the world data below, two are useful references – Mineral Rents  – World % of GDPGDP from Mining – Trading Economics. The monthly Mining Production statistics can be found on the official website of the Federal Reserve for the United States, which can be found here – G7 Industrial Production and Capacity Utilization

GDP from Mining Announcement – Impact due to news release

Mining is an extremely important economic activity in any country. The benefits of Mining have been widely promoted by the industry and institutions such as the World Bank. In several low and middle-income countries rich in non-fuel resources, Mining makes significant contributions to the national economic development as measured by the Mining Contribution Index (MCI-Wr).

The contribution of Mining and Minerals to GDP reached a maximum at the peak of the mining boom in 2011. Now, the figures indicate a decline in the Mining’s contribution but are still considerably higher than before. This is one of the reasons why it not a major determinant of economic growth. Thus, investors do not give importance to the mining data when it comes to investing in an economy.

In today’s lesson, we will try to examine the impact of GDP on various currency pairs and see the volatility change due to the news release. The below snapshot shows the previous, predicted, and actual GDP data of Switzerland released in the month of March. As this is the quarter on quarter GDP data, we can expect moderate to high volatility in the currency during the announcement.

GBP/CHF | Before the announcement

Let’s review the GBP/CHF currency pair to observe the impact of the news release. We see that the market has made a ‘descending triangle‘ candlestick pattern before the news announcement, which essentially is a trend continuation pattern. Depending on the impact of the news release, we will take a suitable position in the currency pair.

GBP/CHF | After the announcement:

After the news announcement, we see a sudden surge in the price indicating bullishness in the currency. The bullish ‘news candle’ suggests a negative reaction to the GDP data as it was on expected lines with no major increase or decrease. The market appears to have broken above the ‘descending triangle’ pattern, which is why we should need to wait for clear signs from the market with respect to the direction it is heading.  

CAD/CHF | Before the announcement

CAD/CHF | After the announcement

The above images represent the CAD/CHF currency pair, where we see that the market seems to be in a downward channel before the news announcement with the price at the bottom of the channel. Since the impact of GDP is high, there is a high chance that the news release could result in a break down if the data comes out to be weak for the economy. Therefore we need to wait for confirmation from the market before we can take a trade.

After the news release, the price moves higher and volatility increases on the upside. Since the GDP data was pretty much equal to the forecasted number, it did not result in bullishness in the currency, and it ultimately weakened the currency for a while. One who takes a ‘buy’ trade should take profits at the top of the channel and not wait for too long. 

AUD/CHF | Before the announcement

AUD/CHF | After the announcement

The above charts belong to the AUD/CHF currency pair, where we see that before the news announcement, the market is moving within a ‘range.’ This means the price is not moving in any single direction, which can make trading a bit challenging in such an environment. The news release can effectively move the market in any direction, which is why we need to wait for the announcement to happen in order to get clarity.

After the news release, the price moves lower, but this gets immediately bought, and the ‘news candle’ closes with a wick on the bottom. We witness buying pressure in the market soon after the news release. we to be cautious before taking a ‘long’ position since the price is at the top of the ‘range.’ All the best!

Categories
Forex Fundamental Analysis

Understanding ‘GDP from Services’ As A Macro Economic Indicator

Introduction

The different proportion of contribution to GDP from the three sectors (primary, secondary, tertiary) can tell us a lot about the economic development stage a country is at the moment. GDP from Services can help us gauge the transition of countries from developing to developed status efficiently. Hence, it is useful for Central Authorities and business people to understand the growth of the Service Sector.

What is GDP from Services? 

Service Sector

It refers to the production of intangible goods, services to be exact, that are not goods. Services are intangible, non-quantifiable, and formless. The result of service may or may not produce a physical good. For example, a construction service would give the client a building, whereas a lawnmowing service would not. It is the largest sector in the global economy and bears high significance in advanced economies.

How can the GDP from Services numbers be used for analysis?

The three different sectors of an economy are associated with different activities. The primary sector is mainly associated with dealing with agriculture, farming. It answers the basic needs. The secondary sector deals with industrialization, where livelihood, employment are answered through the production of goods.

The tertiary sector comes into picture when the basic needs like food, employment, security are taken care of. The tertiary sector consists mainly of services. Countries that have Service Sector as their main contributor to GDP are generally considered the more advanced economies. Indeed, the underdeveloped nations will primarily struggle for food and water, where Agriculture would be the primary need to feed the population.

The industrialization growth will be associated with low-cost wage labors working in factories for mass production to compete in the global market. Whereas, the service sector will be associated with high-cost services generally to provide “good-to-have” commodities.

For example, a vegetable is cheaper than an industrial product. Likewise, an industry product would be cheaper than a service sector like antivirus software. The cost of a 1kg of potato is about 2.50 US dollars, whereas 1kg of potato chips from a company like lays would cost 10 US dollars, whereas a Netflix subscription (service) would cost around 10-15 dollars a month.

It is a general trend where a software employee (service sector) gets paid more than a factory worker (industrial sector). A factory worker generally gets paid more than a farmer (agricultural sector). It is easily observed the wealth generated from the Service Sector far outpaces that of the Industrial Sector and essentially the Agricultural Sector.

In general, countries start to grow from underdeveloped to developing nations through industrialization. China and Japan would be good examples of industrialization-led growth. Once a country has firmly established its primary and secondary sectors, it can reach the status of a developed economy through the service sector only. India and China would be good examples of developing economies, increasing their service sector to generate higher wealth.

Hence, GDP from Service is essential to assess the status of a country transitioning from an emerging or developing economy status to a developed economy. As the contribution of Service Sector to GDP increases, it implies that more percentage of people are engaged in higher revenue-generating activities, and have crossed the stages of addressing basic survival needs.

It is also essential to understand that GDP from Service can increase only when the country is firmly established and stable in the primary and secondary sectors. Because when primary and secondary needs are not answered, people will first engage in meeting primary needs and not providing services.

The developed economies have substantial contributions to GDP from Service Sector. For example, the United States and the United Kingdom, have about 80% of their GDP contributed from the Service Sector. Developing economies like India and China have over 50% of their GDP from Service Sector. Underdeveloped nations like Uganda have only 24% of the Service Sector.

Impact on Currency

Leading indicators like Services PMI or NMI already forecast the GDP from Service, which would mean the increases from GDP from Services is already priced into the market. It is a proportional and lagging indicator.

Also, GDP from Services does not paint the full picture of the economy. Still, it can be an essential tool for the Central Authorities to keep track of Service Sector performance and its relative implications to the economy. As established, the Service Sector is a significant contributor to the GDP in developing and developed economies.

Hence, Service Sector GDP improvements bring more prosperity to a nation than an equivalent improvement in Agriculture or Industrial GDP. Service Sector GDP increase brings wealth to a nation and improves the standard of living of its people better than any other sector. A country can become a developed nation only when its Service Sector GDP increases to 70-80% of its GDP.

In general, Higher GDP from Services is good for the economy and its currency, and vice-versa.

Sources of GDP from Services

For the United States, the BEA reports are available here – GDP -BEAGDP by Industry – BEA. World Bank also maintains the Service Sector’s contribution as a percentage of GDP on its official website – Service Sector – World % of GDPGDP from Services – Trading Economics.

GDP from Services Announcement – Impact due to the news release

In the previous section of the article, we saw the contribution made by the service sector to the GDP, and it’s importance in the growth of the economy. But when it comes to fundamental analysis of a currency, the service sector’s contribution alone is not of great importance to investors as it represents only a small portion of the whole GDP.

Therefore, traders and investors look at a broader figure, which is essentially the GDP itself, and take a currency position based on the GDP of a country. So an increase or decrease in the contribution of ‘Services’ to GDP does not have any impact on the currency.

Now, let’s analyze the impact of GDP on different currency pairs and observe the change in volatility due to the news release. The below image shows the latest quarter on quarter GDP data of New Zealand released in March.

NZD/JPY - Before the announcement

We will start with the NZD/JPY currency pair to examine the impact of GDP on the New Zealand dollar. The above chart shows the state of the market before the news announcement, where we see that the price was in a downtrend with the least number of retracements. Depending on the impact of the news release, we will position ourselves accordingly in the market. However, we should be looking to take a ‘short’ trade since the major trend of the market is down.

NZD/JPY - After the announcement

After the news announcement, the market moves lower by a little where the price closes, forming a bearish ‘news candle.’ The GDP data in the fourth quarter was lower than last time, which drove the price below the moving average. However, it did not cause a major crash in the market where the volatility slightly increased to the downside soon after the news release. One should wait for a price retracement before a ‘short’ trade.

NZD/CAD - Before the announcement

NZD/CAD - After the announcement:

The above images represent the NZD/CAD currency pair where we see in the first image the price violently moved lower, and few minutes before the news release, it has reversed from the ‘lows.’ Until the reversal is confirmed, we should be looking to sell the currency pair since the down move is very strong. Since a major news event is due, one should wait for its release and take a position based on the change in volatility.

After the news announcement, volatility expands on the downside, and the ‘news candle’ closes, forming a trend continuation pattern. The market reacted negatively to the GDP data since there was a decrease in the GDP by 0.3% in the fourth quarter. This can be taken as an opportunity for joining the downtrend where one can take a ‘short’ position with a stop loss above the ‘news candle.’

EUR/NZD - Before the announcement

EUR/NZD - After the announcement

The above images are that of the EUR/NZD currency pair, where the market is in an uptrend, and the price is currently at its highest point. The chart signifies weakness in the New Zealand dollar before the news announcement with no signs of strength. Technically, we will be looking to buy the currency pair after a pullback to a key technical level.

After the news announcement, the price moves higher and volatility expands on the upside, thereby further weakening the New Zealand dollar since it is on the right-hand side of the pair. At this point, one should be cautious by not taking a ‘long’ position as it would imply chasing the market. Cheers!

Categories
Forex Fundamental Analysis

Everything About GDP From Transport & Its Impact On The Forex Price Charts

Introduction

The Transportation Industry’s contribution to GDP is both direct and indirect. The real contribution of Transportation to overall economic growth goes beyond what the GDP can measure. Hence, Understanding the Role of Transportation in economic activity and its underlying importance that is both visible and subtle is essential for our overall fundamental analysis.

What is GDP from Transport?

Transportation

Transportation includes the types of services that are provided through operating vehicles, moving goods, or people over public transport systems like roads, railways, waterways, airways, etc.

The supply side of the Transportation system is called the Transportation Industry. It is also essential to note that the Standard Industrial Classification (SIC) and North American Industrial Classification System (NAIC) both consider Transportation as a separate industry. They do so through a standard set of definitions and criteria. Hence, not all Transportation services come under the Transportation Industry.

The Transportation services’ contribution to GDP can be measured in the following ways:

Final Demand: It is calculated by adding all the expenditures by households, private firms, and the government on Transportation related goods and services.

Value Added: It is calculated as the GDP contribution by the Transportation services overall. Transportation Value Added is a gauge of the transportation sector’s contribution to GDP. It is based on the difference between transportation services sold value and the goods and services used to produce Transportation.

The Bureau of Economic Analysis (BEA) takes industry value added to be a measure of an industry’s contribution to GDP.

From measurement viewpoint, three types of transportation operations can be distinguished:

  • For-hire operations: It includes those services conducted by transportation industries on a fee basis. A trucking company’s trucking operations is an instance of for-hire operations. 
  • In-house operations: also called, own-account operations, is conducted by non-transportation industries for their use. For instance, the Coca-cola company may transport its beverages to its local warehouse for storage through its trucks. 
  • Final user operations: Final users include the general population (end consumers) and the government who purchase transportation services like cars, trucks for their use.

Transportation Satellite Accounts: The Satellite industry segregates data by focusing on types of economic activity. Hence, the TSAs depict the contribution of for-hire, in-house, and household transportation services as they all form part of the Transportation Industry.

How can the GDP from Transport numbers be used for analysis?

The Transportation-related Final Demand metric is useful to compare the expenditures incurred on other industries like healthcare or housing. For sector-wise, growth analysis, investors can use this to gauge, which industries are experiencing increasing demand that can help them to invest accordingly.

On the other hand, it is not an accurate metric to measure the Transportation needed to support and sustain economic activity. For instance, if the investment into Transportation infrastructure is underfunded, then correspondingly, it will underestimate the final demand due to low economic output. The Transportation industry’s contribution in the year 2019 and 2018 has stayed around 3.2% of GDP as per BEA.

The value-added contribution of Transportation Industry to GDP is, however, understated for the following two reasons:

  • It only includes the contribution of for-hire transportation services. Many industries use transportation services for their use. In-house services do not contribute to GDP.
  • The extent to which industries depend on Transportation is not depicted in these figures. Mobility and interconnectivity between industries, states, and countries are critical factors in business growth in today’s interconnected international markets.

Accessibility to resources, end consumers are all enabled through Transportation and are heavily impacted with poor transportation infrastructure. The US Department of Transportation – Bureau of Transportation Statistics accounts for the TSA reports, and they, by far, depict the contribution of the Transportation industry better than other measures published.

Impact on Currency

GDP from transport does not paint the full picture of the economy but tells us the direct contribution of the Transport industry to the overall GDP. Still, for the International Markets, it does not serve as a useful indicator. It is a proportional and lagging indicator. Higher GDP from Transport is good for the economy and its corresponding currency, and vice-versa.

Sources of GDP from Transport

For the United States, the BEA reports are available here – GDP -BEA

We can use the GDP by Industry to get the transport’s contribution to GDP here –

GDP by Industry – BEATransportation Statistics –Annual Report – BTS

Transportation’s contribution to GDP for the world can be found here –

GDP from Transportation – Trading Economics

GDP from Transport Announcement – Impact due to news release

The main role of transport is to provide access to different locations to individuals and businesses. Transport facilitates a wider range of social and economic transactions than would otherwise be possible. Transport is an important sector in its own weight. Transport infrastructure and transport operations together account for more than 5% of the country’s GDP. In developed countries, further investment in that infrastructure will not only result in economic growth but also improve the quality of life, lower costs to access resources and markets, and improve safety.

Therefore, the transport sector is an important sector of the economy that many long-term benefits associated with it. Fundamentally speaking, investors would not invest based on a currency based on the contribution made by the transport sector alone, as its direct influence on the GDP is less. The transport industry indirectly helps in boosting the GDP by assisting in all business activities.

In today’s article, we will observe the impact of GDP on various currency pairs and observe the change in volatility because of its news announcement. For illustration, we have collected the latest GDP data of Switzerland, which was released in March. The below image shows that the GDP in the fourth quarter was slightly better than expectations and higher than the previous quarter.

USD/CHF | Before the announcement

Let us start with the USD/JPY currency pair in order to analyze the impact of GDP on the Swiss Franc. In the above Forex price chart, we see that the overall trend of the market is down where recently the price is moving in a ‘range.’ After the occurrence of a trend continuation pattern, a ‘sell’ trade can be taken with less risk. Conservative traders should wait for news releases and trade after the volatility settles down.

USD/CHF | After the announcement

After the news announcement, the price marginally increases that takes the market higher by just a few pips. We can argue that the GDP data had the least impact on the currency pair and did not induce any volatility in the market. As the data was as expected, it did not turn the market downside, and it moves as usual.

EUR/CHF | Before the announcement

EUR/CHF | After the announcement

The above images represent the EUR/CHF currency pair, it is clear that before the news release, the market is in an uptrend, and few minutes before the release, the price has been moving within a ‘range.’ This means the news event could either result in a continuation of the trend or a reversal of the trend.

Hence it is recommended to wait for the news announcement to watch the impact it makes on the price chart. After the news announcement, there is a slight increase in volatility to the downside after the close of news candle resulting in strengthening of the Swiss Franc. However, the ‘news candle’ itself appears to be impact-less, where there is hardly any change in price during the announcement.

NZD/CHF | Before the announcement

NZD/CHF | After the announcement

The above images are related to the NZD/CHF currency pair, where we see that the market is moving sideways before the news announcement. Just before the release, the price is close to the bottom of the ‘range.’ As the impact of these numbers is less, aggressive traders can take ‘long’ positions when technically the location is supporting for a ‘buy.’

After the news announcement, the market moves higher, and there is an increase in volatility to the upside. Since the GDP was not extremely bullish or bearish, the market did not react violently to the news release. Therefore, in such times we need to look at the charts from a technical angle. All the best!

Categories
Forex Fundamental Analysis

Exploring The ‘GDP From Utilities’ Forex Fundamental Indicator & Its Impact On The Market

Introduction

The Utility sector is the safe-haven sector for investors during economic slowdowns. The volatility of the Utility Sector is very low compared to any other market, be it currency, stocks, or any other financial market. Understanding the nuances involved with the GDP from the Utility Sector can help us identify money flow patterns during slowdowns and growth periods.

What is GDP from Utilities?

Utility Sector

As per the Bureau of Economic Analysis Department of Commerce: The Utility Sector comprises of industries that provide the following utilities: electricity, natural gas, water, and steam supply, sewage removal. Hence, the Utilities Sector deals with the most necessary commodities for the functioning of modern-day society. It deals with the most indispensable resources.

Functioning of societies without electric power is impossible.

One research even shows if electricity was not available for two weeks, 50% of survey members stated they could not survive. Water, Sewage systems, natural gas are all pillars for conducting our social life. Hence, these basic amenities produce profits; they are part of public service and hence are heavily regulated.

Within the sector itself, specific activities associated with utilities also vary. Electric power includes generation, transmission, and distribution. So some companies may only focus themselves on the sub-categories within the Utility sector.

Water supply includes treatment and distribution. Steam supply includes provision and distribution. Sewage removal consists of the collection, treatment, waste disposal through sewer systems, and sewage treatment facilities.

How can the GDP from Utility numbers be used for analysis?

Utilities generally give its investors stable and consistent dividends. It is relatively less volatile compared to other equity markets. During times of recession, the non-essential goods and services sectors take the worst hit while Utility Sector the least. As utilities are a necessity, their performance is consistent in the long run.

Typically investors buy utilities as long-term holdings for their dividend income and portfolio stability. During recessions, where the Central Authorities cut interest rates to stimulate the economy, investors flock to Utility stocks as a more secure alternative. When economic growth is restored, investors may find better alternatives than utility sectors.

Since this sector is heavily regulated, raising rates to increase revenue for the companies. The infrastructure required to run utility services are expensive and require high capital to maintain and upgrade over time. Hence, Utility providing companies have debts in their balance sheets, taken for maintenance and continuity. Hence, these industries are susceptible to interest rate fluctuations, as interests on their debts vary accordingly.

Consumers also have an impact on the Utility sector. Since many states let consumers choose their utility provider, the competition forces companies to keep competitive prices, that overall decreases their profits. Long-term power purchase agreements or water supply contracts can also incur dent on profits for companies when utility generation costs increase over time.

It is also crucial to know the growth of the Utility Sector is also a function of population and industrialization. Developing economies observe a rise in new factories, and industries would require higher utility services. The contrast in the sector’s economic size would be apparent while contrasting underdeveloped and developed economies.

Capitalization of utility services can lead to monopoly or resource control to private industries to their advantage for profits. Overall, we also must consider that utility services are to be accessible to all classes of people. Hence, regulation by the government is essential to keep it affordable for the lower sections of society.

The regulation also ensures that sustainable development is kept as a priority over profits. As the generation of electricity from fossil fuels like coal, and water supply from underground water, both of which are exhaustible. Therefore, revenue-wise, Utility Sector is not a significant contributor. In the United States, it contributed about 1.6% of value to GDP for the year 2018 and 2019.

Impact on Currency

The GDP from Utilities is a low impact indicator compared to the Broader measures like GDP Growth Rates and Real GDP. GDP from Utilities does not paint the full picture of the economy but tells us the direct contribution of the Utility Sector to the overall GDP. It is useful for long-term investors as a safe-haven during economic slowdowns.

Still, for the International Currency Markets, it does not serve as a useful indicator. It is a proportional and lagging indicator. Higher GDP from Utilities will impact the economy and its currency positively. Contrarily, low GDP from utilities will have a negative impact.

Sources of GDP from Utilities

GDP from Utilities Announcement – Impact due to news release

The Utility sector is an important part of any country as it consists of essential products that are consumed by people daily. Water, gas, electricity are some of the products of the Utility sector. Naturally, they play a vital role in economic and social development. Governments are responsible for ensuring access to service under an accountable regulatory framework.

Utilities are one of the key stakeholders in the economic development team. This industry is also important because all business requires these essential services to operate. Therefore, its contribution to the GDP is increasing year by year. When it comes to fundamental analysis of the currency, investors consider the nominal GDP as an indicator of the economy’s growth.

In today’s example, we will examine the impact of GDP on the value of a currency and see the change in volatility because of its news release. The below image shows the first-quarter GDP data of Hong Kong, where we see a big drop in the value from the previous quarter. Let us find out the reaction of the market to this data.

USD/HKD | Before the announcement

Let us first examine the USD/HKD currency pair to analyze the impact of GDP on the Hong Kong dollar. In the above price chart, it is clear that the market is moving within a ‘range’ where the overall trend is up. Before the news announcement, the price is at the bottom of the ‘range,’ which means there is a high chance of buyers getting active from this point. Aggressive traders can ‘long’ positions as the market is expecting weak GDP data for the first quarter.

USD/HKD | After the announcement

After the news announcement, the price rises by a few pips, and the market moves higher by little. As the GDP data was very bad, the rose higher, which resulted in the weakening of the currency. But this did not bring the kind of weakness and bearishness expected, as the GDP had dropped by more than 5%. This means the new release had the least impact on the currency pair.

EUR/HKD | Before the announcement

EUR/HKD | After the announcement

The above images represent the EUR/HKD currency pair, where we see that before the news announcement, the price has broken out of the small ‘range’ that was formed few hours before the news release. Until the breakout is confirmed, one should not consider buying the currency pair as the news announcement could lower the price and make this a false breakout.

After the news announcement, the market moves lower and volatility increases to the downside, resulting in the Hong Kong dollar’s strengthening. We witness an opposite reaction from the market in this currency pair, where the currency gains strength after the news release. This means the market has already priced in weak GDP data and reacted positively to the GDP data. We recommend using technical indicators to confirm the breakout and then take ‘long’ positions.

AUD/HKD | Before the announcement

AUD/HKD | After the announcement

The above images are that of AUD/HKD dollar, where we see that before the market is moving within a ‘range’ before the news announcement where the price is currently in the middle of the ‘range.’ Another thing we notice is that the overall trend of the market is up, which means we need to be cautious before taking a ‘sell’ trade in the currency pair.

After the news announcement, we see that the price marginally moves higher and closes with a slight amount of bullishness. This means the GDP did not impact the currency pair adversely and minimal effect on the pair. One could take a ‘short’ trade after price moves below the moving average.

Categories
Forex Videos

Forex & Gross Domestic Product – How To Trade Fundamentals!

Fundamental Analysis For Novices Gross Domestic Product

Gross Domestic Product, which is commonly referred to as GDP, is one of the most important features of fundamental analysis.
New traders often skip fundamental analysis, preferring to learn a few technical analysis setups and hoping they will be able to ‘wing it’ and make money that way.

However, fundamental analysis is just as important, if not more so, than being able to learn to trade simply by looking at setups on a chart. At the very least, the two go hand in hand, and it is thoroughly recommended that new traders learn both sides to trading.

So what is Gross Domestic Product or GDP, and how should it be applied to trading currency pairs within the forex arena?
Quite simply, GDP is a measurement of a country’s financial health. It usually fluctuates from month to month and is updated by way of released economic data each month for market analysts and traders to view and where the results will likely affect how its currency exchange rate moves up and down against other currencies in the Forex market. This will, therefore, potentially impact on your trades, with regard to opened trades or those in the process of being opened. And so it is imperative that you learn about the GDP for both currencies – remember they are always traded in pairs – that you are trading, or thinking of trading. This also means that you must be aware of when these monthly data releases are happening.

What aspects make up GDP?


You will find GDP release information on your economic calendar, and it will provide you with the anticipated levels of GDP and show you the importance. So here we can see that German GDP YOY – or year on year came in at – 1.9% and had a market level of importance at medium but where the quarter on quarter figure came in at -2.2% and was considered as very important as it shows how Germany is coping during the pandemic.

GDP is updated then compared month by month, then quarterly and annually. It is based on the monetary value of goods which are produced and sold and services which are provided. Some of these goods and services will be sold within the country, and some will be exported.
But the consumption of these is referred to as consumer spending. GDP also takes into account investment into the country and government spending. It then takes the total value of all exports and deducts imports, and what is left is known as real GDP. This figure can then be further divided on a per capita basis or per individual, and all of this gives an overall picture of the financial health of a nation.

How to trade with GDP data

Essentially, if a country’s monthly GDP data is released as per market expectations, the fundamentals

should already be in the price action. That is to say, there should not be any shock factor, and price action movement should, theoretically, continue with technical analysis.
If the GDP comes in weaker than expected, it would be bad for an economy, and therefore, the price action of that country’s currency should weaken against any counter currency being traded.

If the GDP is better than the market forecast, the country’s currency should strengthen.
Ironically, we are in the most difficult of times currently, with a lot of countries’ GDP being decimated by the Coronavirus. So how does this impact on a country’s currency? At the moment, investors are trying to find ways of looking at how governments are handling the crisis and what level of money they are leveling at their country’s to prop them up and help individuals and companies to stave off bankruptcy. And therefore, this form of fundamental analysis has never been so fraught with danger in regard to using it to trade currencies. It is probably better to stay on the sidelines during these types of news releases until such time as some normality has returned to the world. But, GDP – especially if it comes in at an unexpected level – will always be a market mover, so be warned.

Categories
Forex Fundamental Analysis

How The ‘Government Debt’ Numbers Impact A Nation’s Currency Value?

Introduction

Government Debt as an economic indicator has recently been gaining more attention from economists, investors, and traders. Many economies have chosen to actively take on debts to boost economic growth. Hence, it has become a metric & also a concern for many.

Just like a piling up debt is terrible for a householder, huge government debt is a negative sign for any economy. How the debt is used to run economic activities, methods deployed to repay it, all these have a long-term financial impact. In this sense, Government Debt is a critical metric by itself that needs to be watched out for, as investors decide to lend money to governments, basing this also as one of the reasons.

Government Debt levels have consequences that are many-fold to understand. Hence, understanding Government Debt now is more important than ever as the world’s largest economies are taking on debts beyond their revenues.

What is Government Debt?

Government Debt, also called Sovereign Debt, Country Debt, National Debt is the total public Debt and intragovernmental Debt owed by the governing body of the country. It is the money that the Government owes to its creditors.

            Government Debt = Public Debt + Intragovernmental Debt

Public Debt – It is the Debt held by the public. The Government owes this Debt to the buyers of the government bonds, who can be its citizens, foreign investors, or even foreign governments.

Intragovernmental Debt – It is the Debt owed by the Government to other Government departments. It is generally used to fund Government and citizen’s pensions. The Social Security Retirement account would be one such typical example.

Whenever the Government spends more than its generated revenue, it creates a budget deficit and adds to the total Government Debt. To operate in this budget deficit mode, the Government has to issue treasury bills, notes, and bonds, which are promissory notes to lenders that the Government shall pay back the amount along with interests.

Hence, The National Public Debt is the net accumulation of all annual budget deficits of the Federal Government.

How can the Government Debt numbers be used for analysis?

The Governments depend mainly on public spending to stimulate growth in the economy by assisting businesses and individuals in the form of unemployment compensations, wage hikes, etc. This leaves Government no choice but to fall back on taking on more Debt and keep paying interests from the tax revenues and other income sources.

The piling Debt may let things continue smoothly now but will inevitably tighten the belt for the economy in the future. When Debts go out of hand, it can lead to economic collapse, as default on Debts leads to reduced credibility and may lead to a lack of funds during times of need.

When support is lost for the Government, it has to fall back on assets, selling them and thus going to the brink of bankruptcy. At this stage, a nation is vulnerable as enemy nations can also use this situation to their advantage to wage wars in extreme cases. When there is no monetary support, business slowdowns and recessions are unavoidable.

The following are some strategies the Government may opt to reduce the debt burden:

📎 Low-Interest Rates: By lowering interest rates through open market operations, the Government can make borrowing money easy for the business and people in the economy to boost the economy. This has been the case in the United States. Prolonged low-interest-rate environments have not proven to be an effective solution to Debt-ridden Governments.

📎 Monetization: Countries like the United States, whose currency is not pegged to any other currency or commodity, can print off money and clear Debt. But this can lead to hyperinflation and currency depreciation. Hence, it is not preferable.

📎 Spending Cuts: This is the hard pill to swallow that actually works. It is the spending that leads to an increasing debt burden. If the Government cuts back on spending, which is equivalent to cutting back of money supply into specific segments or programs, that will lead to deflationary situations in the economy that can lead to a recession. Furthermore, when the Government cuts back on spending, they lose the support of citizens and fear losing favors in elections by businesses and the population.

📎 Tax Raises: The main culprit is failing to cut back on spending. As the spending continues to rise year after year, increased tax revenues do little to help reduce the burden of Debt. It is the most common practice but is not effective in the long run.

📎 Pro-Business/ Pro-Trade: By selling off real assets like real estate, gold, and military equipment, the Government can reduce the burden. It is like selling your house to pay off the mortgage. This type of solution is not applicable to all countries, but some like Saudi Arabia reduced their Debt significantly from a debt 80% of GDP to 10% in seven years by selling off oil.

📎 Debt restructuring or Bailouts: When the solvency of the Government is at the brink, Debt restructuring (renegotiating the terms of Debt, or partial payments) is one final option. It is a pseudo-defaulting case. This is not also a practical solution, as the credibility is damaged after this, as it tells the world that the economy is weak.

📎 Default: Defaulting may seem the most effective way to get rid off Debt. This is considered only when there are no other options for the Government. This leads to a lack of future monetary support from the rest of the world. Defaulters like Pakistan, Greece, and Spain are good examples of this. Defaulting occurs when the Debt burden crosses way beyond the tipping point, which is 77%. For the United States, it has already passed 100% in recent years.

Impact on Currency

The National Debt is an increasing concern in recent years as the repayments are starting to take more massive proportions of the Government’s revenue. What method the Government decides to opt for to tackle its debt burden in a given year directs the growth for that business year.

The Government Debt is a proportional indicator, meaning higher Government debt numbers are more stimulating for the economy, and appreciating for the currency and vice-versa. The vital thing to note here is that as long as the Debt has not gone way out of control that the Government cannot afford to pay the interests also. For the United States, the Debt burden will be unbearable by 2034, at which point they have to cut back on spending and raise taxes.

The Government Debt is a lagging and reactionary number. It is taken on to solve an issue and is not an initiative effort. Debt numbers follow the already ongoing situation. Hence, it has a low market impact. The more direct implications of the taken Debt are manifested through press releases and other news reports like wage growth, employment statistics, etc.

Economic Reports

The Treasury Department has the “Debt to the Penny” section on their website which shows, the daily Debt after all purchase and sale of the Government Bonds.

The U.S. Treasury Department releases quarterly, end of the period, the Federal Government’s Debt reports.

Sources of Government Debt

The Office of Management has a historical tables section where we can find Federal Debt records. Some of the most reliable sources are given below.

Impact of the ‘Government Debt’ news release on the price charts 

Government Debt which also known as the national debt, is the public and intergovernmental debt owned by the federal government. The government may take a loan from the World Bank and or from other financial institutions for a variety of reasons. It could be required for fulfilling the needs of the people, for defense purposes, or for stabilizing the economy. A moderate increase in debt will boost economic growth, but too much debt is not good for the economy.

It dampens growth over the long term. Higher debt means a higher rate of interest and, thus, more burden on the government while repaying the loan. Investors compare the debt held by the government and its ability to pay it off. Based on this data, they have a short to long term view on the currency. However, traders do not react violently to the Government Debt news release and make few adjustments to their positions in the market.

In today’s article, we will be analyzing the impact of the Government Debt announcement on Turkish Lira as traders identify the debt of the Turkish Government. The below image shows the previous and latest Government debt of Turkey, which indicates an increase in debt from last month.

USD/TRY | Before The Announcement

The above image represents the USD/TRY currency pair before the news announcement. We see that the chart is in an uptrend and the price has broken many resistance points. Currently, it is approaching a major resistance area from where the market has reversed earlier. High volatility on the upside could be an indication that the market is expecting a weak Government Debt data. One can join the uptrend only after the market gives a retracement.

USD/TRY | After The Announcement

As soon as the Government Debt data is announced, the market violently moves higher, and price rises quickly to the top. The reason behind the increase in volatility to the upside is that the Government Debt increased by almost $70B for the month of March. As a rise in Debt is considered to be negative for the economy, this explains why traders and investors sold Turkish Lira and bought U.S. dollars after the numbers were announced. The bullish ‘news candle’ is a sign of trend continuation, and thus one can go ‘long’ in the pair after a suitable price retracement.

TRY/JPY | Before The Announcement

TRY/JPY | After The Announcement

Next, we will discuss the impact of the news on the TRY/JPY currency pair, where we see that the market is moving in a range, and the overall trend is up. As the Turkish Lira is on the left-hand side, a ranging market indicates an indecision state of the market. Before the news announcement, price is at the ‘resistance’ area, and thus one can expect some selling pressure from this point, which can take the price lower. In such a market scenario, aggressive traders can take a ‘short’ trade in the market, expecting bad news for the economy.

The news release resulted in volatility expansion on the downside as the market reacted negatively owing to poor Government Debt data. The price crashed and closed as a strong bearish candle. But this was immediately retraced by a bullish candle, which could be due to the reaction from ‘support’ of the range. Thus, one should go ‘short’ in the pair after the price breaks key levels as the overall trend is up.

EUR/TRY | Before The Announcement

EUR/TRY | After The Announcement

The above images are that of the EUR/TRY currency pair, and here too, the market is range-bound where the overall trend is down. Since the Turkish Lira is on the left-hand side, a ranging market indicates a moderate strength in the currency. Just before the announcement, price is at the ‘bottom’ of the range, and one can expect some buying strength in the market, which can take the price higher from here. The safer approach is to wait for the shift in volatility due to news release and then trade based on the data.

After the data is released, the market, just as in the above pairs, moves higher sharply, and traders sell Turkish Lira. The bullish ‘news candle’ indicates that the Government Debt data was extremely bad for the economy and thereby prompting traders to go ‘long’ in the pair. As now the price is at resistance, one should wait for a breakout and then ‘buy.’

That’s about ‘Government Debt’ and its impact on the Forex market after its news release. If you have any questions, please let us know in the comments below. Good luck!

Categories
Forex Fundamental Analysis

How The ‘Terrorism Index’ News Release Impacts The Forex Market?

Introduction

Terrorism Index is a macroeconomic indicator that can influence long term investing and foreign investments flowing into an economy. The smoothness in business activities and productivity of the economy is influenced by acts of Terrorism, thereby affecting the overall Gross Domestic Product (GDP). Hence, understanding the changes in Terrorism Index and its impact can help economists and policymakers make critical decisions towards the country’s growth.

What is Terrorism Index?

Terrorism Index, also known as the Global Terrorism Index (GTI), is a report that gives us a comprehensive summary of the key global trends and patterns in the acts of Terrorism. It is one of the measures of Terrorist Activity in different economic regions.

Terrorism: According to GTI, Terrorism is defined as the threatened or actual use of illegal force & violence by a non-state actor to achieve an economic, political, religious, or social goal through fear, coercion, or intimidation.

It also details incidents of Terrorism throughout the globe for the past 50 years, covering the period of the beginning of 1970 and the change in recent periods. It also identifies and categorizes terrorists into designated groups. GTI also ranks the countries that it covers as per the degree of Terrorist Activity being experienced by those economies. It covers 163 countries that attribute to about 99.7 percent of the world population.

Below is the top ten countries list losing their GDP due to acts of Terrorism.

How can the Terrorism Index numbers be used for analysis?

Acts of Terrorism harm the economy. The impact of Terrorism is calculated through IEP’s cost of violence methodology. The methodology includes direct costs like loss of lifetime earnings, medical bills for treatment, and property loss from terrorism incidents. It also accounts for indirect effects like a loss in productivity, job or earning losses, psychological traumas that impact the victims and their associated family and friends.

Prolonged periods of terrorist activities can result in an unstable economy, where people may panic and fear for their life that impacts social order, political tensions, security threats, and leads to economic contractions. The more the terrorist activities, the lesser the chance for governing bodies to spend on public and growth, and the overall majority of revenue goes into combating Terrorism and bringing back the economy to its normal state.

Overall the economic impact is divided into four categories: deaths, injuries or fatalities, destruction of property, and GDP losses from Terrorism. Terrorism has many implications for the larger economies. It depends on the duration, level, and severity of the terrorist activities. Typically, when countries suffer more than 1000 deaths from Terrorism, IEP’s model includes national output losses that are equivalent to two percent of the total GDP.

The deaths from Terrorism has a significant impact overall, followed by GDP losses. The global economic impact of Terrorism was 33 billion U.S. dollars in 2018, 38 percent lower than in 2017. Terrorism also has wide-ranging economic consequences that have the potential to spread quickly through the global economy with significant social ramifications.

The violence caused by Terrorism, and the fear of Terrorism creates critical disruptions in the economy. It changes the economy’s behavioral patterns, like changes in investment and consumption patterns, diverting public and private away from productive and economic activities towards protective measures. Developed economies are able to absorb the economic shocks of Terrorism better than growing economies. Terrorist activities directed towards specific organizations specifically hurt that company’s stocks in the short-term.

Trades become costlier as it has to account for increased security and higher wage premiums for workers working during such uncertain times. Countries whose main revenue streams include tourism take a severe hit as terrorist attacks significantly reduce tourist arrivals and, accordingly, the revenue from it.

Impact on Currency

GTI is an inverse indicator, meaning; low GTI levels are suitable for the economy and the currency. High levels of GTI results in allocating a lot of government resources in combating and containing Terrorism. In extreme cases, the regions experiencing high levels of terrorist activities can enter curfews for weeks or even months on end that is bad for the economy.

High GTI discourages foreign capital flow into the economy as investors are not sure of a smooth growth of business and industries within that economy when frequent disturbances are expected.

Terrorism Index is an annual metric and has a low impact on the volatility of the market as it is a lagging indicator and shows the long term trends and studies of Terrorism. The more direct consequences are obvious through other macroeconomic indicators, but GTI is useful for investors and impacts long term growth plans of the economy. High GTI can also lead to shying away from foreign companies to invest and expand in the country.

A decrease in the percentage of GTI is indicative of recovering economy and hence, can be used as a positive signal for growth overall.

Economic Reports

The Global Terrorism Index (GTI) report is released by the Institute for Economics and Peace (IEP) and was developed by Steve Killelea, the founder of IEP. It obtains its data from mainly from the Global Terrorism Database (GTD) and some other sources.

GTD data is collected at the University of Maryland by the National Consortium for the Study of Terrorism and Responses to Terrorism (START). It is an annual report that is released at the year-end, usually around November and December, on the official website of Vision of Humanity organization.

Sources of Terrorism Index

The GTI and Peace reports are available on the official website of the Institute for Economics and Peace – Institute for Economics and Peace – Reports

We can refer the 2019 GTI report here: GTI – 2019

We can find the GTI for different countries listed out in various categories here.

Impact of the ‘Terrorism Index’ news release on the price charts 

The report of the Global Terrorism Index is gaining a lot of importance today as it measures the amount of loss incurred by a country due to the destruction caused by the terrorism activities. The report consists of patterns and trends of terrorism activities in 163 countries. It also measures the economic impact of Terrorism.

Terrorism, for instance, impaired the GDP growth of 18 Western European countries from 1971 to 2004, where the GDP per capita fell by 0.4 percentage points. A large terrorist attack can affect financial markets negatively in the short-term. However, in the long term, they continue to function efficiently, absorbing the shock. Therefore, more and more countries try to quantify the effects of Terrorism on the granule level so that the currency is not adversely impacted.

In today’s article, we will be analyzing the impact of the Global Terrorism Index news announcement on various currency pairs and interpret the change in the volatility. For illustration, we have considered the Terrorism Index of the U.S., where the below image shows the Rank, Score, and the Change in Rank from the previous year. It represents the year-on-year Terrorism Index Score of the U.S., which was released in November.

EUR/USD | Before The Announcement

The above image is that of the EUR/USD currency pair before the news announcement, where we see that the overall trend is down, and currently, the price has retraced up to a key level of support equals resistance. From the knowledge of technical analysis, this is the perfect trade setup for going ‘short’ in the market, but since there is a news announcement on the next day, it is wise to wait and then trade based on the numbers. However, aggressive traders take a ‘short’ trade with a larger stop loss above the recent ‘high.’

EUR/USD | After The Announcement

After the Global Terrorism Index numbers are announced, the price goes lower, and there is an increase in volatility to the downside. But the candle leaves a wick on the bottom and closes near the opening price. Initially, traders bought U.S. dollars because of the positive economic indicator data where the Terrorism Score was better than last time, and the rank reduced by two positions. Even though it was positive, there were some traders who felt it was that robust, which is why the selling did not sustain. One can still go ‘short’ in the pair but with a shorter ‘take-profit.’

USD/JPY | Before The Announcement


USD/JPY | After The Announcement

The above images represent the ‘daily’ timeframe chart of USD/JPY currency pair, where in the first image, it is clear that the market is moving within a channel, and now it is at the bottom of the channel. Technically, it is the right place for going ‘long’ in the market as one can expect some buying force from here. A ‘buy’ trade is only for the aggressive traders, and others still need to wait for the clarity in news data. But since a news announcement.

After the numbers are published, volatility increases on both sides, and the candle managed to close in green. The market reaction was again neutral in this case as the Terrorism Index data was mildly positive to mixed, which is why the ‘news candle’ forms a ‘Doji’ candlestick pattern. Thus, one can now go ahead and take a ‘long’ position once the price goes the moving average with a ‘take-profit’ near the upper trendline.

NZD/USD | Before The Announcement

NZD/USD | After The Announcement

These are the images of NZD/USD currency pair, and since the U.S. dollar is on the right-hand side of the pair, a down-trending market means that the U.S. dollar is showing strength. Though recently, the price is moving in a range and right before the announcement, it is at the top of the range, also known as ‘resistance.’ Another important point of consideration is that the volatility has increased on the upside, and this could be a sign of reversal. Therefore, ‘short’ trades from here have to be taken with caution.

After the Terrorism Index data is released, we see that the market moves lower and a moderate increase in volatility to the downside. The news outcome did not create the kind of impact that was expected and seen in other pairs. Thus, we need more indication from the market in order to go ‘short’ in the currency pair.

This ends our discussion on the ‘Terrorism Index’ and its relative news release impact on the Forex price charts. If you have any questions, please let us know in the comments below. Good luck!

Categories
Forex Fundamental Analysis

Comprehending ‘Current Account to GDP Ratio’ Economic Indicator

Introduction

The Current Account balance represents one half of the nation’s Balance Of Payments. This number typically ranges in billions and trillions. When trying to comprehend such big numbers, a strong understanding of what do these numbers represent in actuality is paramount.

What is the Current Account Balance?

The equations given below represent what Current Account balance is composed of and how it contributes to the nation’s Balance Of Payments

The current account balance is the sum of the Balance Of Trade, Net Income, and Net Current Transfers. Fundamentally, the Balance Of Trade represents the difference between total exports and imports of goods and services for that nation.

Balance Of Trade: The Balance Of Trade is the difference between the revenue generated by export and the expenditure incurred by the imports. A nation that exports more than what it imports is said to be running a trade surplus. Conversely, a country whose imports exceed its exports is said to be running a trade deficit. A country that is having a trade deficit is said to have a negative Balance Of Trade, and a trade surplus country is said to have a positive Balance Of Trade.

Net Income: It represents the income received by a country for its investments in areas like real estate or holding in foreign shares, etc.

Net Current Transfers: The net current transfer represents one-directional transfer between one Nation to another without any equivalent financial item in return. This may take the form of worker remittances, charitable fund transfer, or even relief funds, etc.

All these three components are combined to form what is called the current account balance of a nation.  A country with a negative current account balance is a net borrower from the rest of the world, and that which has a positive current account balance is a net lender to the rest of the world.

For example, the United States, which is running a negative current account balance, indicates that the nation is importing or consuming more than it is exporting or producing, thereby sending trillions of dollars out of the nation in exchange for equivalent goods and services.

Current Account & Capital Account

The Capital Account reflects the opposite of what current account balance shows. If a country is importing commodities by sending out money, it must receive an equivalent amount of money in one form or another from a certain set of sources. The Capital Account reflects those sources.

A country receives capital when its domestic assets are purchased by foreign bodies. The same country also spends money when it purchases foreign assets using domestic currency. The total of these both may result in a positive or negative capital account. A country running a negative current account balance must have, by definition, a positive equivalent capital account as the total of the entire Balance Of Payments should equal to zero.

How is the Current Account Balance to GDP calculated?

The current account balance, which often ranges in billions and trillions, is expressed as a percentage of GDP. The Bureau of Economic Analysis releases the current account balance quarterly, semi-annually, and annually. The World Bank publishes current account balance as a percentage of GDP for all the nations.

Below is the snapshot of the current account balance as a percentage of GDP for the United States published by the World Bank on their official website.

How can the Current Account Balance to GDP be Used for Analysis?

The current account balance is an entire country’s economic figure, and when calculated as a percentage of the Gross Domestic Product GDP, we can draw a lot of conclusions about the current economic situation within the nation.

We have to also keep in mind that simply a negative current account balance or its percentage does not mean that the economy is stagnating nor a positive current account balance indicates a growing economy. The United States has been running in a negative current account balance since 1980.

The current account balance is one part of the Balance Of Payments, and when we look in the absolute sense, we will not be able to assess the nation’s economic situation properly. Instead, if we look at the percentage concerning the previous number, we might be able to know whether the economic conditions have improved or declined concerning earlier periods.

For example, in the US, a $1.1 billion reduction of the current account deficit in the third quarter of 2019 concerning the previous quarter was mainly due to increased income and reduced goods deficits, as mentioned by the Bureau of Economic Analysis.

Impact On The Currency

The Current Account balance reflects the overall economic activity and the revenue circulation in and out of the country. As a percentage of GDP, it can give us a relative comparison on a global scale with other competing nations. In general, it is a proportional indicator. Meaning, an increase in the results in currency appreciation on a relative basis with previous periods and vice-versa.

On a relative basis, the measured changes in the percentages can help us understand which country’s economic activity has grown or contracted. Such macro-economic indicators are very useful for many people. For instance, Governments can take policy decisions or put appropriate pressure or give support to certain businesses, either increase or decrease economic activity.

Traders can also use these indicators to predict currency movement and may decide to invest. Large and unpredictable movements in the current account balance can shake the confidence of investors in either direction, i.e., positively or negatively.

Sources of Current Account Balance to GDP

The United States Bureau of Economic Analysis releases quarterly reports of the Current Account Balance numbers. It can be found here.

Also, the World Bank releases Current Account Balance as a percentage of GDP on its official website for many countries. Those numbers can be found here.

Impact Of ‘CA To GDP’ Announcement On The Price Charts

In this section of the article, we shall see how the Current Account % of GDP will impact the currency and cause a change in the volatility. We will be analyzing the Current Account % of GDP data of New Zealand by observing the changes in the data from previous reading to the current reading.

The Current Account % of GDP data is released every quarter, and thus we will have four readings in a year. The latest data available to us is of the 3rd quarter released in the month of December and the 4th quarter data will be released in March. As we can see below, this indicator has the least impact on the currency (Yellow Implies Least Impact), and we should not expect much volatility after the news announcement.

Below is the Current Account % of GDP of December quarter, which is released by the ‘Statistics New Zealand’ agency, which collects information from people and organizations through censuses and surveys. It is also known as ‘Stats NZ’ and is a government department. The data shows that the Current Account % of GDP was increased by 0.1%, which we will now see what impact it created on the charts.

NZD/CAD | Before The Announcement - (Dec 17th, 2019)

Before the news announcement market is in a clear downtrend and is attempting for a pullback. When we are talking about the impact of the news, we know that since it is a less impactful event, a better than expected result would mean a partial reversal of the trend. If the numbers are not that good for the ‘New Zealand Dollar’ we should expect a continuation of the current trend.

Thus, from a trading point of view, it is better to join the current downtrend if the Current Account % of GDP is maintained somewhere around the previous reading. We should not be going ‘long’ in the market even if the data is good for ‘New Zealand Dollar’ since the impact of the indicator is not high, and then the rally will not last.

NZD/CAD | After The Announcement - (Dec 17th, 2019)

The Current Account % to GDP was increased by 0.1%, which is mildly positive for the New Zealand Dollar. We see the initial reaction of the market where the candle barely closes in green. The volatility witnessed is also very less due to the above-mentioned reason.

Therefore, we can trade this currency pair on the ‘short’ side, after the price goes below the moving average line, which will our confirmation sign for the trend continuation. Since the news outcome was not good for the New Zealand Dollar, the downtrend could continue further, and we should be able to easily make a profit on the downside.

NZD/CHF | Before The Announcement - (Dec 17th, 2019)


NZD/CHF | After The Announcement - (Dec 17th, 2019)

The above chart represents the currency pair of NZD/CHF, which shows similar characteristics as that of the NZD/CAD currency pair. In this pair, we can notice that the news release did not even take the price above the moving average line, which means the data is very weak when compared to Swiss Franc. The market became volatile after the news release and took the price down. Thus, this is a much better pair for taking a ‘short’ trade with an amazing risk to reward ratio. We can also continue to hold on to our profits as long as the price is below the moving average.

EUR/NZD | Before The Announcement - (Dec 17th, 2019)

EUR/NZD | After The Announcement - (Dec 17th, 2019)

In this currency pair, the New Zealand Dollar is on the right side, so we see an uptrend illustrating the weakness of the currency. Since the Current Account % of GDP data was slightly positive for the New Zealand Dollar, we see a red candle after the news announcement, but later it was fully overshadowed by the green candle. This means the Current Account numbers were not good enough to take the currency lower.

What we see after the news release is a ‘Bullish Engulfing’ candlestick pattern, which is essentially a trend continuation pattern. Thus, once the price goes above the moving average line, we can enter for’ longs’ in this pair with a stop loss below the red candle and aiming for a new ‘higher high.

That’s about the Current Account To GDP ratio Economic Indicator and its impact on the Forex market. If you have any questions, please let us know in the comments below. All the best.

Categories
Forex Course

44. Analyzing The Forex Market – Fundamental Analysis

Introduction

We’ve now come to one of the most exciting topics in this course, which is analyzing the Forex market. Now that we know the history and the working of the Forex market, we’re all set to predict the future of the market. Several types of analyses are used by traders across the world to analyze the  Forex market. However, these analyses can broadly be classified into three types.

In this lesson, and the lessons coming forward, we shall be discussing all these three types of analyses.

Types of Forex market analysis

The three types of forex market analysis are:

  1. Fundamental analysis
  2. Technical analysis
  3. Sentimental analysis

Now, you must be wondering which one of them is best for analyzing the markets. Well, if you look at the most successful professional traders in the industry, they analyze the market by considering all the types. In this lesson, let’s understand the most essential Fundamental Analysis.

Fundamental Analysis

Fundamental analysis, as the name pretty much suggests, is the way of analyzing the market by studying the economic, social, and political forces in the country. These factors are considered because they affect the supply and demand of an asset.

The whole idea of trading using fundamental analysis is by considering the factors that affect the supply and demand of a currency. These factors are technically referred to as fundamental or economic indicators.

The concept behind this type of analysis is straightforward. If a country’s currency or economic outlook is good, then there is a high probability that the currency will show strength in the future and vice-versa.

What are the major economic indicators?

Below are some of the economic indicators which have the power to shift the economic situation of a country.

Interest rates

One of the most popular and important economic indicators are interest rates. There are several types of interest rates, but we will be focusing on the basic form of the interest rates set by the central banks. Central banks are the creators of money. This money is borrowed by private banks. And the percentage (interest) or the principle the private banks pay to central banks for borrowing the money is called a nominal or a base interest rate.

If the central banks wish to boost the economy, they decrease the interest rates. This then stimulates borrowing by both private banks and other individuals. And this, in turn, increases consumption, production, and the overall economy. Lowering the interest rates can be a good way to inflate the economy but can be a poor strategy too. Because in the long term, low-interest rates can over-inflate the economy with cash and create an unbalance in the money supply.

So, to avoid this, central banks increase interest rates. And this increase results in less money in the hands of private banks, businesses, and individuals to play around with.

Inflation

Inflation, as the name pretty much says, is fluctuation in the cost of goods over time. Inflation, too, is a vital indicator for economists and investors to forecast the future economy. Inflation will have a good effect on the economy if done uniformly. But, too much inflation can bring the balance of supply and demand on the tip in favor of the supply. And this eventually will bring down the value of the currency.

Apart from these two, there are many other macroeconomic indicators that traders consider to do their fundamental analysis. Some of them include GDP, PPI, CPI, Unemployment Rate, Government Debt, etc. Indicators like these help the investors & traders in analyzing the market and predicting its future.

This completes the lesson on fundamental analysis. In the next lesson, let us understand the insights about technical analysis. Don’t forget to take the quiz below before moving ahead!

[wp_quiz id=”56601″]
Categories
Forex Economic Indicators

What Is Gross Domestic Product (GDP) & How Is It Useful For The Forex Traders?

Introduction

Gross Domestic Product, also known as GDP, is one of the main Microeconomic Indicator in Forex. It is the total amount of money spent on final goods and services. GDP is expressed in percentage terms and is calculated across different time periods. The time period is usually from one quarter to another.

It is a standard measure for the value added to the country’s economy through the production of goods and services during a specific time period. GDP is published by the International Monetary Fund (IMF), and information on the same can be found on their official website.

What does GDP measure?

Just as explained in the beginning, GDP measures the health of an economy. If the GDP of a country is high, it means it is receiving capital flows from central banks and institutions, which is a big positive for that country. However, if the GDP numbers are declining quarter on quarter, it means the economic growth of the country is shrinking. When GDP falls, unemployment in the country rises, and output in production drops.

GDP is important because it gives a birds-eye view of how the economy is doing. It is a sign of people getting more jobs, getting better pay, and businesses feeling confident about investing more.

Calculation of GDP

The GDP of a country can be calculated by using the below-mentioned formula

GDP = C + I + G + (X-M)

Where C is the spending made by consumers

I is the investment by businesses

G is the government spending

(X-M) is the net exports

How do Forex traders use GDP?

GDP is an indicator that is used by both technical and fundamental traders. It is one of the most critical drivers of the economy and is closely monitored by all. GDP is important because it can affect how the financial markets can behave, both positively and negatively. Strong GDP growth translates into higher corporate earnings, which directly appreciates the currency value. Conversely, falling GDP means the economy is weakening, which is negative for the currency and, therefore, stock prices. According to economists, a recession is said to occur when there are two consecutive quarters of negative GDP growth.

One should not forget that GDP is a lagging indicator, meaning it shows what the economy did in the past. It does not predict the state of the economy in the near future. Hence, if the GDP data of a country is not good, traders view this as an opportunity to buy the currency and make a profit in the long term.

Summary

Understanding the Gross Domestic Product and its growth rate is essential for investors and traders as it affects the decision-making process of policymakers of the country. When the GDP growth rate is high, the central banks raise interest rates and encourage investment. High-interest rate is said to attract foreign investors and financial institutions. With the improvement in research and quality of data, statisticians and governments are trying to find measures to strengthen GDP and make it a comprehensive indicator of national income.

Categories
Forex Economic Indicators Forex Fundamental Analysis

What you should know about Government Debt to GDP

What is the Government Debt to GDP?

The government Debt-to-GDP ratio is simply the ratio between the country’s total GDP (Gross Domestic Product) to its total debt. It is computed by dividing the total debt the nation has in a particular year to that of the GDP figure for that year.

As it is a ratio, this indicator is represented in percentage. The debt-to-GDP ratio indicates the country’s capability to repay its debts. If the debt-to-GDP ratio of a country is high, it means that the country might struggle to pay back the debt it has incurred. If this ratio is nominally high, then there is a high likelihood that the country is more likely to default on payments and fail to repay the debt. If the debt-to-GDP ratio is low, then the country is in a stable financial position to repay the debt.

This ratio is also useful to help determine the number of years that a country would need in order to pay back the debt if the total GDP is solely dedicated to the repayment. The debt-to-GDP ratio also measures the financial leverage of an economy.


What Does the Debt-to-GDP Ratio Tell You?

A financial panic in domestic and international markets is triggered when a country is unable to repay its debt. Governments will strive to lower their debt-to-GDP ratios. However, this can be difficult during periods of unrest or when the country is in an economic recession. When this occurs, governments like to increase borrowing in an attempt to stimulate economic growth.

Some economists adhere to the modern monetary theory (MMT), which argues that sovereign nations that are capable of printing their own money can’t go bankrupt as they can simply print more fiat currency to cover their debts. However, the nations of European Union (EU), who have to rely on the European Central Bank (ECB) to issue euros, do not apply to this rule because they do not control their own monetary policies.

A  recent study by the World Bank found that countries whose debt-to-GDP ratios exceed 77% for extended periods will experience a slowdown in economic growth. It is important to note that every percentage point of debt above this level costs countries 1.7% in economic growth and is even more pronounced in the emerging markets, where each additional percentage point of debt over 64%, annually slows growth by 2%.

Sources of information on ‘Debt to GDP Ratio’ for Major currencies:

In the sources below, there is a lot of information with respect to the Debt to GDP ratio. You can acquaint yourself with the Debt to GDP ratio for the respective country in addition to the historical data related to that country’s Debt to GDP ratio. This graphical representation of the historical Debt to GDP ratio data will leave you with a clearer understanding of how these ratios can change over time.

World Bank – https://datacatalog.worldbank.org/dataset/quarterly-public-sector-debt

GBP (Sterling) – https://tradingeconomics.com/united-kingdom/government-debt-to-gdp

AUD – https://tradingeconomics.com/australia/government-debt-to-gdp

USD – https://tradingeconomics.com/united-states/government-debt-to-gdp

CHF – https://tradingeconomics.com/switzerland/government-debt-to-gdp

EUR – https://tradingeconomics.com/euro-area/government-debt-to-gdp

CAD – https://tradingeconomics.com/canada/government-debt-to-gdp

NZD – https://tradingeconomics.com/new-zealand/government-debt-to-gdp

JPY – https://tradingeconomics.com/japan/government-debt-to-gdp


Frequency of release

Public Debt figures are released quarterly by the World Bank and the International Monetary Fund (IMF), therefore, investors and agency ratings are able to compute this ratio on a quarterly basis.

What do traders care about the Debt to GDP ratio and its impact on the currency?

As we already know, the government debt to GDP ratio indicates the ability of a country to repay its debt, and a higher Debt to GDP ratio for an extended period of time means that the country is more likely to get default on its debt. This leads the foreign banks and governments to lend more money to these countries, and they increase their interest rates to mitigate the high risk involved. Aa a result, the economy of the country will slow down when there is a high debt to GDP ratio. A weak economy can indicate that there may be depreciation of that currency. This is why this ratio will be an essential factor for forex traders to consider when they trade on the Forex market.

The bottom line

If a country has a high debt-to-GDP ratio for an extended amount of time, it can indicate a recession as a country’s GDP will go down in a recession. This will also affect the people living in that country as governments tend to increase taxes to keep up the revenue. The lending governments will have more faith in the county to repay their debts if there is a high return on the debt that is borrowed. If there is a high risk involved due to less return on the debt that is acquired, this will question the lenders. Another important factor to consider is that the lending institutions earn a high rate of interest on the debt that is provided, So they won’t mind the country in question not paying back their debt, as the lending country can earn high interest from the debts they have provided.

From a traders’ point of view, it is better to have an overall view on what the country’s debt to GDP ratio is and to forecast if the specific country is likely to repay their debts or default on payments. If this fundamental analysis indicator factor is ignored when doing your due diligence for long term trades, then there is a high probability of the specific currency to depreciate in the long run, if that country defaults on its debt.


Categories
Forex Market Analysis

June 29 – Technical Update on S&P500 & Gold – U.S. GDP Disappoints

The financial markets remained heavily volatile due to a series of market-moving economic events like the German CPI and U.S. Final GDP.  Well, the game isn’t over yet. We have another series of high impact economic events coming out of the market on Friday. Let’s take a quick look.


Top Economic Events to Trade

  • EUR – German Retail Sales m/m – 6:00 (GMT)
  • GBP – Current Account – 8:30 (GMT)
  • GBP – Final GDP q/q – 8:30 (GMT)
  • EUR – CPI Flash Estimate y/y – 9:00 (GMT)    
  • CAD – GDP m/m – 12:30 (GMT)
  • USD –  Chicago PMI – 13:45 (GMT)


Although there are lot more economic events due to be released, these are the most important ones and may help you capture a nice amount of pips.     


Gold – XAU/USD – Daily Outlook

On Thursday, gold plunged to its weakest level in six months to trade at $1,247. Most of the selling came in response to escalating pressure from the trade war and the sentiments of higher U.S. interest rates which continues to weigh on gold. Nevertheless, we can expect a modest reversal in the near term. Price action is expected to retrace the decays back to 1263, the same level which earlier served as support.


Support     Resistance 

1252.5    1259.76

1250.26    1262

1246.63    1265.63

Key Trading Level:    1256.13


SPX – S&P 500 – Technical Outlook

SPX is trading bullish near 2718 after gaining support above 2694. On the 4- hour chart, the upward trendline is also extending support near 2679. While the resistance prevails at 2732 and 2745 today, the main trend is up as per the daily swing chart, but, momentum is trending lower. A trade through 2679.25 will convert the main trend (bullish) into the bearish bias.


Overall, the main trading range of SPX is 2595 to 2796. The index is currently testing the upper or 50% level of this range at 2795.75.


Support     Resistance 

2697.19    2732.87

2686.16    2743.9

2668.32    2761.74

Key Trading Level:    2715.03