Introduction
Vehicle sales figures offer us much insight into the consumer demand and overall health of the economy. Changes in vehicle sales figures could also be used for predicting the near-future direction of economic growth. Understanding how vehicle sales figures can be used to infer upcoming trends in crucial economic indicators could always give us the advantage of being ahead of the market trend.

What is Total Vehicle Sales?
Total Vehicle Sales represent the overall number of domestically produced vehicles that have been sold. The reports could be monthly, quarterly, or even yearly, depending on the reporting vehicle manufacturing companies. In other words, Total Vehicle Sales is the annualized new vehicles sold count for a given month.
The automotive industry represents a vital component of the United States economy. It makes up about 3% of the total GDP and remains the largest industry in the manufacturing sector. It is responsible for employing lakhs of people in the United States and transacts in billions each year.
How can the Total Vehicle Sales numbers be used for analysis?
At first, the importance of the vehicle sales figure may not be apparent, but vehicle sales serve useful for economic analysis. A vehicle is a significant purchase for people. People buy vehicles when they are confident about their ability to make payments. It is possible only when they have considerable disposable income or procure loans at lower interest rates.
When people’s disposable income is considerable, it means the people are affluent financially and reflects the good health of the economy. On the other hand, when loans are available to more people at lower interest rates, it means there is sufficient monetary stimulus from Central Banks to promote economic growth and money is easy to come by. Such inflationary pressures stimulate economic growth and indicate that the economy is likely to grow steadily.
The increase in vehicle sales figures reinforces the positive affirmations forecasted by other economic indicators like consumer spending or interest rates. As consumer spending comprises more than two-thirds of the GDP, an increase in vehicle sales likely indicates a healthy two or three quarters that are going to continue in the economy.
Equity markets respond and perform exceptionally well around the Total Vehicle Sales figures, as the increasing figures in sales imply increasing profits for the related companies. The increase in profits due to sales is doubled down by the stock prices soaring higher, and vice-versa also holds. Hence, the vehicle sales figures are given much-deserved attention every month by the equity traders and the media. To some degree, currency markets feed off from the equity markets, but the effect is noticeable only when the changes are significant.
Vehicle purchases are considered to be discretionary spending, and when people are paying for such items, it indicates the economy is flourishing. The relation between vehicle sales and economic growth also becomes more apparent during recessions, where vehicle sales drop significantly. During the Great recession of 2007-2009, vehicle sales fell by 3 million.
With rapid development in the automobile industry, more durable vehicles that last longer, unlike older models, are coming into the market. It means people need not buy new vehicles as frequently as before. Hence, recent trends should incorporate this factor also into the statistics.
Alongside this, there is a shift in the industry due to disruptive brands like Tesla introducing electric cars as a contrast to combustion engines. It affects the industry and the dependent oil and gasoline industries as well. Self-driving and Artificial Intelligence equipped automobiles are catching up with the people, and this could soon invalidate many traditional jobs that came as a result of the regular gasoline cars and trucks.
The current COVID-19 pandemic already cost the economies of most countries much than they could handle, and many industries suffered heavy losses. The silver lining for the automotive industry is coming from the fact that as people resume their regular life by going back to their work require a safe commute. Things are looking brighter for the automobile industry as more people are considering the safety assured through private commute over the risk involved in the public transportation system.
Impact on Currency
Vehicle Sales acts as a coincident indicator that reflects the health of the economy at the current state. The currency markets are focused more on the leading indicators before the trends pick up. Total vehicle sales prove to be more useful for the equity markets for trading on the automobile and other related industries, but currencies require more than just vehicle sales.
Hence, overall Total Vehicle Sales are a low-impact indicator for the FOREX market and are useful in double-checking or reaffirming our leading indicator predictions. Economists and business analysts will use total vehicle sales data to report current economic health, but currency traders can overlook this indicator for other macroeconomic leading indicators.
Economic Reports
The Bureau of Economic Analysis (BEA) provides monthly reports on total vehicle sales on its official website. Apart from this, the St. Louis FRED website also details the same figures historically in a more comprehensive and visually depictive way.
Sources of Total Vehicle Sales
We can obtain Total Vehicle Sales figures for the United States from BEA.
For analysis purposes, the St. Louis FRED website offers better resources and ease of access for Vehicle Sales figures.
We can obtain Global Total Vehicle Sales figures for the majority of the countries from Trading Economics.
How Total Vehicle Sales Data Release Affects The Price Charts
In the US economy, total vehicle sales data is an important leading indicator of consumer spending and consumer confidence. It measures the annualized number of new vehicles sold domestically in the reported month. The most recent data related to this was released on August 3, 2020, at 7.00 PM ET. The total vehicle sales is a combination of all car sales and all truck sales data and can be accessed from Investing.com here. The historical data of total vehicle sales can be accessed from Trading Economics here.
The screengrab below is of the monthly total vehicle sales from Investing.com.
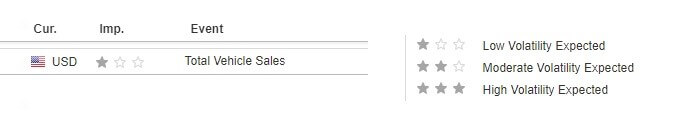
As can be seen, the total vehicle sales data is expected to have a low impact on the USD upon its release.
The screengrab below shows the most recent changes in the monthly total vehicle sales data in the US. In July 2020, the monthly total vehicle sales were 14.5 million compared to 13.1 million in June 2020. This increase is expected to be positive for the USD.

Now, let’s see how this release made an impact on the Forex price charts.
EUR/USD: Before Monthly Total Vehicle Sales Release on August
2020, Just Before 7.30 PM ET
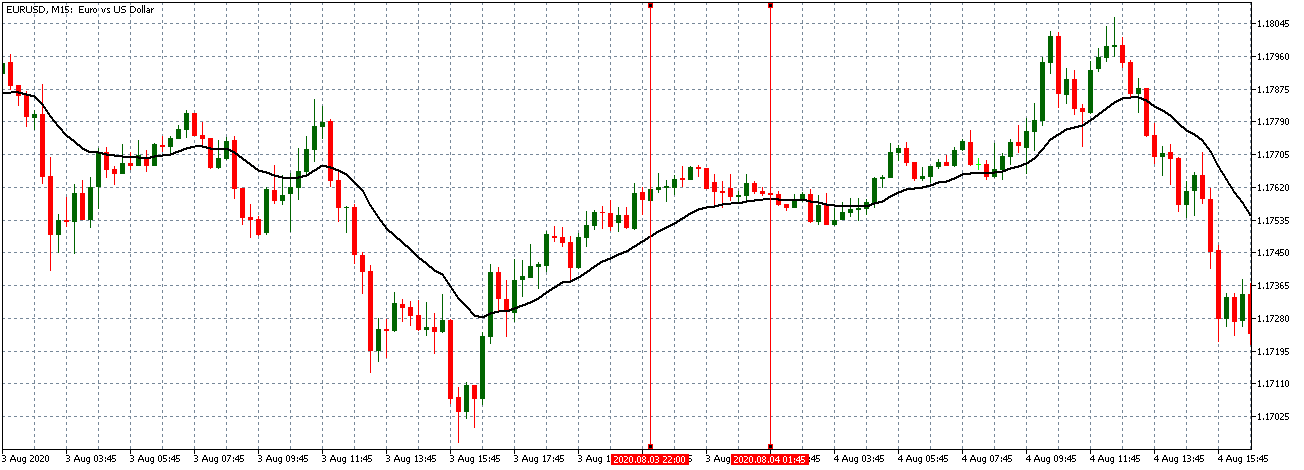
From the above 15-min EUR/USD chart, the pair can be seen to be trading on a neutral trend before the release of the total vehicle sales data. This trend represents a period of relative market inactivity with candles forming near a flattening 20-period Moving Average.
EUR/USD: After the Monthly Total Vehicle Sales Release on
August 2020, 7.30 PM ET
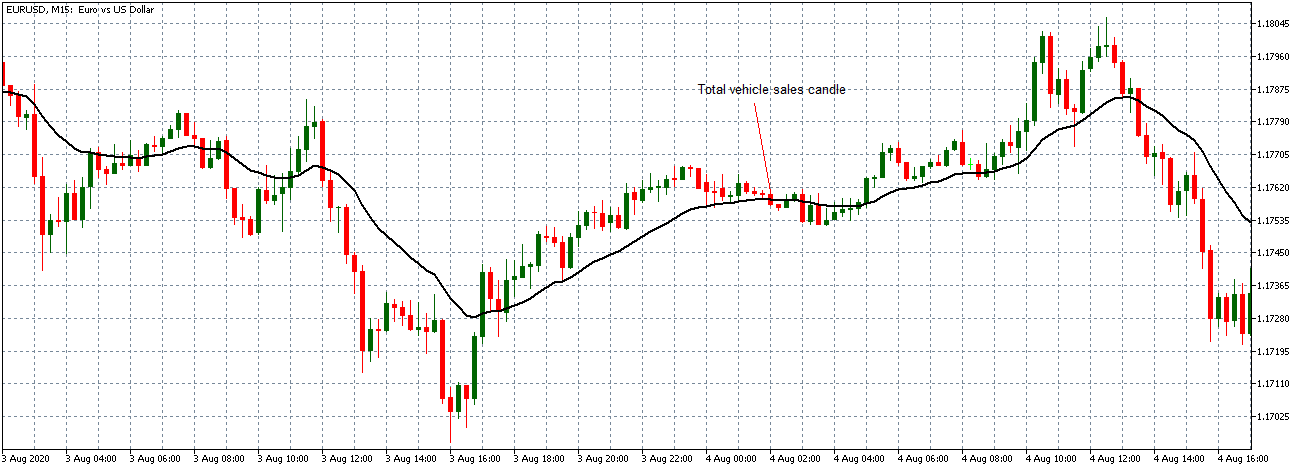
After the data release, this Forex pair formed a 15-minute bearish candle, indicating that the USD became stronger as expected due to the increase in total vehicle sales. The data release was, however, not significant enough to cause any market volatility as the pair continued to trade in a neutral trend with the 20-period Moving Average flattening.
GBP/USD: Before Monthly Total Vehicle Sales Release on August
2020, Just Before 7.30 PM ET

Similar to the trend that we have observed with the EUR/USD pair, the GBP/USD was trading in a neutral pattern before the data release with candles forming around a flattening 20-period MA.
GBP/USD: After the Monthly Total Vehicle Sales Release on
August 2020, 7.30 PM ET
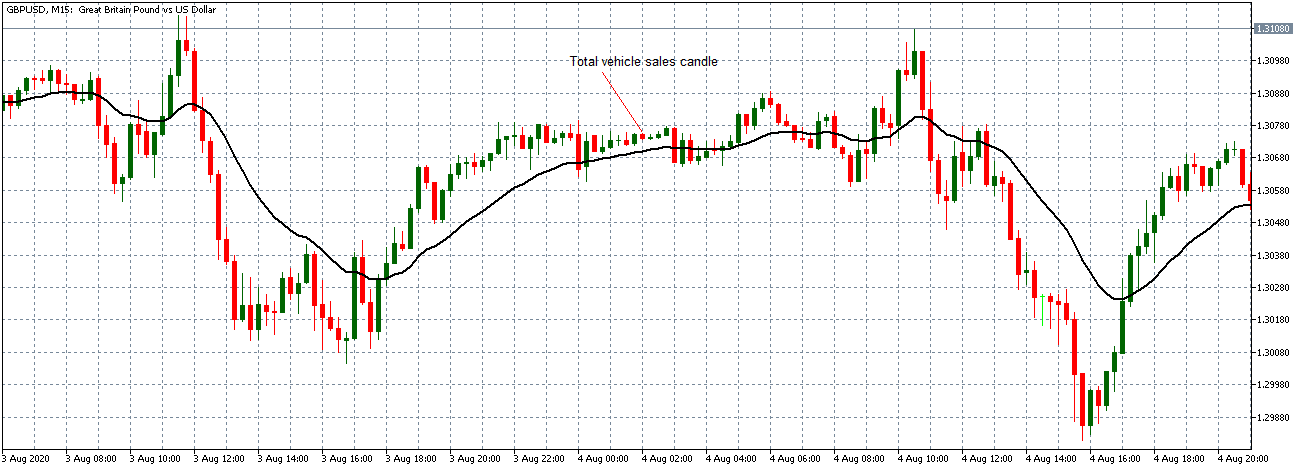
After the news announcement, this pair formed a 15-min bearish candle but continued trading in the neutral trend observed before the data release.
AUD/USD: Before Monthly Total Vehicle Sales Release on August
2020, Just Before 7.30 PM ET
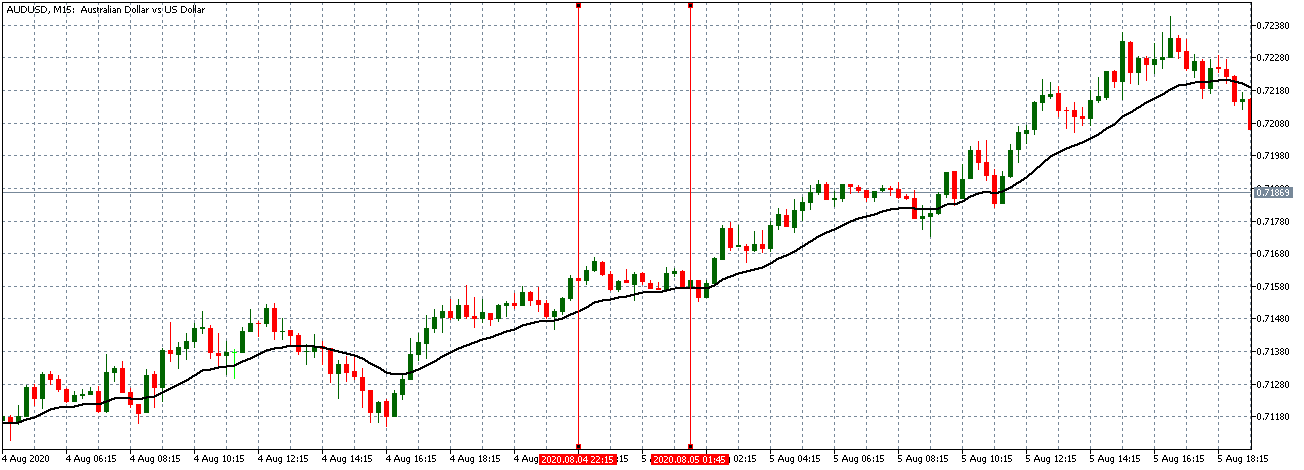
AUD/USD: After the Monthly Total Vehicle Sales Release on
August 2020, 7.30 PM ET

As observed with the EUR/USD and the GBP/USD pairs, the AUD/USD traded within a subdued neutral trend before the data release. The pair formed a 15-minute bearish candle after the news release, but unlike the other pairs, it continued trading in a weak uptrend.
Although it plays a vital role as an indicator within the economy, it is evident that the total vehicle sales indicator does not cause any significant impact on the price action in the forex markets.