Categories
Forex Education Forex Fundamental Analysis

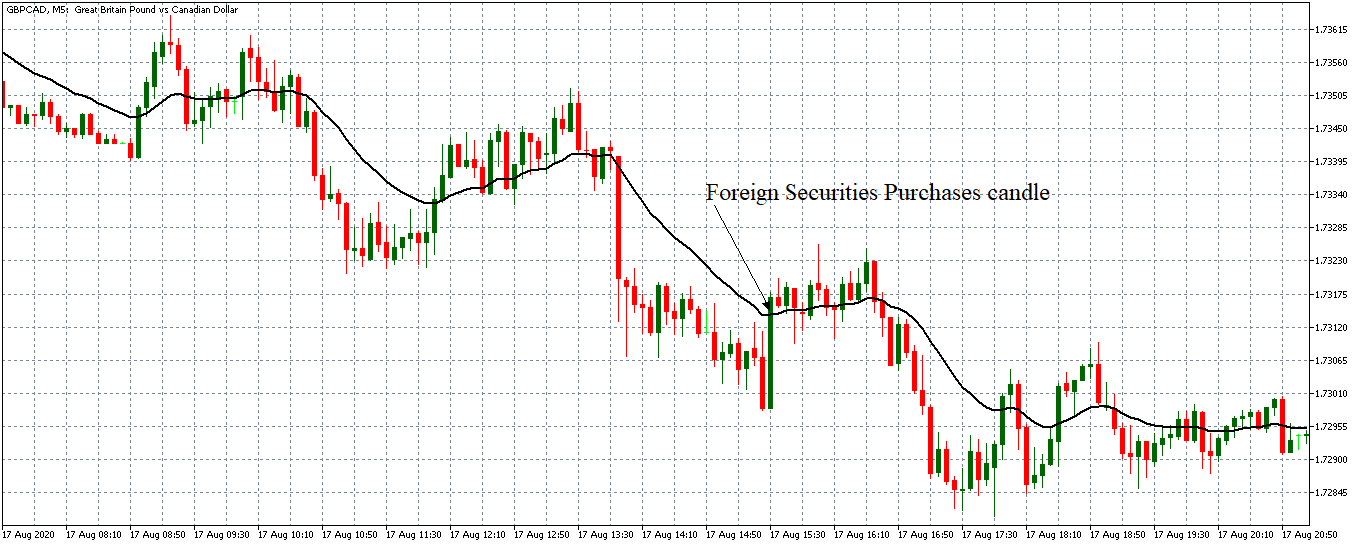
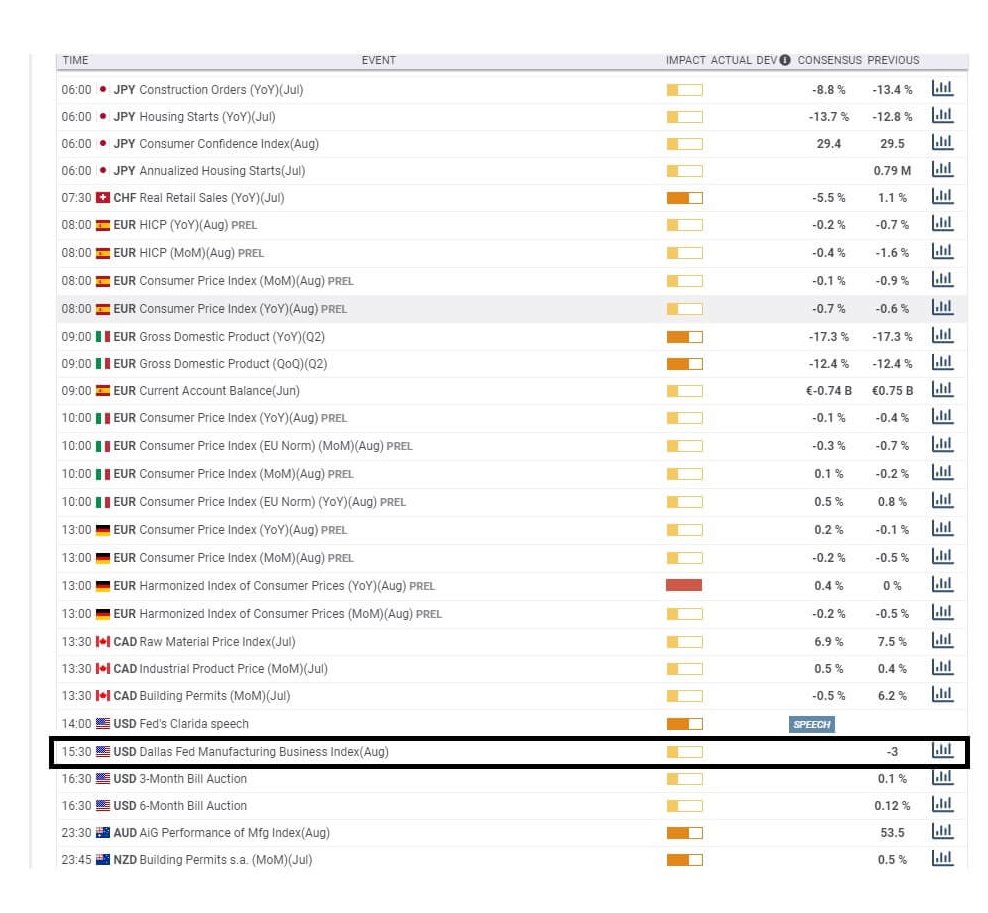
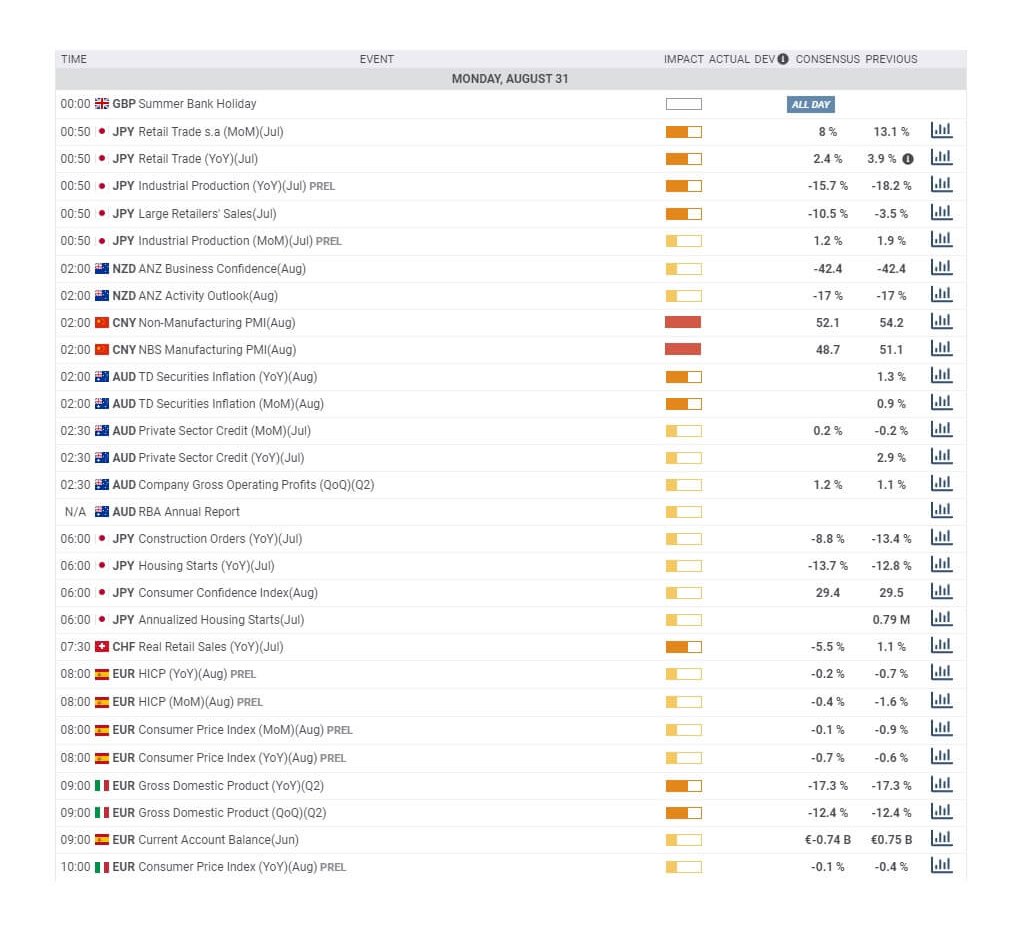
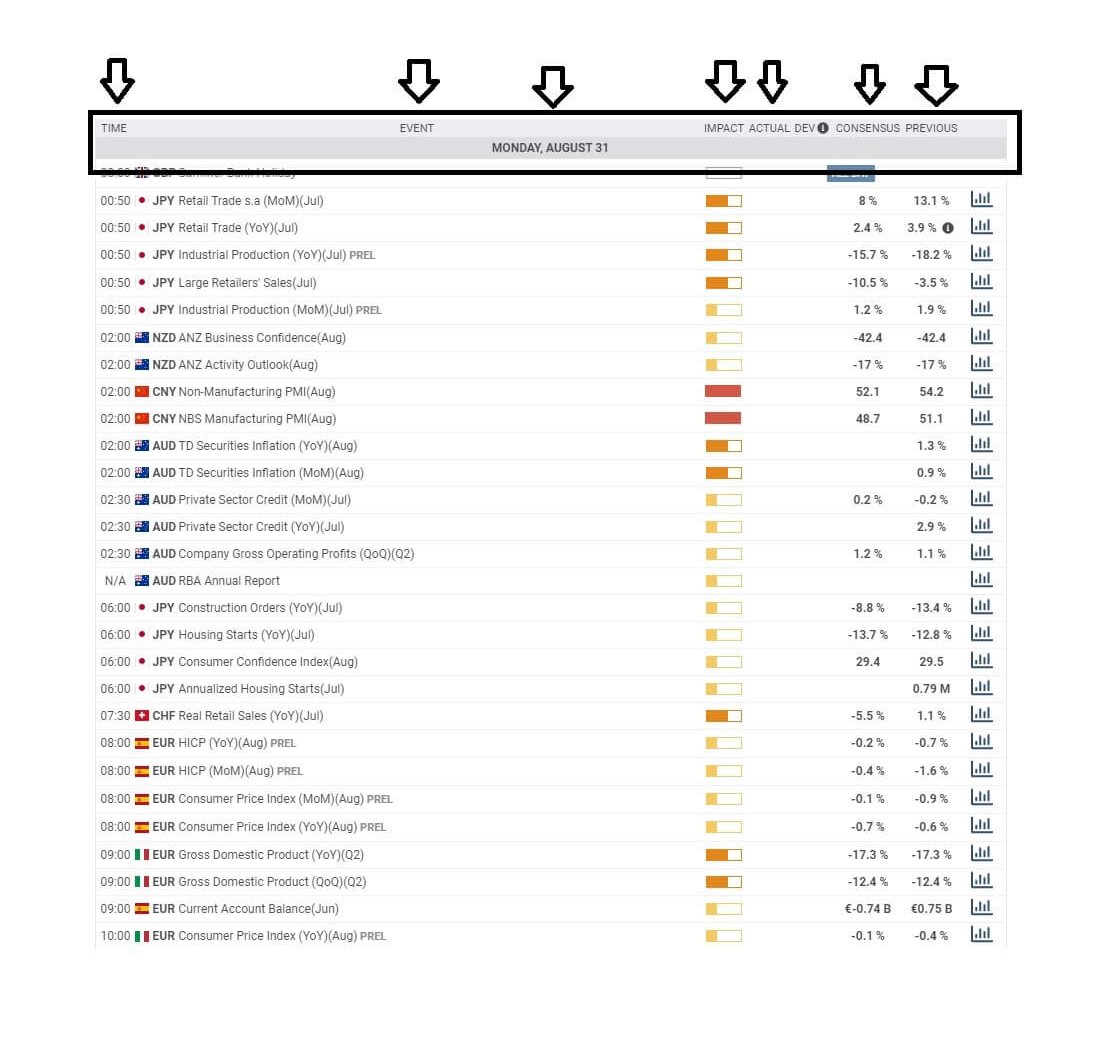
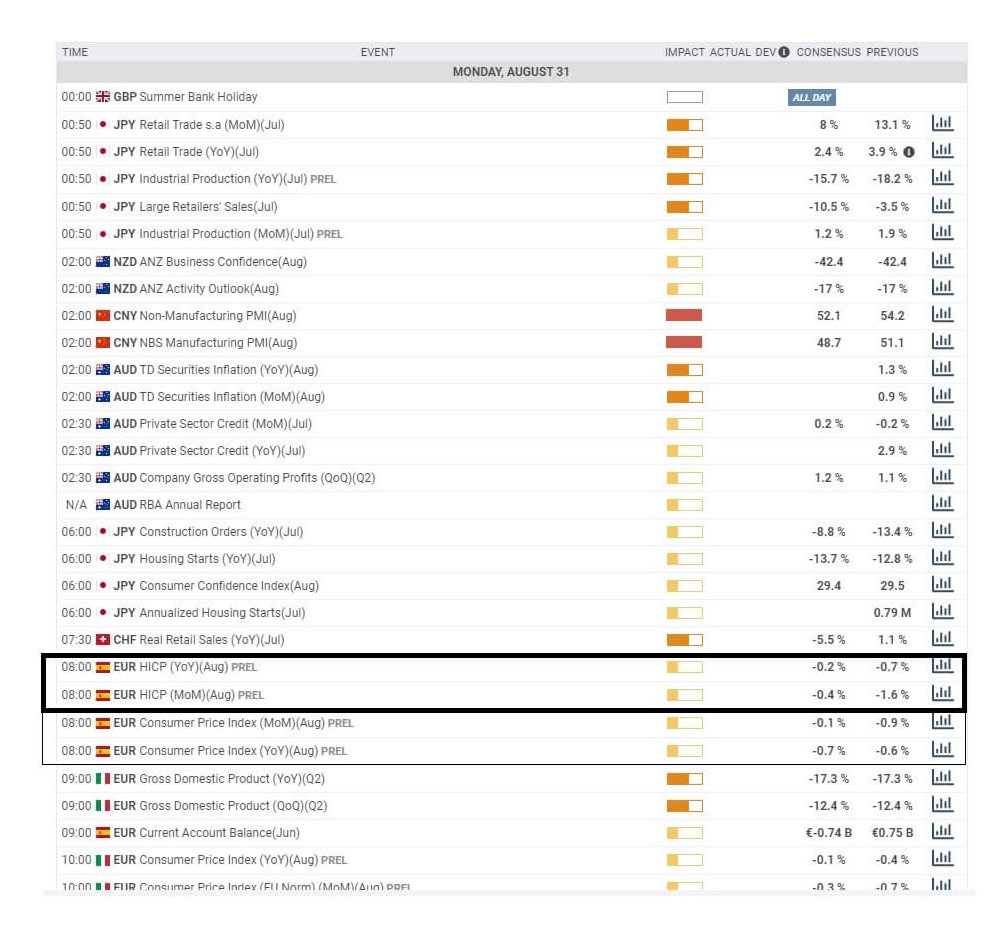
Trading Forex On the Most Important News Events

It is possible that you have come this far because you are thinking about trading when news is published and taking advantage of the big moves that occur at that time. You may also simply wonder if this is possible or how it can be done. The best thing is to go point by point to see how and what news affects when we do trading, everything you should contemplate, and some things that don’t usually tell you.

What Economic News Impacts Trading?

As you may know, there are different news items that affect trading, especially in forex, such as macroeconomic events (for example, interest rate decisions), government policy decisions, employment news publications. Basically, we can distinguish between:

Economic News: GDP, inflation, unemployment or oil reserves, any related economic aspects that can affect a country and its currency.

Political News: decisions and governmental actions that are carried out in the country in question and have direct involvement in currency.

All of them are important (though some to a lesser or greater extent than others) and you can often see how when they are published it makes the currency pair in question move significantly. But how do we know when and what data will be published and the impact it will generate?

How to NOT Predict Trading News

It’s obvious, isn’t it? We already know when they’re going to be published, we’re going to put a lot of money in and let the flute play. NO. This might not work for you. And even if you get it right, you’ll end up losing everything. Events such as the one that occurred in the Swiss Franc (black swan) or the Brexit have left the graveyard full of traders. Even some brokers have had to close. Why?

News Trading Errors

Behind an excuse of losing money by trading when a story is published there is usually one or several of these causes:

Strong Leverage: Enter the market strong with a small account to earn a lot of money in a short time. In the end, your account does not resist and a minimal movement to the contra makes you lose count. Serious error.

Bet Mode: not having a trading system and think that this goes up or down because it comes out in the media, my brother-in-law has told me or because yes. If you don’t have a system, start working for it.

Stop-loss Strategies: Strategies with very small stops often do not have good results when the price moves aggressively. The institutional (the big ones) sweep them away. It’s not that these kinds of strategies are wrong or anything, but consider reviewing how they behave when these data are posted and limiting your trading if it doesn’t affect them in a positive way. This can be done not by being in front of the screen if you operate manually or by disconnecting your systems if you do so automatically.

News-Based Trading Systems

You may have read or thought that trading with the news can be very easy if you place a purchase order and a sales order. This hypothesis starts from the idea that price moves without setbacks. Most of the time this is not the case, since the price can be directed without a trend, either in its initial phase or during the entire period.

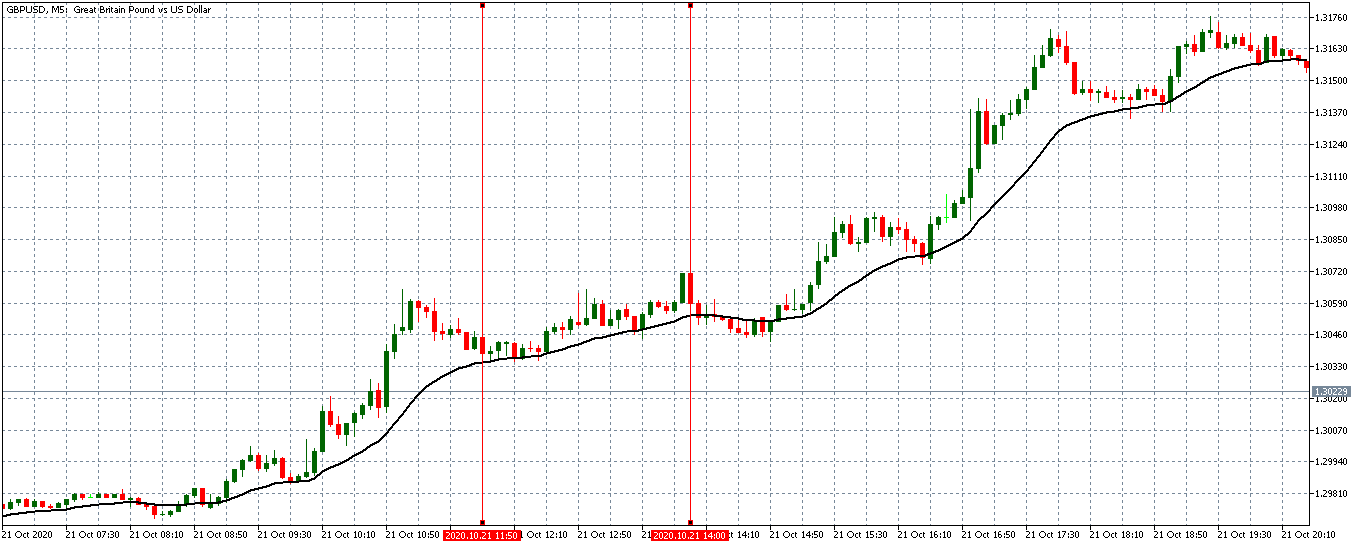
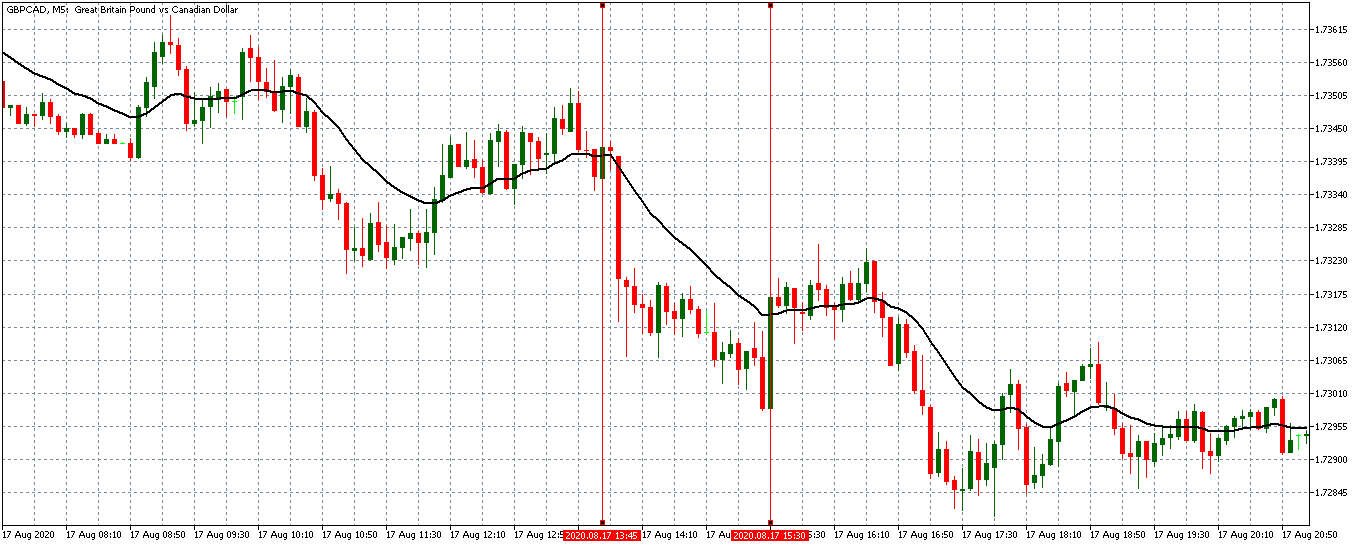
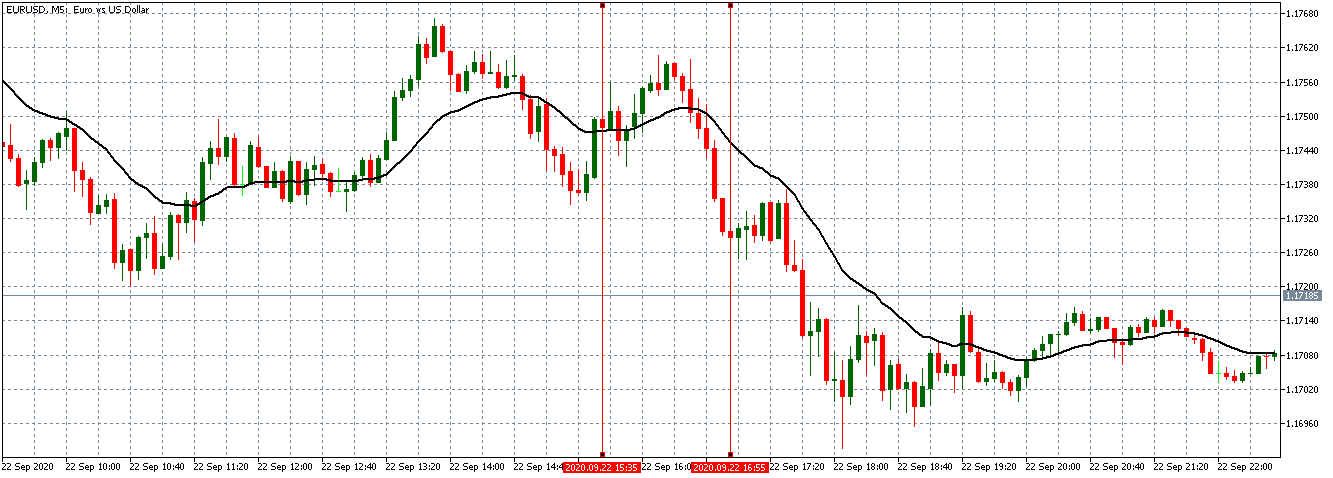
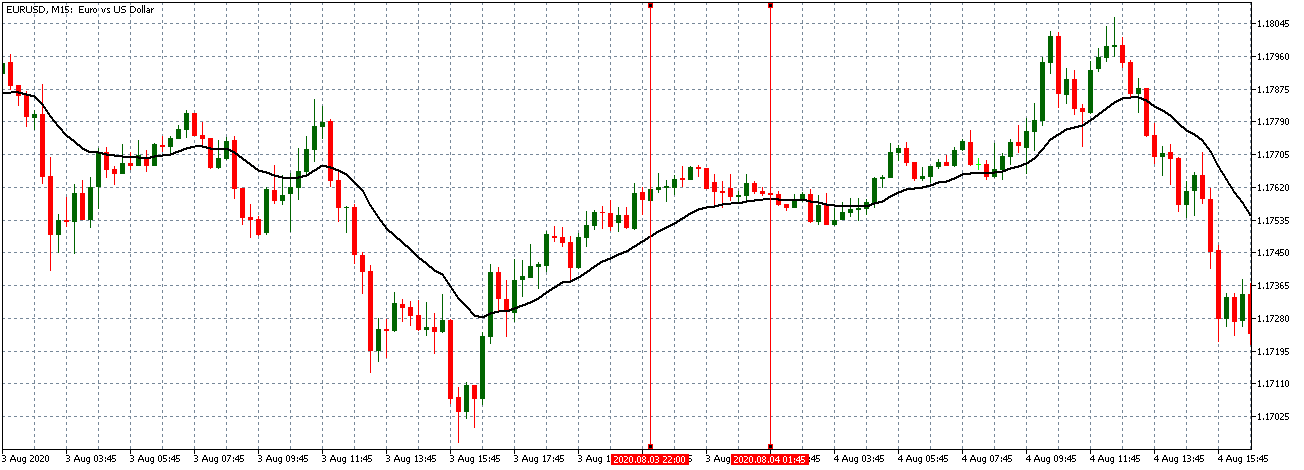
The price moves aimlessly before the news. We place a purchase order (above) and a sale order (below). Do not take into account the zones, it is just an example to see it.

Suppose we leave them as they are. They activate both and we lose the difference. Suppose now that when the first is activated we cancel the other. In this case, we also lose because we opened activated the purchase and subsequently the price falls. This doesn’t have to be like this forever, I just give you this example to you realize that what we’re dealing with isn’t as wonderful as appears in your mind.

Be careful with it. Try it, but be very careful and check results with backtesting. Logic makes us think that this can go well but then when we see the results we realize that often this is not so. These types of operations are usually displayed by brokers and platforms so that you operate when there is a lot of volatility and with a lot of money. Then they do their business, earn commissions and win when the customer loses. As a trader, you must be above these things and concentrate on your business and your operation.

Trading with Volatility and News

It is normal that you can think after all this when you open your trading platform “what if the flute sounds? what if it does?”. We’ve all read the typical news in the newspaper where it tells you that x person won an incredible amount of money with x event. Quick and easy. Here the survival bias is very high. Don’t tell you that that could be 0.0001%

Actually, with all this, I’m not telling you that you can’t trade when news comes in, I’m telling you to get your mind off the fact that you make a lot of money luckily. If you do not use high leverage and for example apply swing trading strategies or you have a % risk in each small trade if you diversify. this news will not affect to a greater extent.

In fact, be clear that most of the time there will be a complicated situation in the market: currency wars, economic crises, political decisions. Volatility in the market can occur when you least expect it and you should be a trader who knows how to manage this well.

Mind-Set to Trade News Trading

Many traders think that news is the axis of their ills and that all their losses are due to this or the other. It’s not like that. These are just excuses. You may also have heard something like “but if the data is good, why does the price drop?”. Simply because in the financial markets prices are driven by expectations. That is, the price at which an asset is quoted includes what is expected of that asset in the future. So that’s why when you publish a piece of information that you assume is good, some institutional investors had already taken it into account and even though it would be even better.

You have to have a micro mindset (each operation counts) and a macro mindset (what is really important in the long term and its consequences). So if you play a card with a piece of information or a piece of news, you’re sending the macro to take it for granted. Keep this in mind or you’ll learn it by taking out your wallet and burning accounts.

New Is Not the Solution (or Problem)

Why, instead of focusing on speculation or news, don’t you focus on what you have objectively? That is data-based trading systems. When investing in the long term it makes sense to read and soak up some company and industry news. But by trading, we look for short-term moves. Do you really think you can from home predict a story that is public in a market as big as the currency market?

What you could do is concentrate on creating systems that have a positive statistical advantage and apply them rigorously. If it’s the news and it works well, great. But don’t get obsessed with the idea that news is the origin of everything. Focus on what you can control.

All this being said, in my case what I do is I keep in mind the news to keep in mind the moments where the market can move aggressively. If there is a moment (very punctual) where a lot of news (very important) will be published or a weekend where there is some decision that can make the markets shake, I try to close everything and be out. But this is at very specific times, perhaps less than 1%. Most of the time I take on this volatility and adapt my systems to them.

Ignoring News In the Press

In recent months, for example, a lot of news has been published about Brexit and most of it seemed definitive. The bottom line is that a year has passed and nothing has changed. Another situation: Trump’s ongoing tweets. You can’t predict that. Face it. It’s part of the equation of trading. And it also makes it different.

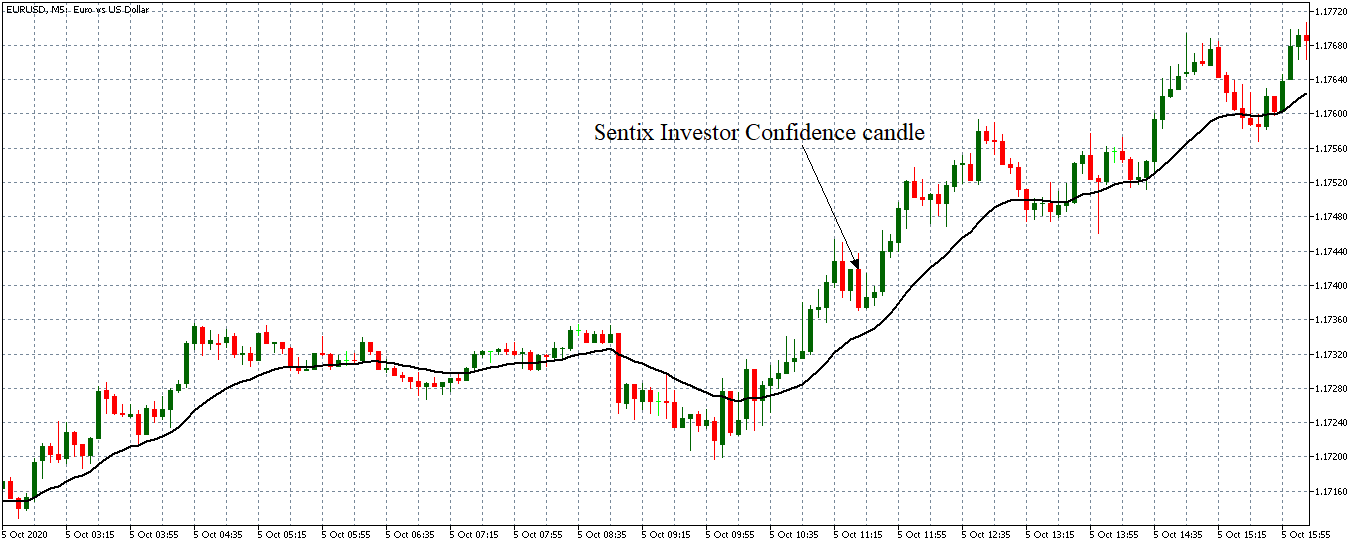
The press always has a good headline to justify what is happening. For example, after an event, the EUR/USD pair goes up. You can read or listen in some media: “The EUR/USD crossing goes up despite the measures of the European Central Bank.” However, if after that same event the pair falls you can read something like: “The EUR/USD crossing drops due to the measures of the European Central Bank.”

It’s kind of like knowing the end and creating an argument that makes sense to get to that end. We as traders are interested in the behavior in the price market, the rest is just noise that gives us little good. This is another of the big arguments why I trade through systems, they don’t get carried away by this kind of thing.

Categories
Forex Fundamental Analysis

GBP/CAD Global Macro Analysis – Part 3

GBP/CAD Exogenous Analysis

The UK and Canada Current Account Differential

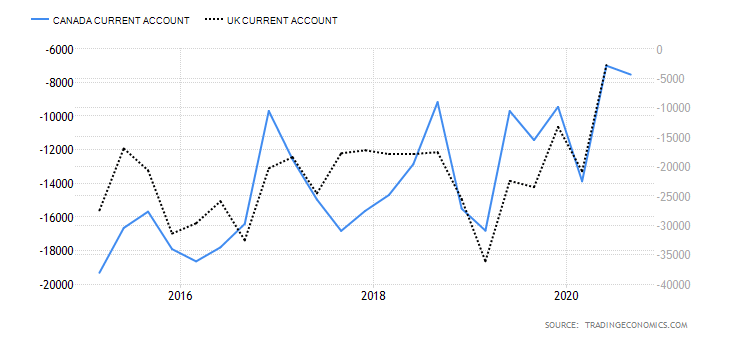
The current account differential between the UK and Canada can determine if the GBP/CAD pair is bullish or bearish. If the differential is positive, it means that the UK has a higher current account balance than Canada. This would imply that the GBP is in higher demand in the forex market than the CAD; hence, it is a bullish trend for the pair. Conversely, if the current account differential is negative, it means that the UK has a lesser current balance than Canada. It would imply that the GBP has a lower demand than the CAD in the forex market; hence, a bearish trend for the pair.

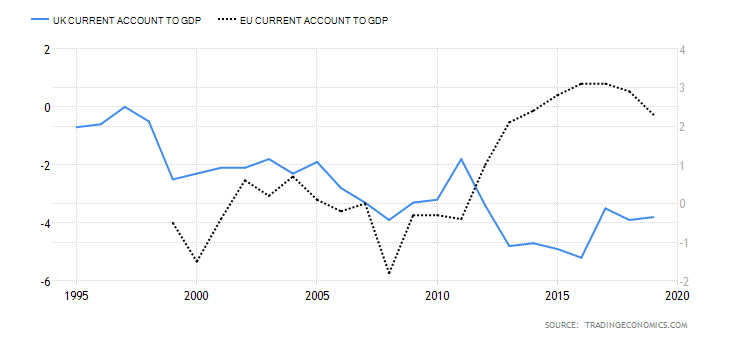
In Q3 of 2020, the UK had a current account deficit of $20.97 billion while Canada had a $5.83 billion deficit. Thus, the current account differential is -$15.14 billion. We assign a score of -2.

The interest rate differential between the UK and Canada

The interest rate differential is the difference between the Bank of England’s interest rate and that by the Bank of Canada. In the forex market, carry traders use the interest rate differential to decide whether to buy or short a currency pair. When the interest rate differential is positive, traders will earn the differential by going long. If the differential is negative, traders can earn the differential by shorting the currency pair.

Therefore, if the GBP/CAD pair’s interest rate differential is positive, the pair is bound to adopt a bullish trend. Conversely, if negative, the pair is bound to be bearish.

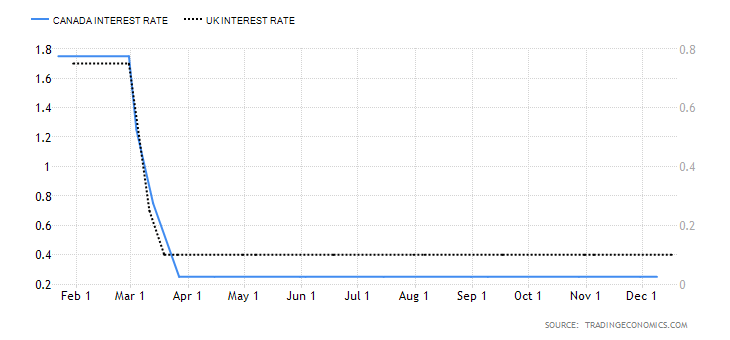
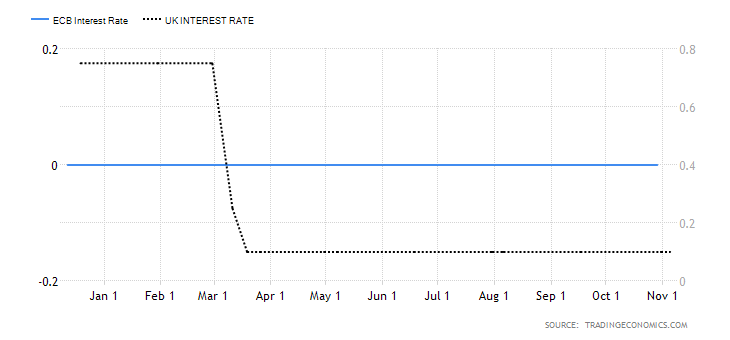
In 2020, the interest rate in the UK dropped from 0.75% to 0.1%. In Canada, the BOC cut interest rates from 1.75% to 0.25%. Therefore, the interest rate differential is -0.15%. The interest rate differential between the UK and Canada has a score of -1.

The differential in GDP growth rate between the UK and Canada

This differential measures the changes in the growth rate between the two economies. It is a preferred method of comparison since economies are of different sizes. Naturally, the economy with a higher GDP growth rate will have its currency appreciate more. Therefore, if the GDP growth rate differential is positive, it means that the GBP/CAD pair is bullish. If negative, then the pair is bearish.

During the first three quarters of 2020, the UK economy has contracted by 5.8%, while the Canadian economy has contracted by 3.3%. This makes the GDP growth rate differential -2.5%. Hence, a score of -1.

Conclusion

Indicator Score Total State Comment
The UK and Canada Current Account Differential -2 10 A differential of – $15.14 The UK has a higher deficit than Canada
The interest rate differential between the UK and Canada -1 10 -0.15% Expected to remain at -0.15% until either economy have recovered
The differential in GDP growth rate between the UK and Canada -1 10 3.30% The Canadian economy contracted at a slower pace than the UK economy
TOTAL SCORE -4

The cumulative score for the exogenous factors is -4. This means that we can expect the GBP/CAD pair to trade in a downtrend in the short term.

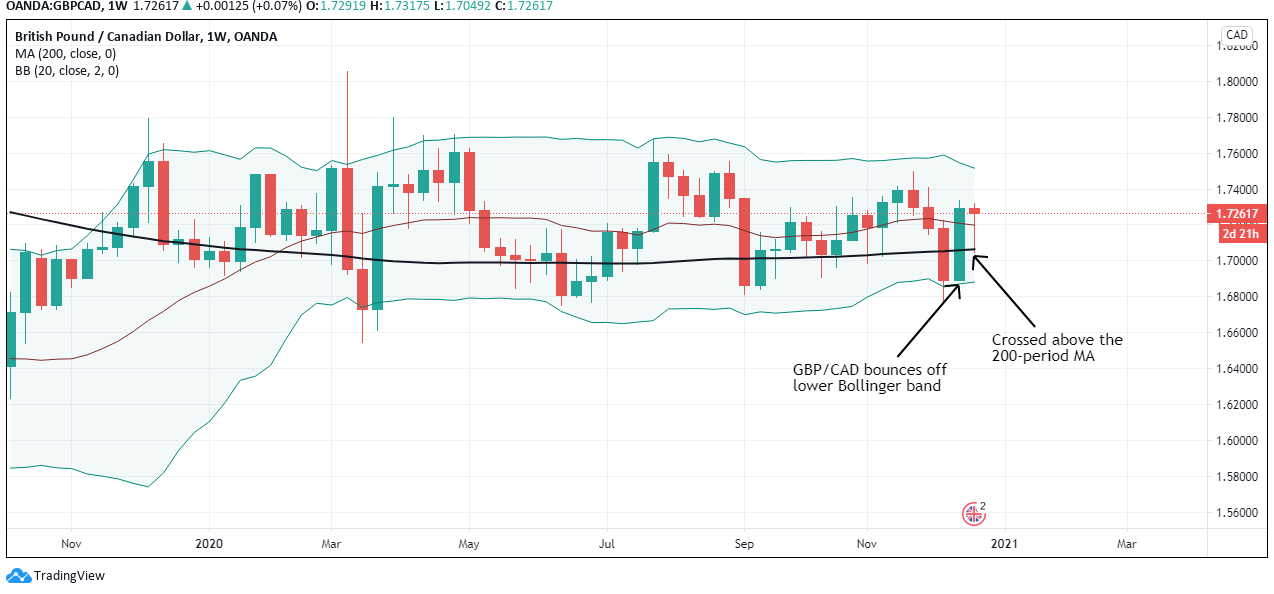
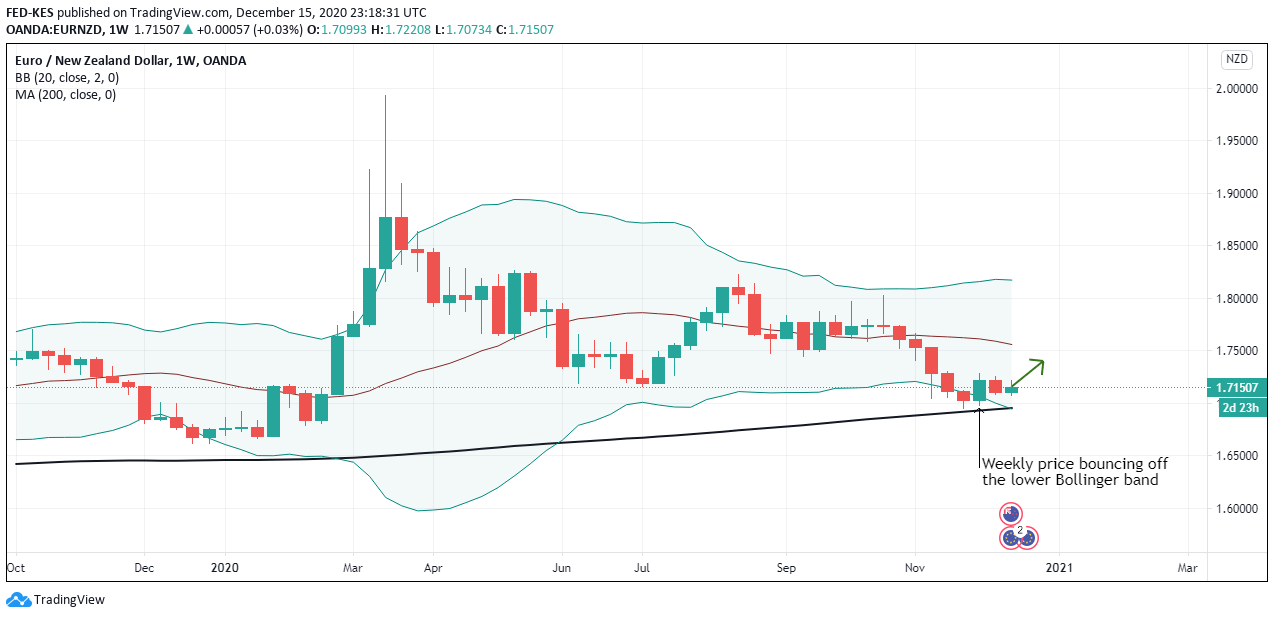
However, technical analysis shows the pair adopting a bullish trend with the weekly chart trading above the 200-period MA. More so, the pair is seen bouncing off the lower Bollinger band. Keep an eye on the near-term changes in the exogenous factors.

Categories
Forex Fundamental Analysis

GBP/CAD Global Macro Analysis – Part 1 & 2

Introduction

This analysis will evaluate the endogenous factors that affect the domestic economy in both the UK and Canada. We’ll also cover exogenous factors that influence the price of the GBP/CAD pair.

Ranking Scale

After analysis, we will rank both the exogenous and the endogenous factors on a scale from -10 to +10.

Endogenous factors will be ranked after a correlation analysis with the GDP growth rate. If negative, it means that either the GBP or the CAD have depreciated. If positive, it means that the domestic currency has appreciated.

The exogenous factors are ranked based on their correlation with the GBP/CAD pair’s exchange rate. When negative, it means that the price will drop. The price will be expected to increase if the exogenous analysis is positive.

Summary – GBP Endogenous Analysis

-15 score on Pound’s Endogenous Analysis indicates that this currency has depreciated since the beginning of 2020.

Summary – CAD Endogenous Analysis

  • Canada Employment Rate

The Canadian employment rate measures the percentage of the labor force that is employed during a particular period. The developments in the labor market are a leading indicator of overall economic growth. When the economy is expanding, there are more job openings, hence a higher employment rate. Conversely, when the economy is going through a recession, businesses close down, leading to a dropping employment rate.

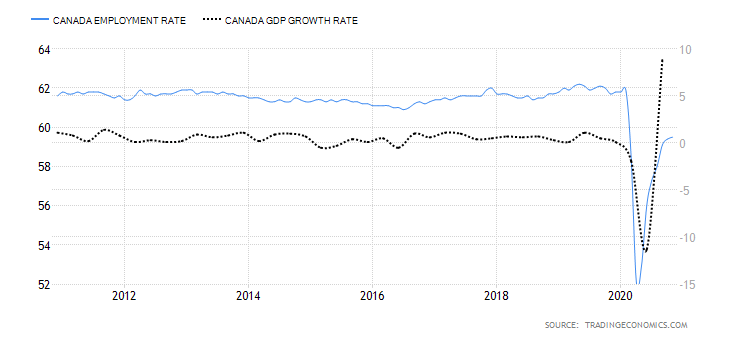
In November 2020, the employment rate in Canada rose to 59.5% from 59.4% in October. Although the employment rate has been steadily increasing from the lows of 52.1% in April, it is still lower than in January. Canada’s employment rate has a score of -6.

  • Canada Core Consumer Prices

This index measures the overall change in Canada’s inflation rate based on a survey of price changes for a basket of consumer goods. The rate of inflation gauges the increase in economic activity. Typically, when demand is depressed in an economy, prices drop, resulting in lower inflation. Conversely, when demand increases, prices tend to increase, resulting in a higher rate of inflation.

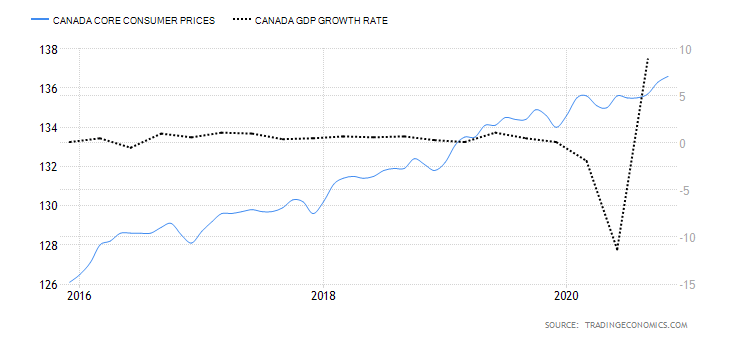
In November 2020, Canada’s core consumer prices rose to 136.6 points from 136.3 in October. Between January and November, the index has increased by 2 points. It has a score of 3.

  • Canada Manufacturing Production

This index measures the YoY change in the value of the output from the Canadian manufacturing sector. Canadian manufacturing is a significant contributor to the labor market and economic growth. In the age of the coronavirus disruption, changes in manufacturing production show how faster the economy is bouncing back.

In September 2020, the YoY manufacturing production in Canada dropped by 4.24%. This is an improvement compared to the 5.34% drop recorded in August. Canadian manufacturing production has a score of -2.

  • Canada Business Confidence

The Ivey Purchasing Managers Index (PMI) measures monthly business confidence in Canada. In the survey, private and public companies rate whether the current business activity is higher or lower than the previous month. The index survey aspects including inventories, purchases, deliveries from suppliers, output prices, and employment.

When the index is over 50, it means that purchases have increased from the preceding month. Reading of below 50 shows a decrease in purchases.

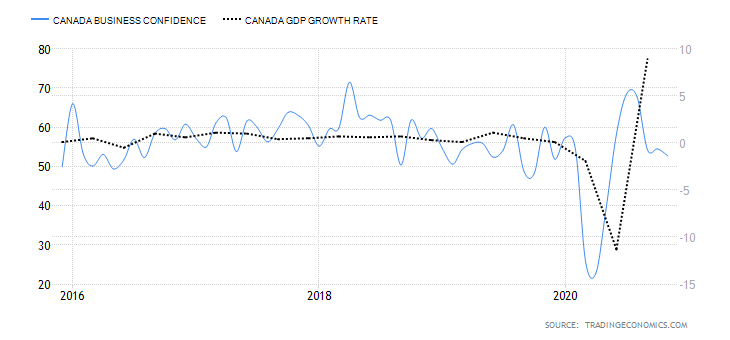
In November 2020, Canadian business confidence dropped to 52.7 from 54.5 in October. This was the lowest reading since May, when the economy began rebounding from the shocks of  COVID-19. Consequently, Canada’s business confidence has a score of 1.

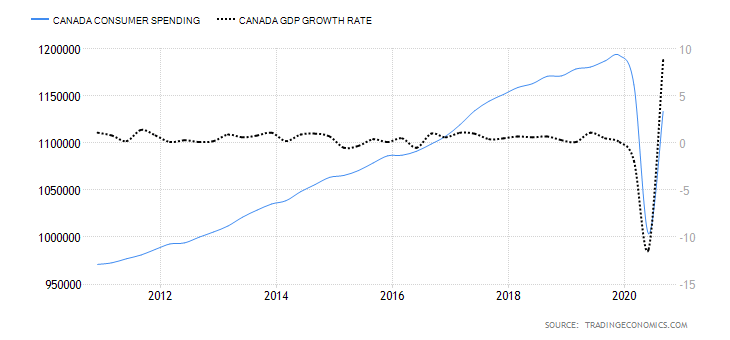
  • Canada Consumer Spending

This measures the final market value of all household expenditures on goods and services. It also includes expenditure by non-profit organizations that serve households in Canada but excludes purchases of homes. Consumer spending plays a critical role in economic growth.

In Q3 of 2020, consumer spending in Canada rose to CAD 1.13 trillion from CAD 1 trillion in Q2. However, it is still lower than consumer spending recorded in Q1. Thus, Canada’s consumer spending has a score of -4.

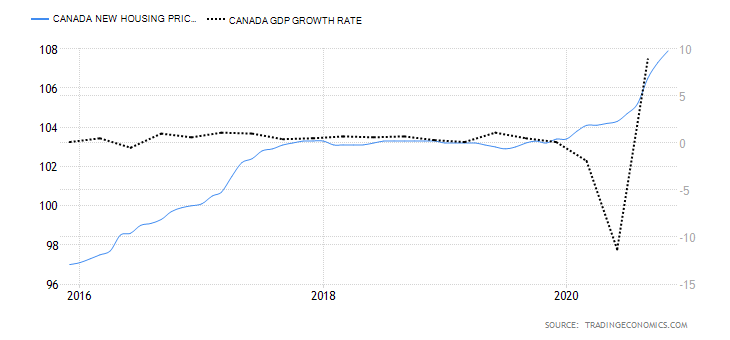
  • Canada New Housing Price Index

The Canadian NHPI measures the changes in the selling price of newly built residential houses. The price measured is that paid by the home buyers to the contractors. Note that the price comparison is strictly between houses of the same specification. The NHPI shows the construction sector’s growth trends; hence, it corresponds to changes in the labor market and GDP growth.

In November 2020, the Canadian NHPI rose to 107.9 from 107.3 in October. Thus, we assign a score of 3.

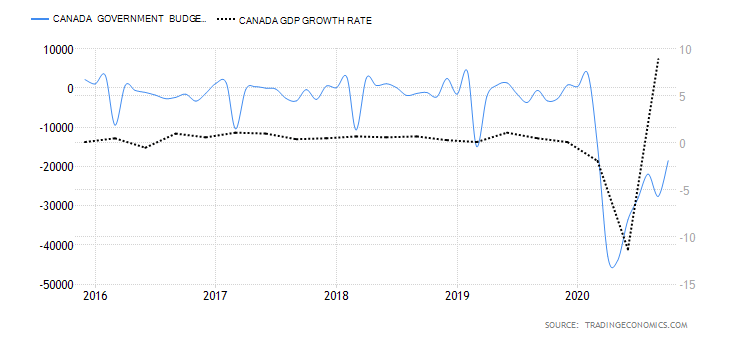
  • Canada Government Budget Value

This indicator tracks the changes in the difference between the Canadian government revenues and expenditures. It shows whether the government is running a surplus or a deficit. It also breaks down the changes in the receipts by the government. This helps to show how the overall economy is fairing.

In October 2020, the Canadian government budget had a deficit of CAD 18.51 billion compared to CAD 27.59 billion in September. Throughout the year, the budget deficits have been due to the economic shocks brought on by the coronavirus pandemic. The Canadian government had to ramp up expenditure through its Economic Response Plan, while revenues dropped in the same period. We assign it a score of -5.

Conclusion

Indicator Score Total State Comment
Canada Employment Rate -6 10 59.5% in November 2020 The employment rate is steadily increasing. It is, however, still below January levels
Canada Core Consumer Prices 3 10 136.6 points in November 2020 Since January, it has increased by 2 points. That shows demand in the economy has kept prices higher
Canada Manufacturing Production -2 10 YoY dropped by 4.24% in September 2020 A slight increase from -5.34% recorded in August. This shows that the manufacturing production is returning to the pre-pandemic levels
Canada Business Confidence 1 10 52.7 in November November level was the lowest since the economy began to recover in May. It’s expected to improve as mass vaccinations against COVID-19 rolls out
Canada Consumer Spending -4 10 Was CAD 1.13 trillion Q3 2020 Recovered from CAD 1 trillion in Q2 but still lower than Q1. This shows that demand is increasing in the economy
Canada New Housing Price Index 3 10 November NHPI was 107.9 It has been increasing, which shows that output in the construction industry is improving
Canada Government Budget Value -5 10 a budget deficit of CAD 18.51 billion in October The deficit widened in 2020, driven by unprecedented fiscal policies to curb recessionary pressure from the pandemic
TOTAL SCORE -10

A score of -10 indicates that the CAD has depreciated since the beginning of the year 2020.

In the next article, you can find the exogenous analysis of GBP/CAD where we have forecasted this pair’s future price movements. Cheers.

GBP/CAD Exogenous Analysis

  • The UK and Canada Current Account Differential

The current account differential between the UK and Canada can determine if the GBP/CAD pair is bullish or bearish. If the differential is positive, it means that the UK has a higher current account balance than Canada. This would imply that the GBP is in higher demand in the forex market than the CAD; hence, it is a bullish trend for the pair. Conversely, if the current account differential is negative, it means that the UK has a lesser current balance than Canada. It would imply that the GBP has a lower demand than the CAD in the forex market; hence, a bearish trend for the pair.

In Q3 of 2020, the UK had a current account deficit of $20.97 billion while Canada had a $5.83 billion deficit. Thus, the current account differential is -$15.14 billion. We assign a score of -2.

The interest rate differential is the difference between the Bank of England’s interest rate and that by the Bank of Canada. In the forex market, carry traders use the interest rate differential to decide whether to buy or short a currency pair. When the interest rate differential is positive, traders will earn the differential by going long. If the differential is negative, traders can earn the differential by shorting the currency pair.

Therefore, if the GBP/CAD pair’s interest rate differential is positive, the pair is bound to adopt a bullish trend. Conversely, if negative, the pair is bound to be bearish.

In 2020, the interest rate in the UK dropped from 0.75% to 0.1%. In Canada, the BOC cut the interest rate from 1.75% to 0.25%. Therefore, the interest rate differential is -0.15%. The interest rate differential between the UK and Canada has a score of -1.

  • The differential in GDP growth rate between the UK and Canada

This differential measures the changes in the growth rate between the two economies. It is a preferred method of comparison since economies are of different sizes. Naturally, the economy with a higher GDP growth rate will have its currency appreciate more. Therefore, if the GDP growth rate differential is positive, it means that the GBP/CAD pair is bullish. If negative, then the pair is bearish.

During the first three quarters of 2020, the UK economy has contracted by 5.8%, while the Canadian economy has contracted by 3.3%. This makes the GDP growth rate differential -2.5%. Hence, a score of -1.

Conclusion

Indicator Score Total State Comment
The UK and Canada Current Account Differential -2 10 A differential of – $15.14 The UK has a higher deficit than Canada
The interest rate differential between the UK and Canada -1 10 -0.15% Expected to remain at -0.15% until either economy have recovered
The differential in GDP growth rate between the UK and Canada -1 10 3.30% The Canadian economy contracted at a slower pace than the UK economy
TOTAL SCORE -4


The cumulative score for the exogenous factors is -4. This means that we can expect the GBP/CAD pair to trade in a downtrend in the short term. However, technical analysis shows the pair adopting a bullish trend with the weekly chart trading above the 200-period MA. More so, the pair is seen bouncing off the lower Bollinger band.

Keep an eye on the near-term changes in the exogenous factors.


Categories
Forex Daily Topic Forex Fundamental Analysis

GBP/AUD Global Macro Analysis – Part 3

GBP/AUD Exogenous Analysis

  1. The UK and Australia Current Account Differential

In this case, the current account differential is derived by subtracting Australia’s current account balance from that of the UK. The current account shows the net value of a country’s exports. Remember that the value of a currency is determined by its demand. Theoretically, the country’s domestic currency with a higher current account balance will have a higher demand. Therefore, its value will be higher in the forex market than in currencies with lower current account balances.

In this case, if the current account differential is positive, it means that the GBP is in higher demand than the AUD, hence a bullish trend for the GBP/AUD pair. Conversely, if the differential is negative, the GBP/AUD pair will have a bearish trend.

Australia had a $7.5 billion current account surplus in Q3 2020, while the UK had a $20.97 billion deficit. The current account differential is -$28.47 billion. Consequently, the current account differential between the UK and Australia has a score of -4.

  1. The interest rate differential between the UK and Australia

This interest rate differential is the difference between the interest rate in the UK and Australia. Typically, investors prefer to buy currencies with a higher interest rate. Therefore, if the interest rate differential for the GBP/AUD pair is positive, it means that the UK offers higher interest rates than Australia. Traders would then sell AUD and buy the GBP, which implies that the GBP/AUD pair will have a bullish trend. Conversely, if the interest rate differential is negative, Australia offers a higher interest rate. Thus, traders would sell the GBP and buy the AUD, which will force the GBP/AUD pair into a downtrend.

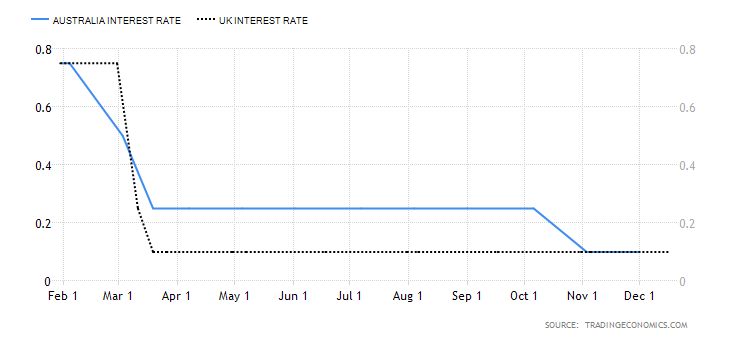
In 2020, the Reserve Bank of Australia cut interest rates from 0.75% to 0.25% and finally to 0.1% in December. The BOE cut interest rates from 0.75% to 0.1%. As of December 2020, the interest rate differential for the GBP/AUD pair is 0%. Thus, we assign a score of -1.

  1. The differential in GDP growth rate between the UK and Australia

The differential in GDP growth rate measures the difference in domestic economic growth in the UK and Australia. It is expected that the domestic currency of the country whose GDP is expanding at a faster pace will appreciate faster. Therefore, if the GDP growth differential between the UK and Australia is positive, we should expect a bullish trend for the GBP/AUD pair. Conversely, we should expect a downtrend in the pair if the differential is negative.

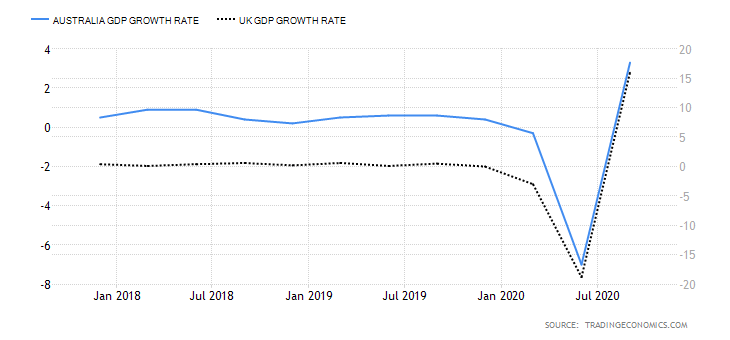
The Australian economy has contracted by 4% in the first three quarters of 2020, while the UK has contracted by 5.8%. Thus, the GDP growth rate differential is -1.8%. Hence, the score of -3.

Conclusion

Indicator Score Total State Comment
The UK and Australia Current Account Differential -4 10 A differential of – $28.47 Australia has a current account surplus while the UK is running a deficit. The differential is expected to increase as COVID-19 restrictions ease
The interest rate differential between the UK and Australia -1 10 0.00% Neither the RBA nor the BOE intends to change the interest rate policy in the near term. The differential of 0% is expected to persist in the near term
The differential in GDP growth rate between the UK and Australia -3 10 -1.80% The Australian economy contracted slower than the UK’s
TOTAL SCORE -8

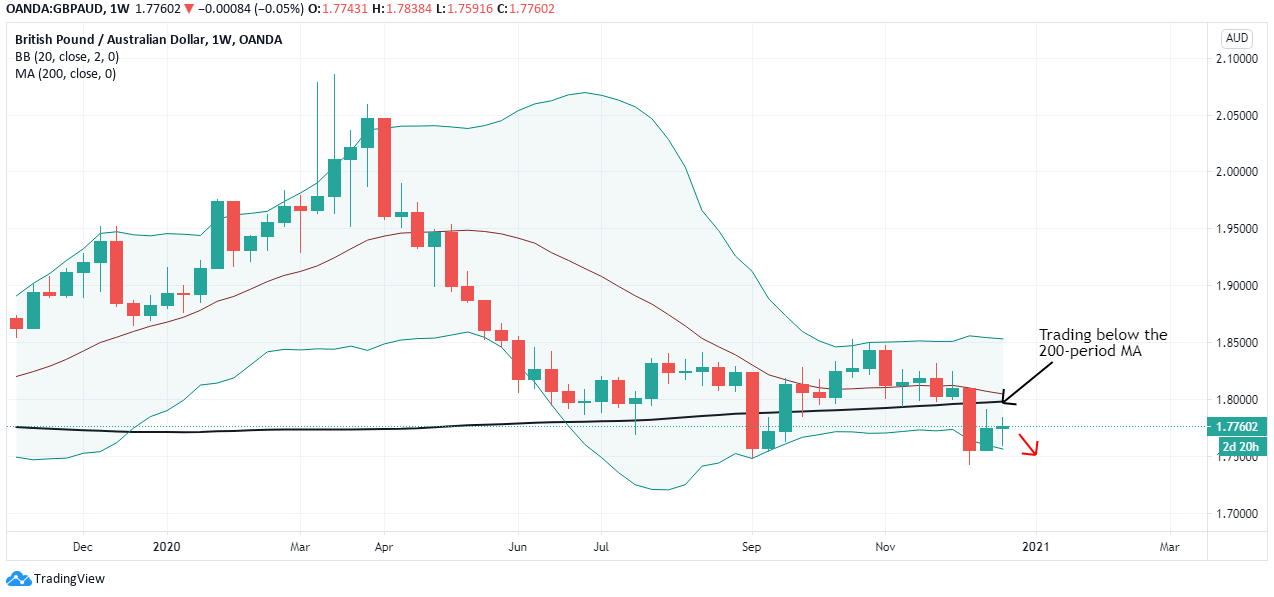
Since the cumulative exogenous score for the GBP/AUD pair is -8, we can expect the pair to continue a bearish trend.

According to the above picture’s technical analysis, this pair is trading below the 200-period MA and attempting to breach the lower Bollinger band, supporting our fundamental analysis. Cheers.

Categories
Forex Daily Topic Forex Fundamental Analysis

GBP/AUD Global Macro Analysis – Part 1 & 2

Introduction

This analysis will look into endogenous factors that influence economic growth both in the UK and Australia. We will also analyze the exogenous factors that impact the exchange rate of the GBP/AUD pair.

Ranking Scale

We will conduct correlation analysis, which we will use to rank the endogenous and exogenous factors on a scale of -10 to 10.

In ranking the endogenous factors, we will conduct a correlation analysis against the GDP growth rate. If the score is negative, the endogenous factor has resulted in depreciation of either the GBP of the AUD. Conversely, if the score is positive, then the factor has resulted in an appreciation of the local currency.

When the exogenous analysis is negative, the factor has resulted in a decline of the GBP/AUD exchange rate. If the score is positive, then the factor has led to an increase in the exchange rate.

Summary – GBP Endogenous Analysis

-15 score indicates that the Pound has depreciated since the starting of 2020.

Summary – AUD Endogenous Analysis

A score of -8 indicates that the Australian dollar has depreciated as well since the beginning of 2020.

Indicator Score Total State Comment
Australia Employment Rate -3 10 61.2% in October The employment rate hit 20-year lows during the pandemic. It’s expected to continue recovery as the economy recovers
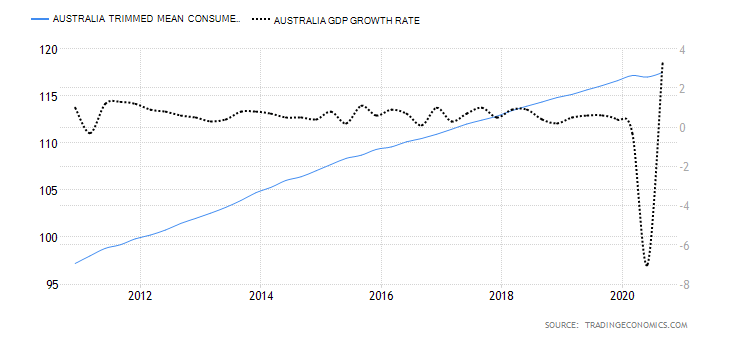
Australia Core Consumer Prices 2 10 117.49 in Q3 2020 The inflation rate still lower than Q1, but the demand is increasing in the economy
Australia Manufacturing Production -3 10 Q3 projected to drop by 3.5% Q2 dropped by 6.2%. Production expected to improve in Q3 as business operation resume some normalcy
Australia Business Confidence 6 10 NAB business confidence was 12 in November It’s the highest level since April 2018. This shows that businesses are highly optimistic about their future operations
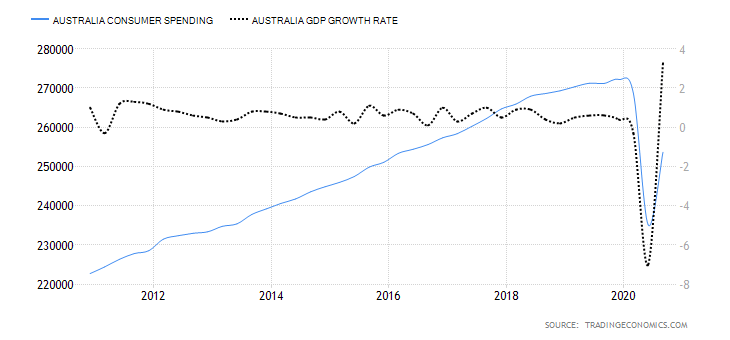
Australia Consumer Spending -3 10 Was 253.648 billion AUD in Q3 2020 Q3 levels still lower than Q1 domestic expenditure. Expected to increase further when the economy recovers to pre-pandemic levels
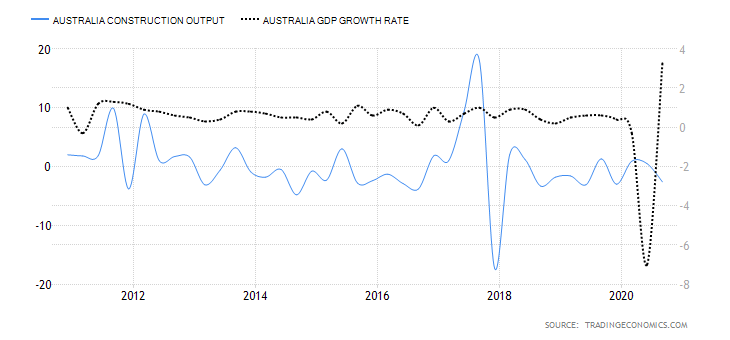
Australia Construction Output -3 10 Q3 output dropped by 2.6% Q3 drop caused by a reduction in residential and non-residential construction, engineering, and building works
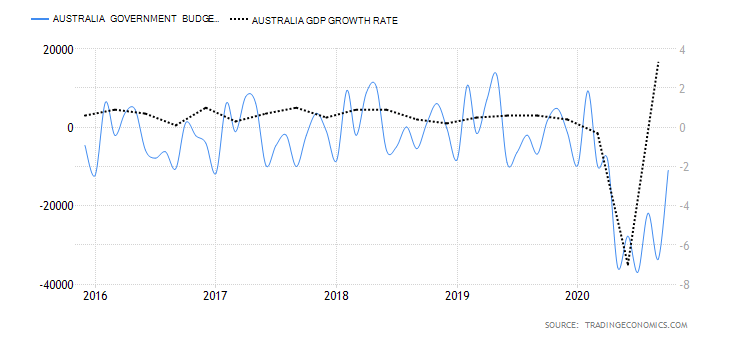
Australia Government Budget Value -4 10 a budget deficit of 10.974 billion AUD in October The government budget deficit is improving. This shows that the revenue stream is improving as businesses resume operations
TOTAL SCORE -8
  1. Australia Employment Rate

This indicator shows the number of working-age Australians who are employed during a particular period. As an indicator of growth in the labor market, the employment rate shows if the economy is adding or shedding jobs. Thus, it is used to show periods of economic growth and contractions.

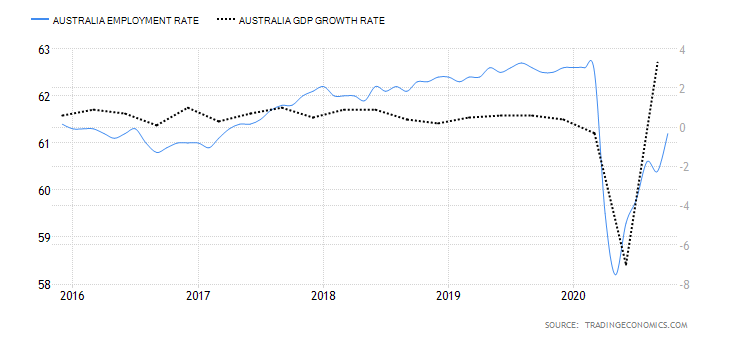
The Australian labor market has been recovering from the coronavirus pandemic shocks when the employment rate hit a 20-year low of 58.2%. In October 2020, Australia had an employment rate of 61.2%, up from 60.4% in September. However, it is still lower than January’s 62.6%. Australia’s employment rate has a score of -3.

  1. Australia Trimmed Mean Consumer Prices

This indicator is also called core consumer prices. It measures the price changes of goods and services that are frequently purchased by Australian households. The computation of the trimmed mean consumer prices excludes goods and services whose prices are volatile.

In Q3 2020, the core consumer prices in Australia rose to 117.49 from 117.04 in Q2. Q3 levels are also higher than the 117.17 points recorded in Q1. This shows that the economy is recovering since an increase in prices implies an increase in domestic demand for goods and services. We assign a score of 2.

  1. Australia Manufacturing Production

This indicator shows the YoY change in the value of output from the manufacturing sector. The Australian economy is heavily dependent on industrial production; hence, manufacturing production changes provides invaluable insights into the domestic economic growth. It also shows how the economy is recovering from the impact of COVID-19.

In Q2 2020, the YoY manufacturing production in Australia dropped by 6.2%, compared to 2.7% growth in Q1. Q3 YoY manufacturing production is expected to drop by 3.5%. Consequently, Australian manufacturing production has a score of -3.

  1. Australia Business Confidence

Business confidence in Australia is measured by conducting a monthly survey of about 600 businesses. They include small, medium, and large companies operating in non-agricultural sectors. The survey gauges the businesses’ expectations in terms of profitability, trading volume, and employees. The index is derived by considering the percentage of respondents who have good and very good expectations and those who have a bad and very bad outlook.

In November 2020, the NAB business confidence increased to 12 from 3 in October, which has been the highest since April 2018. Australia’s business confidence has a score of 6.

  1. Australia Consumer Spending

The indicator records the quarterly change in the value of goods and services consumed by domestic households. It includes expenditure by non-profit organizations that provide goods and services to Australian households and the value of backyard productions.

In Q3 of 2020, consumer spending in Australia rose to AUD 253.648 billion from AUD 235.131 billion in Q2. Although it’s lower than Q1 expenditure, domestic demand in the economy is rebounding from the slump of COVID-19. Consequently, Australian consumer spending has a score of -3.

  1. Australia Construction Output

This indicator shows the quarterly change in the value of construction work in Australia. The total value involves both private and public sector building and engineering work.

In the third quarter of 2020, Australia’s construction output dropped by 2.6% from a 0.5% growth in Q2. This drop was caused by output drop in residential and non-residential construction, engineering, and building works. Thus, we assign a score of -3.

  1. Australia Government Budget Value

The government budget value measures whether the Australian government has a budget surplus or deficit. A budget surplus implies that the government’s expenditure is less than its revenue. Similarly, a budget deficit means that the government spends more than it collects in terms of revenue.

In October 2020, Australia had a budget deficit of AUD 10.974 billion, up from a deficit of 33.613 billion in September. We assign a score of -4.

In the next article, you can find the Exogenous analysis of the GBP/AUD currency pair and also our forecast on its price movement in the near future. Cheers.

Categories
Forex Fundamental Analysis

GBP/NZD Global Macro Analysis – Part 3

GBP/NZD Exogenous Analysis

  1. The UK and New Zealand Current Account Differential

The current account differential between the UK and NZ is the value of the subtraction of the NZ current account balance and the UK’s current account. For the GBP/NZD pair, if the current account differential is positive, it means that the UK has a higher current account balance than NZ. Thus, the price of the GBP/NZD pair will increase. Conversely, if the differential is negative, NZ has a higher current account balance than the UK. Theoretically, this means that traders would be bullish on the NZD; hence, the GBP/NZD pair price would drop.

In Q3 2020, NZ had a current account deficit of $2.48 billion while the UK a deficit of $20.97 billion. This means that the current account differential is -$18.49 billion. Thus, we assign a score of -5.

  1. The interest rate differential between the UK and New Zealand

The interest rate differential for the GBP/NZD pair is the difference between the UK and NZ’s interest rate. Carry traders and investors would direct their money to the currency, which offers higher interest rates. Therefore, if the interest rate differential for the GBP/NZD pair is positive, it means that the UK offers a higher interest rate than NZ. Hence, traders will be bullish on the GBP/NZD pair. Conversely, if the interest rate differential is negative, it means that NZ has a higher interest rate than the UK. This means that traders would be bearish on the GBP/NZD pair.

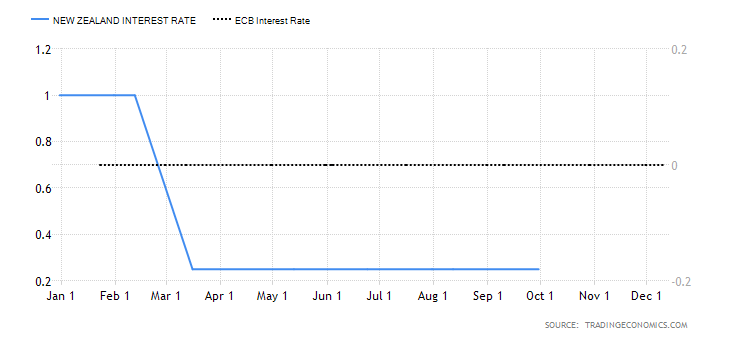
In 2020, the Reserve Bank of New Zealand cut its official cash rate from 1% to 0.1%, while the BOE cut the interest rate from 0.75% to 0.1%. In this case, the interest rate differential is 0%. Thus, we assign a score of 0.

  1. The differential in GDP growth rate between the UK and New Zealand

This differential shows which economy is expanding faster between the NZ economy and the UK economy. Comparing domestic economies using their GDP growth rates is more effective than using absolute GDP figures since they vary in size.

If the GDP growth rate differential is negative, the NZ economy is growing faster than the UK economy. This would result in a bearish trend for the GBP/NZD pair. Conversely, the pair will have a bullish trend if the differential is positive since it would mean that the UK economy is expanding more than the NZ economy.

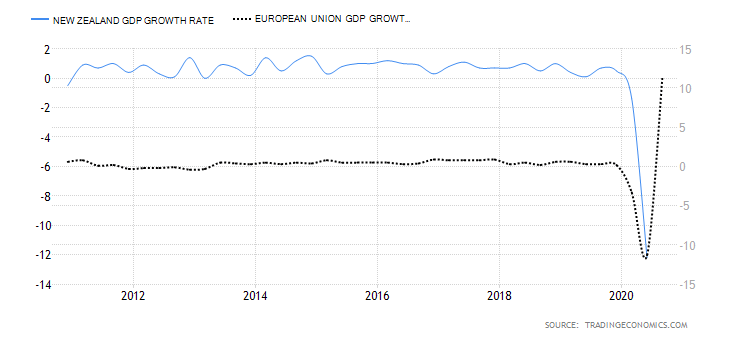
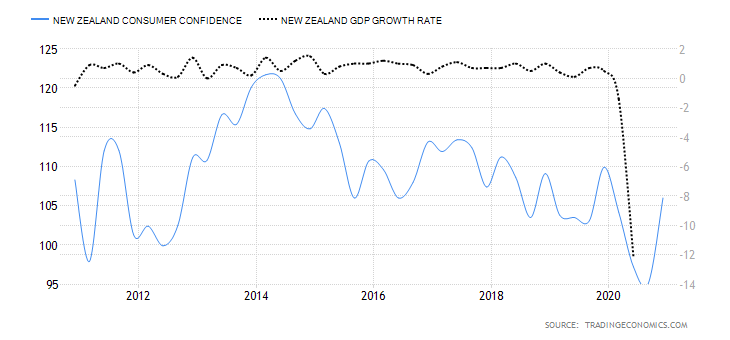
The first three quarters of 2020 saw the NZ economy expand by 0.4% and the UK contract by 5.8%. In this case, the GDP growth rate differential is -6.2%. Hence, the score of -4.

Conclusion

Indicator Score Total State Comment
The UK and New Zealand Current Account Differential -5 10 A differential of – $18.49 NZ has a lower current account deficit than the UK.
The interest rate differential between the UK and New Zealand 0 10 0.00% The 0% interest rate differential is expected to persist in the short-term. That’s because neither the RBNZ and the BOE have scheduled changes in the monetary policy
The differential in GDP growth rate between the UK and New Zealand -4 10 -6.20% New Zealand’s economy expanded by 0.4% in the first three quarters of 2020, while the UK contracted by 5.8%
TOTAL SCORE -9

GBP/NZD exogenous factors have a cumulative score of -9. It means we should expect a continued downtrend in the pair for the short term.

In the above image, we can see that this pair’s weekly chart trading below the 200-period MA for the first time since August 2019. Cheers.

Categories
Forex Fundamental Analysis

GBP/NZD Global Macro Analysis – Part 1 & 2

Introduction

In this analysis, we will analyze endogenous factors that influence both the UK and New Zealand economies. The analysis will also include exogenous factors that impact the exchange rate between the GBP and the NZD.

Ranking Scale

We’ll rank the endogenous and exogenous factors on a scale from -10 to +10.

The score of the endogenous factors will be determined from correlation analysis between the GDP growth rate. If the score is negative, the endogenous factor had a devaluing effect on the domestic currency. Conversely, if the score is positive, the factor led to the appreciation of the domestic currency.

Similarly, we’ll do a correlation analysis between the exogenous factors and the GBP/NZD exchange rate. If the correlation is negative, the factor results in a drop in the exchange rate. If positive, then the exogenous factor increases the exchange rate.

Summary – GBP Endogenous Analysis

-15 score on Pound’s Endogenous Analysis indicates that this currency has depreciated since the beginning of 2020.

Summary – NZD Endogenous Analysis

A positive 5 indicates that the New Zealand dollar has appreciated since the beginning of this year.

Indicator Score Total State Comment
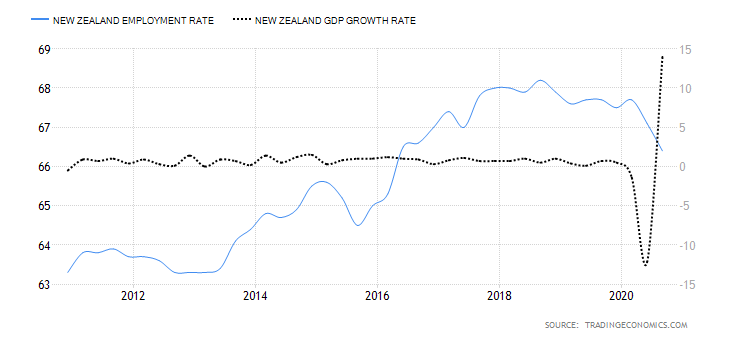
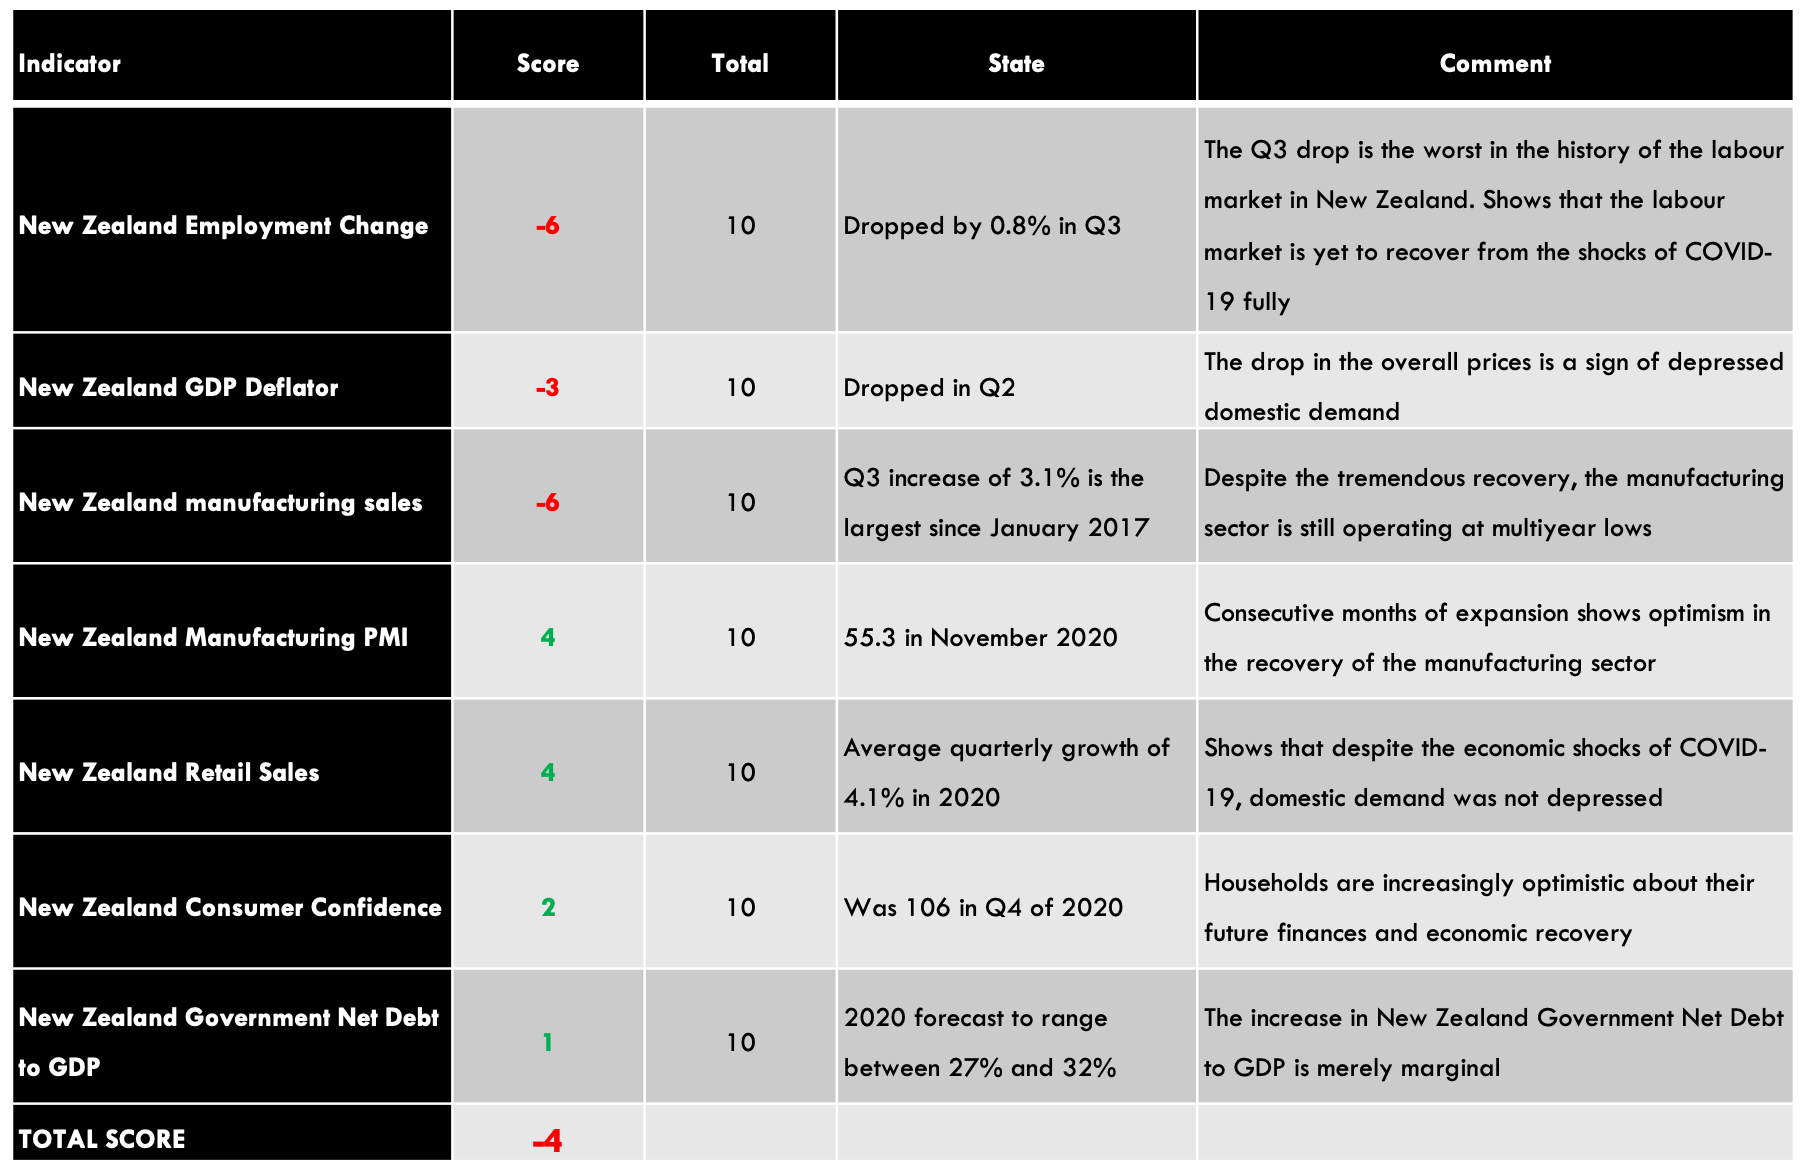
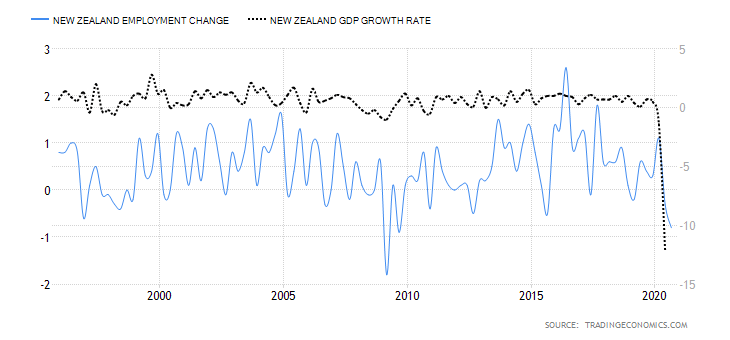
New Zealand Employment Rate -7 10 66.4% in Q3 2020 The NZ labor market is yet to recover from the economic disruptions of the pandemic
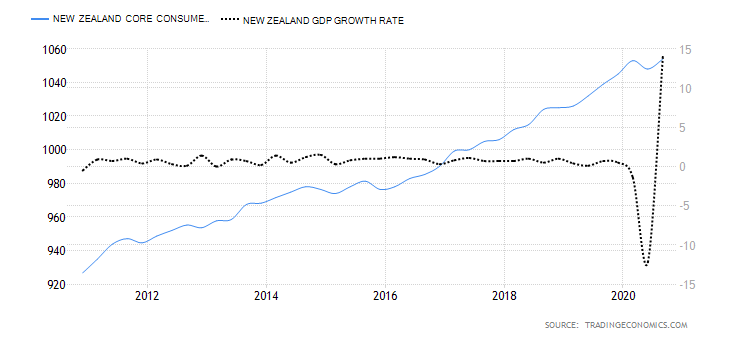
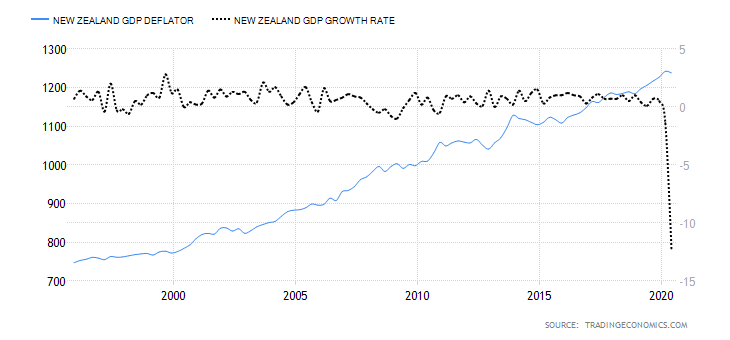
New Zealand Core Consumer Prices 1 10 1054 points in Q3 2020 From Q1 to Q3, inflation has increased by 1 point
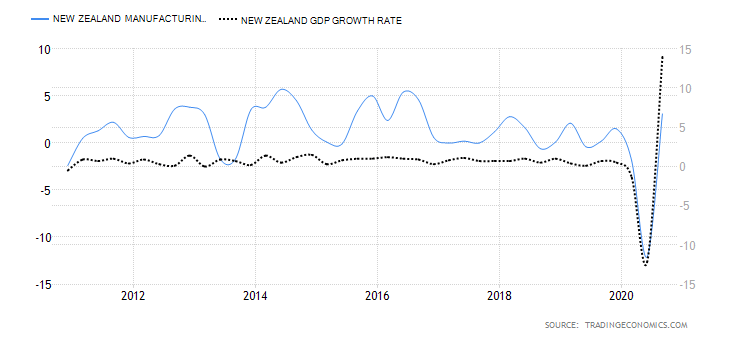
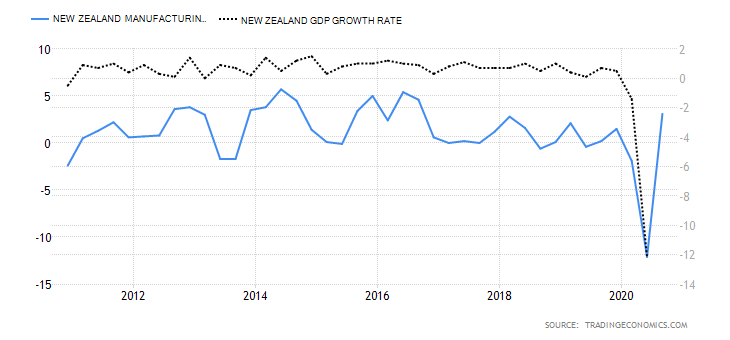
New Zealand Industrial Production 5 10 A 3.1% increase in Q3 The NZ industrial sector is rebounding from a 12.1% drop in Q2.
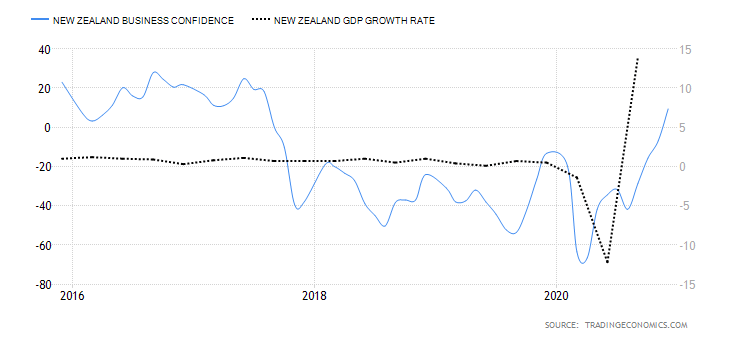
New Zealand Business Confidence 7 10 Was 9.4 in November November showed the first positive reading in ANZ business confidence since August 2018
New Zealand Consumer Spending 5 10 Q3 spending was 41.335 billion NZD. Q3 consumer spending was the highest recorded in 2020. This shows that the domestic demand has recovered beyond the pre-pandemic period
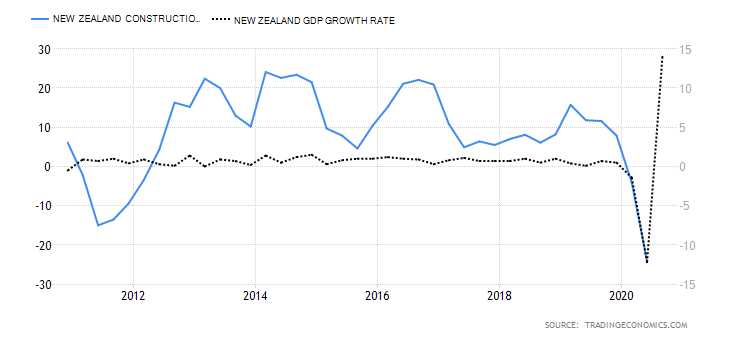
New Zealand Construction Output -4 10 Q2 output dropped by 24.2% The worst decline in construction output in about 18 years. It’s bound to increase as COVID-19 restrictions ease
New Zealand Government Budget Value -2 10 2020 projected deficit of 4.5 billion NZD This would be a drop from a surplus of 7.5 billion NZD in 2019. Attributed to the increase in government spending during the pandemic
TOTAL SCORE 5
  1. New Zealand Employment Rate

The employment rate shows the growth in New Zealand’s labor market. The change in the labor market shows how the economy is performing – especially in the coronavirus pandemic. The labor market shows if the economy is churning out new jobs or if jobs are lost. Thus, the growth of the labor market is a leading indicator of economic growth.

In Q3 2020, New Zealand’s employment rate dropped to 66.4% from 67.1% in Q2 and 67.7% in Q1. This shows that the labor market is yet to recover from the economic shocks of the pandemic. The New Zealand employment rate has a score of -7.

  1. New Zealand Core Consumer Prices

This indicator samples the price changes in a basket of the most commonly purchased goods and services by households. The price changes represent the rate of inflation in the overall economy. Note that the computation of the core consumer prices excludes goods and services whose prices tend to be volatile. It helps avoid seasonal distortions in the index.

In Q3 of 2020, the core consumer prices in New Zealand rose to 1054 points from 1048 in Q2. The index had only increased by 1 point in 2020. Thus, we assign a score of 1.

  1. New Zealand Industrial Production

Industrial production in New Zealand refers to the YoY change in total manufacturing sales. It measures the YoY change in sales volume in the manufacturing sector. A survey of 13 industries across the manufacturing sector is surveyed to derive the YoY manufacturing sales data for the whole sector. Some of these industries include; petroleum and coal products, metal products, machinery, equipment and furniture, and food and beverage. Naturally, expansion in industrial production corresponds to the expansion of the economy.

New Zealand manufacturing sales rose by 3.1% in Q3 2020 from a drop of 12.1%. This is the largest YoY increase in manufacturing sales in three years. It shows that the economy is rebounding. We assign a score of 5.

  1. New Zealand Business Confidence

NZ business confidence is a survey of about 700 businesses. They are polled to establish their expectations about the future business operating environment and economic growth in general. Some aspects surveyed include; activity outlook, employment prospects, capacity utilization, and investment decisions.

In December 2020, the NZ ANZ business confidence rose to 9.4 from -6.9 in November. This shows an increased optimism in NZ businesses since it is the first positive reading since August 2018. Thus, we assign a score of 7.

  1. New Zealand Consumer Spending

This measures the value of the quarterly consumer expenditure in NZ. Changes in consumer expenditure go hand in hand with domestic demand changes in the economy, which drive GDP growth.

In Q3 2020, the NZ consumer spending increased to NZD 41.335 billion from NZD 35.197 billion in Q2. More so, the Q3 consumer spending is more than the NZD 40.04 billion recorded in Q1. Consequently, the NZ consumer spending has a score of 5.

  1. New Zealand Construction Output

This indicator shows the overall change in the value of all construction work done by contractors in NZ. It compares the YoY quarterly change, which helps to show if the economy is expanding or contracting.

In Q2 2020, the NZ construction output dropped by 24.2% compared to the 4.1% drop in Q2. This is the worst drop in over 18 years. Thus, we assign a score of -4.

  1. New Zealand Government Budget Value

This is the difference between the revenues that the NZ government collects and the amount it spends. Deficits arise if the revenues are less than expenditures, while surplus occurs when the revenues exceed expenditure.

In 2019, the NZ government had a budget surplus of NZD 7.5 billion. In 2020, it was projected that the budget would hit a deficit of NZD 4.5 billion. This is due to increased government expenditure to alleviate the pandemic’s economic shocks while revenues have been depressed due to nationwide shutdowns. Thus, we assign a score of -2.

For the exogenous analysis of both of these currencies, you can check our very next article. In case of any queries, let us know in the comments below. Cheers.

Categories
Forex Fundamental Analysis

GBP/CHF Global Macro Analysis – Part 3

GBP/CHF Exogenous Analysis

  1. The UK and Switzerland Current Account Differential

A country’s current account shows the sum of its net exports, net secondary income, and net primary income. In this case, the current account differential is the difference between the UK’s current account balance and Switzerland.

In international trade, when a country has a current account surplus, it means the value of its exports is higher than imports. Thus, its domestic currency is in higher demand in the forex market. Therefore, if the current account differential is positive, it implies that the UK has a higher current account than Switzerland. We can then expect that the price of the GBP/CHF pair will increase. Conversely, a negative differential would mean that Switzerland has a higher current account than the UK. In this case, the price of the GBP/CHF pair is expected to drop.

Switzerland had a current account surplus of $10.11 billion in the third quarter of 2020, while the UK had a $20.97 billion deficit. The current account differential is -$31.08 billion. Hence a score of -7.

  1. The interest rate differential between the UK and Switzerland

Interest rate differential is the swiss interest rate subtracted from the interest rate in the UK. Forex carry traders use a pair’s interest rate differential to establish whether to buy or short the pair. For GBP/CHF, if the interest rate differential is positive, it means that the UK’s interest rate is higher than in Switzerland. This makes traders and investors go long on the pair; hence, a bullish trend.

Conversely, if the interest rate differential is negative, it means that Switzerland’s interest rate is higher than in the UK. Thus, forex traders will short the GBP/CHF pair; hence, a bearish trend.

The Swiss National Bank has maintained the interest rate at -0.75%, while the UK’s interest rate is 0.1%. Therefore, the GBP/CHF interest rate differential is 0.85%. It has a score of 3.

  1. The differential in GDP growth rate between the UK and Switzerland

GDP growth rate differential is the difference between the economic growth in the UK and Switzerland. A negative differential means that the UK’s economy is expanding faster than that of Switzerland. Consequently, the GBP/CHF pair will adopt a bullish trend. Conversely, if the GDP growth rate differential is negative, the swiss economy is growing faster than that of the UK. Hence, the GBP/CHF pair will adopt a bearish trend.

The UK economy has contracted by 5.8% in the first three quarters of 2020, while the swiss economy has contracted by 1.5%. That means the GDP growth rate differential is -4.3%. We assign a score of -3.

Conclusion

Indicator Score Total State Comment
The UK and Switzerland Current Account Differential -7 10 A differential of – $31.08 Switzerland has a $10.11 billion current account surplus, while the UK has a deficit of $20.97 billion
The interest rate differential between the UK and Switzerland 3 10 0.85% The differential is expected to remain at 0.85% all through 2021
The differential in GDP growth rate between the UK and Switzerland -3 10 -4.30% Switzerland’s economy contracted by 1.5% in the first three quarters of 2020 while the UK by 5.8%
TOTAL SCORE -7

The exogenous analysis of the GBP/CHF pair has a cumulative score of -7. Thus, we can expect a short-term downtrend in the pair.

In technical analysis, GBP/CHF’s weekly price is seen bouncing off from the upper Bollinger band.

We hope you find this analysis informative. Let us know if you have any questions in the comments below. Cheers.

Categories
Forex Fundamental Analysis

GBP/CHF Global Macro Analysis – Part 1 & 2

Introduction

The global macro analysis of the GBP/CHF currency pair will involve analysing endogenous and exogenous factors. Endogenous factors drive the domestic GDP growth in the UK and Switzerland. Exogenous factors influence the exchange rate for the currency pair.

Ranking Scale

The analysis will rank the endogenous and exogenous factors on a scale from -10 to +10. The score for endogenous factors will be determined from a correlation analysis with the domestic GDP growth rate. If the score is negative, it means that the endogenous factor has led to the domestic currency depreciation. If positive, it has caused the appreciation of the domestic currency.

The exogenous analysis score is from a correlation analysis with the exchange rate for the GBP/CHF pair. When the score is negative, traders can expect the bearish trend for the pair. If positive, then the pair is expected to have a bullish trend.

Summary – GBP Endogenous Analysis

A -15 score implies that GBP has depreciated since the beginning of 2020.

Summary – CHF Endogenous Analysis

A score of 3 implies that CHF has partially appreciated since the beginning of this year.

Indicator Score Total State Comment
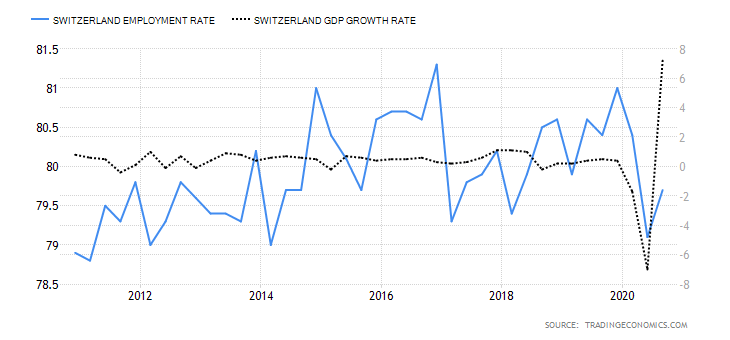
Switzerland Employment Rate -3 10 79.7% in Q3 2020 Slightly below the 80.4% recorded in Q1.
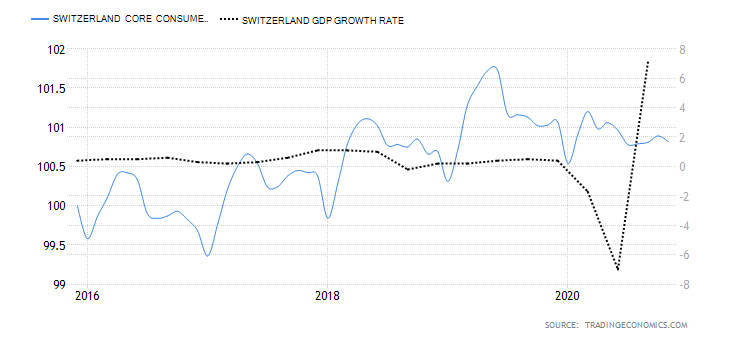
Switzerland Core Consumer Prices 4 10 100.82 points in November Inflation, as measured by the core consumer prices, rose by 0.28 points from January to November
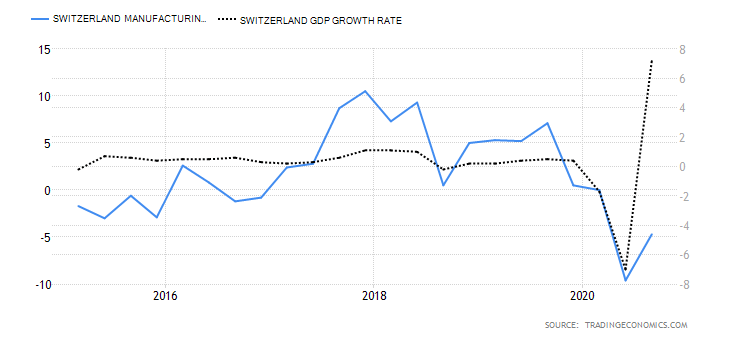
Switzerland Manufacturing Production -2 10 4.7% decrease in Q3 2020 The YoY swiss manufacturing production is recovering
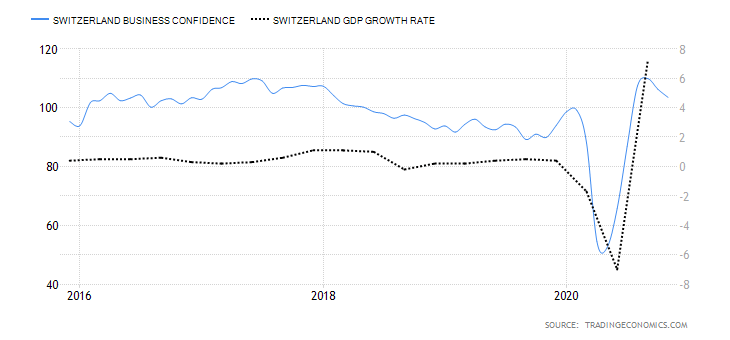
Switzerland Business Confidence 3 10 103.5 in November Swiss KOF Economic Barometer dropped in October and November. The majority of the consecutive drop was driven by private consumption
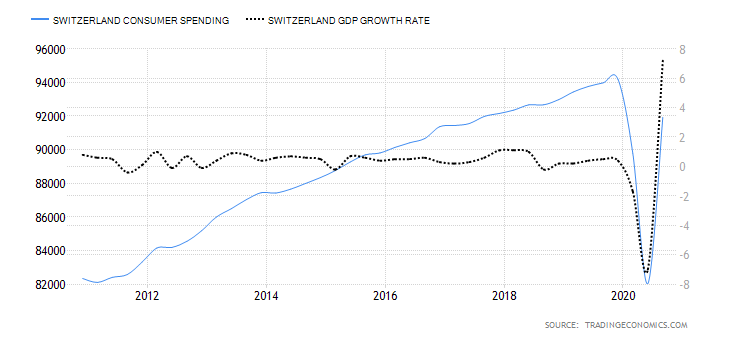
Switzerland Consumer Spending 5 10 Q3 spending was 91.929 billion CHF Q3 had the highest consumer spending compared to Q1 and Q2.
Switzerland Construction Output -2 10 A 0.4% drop in Q3 2020 Q3 output recovered from the 5% drop in Q2 but is still lower than the 3.1% growth in Q1
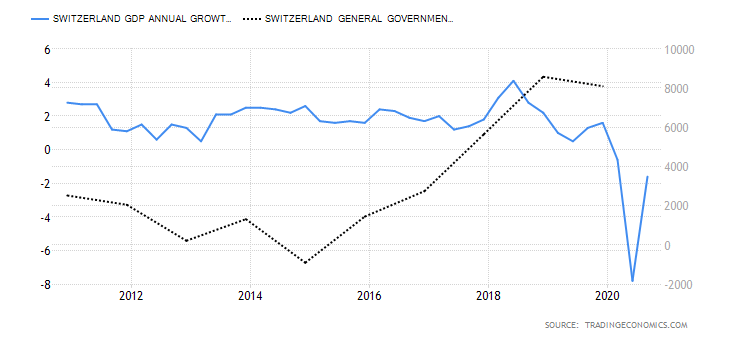
Switzerland Government Budget Value -2 10 An expected deficit of 2.2 billion CHF in 2020 Switzerland had a surplus of 8.1 billion CHF in 2019. The projected deficit is on account of aggressive government stimulus program and decreases in revenue due to COVID-19
TOTAL SCORE 3
  1. Switzerland Employment Rate

The Swiss employment rate measures the quarterly change in the percentage of the labour force that is employed. Changes in the number of people employed in the economy are a leading indicator of economic growth. When the economy is expanding, businesses create more job opportunities; hence, higher employment rate. Conversely, a shrinking economy leads to job cuts, which result in a lower employment rate.

In 2020 Q3, the Switzerland employment rate rose to 79.7% from the 6-year lows of 79.1%. Although the Q3 employment rate is lower than the 80.4% recorded in Q1, it shows that the Swiss economy is recovering from the economic shocks of COBID-19. The swiss employment rate scores -3.

  1. Switzerland Core Consumer Prices

Core consumer prices measure the rate of inflation by monitoring the price changes of only a select basket of goods and services. Consumer products with volatile prices are excluded. The rate of inflation is a leading indicator of economic growth. That’s because when inflation rises, it means domestic demand is on the rise, too, hence a higher GDP growth rate. Similarly, a decrease in the inflation rate means domestic demand is depressed, which may be followed by a contracting economy.

In November 2020, the swiss core consumer prices dropped to 100.82 points from 100.89 points in October. However, it is still higher than 100.54 points recorded in January. It has a score of 4.

  1. Switzerland Manufacturing Production

This measures the YoY change in the value of output from the swiss manufacturing sector. This sector plays a significant role in the Swiss economy. Therefore, growth in manufacturing production is accompanied by growth in the labour market and, consequently, the domestic economy’s expansion.

In Q3 of 2020, the YoY swiss manufacturing production dropped by 4.7%. That’s an improvement from the 9.6% drop in Q2. We assign a score of -2.

  1. Switzerland Business Confidence

The KOF Swiss Economic Institute compiles this index. It measures company managers’ optimism based on their perspective of the economy and the growth prospects of their businesses. The business that is surveyed are drawn from multiple sectors in the economy and contains 219 different variables.

In November 2020, the Swiss KOF Economic Barometer dropped to 103.5 from 106.3 in October. This marks the send consecutive month of a drop in the swiss business confidence. Notably, the drop in the index is primarily driven by the manufacturing sector and private consumption. Swiss business confidence has a score of 3.

  1. Switzerland Consumer Spending

This is the value of the total consumption by Swiss households. Domestic consumption is a primary driver of GDP growth. More so, it also an indicator of the performance in the labour market. With a higher rate of employment, disposable income increases, which increases consumer spending.

Swiss consumer spending increased to CHF 91.929 billion in the third quarter of 2020, which is the highest recorded compared to CHF 89.79 billion in Q1 and CHF 82.03 billion in Q2. It has a score of 5.

  1. Switzerland Construction Output

This indicator measures the percentage change in the value paid for construction work in Switzerland. The construction work includes building and engineering works done by public and private companies. Typically, when construction work increases, it is expected to be accompanied by an increase in the employment rate and economic growth.

In the third quarter of 2020, the YoY swiss construction output dropped by 0.4%. That is an improvement compared to the 5% drop in Q2 but still less than the 3.1% growth recorded in Q1. It has a score of -2.

  1. Switzerland General Government Budget Value

This represents the difference between the revenues received by the Swiss government and its expenditures. Government expenditure includes all transfer payments and purchases of goods and services. The general government budget value shows if the Swiss government has a surplus or a deficit. Too much deficit means that the economy is probably not responding to expansionary fiscal policies.

In 2019, the Swiss government had a budget surplus of CHF 8.097 billion. In 2020, the general government budget was expected to hit a deficit of CHF 2.2 billion. This deficit is primarily driven by a significant drop in revenue collection due to COVID-19. It has a score of -2.

In the very next article, you can find the Exogenous analysis of the GBP/CHF currency pair, so make sure to check that out. Cheers.

Categories
Forex Fundamental Analysis

GBP/JPY Global Macro Analysis – Part 3

GBP/JPY Exogenous Analysis

  • The United Kingdom and Japan Current Account Differential

The current account data is the most comprehensive measure of a country’s participation in international trade. It is the sum of net exports, net factor income, and net transfer payments. Remember that in the forex market, the value of a country’s fluctuates depending on its demand. Therefore, when a country has a current surplus account, it means that the demand for its currency is higher, and vice versa.

In this case, the current account differential is the difference between the UK and Japan’s current account balance. If the current account differential is positive, it means that the GBP will appreciate more than JPY hence a bullish GBP/JPY. Conversely, if the current account differential is negative, JPY will appreciate faster than the GBP hence a bearish trend for GBP/JPY.

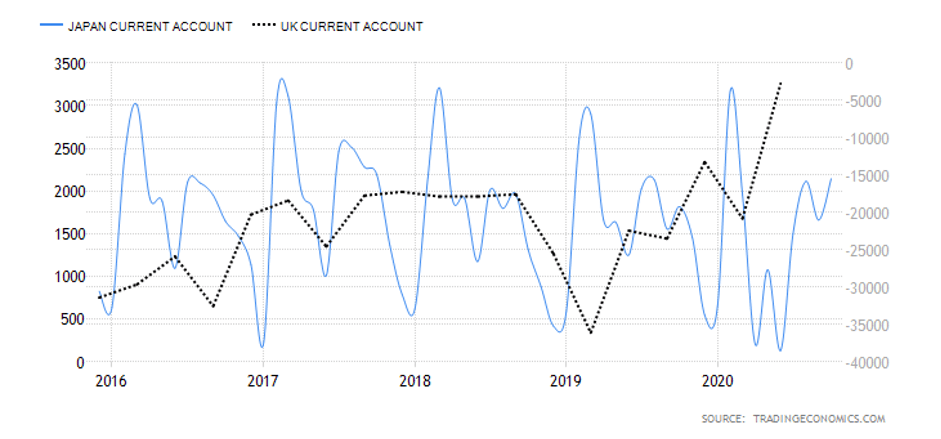
In Q3 2020, Japan had a current account surplus of $15.4 billion while the UK had a $20.97 billion deficit. Thus, the current account differential between GBP and JPY is – $36.37 billion. Thus, the UK and Japan current account differential have a score of -3.

In the forex market, the interest rate is one of the most closely monitored economic indicators. Suffice to say, traders and investors monitor every other domestic economic indicator to predict the interest rate policy changes. The interest rate differential for the GBP/JPY pair is the difference between the UK’s interest rate and that in Japan.

If the differential is positive, traders and investors can receive better returns by selling the JPY and buying the GBP, hence, bullish GBP/JPY. Conversely, if the interest rate differential is negative, currency traders would prefer to sell the GBP and buy JPY hence, the bearish GBP/JPY pair.

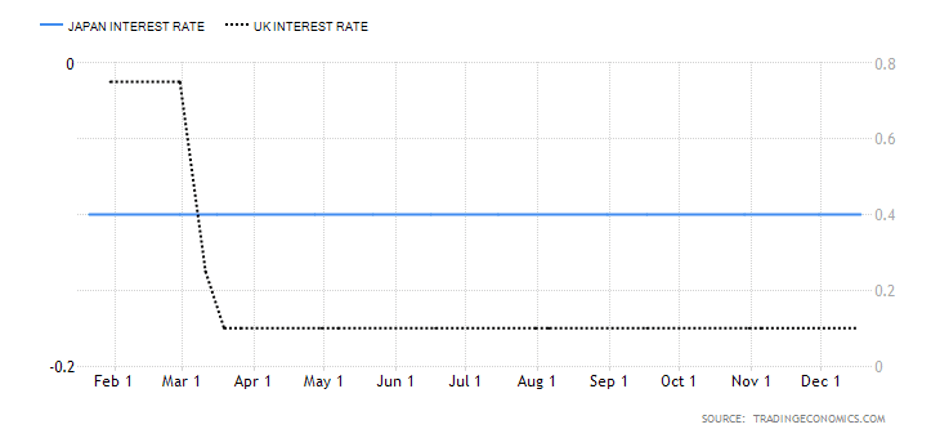
In 2020, the BOE cut interest rates from 0.75% to 0.1%, while the BOJ has maintained an interest rate of -0.1%. Therefore, the GBP/JPY interest rate differential is 0.2%. It has a score of 4.

  • The differential in GDP growth rate between the UK and Japan

The GDP growth rate differential measures the difference between the UK and Japan’s average annual growth rate. This is an effective way of comparing two economies since all economies vary in size and composition.

When the GDP growth rate differential is positive, it means that the UK economy has expanded more than Japan. Hence, the GBP/JPY will be bullish. Conversely, if the differential is negative, Japan’s economy has expanded faster than the UK’s. Hence, the GBP/JPY pair will be bearish.

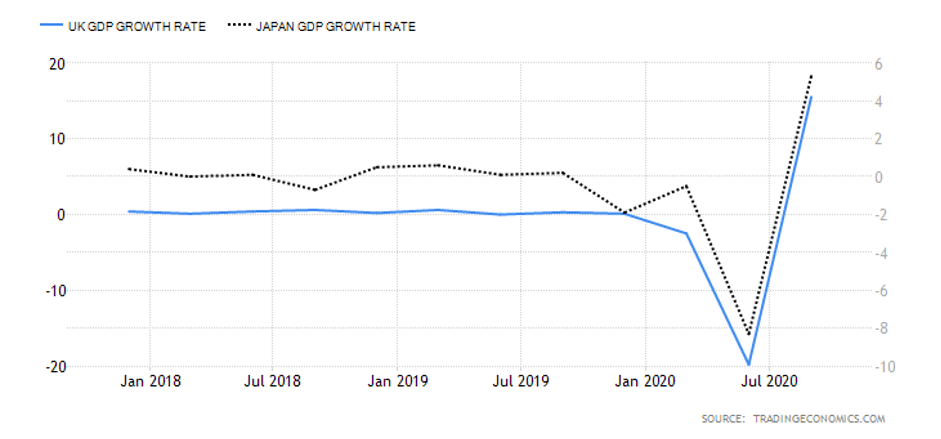
In the first three quarters of 2020, the UK economy has contracted by 5.8% while Japan contracted by 3.5%. The GDP growth rate differential is -2.3%. Thus, we assign a score of -3.

Conclusion

Indicator Score Total State Comment
The UK and Japan Current Account Differential -3 10 A differential of – $36.37 The UK has a current account deficit of $20.97 billion, while Japan has a surplus of $15.4 billion. This is expected to continue to widen as both economies recover from the pandemic
The interest rate differential between the UK and Japan 4 10 0.20% Both the BOJ and the BOE have no plans to change their monetary policies in the foreseeable future. This means the differential will remain at 0.2% in the short-term
The differential in GDP growth rate between the UK and Japan -3 10 -2.30% The UK economy contracted more than the Japanese economy. As economic recovery progresses, this differential could change
TOTAL SCORE -2

The cumulative score for the exogenous factors is -2. That means that the GBP/JPY pair is set on a bearish trend in the short-term.

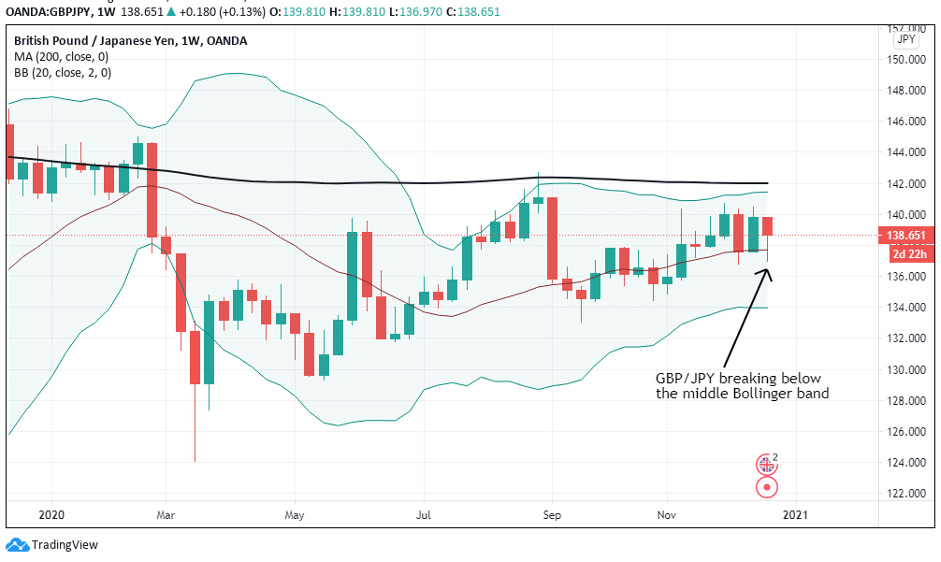
Technical analysis of the pair shows the weekly chart attempting to break below the middle Bollinger band.

Categories
Forex Fundamental Analysis

GBP/JPY Global Macro Analysis – Part 2

JPY Endogenous Analysis

Summary

An overall score of -13 implies that this currency (JPY) has depreciated since the beginning of this year.

Indicator Score Total State Comment
Japan Employment Rate -4 10 60.4% in October 2020 The Japanese labor market has shed about 820,000 jobs between January and October 2020
Japan Core Consumer Prices -1 10 101.2 points in November 2020 The index has dropped marginally by 0.8 points in the first 11 months
Japan Manufacturing Production 2 10 3.1% drop in October The decrease in YoY manufacturing production is slowing down
Japan  Business Confidence -2 10 Q4 reading was -10 Businesses are growing increasingly optimistic
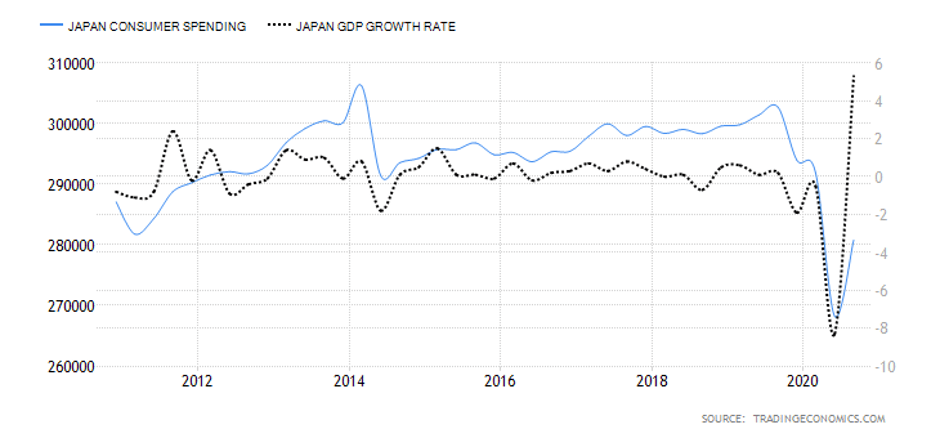
Japan Consumer Spending -2 10 Was ¥280.8 trillion in Q3 2020 The increase in Q3 expenditure by households shows that the economy is steadily recovering
Japan Construction Industry Activity -2 10 YoY drop of 6.9% in July 2020 The July drop was the second-worst recorded in over ten years
Japan Government Budget Value -4 10 the budget deficit of ¥308414 in Q2 2020 This is the worst deficit in 20 years. It’s expected to improve as the economy goes back to normal
TOTAL SCORE -13
  • Japan Employment Rate

This indicator shows the number of Japanese nationals employed as a percentage of the entire Japanese working-age population. With this indicator, we can track the Japanese economy’s performance since employment corresponds to the expansion and contraction of the economy.

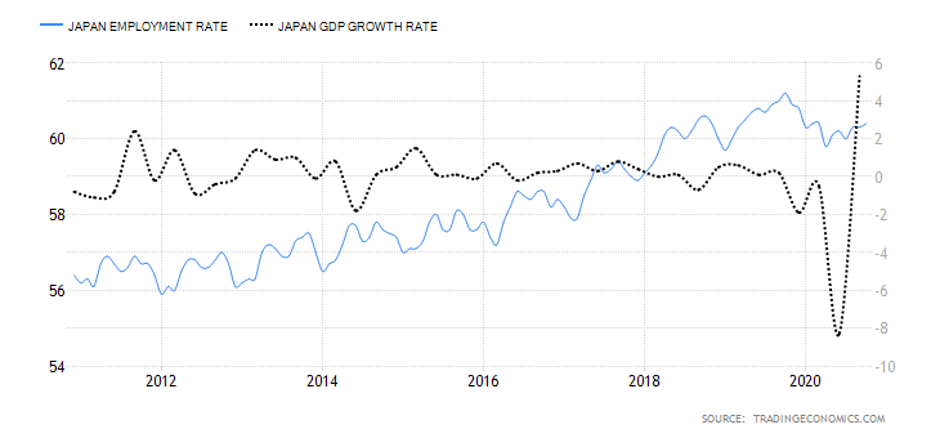
In October 2020, the Japan employment rate rose to 60.4% from 60.3% in September. Although Japan’s employment rate is higher than in January, the labor market has lost about 820,000 jobs since January. We assign a score of -4.

  • Japan Core Consumer Prices

Core consumer prices measure the inflation rate in Japan based on a select basket of goods. The core consumer prices do not include goods and services with volatile prices. Typically, when inflation rises, it implies that the economy is expanding and the labor market is growing. Conversely, when the index drops, it means that the labor market is shrinking.

In November 2020, Japan Core Consumer Prices dropped to 101.2 points from 101.3 in October. Since January, the index has shed 0.8 points. Thus, it scores a -1.

  • Japan Manufacturing Production

This indicator measures the percentage change in the value of the output in the manufacturing sector. Since the Japanese economy is highly reliant on the manufacturing sector, changes in this indicator can be considered a leading indicator of economic growth.

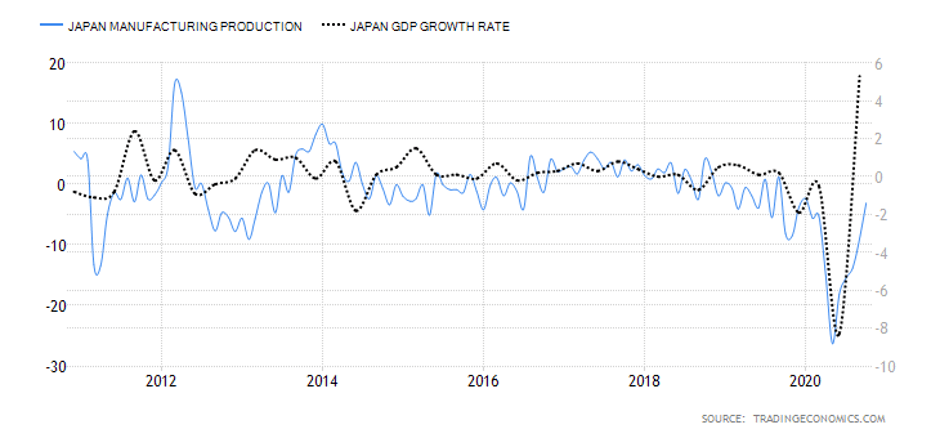
In October 2020, the YoY manufacturing production in Japan decreased by 3.1% compared to the 9% decrease recorded in September. The October decrease is the slowest since February.  We assign a score of 2.

  • Japan Business Confidence

In Japan, the business confidence index results from a survey of about 1100 large manufacturers with a capital of at least ¥1 billion. The survey evaluates the current industry trends, business conditions within the company and the industry, and expectations for the next quarter and year. The sentiment in Japanese businesses is ranked with an index of a scale from -100 to +100. The negative index shows pessimism, while a positive index shows optimism.

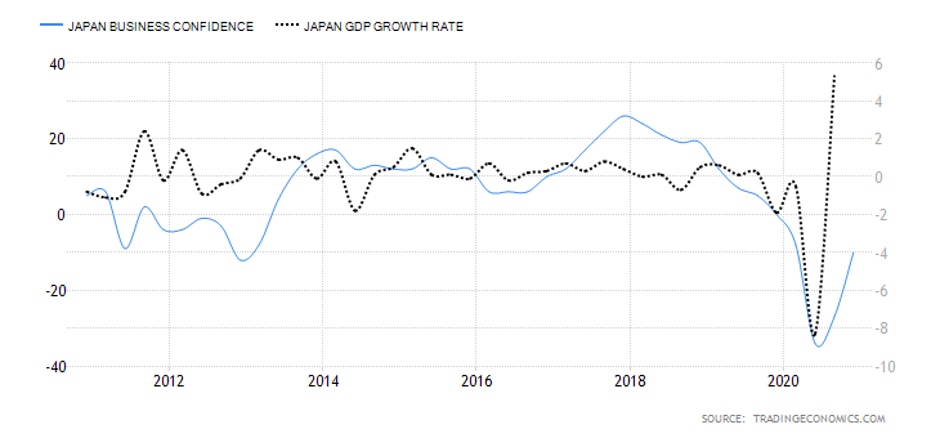
In Q4 of 2020, the Bank of Japan’s Tankan business sentiment index increased to -10 from -27 in Q3. This improvement shows that the economy is potentially recovering from the impact of the COVID-19 pandemic. However, it is still lower than the -8 registered in Q1. Thus, we assign a score of -2.

  • Japan Consumer Spending

It tracks the quarterly value of expenditure by households. In Japan, the consumption expenditure accounts for both the supply-side and demand-side. The supply-side from the survey of family income, while the demand-side is from the expenditure survey. The weighted average of both these estimates represents the final consumption expenditure.

In Q3 2020, the consumer spending in Japan rose to ¥280.8 trillion from ¥268.2 trillion in Q2. However, it is still lower than the consumer spending recorded in Q1. Japan consumer spending scores -4.

  • Japan Construction Industry Activity

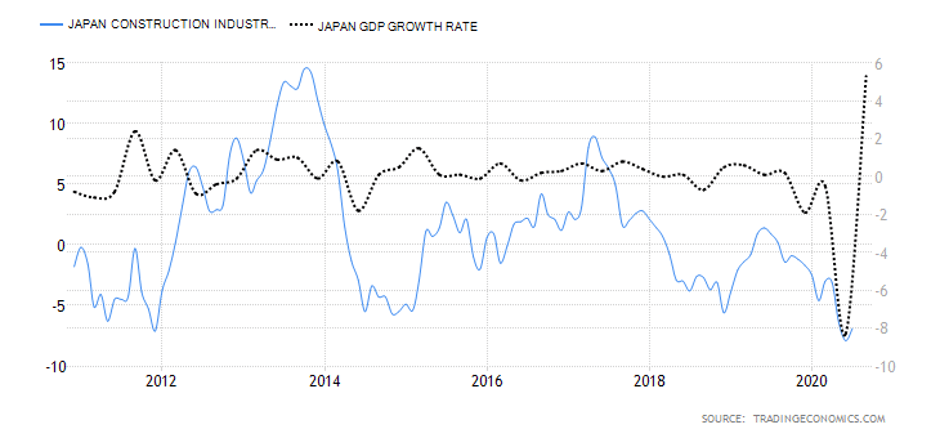
This index tracks the YoY changes in the construction industry in Japan. It shows the changes in companies’ monetary value of construction work and billed to the clients. Note that in Japan, the construction industry accounts for about 6% of the total industrial activity. Thus, the construction output index can be a leading indicator of the entire industrial activity. More so, since it is a tertiary industry, it can signal longer-term changes in the GDP.

In July 2020, Japan’s YoY construction output dropped by 6.9%. This drop is the second-worst in over ten years. The worst was recorded in June at -7.9%. The Japan construction industry activity scores -2.

  • Japan Government Budget Value

In Japan, the government budget value evaluates the difference between government revenues and expenditure. This is meant to determine whether there is a government budget surplus or deficit. A budget surplus arises when revenues exceed the expenditure, while a deficit occurs when government expenditure is more than revenues.

In Q2 of 2020, Japan has a government budget deficit of ¥308414. This is the worst deficit recorded in over two decades. Thus, the Japan Government Budget Value has a score of -4.

In the upcoming article, you can find the Exogenous analysis of the GBP/JPY currency pair where we have forecasted its price movements. All the best.

Categories
Forex Fundamental Analysis

EUR/JPY Global Macro Analysis – Part 3

EUR/JPY Exogenous Analysis

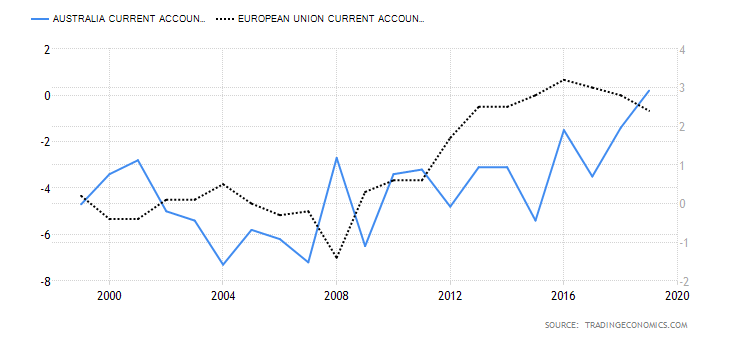
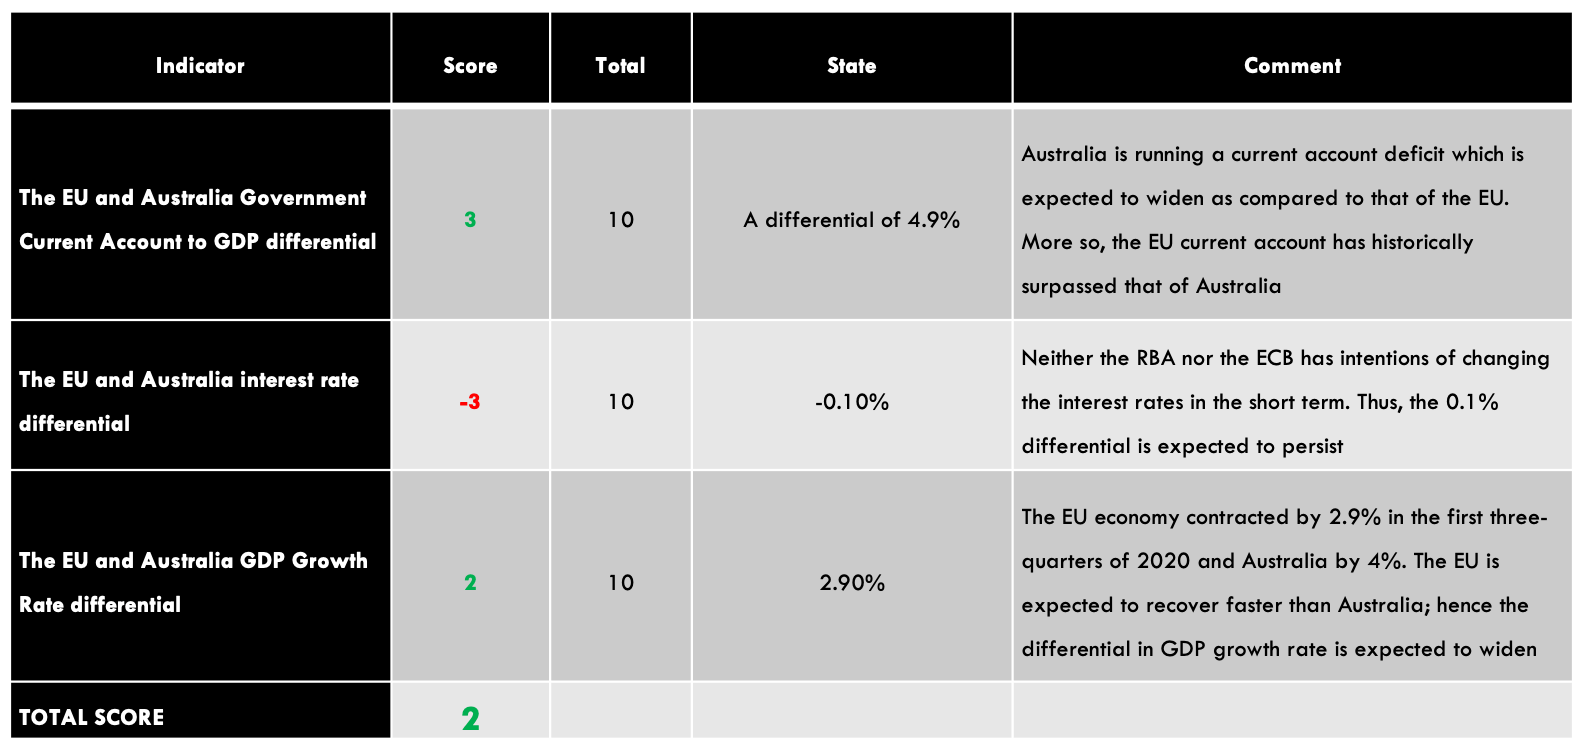
  • The EU and Japan Current Account to GDP differential

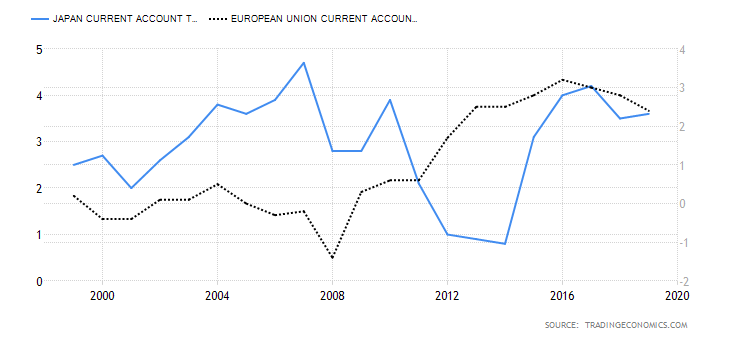
The current accounts have three basic components: net exports, the difference in incomes that countries pay each other, and transfer payments that countries make to each other. A country that has a surplus in international trade has a higher current account to GDP ratio. Since its domestic currency is in higher demand, it tends to appreciate. Conversely, a country with current account deficits will need to buy more foreign currencies to finance its imports – which weakens the domestic currency in the forex market.

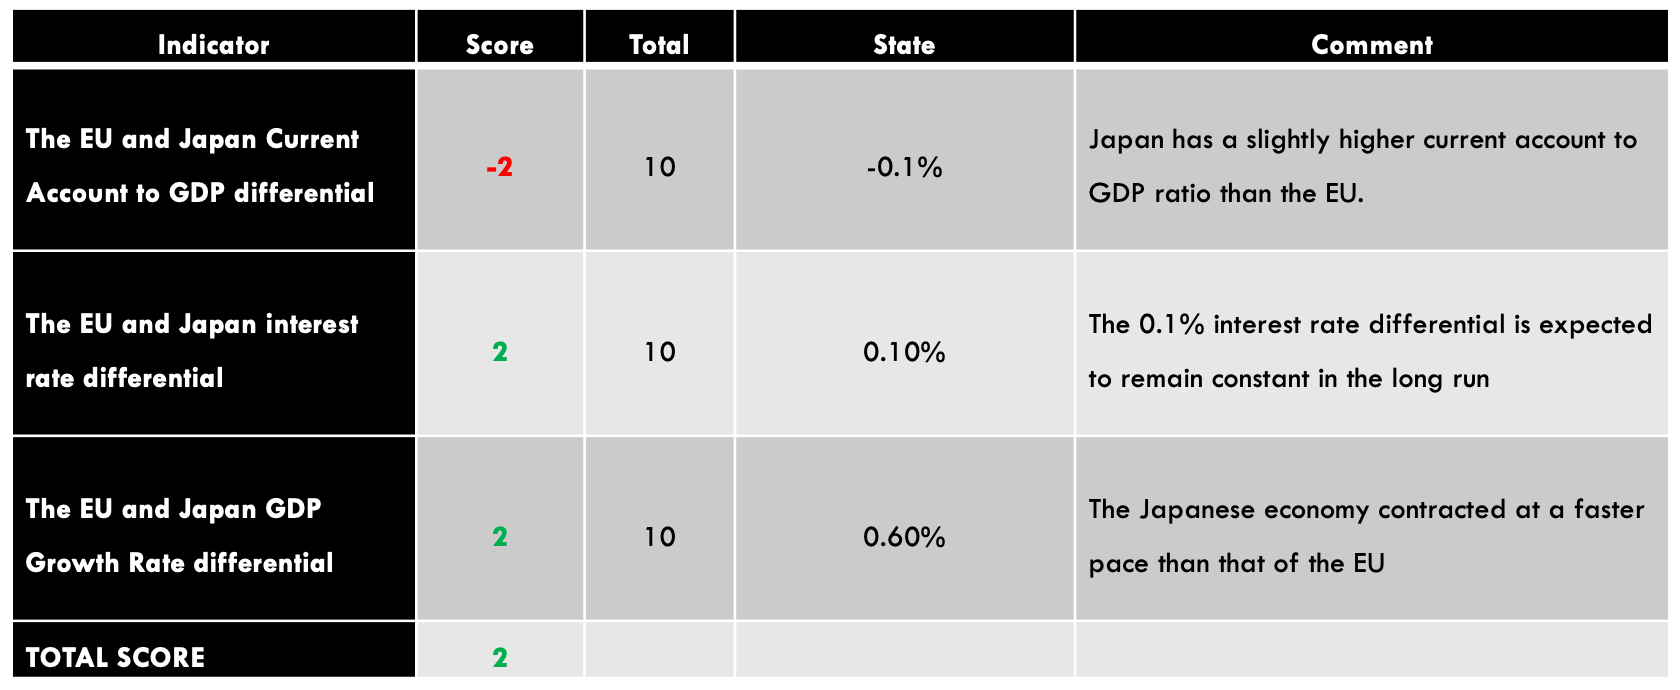
In 2020, the Japanese currency account to GDP ratio was expected to drop to 3.5% while that of the EU 3.4%. This means that the 2020 current account to GDP differential between the EU and Japan is -0.1%. In this case, we expect a bullish JPY; hence, we assign a score of -2.

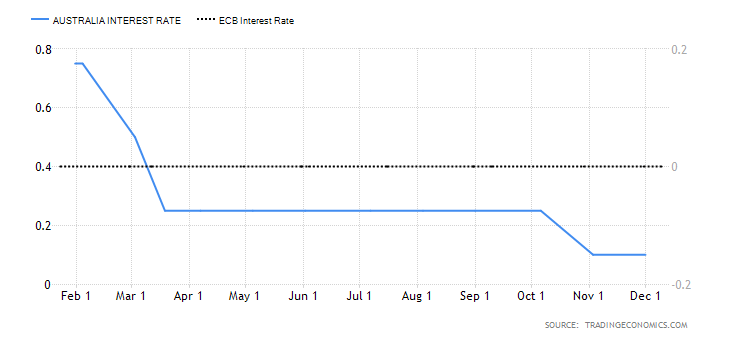
The interest rate differential between the EUR/JPY pair is used to determine whether traders are bullish or bearish. If the interest rate differential is positive, it means that traders can receive higher returns by selling the JPY and buying the EUR since the EUR offers higher returns. Thus, they are bullish on the pair. Conversely, if the interest rate differential is negative, it means that traders can receive higher returns by selling the EUR and buying the JPY, which means they will be bearish on the EUR/JPY pair.

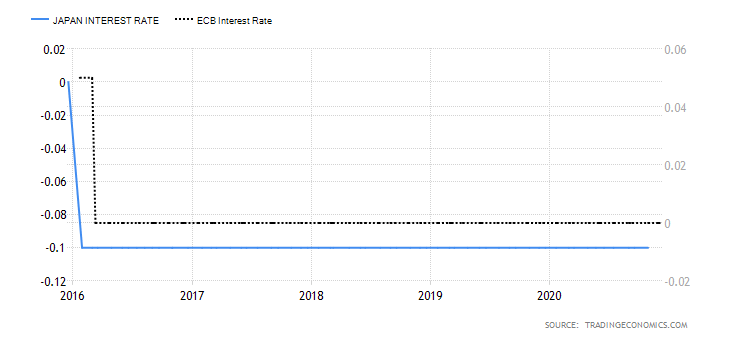
In 2020, the Bank of Japan maintained the interest rates at -0.1% while the ECB maintained at 0%. Therefore, the interest rate differential for the EUR/JPY pair is 0.1%. We assign a score of 2.

  • The EU and Japan GDP Growth Rate differential

The rate at which an economy is growing impacts the strength of the domestic currency in the forex market. Since it is impractical to compare countries’ economic performance using absolute GDP numbers, we will use their growth rate. In this case, if the GDP growth rate differential is positive, it means that the EU economy has been growing at a faster pace than that of Japan hence a bullish outlook for the EUR/JPY pair. Conversely, when negative, it implies a bearish outlook for the pair.

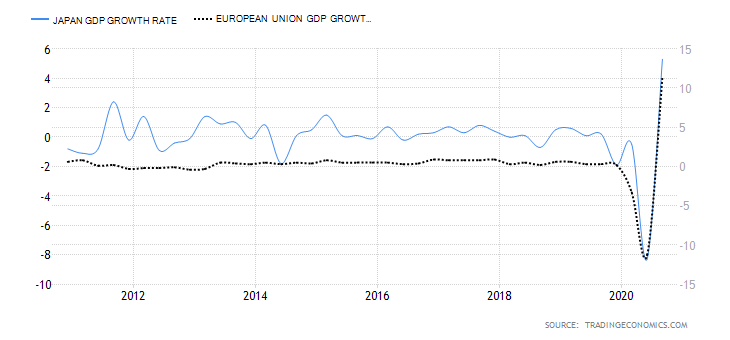
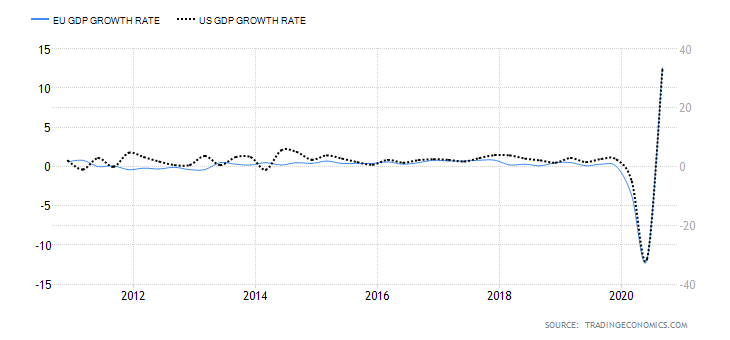
The Japanese economy contracted by 3.5% in the first three quarters of 2020, while the EU economy contracted by 2.9. Thus, the GDP growth rate differential is 0.6%. Thus, we assign a score of 2.

Conclusion

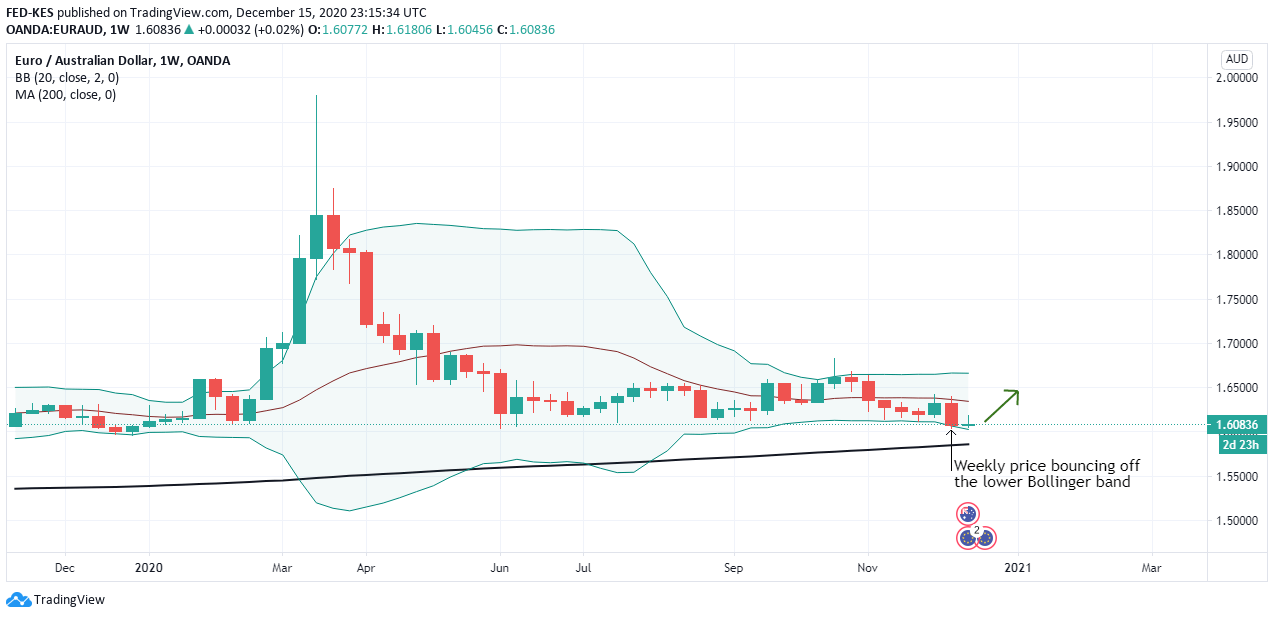
The exogenous factors have a cumulative score of 2. That means we can expect a short-lived bullish trend for the EUR/JPY pair. The weekly EUR/JPY chart shows that the pair has crossed the 200-period MA for the first time since August and attempting a breach of the upper Bollinger band.

We hope you find this article informative. In case of any questions, please let us know in the comments below. Cheers.

Categories
Forex Fundamental Analysis

EUR/JPY Global Macro Analysis – Part 1 & 2

Introduction

The global macro analysis of the EUR/JPY forex pair will involve the analysis of endogenous and exogenous economic factors. The endogenous analysis will cover indicators that drive economic growth in the EU and Japan. Exogenous factors will cover the analysis of factors that impact the exchange rate between the Euro and the Japanese Yen.

Ranking Scale

We will use a scale of -10 to +10 to rank the impact of these factors. When the endogenous factors are negative, it implies that they resulted in the depreciation of the local currency. a positive ranking implies that they led to an increase in the value of the domestic currency. The ranking of the endogenous factors is determined by their correlation with the domestic GDP growth.

When the exogenous factors get a negative score, it means they have a bearish impact on the EUR/JPY pair. A positive score implies they’ve had a bullish impact. The ranking of the exogenous factors is determined by their correlation to the exchange rate of the EUR/JPY pair.

EUR Endogenous Analysis – Summary

The endogenous analysis of the EUR has an overall score of -3. Based on the factors we have analyzed, we can expect that the Euro had marginally depreciated in 2020.

JPY Endogenous Analysis – Summary 

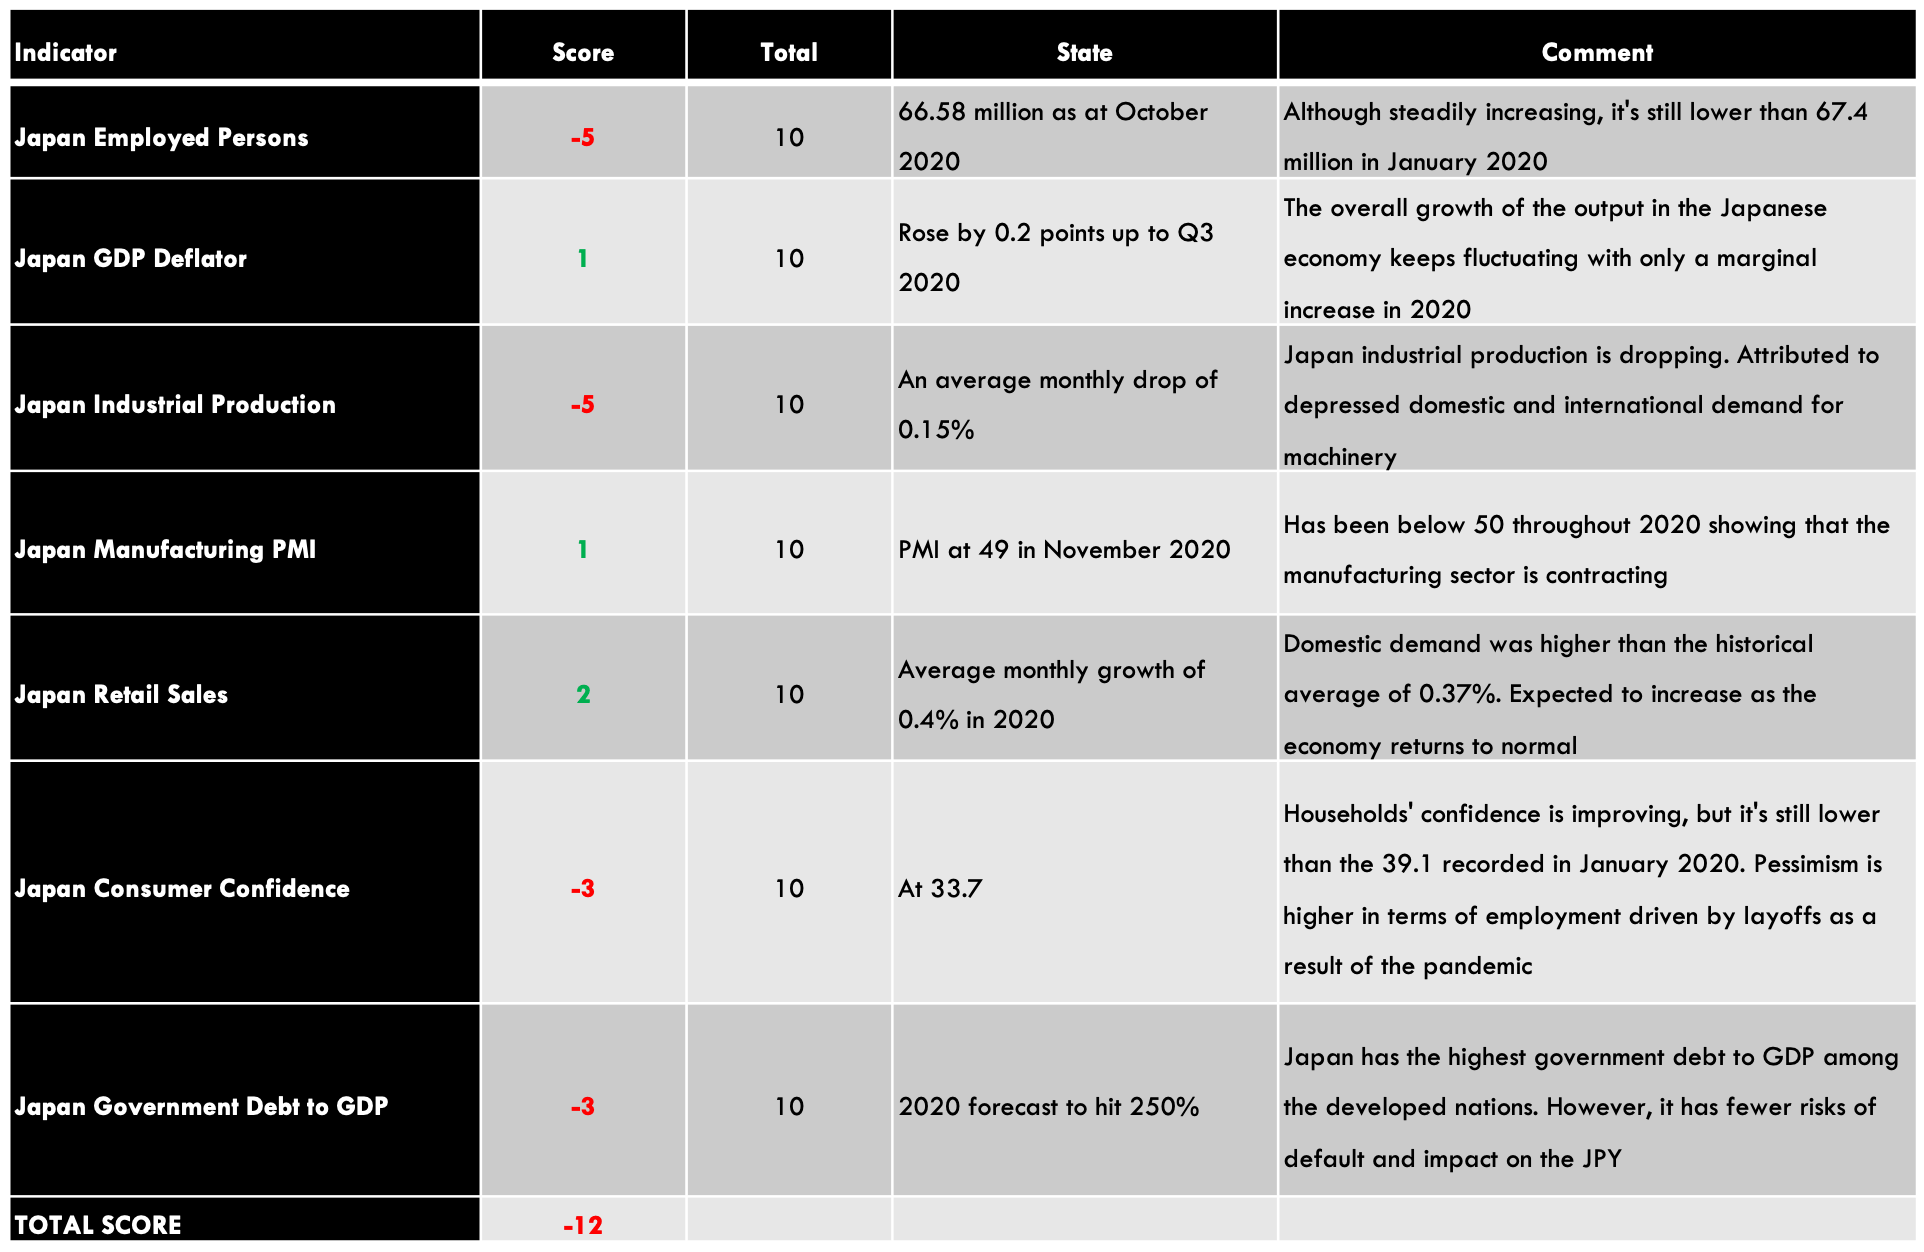
A score of -12 implies a strong deflationary effect on the JPY currency pair, and we can conclude that this currency has depreciated this year.

  • Japan Employed Persons

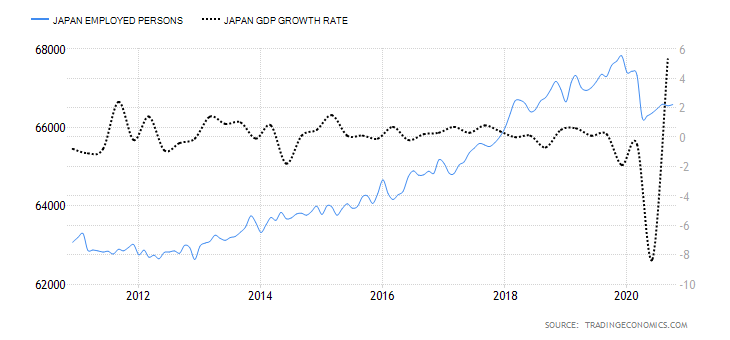
This indicator measures the changes in the number of workers over a particular period. It only tracks the section of the labor force that has attained the minimum working age. Changes in the labor market are seen as leading indicators of economic development.

In October 2020, the number of employed persons in Japan increased to 66.58 million from 66.55 million in September. The number of employed persons in Japan is still lower than the 67.4 million recorded in January. We assign a score of -5.

  • Japan GDP Deflator

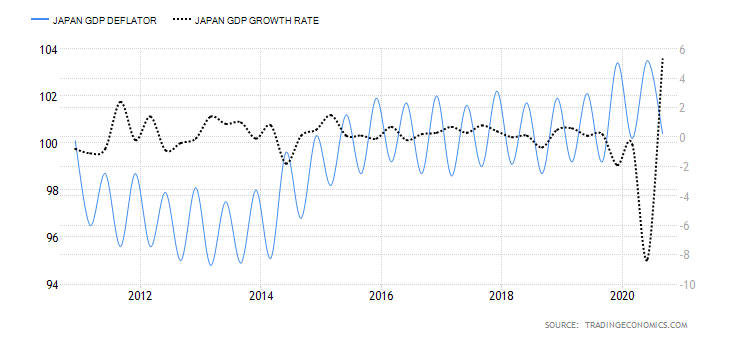
The GDP deflator is used to measure the comprehensive changes in the overall inflation of the Japanese economy. Since it measures the price changes of the entire economic output, it is used as a key predictor of future monetary and fiscal policies. An increase in GDP deflator means that the economy is expanding, which may lead to the appreciation of the JPY.

In Q3 of 2020, the Japan GDP deflator dropped to 100.4 from 103.5 in Q2. Up to Q3, the Japan GDP deflator has marginally increased by 0.2 points. We assign a score of 1.

  • Japan Industrial Production

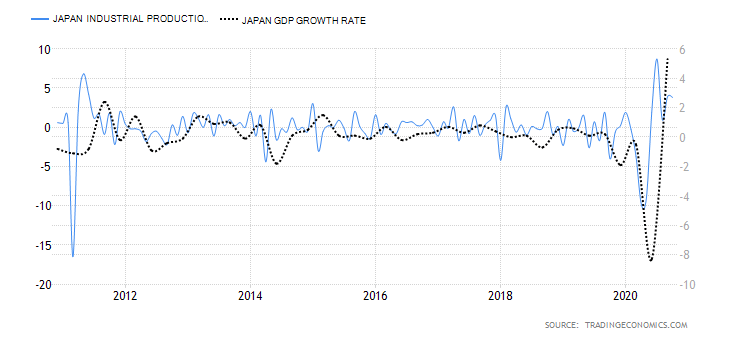
This indicator covers the changes in the output value of mining, manufacturing, and utility sectors. The Japanese economy is highly industrialized. The industrial sector contributes approximately 33% of the GDP. That means the GDP growth rate in Japan is sensitive to the changes in industrial production.

The MoM industrial production in Japan increased by 3.8% in October 2020 while the YoY dropped by 3.2% – the slowest since February 2020. On average, the MoM industrial production in Japan is -0.15%. We assign a score of -5.

  • Japan Manufacturing PMI

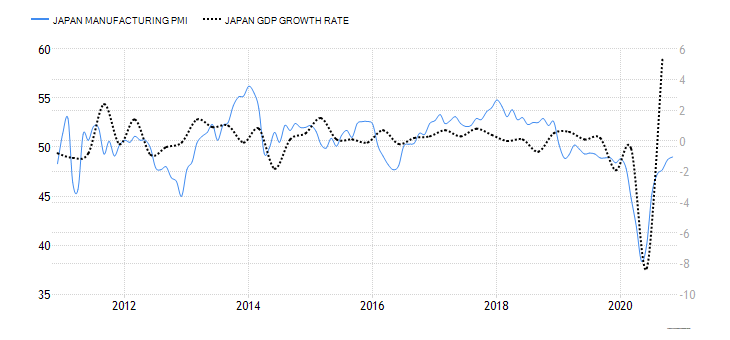
About 400 large manufacturers are surveyed monthly by The Jibun Bank. These manufacturers are classified according to the sector of operations, their workforce size, and contribution to GDP. The overall manufacturing PMI is an aggregate of employment, new orders, inventory, output, and suppliers’ deliveries. The Japanese manufacturing sector is seen to be expanding when the PMI is above 50 and contracting when below 50.

In November 2020, the Japan Manufacturing PMI was 49 compared to 48.7 in October. The November reading is almost at par with the January levels. We assign a score of 1.

  • Japan Retail Sales

The retail sales measure the change in the monthly purchase of goods and services by Japanese households. Since it is a leading indicator of consumer demand and expenditure, it is best suited to gauge possible economic contractions and expansions.

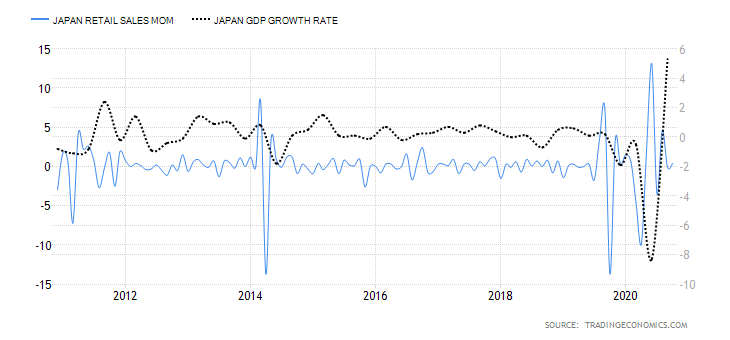
In October 2020, Japan retail sales rose by 0.4% from 0.1% recorded in September. YoY retail sales increased by 6.4%, which marks the first month of increase since February 2020. The growth of retail sales is mainly attributed to an increase in motor vehicle sales, machinery and equipment, and medicine & toiletry. On average, the first ten months of 2020 have had a 0.4% increase in MoM retail sales. Thus, we assign a score of 2.

  • Japan Consumer Confidence

This is a monthly survey of about 4700 Japanese households with more than two people. The survey covers the households’ opinion on the overall economic growth, personal income, employment, and purchase of durable goods. An index of above 50 shows that the households are optimistic, while below 50 shows that they are pessimistic.

In November 2020, Japan’s consumer confidence was 33.7 – the highest recorded since March. It is, however, still lower than the pre-pandemic levels of 39.1. We assign a score of -3.

  • Japan General Government Gross Debt to GDP

Prospective domestic and international lenders use the government debt to GDP ratio to determine the ability of an economy to sustain more debt. Among the developed nations, Japan has the highest government debt to GDP ratio. However, it has minimal risk of default since most of the debt is domestic and denominated in Japanese Yen, which poses a low risk of inflating the domestic currency in the international market.

In 2019, the general government gross debt to GDP in Japan was 238%, up from 236.6% in 2018. In 2020, it was projected to hit a maximum of 250%. We assign a score of -3.

In our upcoming article, we have performed an Exogenous analysis of the EUR/JPY Forex pair and gave our optimal forecast. Make sure to check that out. Cheers.

Categories
Forex Fundamental Analysis

EUR/CAD Global Macro Analysis Part 3

EUR/CAD Exogenous Analysis

  • The EU and Canada Current Account to GDP differential

When a country has a high current account to GDP ratio, it means that it is running a current account surplus. That implies that the country is highly competitive in international trade as the value of its exports is higher than its imports. Conversely, a country with a low or negative current account to GDP ratio, is running a current account deficit. It means that the value of its imports is higher than exports.

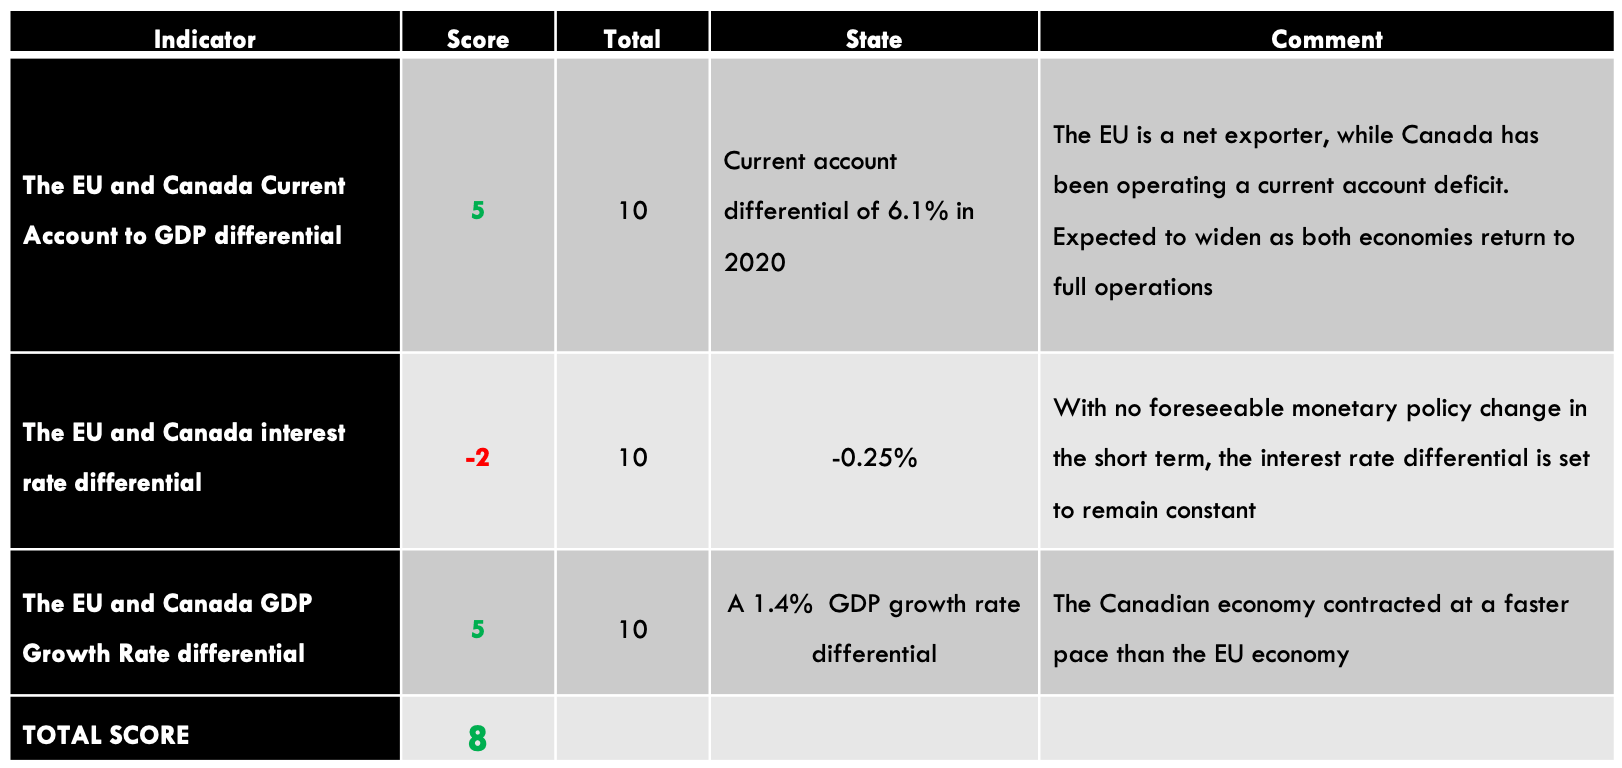
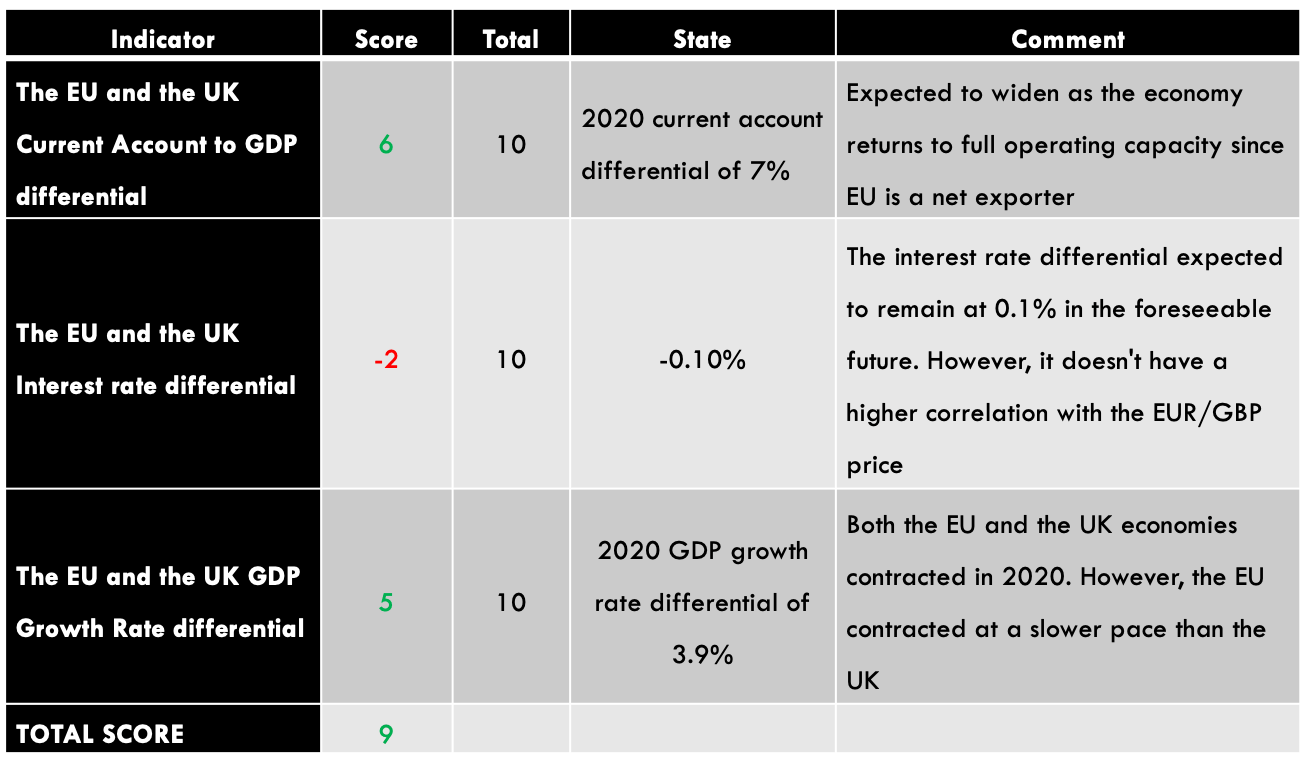
In 2020, Canada’s current account to GDP is expected to hit -2.7% while that of the EU 3.4%. Thus, the current account to GDP differential between the EU and Canada is  6.1%. This means that the EUR is in higher demand in the international market than the CAD. We assign a score of 5.

In the forex market, interest rate differential helps to show investors and traders which currency will earn them higher returns. In a carry trade, forex traders tend to be bullish on the currency that offers a higher interest rate differential. This means that the currency with the higher interest rate will have a higher demand than the lower interest rate.

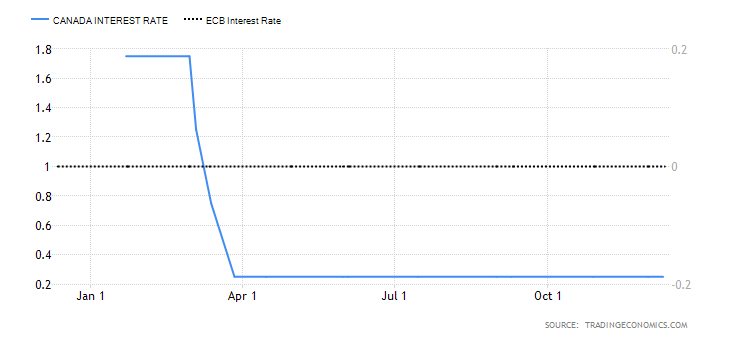
The European Central Bank has maintained interest rates at 0% throughout 2020, while in Canada, interest rates were cut from 1.75% to 0.25%. Thus, the interest rate differential for the EUR/CAD pair is -0.25%. We assign a score of -2.

  • The EU and Canada GDP Growth Rate differential

Since countries vary in the economy’s size, it makes it hard to compare them based on absolute GDP. However, the GDP growth rate helps filter out the effects of the economy size and instead compares countries based on their growth.

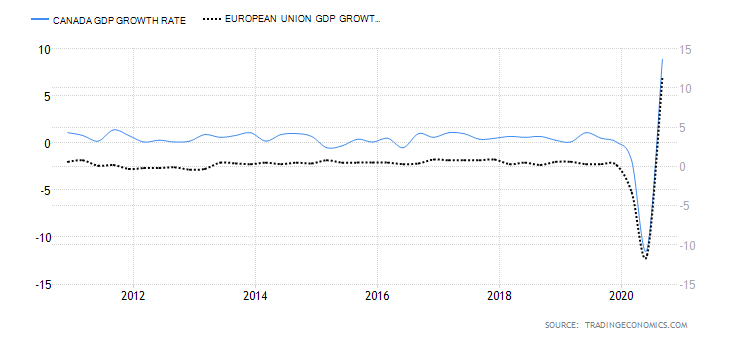
From January to September 2020, the Canadian economy has contracted by 4.3% while the EU economy has contracted by 2.9%. That means that the GDP growth rate differential between the EU and Canada is 1.4%. i.e., the Canadian economy has contracted more than the EU economy. We assign a score of 4.

Conclusion

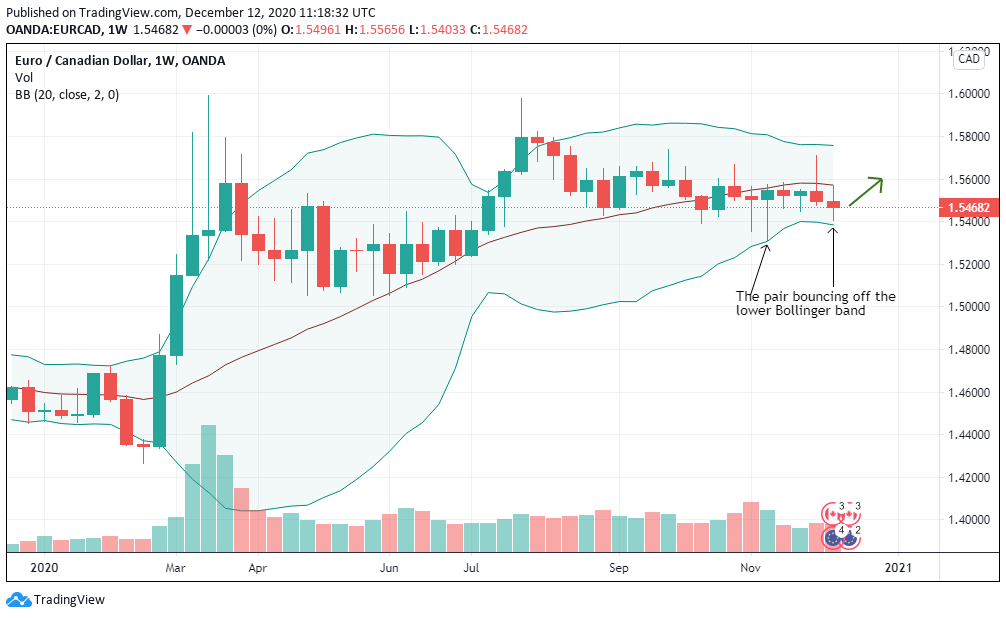
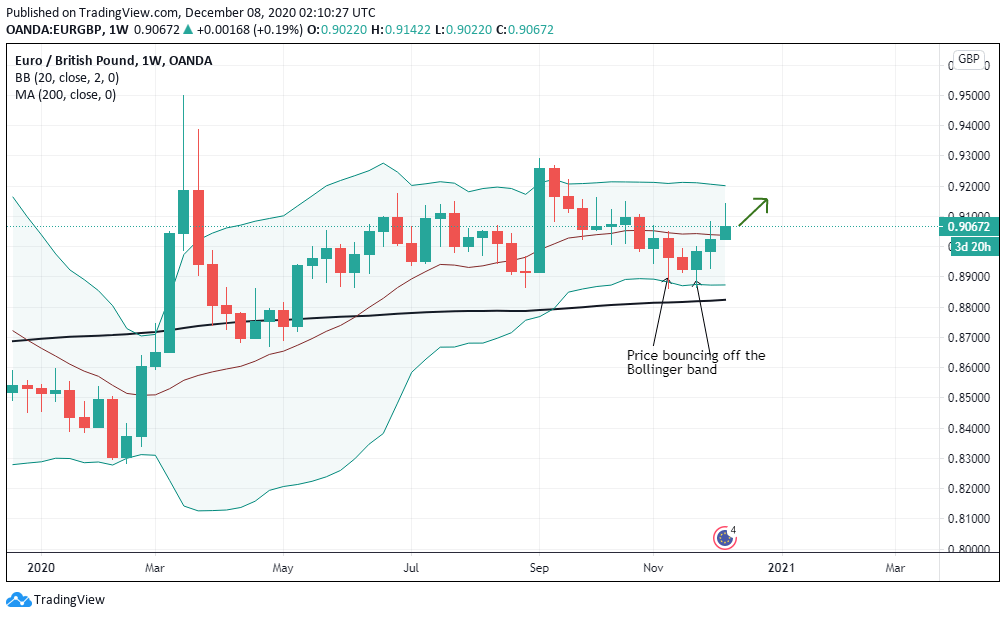
The exogenous analysis of the EUR/CAD pair has a score of 8, which means we can expect a bullish trend for the pair in the short-term. This is supported by our technical analysis, which shows the weekly chart bouncing off the lower Bollinger band, implying that an uptrend is looming.

We hope you find this article informative. In case of any queries, please let us know in the comments below. All the best.

Categories
Forex Fundamental Analysis

EUR/CAD Global Macro Analysis Part 1 & 2

Introduction

The global macro analysis of the EUR/CAD pair will analyze endogenous factors that drive the domestic GDP in the EU and Canada. We’ll also analyze exogenous factors that affect the dynamics of the EU and Canada economies, hence affecting the EUR/CAD exchange rate.

Ranking Scale

We’ll rank both endogenous and exogenous factors on a sliding scale from -10 to +10. When the endogenous factors are negative, it means they caused the domestic currency to depreciate. A positive ranking means they resulted in an appreciation of the currency during the period under review. The endogenous scores are based on correlation with the domestic GDP growth.

Similarly, when the exogenous factors get a negative score, they resulted in a drop in the exchange rate. A positive exogenous score means it increased the exchange rate of the EUR/CAD pair. The exogenous scores are based on a correlation with the price of the EUR/CAD pair.

EUR Endogenous Analysis – Summary

The endogenous analysis of the EUR has presented a score of -3. Based on the indicators that we have analyzed, we can conclude that the Euro has depreciated marginally this year.

CAD Endogenous Analysis – Summary

This economic indicator shows the monthly change in the number of Canadians who are employed. It covers both full-time and part-time employment. Normally, employment changes correspond to an increased business activity, which corresponds to changes in the GDP.

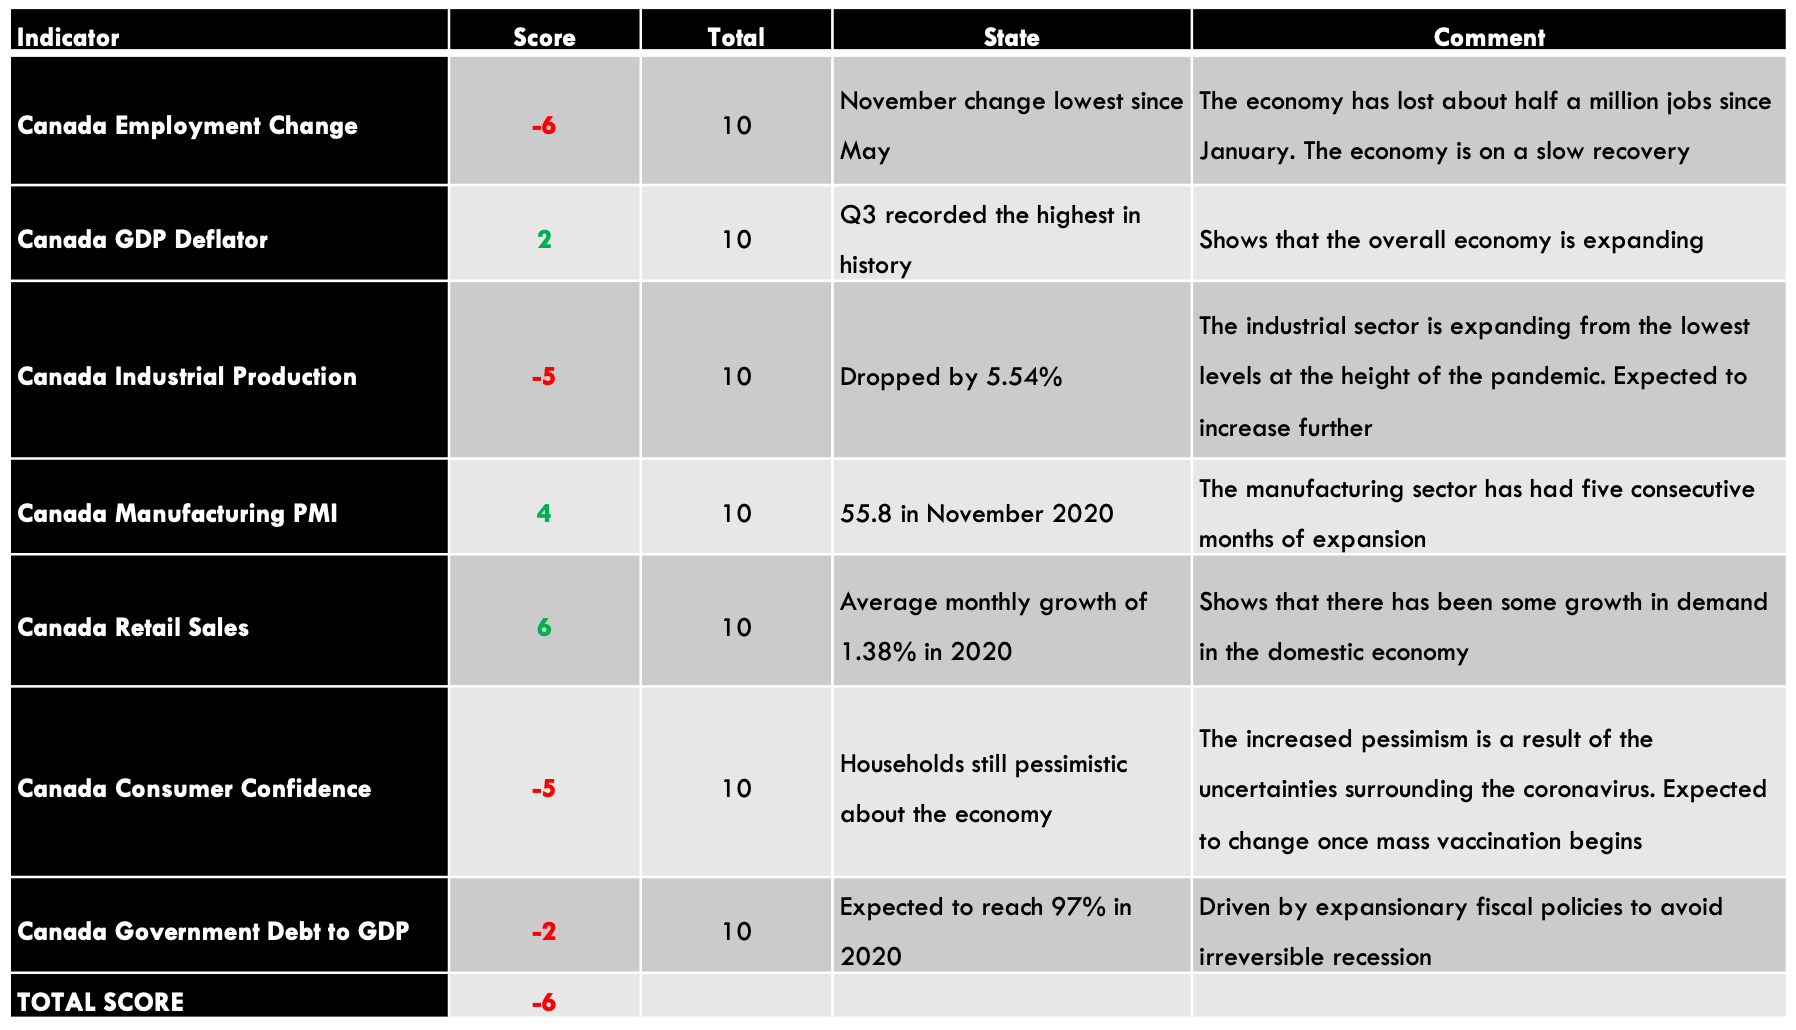
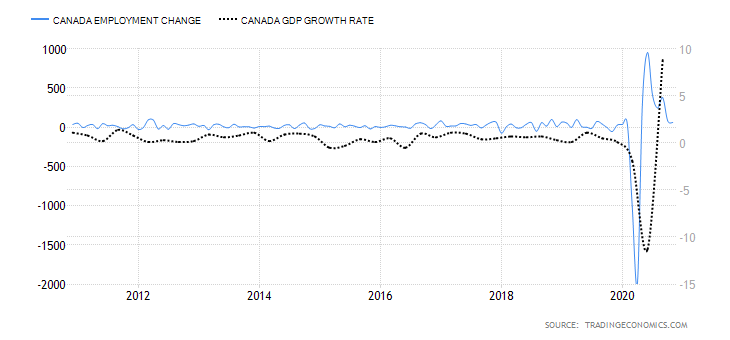
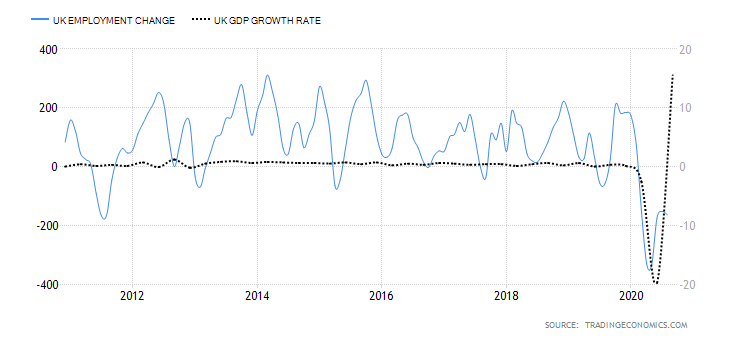
In November 2020, employment in Canada increased by 62,000, down from the 83,600 increase registered in October. The November employment change was the lowest since May 2020, when economic recovery from the effects of the coronavirus began. Up to November 2020, the Canadian economy has shed about half a million jobs. We assign a score of -6.

  • Canada GDP Deflator

The GDP inflator is a comprehensive measure of the change in the inflation rate in Canada. It is comprehensive since it reflects the changes in the prices of all goods and services produced within the economy. This contrasts with other measures of inflation like the CPI, which only measures changes in the price of a select basket of goods and services.

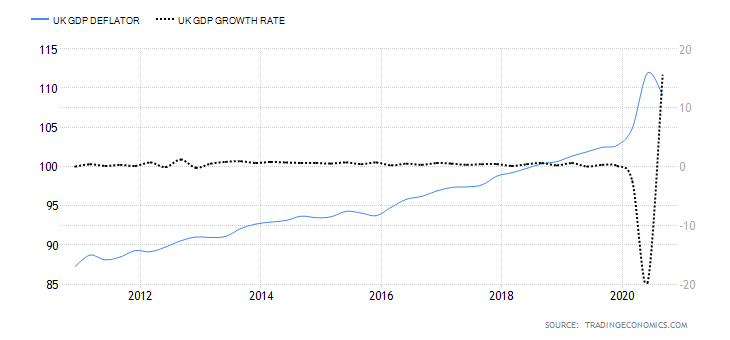
In Q3 of 2020, the GD deflator in Canada rose to 111.6 from 108.8 in Q2. Q3 reading is the highest ever in the history of Canada. This shows that the Canadian economy is bouncing back from the economic downturn brought about by the pandemic. We assign a score of 2.

  • Canada Industrial Production

This indicator measures the total output from businesses operating in the industrial sector. Canadian industrial production comprises mining, manufacturing, and utilities. It is the backbone of the Canadian economy, with crude oil production alone accounting for almost 10% of the GDP.

In September 2020, the YoY Canadian industrial production dropped by 7.9%, while the MoM increased by 1.41%, up from the 0.13% drop in August. Up to September, the overall industrial production is down 5.54%. We assign a score of -5.

  • Canada Manufacturing PMI

This indicator measures the Canadian manufacturing sector’s performance from the perspective of firms’ purchasing managers in the sector. The PMI aggregates the following indexes; inventories, employment, new orders, output, and suppliers’ deliveries. The sector is expanding if the index is above 50, while a reading below 50 shows contraction.

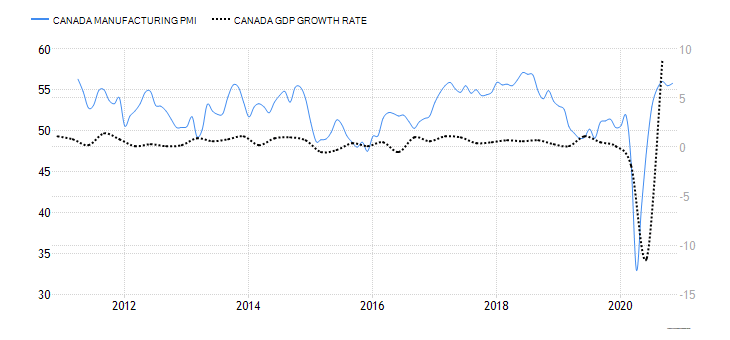
In November 2020, the Canada Manufacturing PMI rose to 55.8 from 55.5 in October. This marked the fifth consecutive expansion in the manufacturing sector from July 2020. Thus, we assign a score of 4.

  • Canada Retail Sales

The Canada retail sales data measures the changes in the value of final goods and services purchased by households over a particular period. It is a critical leading indicator of the overall economic growth since households’ consumption is considered the primary driver of GDP growth.

In September 2020, the MoM retail sales in Canada increased by 1.1%  compared to a 0.5% increase in August. YoY retail sales rose by 4.6% compared to 3.7% in August 2020. Up to September 2020, the retail sales figure has risen by an average of 1.38%. We assign a score of 3.

  • Canada Consumer Confidence

Canada consumer confidence is calculated from an aggregate of 11 questions from the survey of households. This survey estimated the current situation to that expected by households in about six months. The questions touch on the areas of the economy, personal finances, job security, household purchases, and savings vs. expenditure goals. Their confidence is measured on a scale from 0 to 100.

In November 2020, consumer confidence in Canada rose to 44.5 from 42.08 in October. It is, however, still lower than during the pre-pandemic period. We assign a score of -5.

  • Canada Government Gross Debt to GDP

In 2019, Canada had a government debt to GDP ratio of 88.6%, down from 89.7% in 2018. The 2019 ratio was the fourth consecutive year since 2016, when the government debt to GDP ratio dropped.

In 2020, it is projected that the Canadian government debt to GDP ratio will increase to 97%. This increase is due to the increased expenditure to alleviate the economy during the coronavirus pandemic. Over the long term, Canada’s government debt to GDP ratio is expected to stabilize around 90%. We assign a score of -2.

In the next article, you can find the exogenous analysis of the EUR/CAD forex pair where we have qualitatively forecasted the future price movement of this pair. Cheers.

Categories
Forex Fundamental Analysis

EUR/AUD Global Macro Analysis – Part 3

EUR/AUD Exogenous Analysis

  • The EU and Australia Current Account to GDP differential

The current account to GDP shows the percentage of a country’s international trade that makes up the GDP. Countries with higher current account surplus have a higher current account to GDP ratio while those running deficits have a negative current account to GDP ratio.

In this case, if the GDP differential is positive, it means that the exchange rate for the EUR/AUD pair will increase. But if the differential is negative, then the exchange rate for the pair will drop.

In 2020, the current account to GDP ratio in the EU is expected to hit 3.4% and -1.5% in Australia. Thus, the current account to GDP differential is 4.9%. We assign a score of 3.

Typically, investors put their money into financial instruments that offer higher interest rates. Therefore, the country with a higher interest rate should be expected to have more inflow of funds than that with a lower interest rate. Note that when foreign investors invest in the local economy, they have to convert their money into the domestic currency. This conversion increases the demand for the domestic currency in the forex market hence increasing its value.

In forex trading, if the EUR/AUD pair has a positive interest rate differential, it means that the exchange rate of the pair will increase. Conversely, a negative interest rate differential implies that the pair has a bearish outlook.

In 2020, the Reserve Bank of Australia cut the cash rate from 0.75% to 0.1%, while the ECB has maintained interest rates at 0%. Therefore, the interest rate differential for the EUR/AUD pair is -0.1%. We assign a score of -3.

  • The EU and Australia Growth Rate differential

In any economy, the value of the domestic currency is mostly determined by the growth of the local economy. Therefore, a country whose economy is growing faster will see its domestic currency appreciate faster.

If the growth rate differential is negative for the EUR/AUD pair, we can expect a bearish outlook. If it is positive, it implies that the exchange rate for the pair will rise.

For the first three quarters of 2020, the Australian economy contracted by 4% and the EU economy by 2.9%. The GDP growth differential is 1.1%. We assign a score of 2.

Conclusion

The EUR/AUD exogenous factors have a score of 2. If the conditions observed in the exogenous factors persist, we can expect that the pair will adopt a bullish trend in the short-term.

The technical analysis of the EUR/AUD shows the weekly price chart bouncing off the oversold region of the lower Bollinger bands. More so, the pair is still trading above the 200-period MA. All the best.

Categories
Forex Fundamental Analysis

EUR/AUD Global Macro Analysis – Part 1 & 2

Introduction

Global macro analysis of the EUR/AUD pair will focus on the endogenous analysis of fundamental factors driving economic growth in the EU and Australia. It will also involve exogenous analysis that will focus on factors that influence the EUR/AUD pair’s exchange rate.

Ranking Scale

This analysis will assign a score between -10 and +10, depending on the endogenous and exogenous factors’ impact.

A negative score for the endogenous factors means that the local currency shed some value. When positive, it means that the domestic currency has appreciated. The endogenous score is determined through correlation analysis between the endogenous factors and the GDP growth rate.

On the other hand, when the exogenous factors have a negative score, it means that the exchange rate between the EUR and the AUD will drop. A positive score means that the exchange rate will rise. The exogenous score is determined via a correlation analysis between the exogenous factors and the EUR/AUD pair’s exchange rate.

EUR Endogenous Analysis – Summary

The endogenous analysis of the EUR has an overall score of -3. Based on the factors we have analyzed, we can expect that the Euro has marginally depreciated in 2020.

AUD Endogenous Analysis – Summary

As you can see in the below image, according to the Endogenous Indicators of AUD, we can conclude that this currency has depreciated as well in 2020.

The employment change in Australia tracks the monthly number of people who are gainfully employed or engaged in unpaid work. The fluctuation in the number of those employed on a full-time or parttime basis helps to show economic growth.

Between September and October 2020, the number of those employed in Australia increased by 178,800. This shows that the economy is recovering and adding more jobs to the labor market. However, from January to October, the Australian labor market has lost about 190,100 jobs. Hence, we assign a score of -6.

  • Australia GDP Deflator

The GDP deflator measures the overall inflation for the economy. It is a comprehensive measure of inflation rate compared to other measures since it accounts for the changes in the prices of all goods and services produced within Australia. Changes in the prices often correspond to changes in economic growth.

In the third quarter of 2020, the Australia GDP deflator rose to 102.03 points from 101.64 in Q2. Up to Q3, the GDP deflator in Australia has dropped by 0.07 points. We assign a score of -2.

  • Australia Industrial Production

Industrial production measures the quarterly changes in output from the manufacturing sector, utilities, and mining. Note that the Australian economy is heavily dependent on commodity exports, which means that industrial production changes significantly impact economic growth.

In Q2, the industrial production in Australia dropped by 3.3%, while the YoY Q3 industrial production dropped by 2.02%. The drop in Q2 is the largest quarterly drop in over 25 years. We assign a score of -6.

  • Australia Manufacturing PMI

This PMI is from a survey of companies operating in the industrial sector. The index shows whether the manufacturing sector in Australia is expanding or contracting. In Australia, the Ai Group surveys the changes in new orders, employment, inventory, output prices, and production levels. When the index is above 50, it means that the manufacturing sector is expanding and contracting when it’s below 50.

In November 2020, the AIG Australian manufacturing PMI dropped to 52.1 from 56.3 in October. Despite the drop, the Australian manufacturing PMI points to growth in the industrial sector. Hence, we assign a score of 6.

  • Australia Retail Sales

The retail sales data in Australia tracks the monthly change of the consumer expenditure on goods and services. Consumer goods include items of clothing and footwear, food, and household items. Purchases made in restaurants, departmental stores, and hotel services and deliveries are also included as retail sales.

In October 2020, the MoM retail sales increased by 1.4% from a 1.1% drop in September. In 2020, the average MoM retail sales have grown by 0.97%. We assign a score of 2.

  • Australia Consumer Confidence

The Melbourne Institute and Westpac Bank survey about 1200 households in Australia and constructs the consumer confidence index. The index is based on households’ evaluation of their financial condition for the preceding year and in the next 12 months. It also includes their economic expectations in the next one and five years. When the index is above 100, it shows that households are optimistic and pessimistic if the index is below 100. Note that consumer confidence about their finances and the economy determines their level of expenditure; hence, it drives the rate of GDP growth.

In December 2020, consumer confidence in Australia rose to 112 from 107.7 in November, which is the highest in over ten years. We assign a score of 5.

  • Australia Government Debt to GDP

The government debt to GDP determines the ability of the economy to service its debts. It also impacts the ability of the government to take on more debt to advance an economic agenda. A debt level of below 60% of the GDP is preferable since it ensures that the government can take on more debt without over-leveraging the economy.

In 2019, the Australian government debt to GDP rose to 45.1% from 41.5% in 2018. In 2020, it is expected to reach 50% on account of increased government expenditure during the coronavirus pandemic. We assign a score of -3.

Please check our following article where we discuss the Exogenous analysis of the EUR/AUD Forex pair. Cheers.

Categories
Forex Fundamental Analysis

EUR/NZD Global Macro Analysis – Part 3

EUR/NZD Exogenous Analysis

  • The EU and New Zealand Current Account to GDP differential

An economy’s current account comprises the balance of trade, net transfer payments, and net factor income. In international trade, a country with a higher current account surplus experiences higher demand for its domestic currency. That means the value of its currency will be higher. Typically, a higher current account to GDP means that the country has more current account surplus.

For the EUR/NZD pair, if the differential of the current account to GDP is negative, it means that the pair’s exchange rate will fall. If it’s positive, we can expect the pair’s exchange rate to increase.

In 2020, New Zealand’s current account to GDP is forecasted to reach -0.8% while that of the EU 3.4%. Thus, the current account to GDP differential between the EU and New Zealand is 4.2%. We assign a score of 4.

The prevailing interest rate in a country determines the flow of capital from foreign investors. Naturally, the country that offers a higher interest rate will attract more foreign investors who seek higher returns. Similarly, a country with lower interest rates will experience an outflow of capital by foreign investors. In the forex market, a currency pair with a positive interest rate differential tends to be bullish since traders are buying the base currency – which offers a higher interest rate and sell the quote currency – which has a lower interest rate. Conversely, a currency pair is expected to be bearish if the interest rate differential is negative since investors will sell the base currency and buy the quote currency.

In 2020, the Reserve Bank of New Zealand cut the official cash rate to 0.25%, while the ECB maintained the interest rate at 0%. Hence, the interest rate differential for the EUR/NZD pair is -0.25%. We assign a score of -3.

  • The EU and New Zealand GDP Growth Rate differential

The value of a country’s domestic currency is impacted by the growth rate of the local economy. Thus, comparing the growth rate between countries’ GDP growth rates helps determine which currency appreciated or depreciated more than the other.

The New Zealand economy contracted by 3.2% in the first three quarters of 2020 and that of the EU by 2.9%. The GDP growth rate differential is 0.3%. We assign a score of 2.

Conclusion

The EUR/NZD exogenous analysis has a cumulative rank of 3. This means that the pair is expected to trade in a bullish trend in the short-term.

The bullish trend can also be observed from the technical analysis of the weekly price charts. The pair is trading above the 200-period MA and the weekly price rebounding from the lower Bollinger Band.

We hope you found this analysis informative. If you have any questions, please let us know in the comments below. Cheers!

Categories
Forex Fundamental Analysis

EUR/NZD Global Macro Analysis – Part 1 & 2

Introduction

In conducting the global macro analysis for the EUR/NZD pair, we will analyze the endogenous factors that impact the EU and New Zealand economic growth. We’ll also analyze exogenous economic factors that affect the EUR/NZD pair’s exchange rate in the forex market.

Ranking Scale

We will rank the effects of the endogenous and exogenous factors on a sliding scale of -10 to +10. The endogenous factors will be ranked based on correlation analysis with the GDP growth rate. When the endogenous ranking is negative, it means that the domestic currency will depreciate and appreciate when positive.

Similarly, the exogenous factors are scored based on correlation analysis with the EUR/NZD pair’s exchange rate. A positive score means that the EUR/NZD pair’s price will rise and drop if the score is negative.

Summary – EUR Endogenous Analysis

Based on the factors we have analyzed, we have got a score of -3, and we can expect the Euro to be marginally depreciating in 2020.

Summary – NZD Endogenous Analysis

A score of -4 on NZD Endogenous Analysis implies that in 2020, the NZD has depreciated as well.

Employment change measures the quarterly change in the number of people who are gainfully employed. It can be used as a comprehensive measure of the labor market changes, which corresponds to economic growth.

In Q3 of 2020, Employment in New Zealand dropped by 0.8%, from a 0.3% drop in Q2 to 2.709 million. The Q3 reading is the largest drop in QoQ employment since Q1 of 2009. We assign a score of  -6.

  • New Zealand GDP Deflator

This indicator measures the quarterly changes in the price of all economic output in New Zealand. It is regarded as the most specific inflation measure since it covers price changes for every good and service produced.

In Q2 of 2020, the New Zealand GDP deflator dropped to 1238 points from 1242 in Q1. This shows that the economy contracted in Q2. Hence, we assign a score of -3.

  • New Zealand Manufacturing Sales

New Zealand manufacturing sales track the change in the volume of total sales made in the manufacturing sector. The indicator tracks the sales in 13 industries, which comprehensively represents New Zealand’s economy. The changes in the volume of sales are directly correlated to the growth of the economy.

In Q3 of 2020, the YoY manufacturing sales in New Zealand increased by 3.1% after dropping by 12.1% in Q2 and 1.9% in Q1. The increase in Q3 is the largest recorded since January 2017. However, since the overall industrial production is still at multi-year lows, we assign a score of -6.

  • New Zealand Manufacturing PMI

This index is aggregated from a survey of purchasing managers in the manufacturing sector. It is a composite of scores regarding output in the sector, prices, expected output, employment, new orders, and inventory. When the PMI is above 50, it means that the manufacturing sector is expanding. A PMI score below 50 shows that the sector is contracting. Naturally, these periods of expansions and contractions are leading indicators of changes in the GDP growth rate.

In November 2020, the New Zealand manufacturing PMI rose to 55.3 from 51.7 in October. The rise was due to increased new orders, inventory, production, and deliveries, as uncertainties surrounding COVID-19 decreased. We assign a score of 4.

  • New Zealand Retail Sales

The retail sales track the changes in the quarterly purchase of final goods and services by households in New Zealand. Although retail sales are often affected by seasonality and tend to be highly volatile, it is a significant measure of the overall economic growth since consumer expenditure is one of the primary drivers of GDP growth.

In Q3 of 2020, New Zealand retail sales increased by 28% from 14.8% recorded in Q2. Historically, the Q3 retail sales increase is the largest rise recorded in New Zealand since 1995. The increase was driven by increased expenditure on groceries, vehicles, and household goods. On average, the QoQ New Zealand retail sales figure has grown by 4.1%. We assign a score of 4.

  • New Zealand Consumer Confidence

The New Zealand consumer confidence is also called the Westpac McDermott Miller Consumer Confidence Index. The index measures the quarterly change in consumers’ pessimism or optimism about the performance of the economy. When the index is above 100, it shows increased optimism by households, and that below 100 shows pessimism.

In the fourth quarter of 2020, New Zealand consumer confidence rose to 106 from 95.1 in Q3. The increased optimism was driven by higher readings in both the current and expected financial situation. We assign a score of 2.

  • New Zealand Government Net Debt to GDP

Investors use this ratio to determine if the economy is capable of servicing its debt obligations. Consequently, the government’s net debt to GDP affects the government securities yield and determines a country’s borrowing costs. Typically, levels below 60% are deemed favorable.

In 2019, the New Zealand Government Net Debt to GDP dropped to 19% from 19.6% in 2018. In 2020, it is projected to range between 27% to 32%, which would be the highest since 1998. We assign a score of 1.

In the next article, we have done the exogenous analysis of both EUR and NZD pairs to accurately forecast this currency pair’s future trend. Please check that out. Cheers.

Categories
Forex Fundamental Analysis

EUR/GBP Global Macro Analysis – Part 3

EUR/GBP Exogenous Analysis

  • The EU and the UK Current Account to GDP differential

This indicator is used to measure how competitive an economy is in the international market. When a country has a higher trade surplus, the current account to GDP ratio is higher. Conversely, if a country has a lower trade surplus or deficit, the ratio is smaller.

Typically, economies with a higher surplus in terms of the balance of trade tend to have more exports than imports. That means that their value on exports is higher than imports, implying that the domestic currency is in high demand in the forex market. Similarly, a running deficit means lower demand for the domestic currency in the forex market since it is a net importer.

In 2020, the EU current account to GDP is expected to hit 3.4% while that of the UK -4%. The differential is 7%. Based on the correlation with the exchange rate of the EUR/GBP pair, we assign a score of 6. That means we expect a bullish trend for the pair.

This helps determine where the most investor capital will flow. Expectedly, investors will direct their capital to the country with a higher interest rate to earn superior returns. In the forex market, traders tend to be bullish when a currency pair has a positive interest rate differential and bearish if it has a negative interest rate differential.

In the EU, the ECB has maintained interest rates at 0%, while the BOE cut interest rates from 0.75% to 0.1%. Therefore, the interest rate differential for the EUR/GBP pair is -0.1%. Based on the correlation with the EUR/GBP exchange rate, we assign a score of -2.

  • The EU and the UK GDP Growth Rate differential

The differential in GDP growth helps to efficiently compare economic growth by eliminating the aspect of the size of different economies.

For the first three quarters of 2020, the EU economy has contracted by 2.9% while the UK has contracted by 6.8%. That makes the GDP growth rate differential between the two economies 3.9%. It means that the EU economy contracted at a slower pace than the UK. Based on the correlation with the EUR/GBP price, we assign a score of 5.

Conclusion

The exogenous analysis of the EUR/GBP pair has a score of 9. This inflationary score means that we can expect a bullish trend for the pair in the short-term.

Our technical analysis shows the pair trading above the 200-period MA. More so, notice that the EUR/GBP pair bounces off the lower Bollinger band crossing above the middle band, supporting our fundamental analysis. Happy  Trading.

Categories
Forex Fundamental Analysis

EUR/GBP Global Macro Analysis – Part 2

GBP Endogenous Analysis – Summary

The GBP endogenous analysis has a score of -9. We can therefore understand that the GBP has depreciated in 2020.

  • United Kingdom Employment Change

The UK unemployment change measures the changes in the number of people who are above 16 years and employed. This data is a 3-month moving average of the change in employment, which measures a general trend in the labor industry changes, which typically corresponds to fluctuations in the economy.

In the three months to September 2020, the number of employed people in the UK dropped by 164,000. The YoY employment change shows a drop of 247,000 jobs, which is the worst in ten years. Based on correlation analysis, we assign a score of -7.

  • United Kingdom GDP Deflator

The UK GDP deflator is used as a measure of the comprehensive change in inflation. It filters out any nominal price changes in the entirety of the goods and services produced within the UK.

In Q3 of 2020, the UK GDP deflator dropped to 109.12 from 111.9 in Q2 – the highest ever recorded in UK history. The UK GDP deflator has increased by 6.41in 2020. We, therefore, assign a score of 4 based on its correlation with the GDP growth.

  • United Kingdom Industrial Production

This indicator tracks the changes in all the firms operating under the industrial sector in the UK. The manufacturing sector accounts for about 70% of the total industrial output. The major components of the manufacturing sector are food, tobacco, and drinks, which account for 11%. The manufacture of transport equipment and basic metals account for 17%, pharmaceuticals and non-metallic 6% each. Quarrying and mining activities account for 12% of the industrial production, with 10% for oil and gas extraction.

In September 2020, MoM industrial production in the UK rose by 0.5 while YoY dropped by 6.3%. Despite the growth and recovery of industrial activity from the coronavirus pandemic, the output is still 5.6% lower than the pre-pandemic levels. Thus, we assign a score of -3 based on correlation with GDP growth.

  • United Kingdom Manufacturing PMI

This index is a result of a survey of about 600 companies in the industrial sector. It is a composite of new orders, which accounts for 30%, output 25%, employment 20%, deliveries from suppliers 15%, and inventory 10%. When the index is above 50, it shows that the manufacturing sector is expanding. Below 50, the manufacturing sector is expected to contract, which impacts the GDP output.

In November 2020, the UK manufacturing PMI was 55.6 – the highest recorded in three years. This was mainly driven by increased inventories and increased new orders as a result of Brexit. We assign a score of 3 based on correlation with the GDP growth rate.

  • United Kingdom Consumer Spending

Consumer spending in the UK shows the amount of money that households spent on the purchase of goods and services in the retail sector. Note that expenditure by households is among the primary drivers of GDP growth.

In Q3 of 2020, the UK consumer spending rose to £304.5 billion from £258.32 billion in Q2. This increase is attributed to the restriction imposed at the onset of the coronavirus outbreak, resulting in the economic slowdown. It is, however, still lower than the pre-pandemic levels. Thus, we assign a score of -5 based on correlation with the GDP growth rate.

  • United Kingdom Consumer Confidence

In the UK, GfK surveys about 2000 households to establish their opinions about the past and future economic conditions, their financial situation, and prospects of saving. The survey period covers about 12 months into the future, which makes it a leading indicator of consumer spending, and by extension, the overall economy.

In November 2020, the UK consumer confidence dropped to -33 edging closer to yearly lows of -34 registered at the height of the pandemic. We assign a score of -5 based on its correlation with the GDP growth rate.

  • United Kingdom Public Sector Net Debt to GDP

This ratio tracks the indebtedness of the UK economy. Based on the economy out, both domestic and foreign investors use the ratio to determine whether the UK can be able to service its debt obligations in the future comfortably.

In the financial year 2018 – 2019, the UK’s public sector net debt to GDP was 80.8%, down from 82.4%. In 2020, it is expected to hit 100% with a longer-term average of 91%. We assign a score of 4 since the increased net pubic debt managed to avoid a deeper recession in 2020.

In the next article, we have performed the Exogenous analysis of the EUR/GBP pair and concluded what trend to expect in this currency pair in the near future. Cheers.

Categories
Forex Fundamental Analysis

USD/CHF Global Macro Analysis – Part 3

USD/CHF Exogenous Analysis

The exogenous analysis covers fundamental indicators that can compare the performance of the US and Swiss economies. Note that this comparison between the two economies is what drives the exchange rate of USD/CHF. They are:

  • US and Swiss interest rate differential
  • The difference in the GDP growth in the US and Switzerland
  • Balance of trade differential

Balance of trade differential

For each country, the balance of trade shows the demand for the domestic currency in the international market. When a country has a surplus of the balance of trade, it means that its currency is in high demand in international trade. The rationale behind this is that when a country exports more than it imports, other countries will need more of that country’s currency to participate in international trade.

The balance of trade differential measures the difference between the balance of trade in Switzerland and the US. If the Swiss balance of trade is higher than that of the US, the USD/CHF pair will be bearish.

In October 2020, Switzerland had a trade surplus of CHF 2.9 billion while the US a deficit of $63.1 billion. Throughout 2020, the US trade deficit has been widening from $37 billion in January, while the Swiss trade surplus has increased from CHF 2.8 billion.

Based on the correlation with the USD/CHF pair, we assign the balance of trade differential a score of -5.

US and Switzerland interest rate differential

Typically, the country with a higher interest rate attracts more foreign capital seeking superior returns. A higher interest rate increases the domestic currency demand, which makes it appreciate in the forex market. More so, forex traders tend to be bullish on the currency with the higher interest rate.

The interest rate by The Swiss National Bank is -0.75% since January 2015. In the US, the federal funds rate is 0.25%. That makes the interest rate differential 1% for the USD/CHF pair.

Based on the correlation analysis with the USD/CHF pair, we assign the interest rate differential a score of 3.

The difference in the GDP growth in the US and Switzerland

A country’s GDP is primarily driven by domestic consumption. Although the GDP size differs in absolute terms, we can compare the US and Swiss GDP in terms of growth rate. An expanding economy is accompanied by appreciating currency. Therefore, if the US growth rate is higher than Switzerland’s, we can expect a bullish trend for the USD/CHF pair.

In Q3 of 2020, the Swiss economy expanded by 7.2% and the US by 33.1%. It means that the US economy is recovering faster than that of Switzerland. We, therefore, assign a score of 2. This implies that the GDP growth rate differential between the US and Switzerland has led to a bullish USD/CHF.

Conclusion

The USD/CHF pair has an exogenous score of -2. This implies that we can expect the pair to continue with its current bearish trend in the near future.

Note that the USD/CHF pair has breached the lower Bollinger band. Therefore, we can expect the downtrend to continue for a while, which supports our fundamental analysis. All the best.

Categories
Forex Fundamental Analysis

USD/CHF Global Macro Analysis – Part 1 & 2

Introduction

When conducting the global macroeconomic analysis, endogenous and exogenous factors are considered. These analyses can be used to explain the price dynamic of a currency pair. In this case, we will analyze the endogenous factors that drive the economy in the US and Switzerland. We will also analyze the exogenous factors that primarily drives the price of the USD/CHF pair.

Ranking Scale

A sliding scale from -10 to +10 will be sued to ranks the impact of the individual endogenous and exogenous factors on the currency. A negative ranking for the endogenous factors means that they had a depreciating impact on the individual currencies, while a positive ranking means they resulted in currency appreciating.

Similarly, a negative ranking for the exogenous factors implies that they’ve had a bearish impact on the currency pair, while a positive ranking means they’ve had a bullish impact.

Summary of USD Endogenous Analysis

From the above table, we can see a clear deflationary effect on the USD currency and implies that it has depreciated in its value since the beginning of the year. You can find the complete USD Endogenous Analysis here.

Summary of CHF Endogenous Analysis

Overall, the endogenous analysis of CHF has a score of -5. That implies that the CHF is expected to have depreciated marginally in 2020.

  • Switzerland Inflation Rate

The rate of inflation is used to measure the changes in the price of consumer goods in Switzerland over a specified period – usually monthly or yearly. Here are the components of the CPI in Switzerland: Housing and energy, which accounts for 25% of the total CPI weight; 16% for healthcare; Transport accounts for 11%; Food and non-alcoholic drinks 11%; hotel and restaurant services 8%; 4% for Household goods and services; and clothing 3%. Education, communication services, and alcoholic beverages cumulatively account for 7% of the total CPI weight.

In November 2020, the YoY CPI in Switzerland dropped by 0.7%, while the MoM CPI dropped by 0.2%. The fall in prices of the hotel and holiday packages contributed to the drop in the inflation rate. The Switzerland CPI is at the lowest point since January 2018.

Based on our correlation analysis, we assign the Switzerland rate of inflation a score of -3.

  • Switzerland Unemployment Rate

This economic indicator shows the percentage of the total Swiss labor force that is actively seeking a job. Note that not all unemployed portion of the working-age population are seeking employment; so, they are not captured by the unemployment rate.

The unemployment rate can also be used to show the rate at which the economy is adding or cutting job opportunities. This can be used to show economic growth.

In October 2020, the Swiss unemployment rate was 3.2%, down from highs of 3.4% in May, while the employment rate in Q3 2020 was 79.7%. Although it is higher than the 79.1% registered in Q2, it is still significantly lower than the pre-pandemic rate of 80.4%.

The Swiss unemployment rate has a high correlation with the GDP, but since it only increased marginally, we assign it a score of -2.

  • Switzerland Manufacturing PMI

The Swiss procure.ch Manufacturing Purchasing Managers’ Index surveys the executives in the manufacturing sector. The index is a measure of the Swiss manufacturing sector’s performance and serves as a leading indicator for business expectations.

The Manufacturing PMI is an aggregate of five components: new orders, which a weight of  30%, output 25%, employment 20%, supplies 15%, and inventory 10%. The manufacturing sector is expected to expand when the index is above 50 and contract when the index is below 50.

In November 2020, the Swiss procure.ch Manufacturing PMI increased to 55.2, the highest since December 2018. Based on the correlation analysis with the GDP, we assign a score of 7 since it shows a robust expansion.

The Swiss services industry employs over 60% of the working population and accounts for 73% of Switzerland’s GDP. This makes the services PMI a crucial indicator of the overall economy. The Services PMI is obtained through a comprehensive survey of 300 purchasing managers in the services sector to evaluate the changes in business activities.

The survey covers areas such as customer new orders, purchasing, and sales prices, and changes in the employment level.

In November 2020, the Swiss services PMI dropped to 48 from 50.4 in October, primarily attributed to new orders’ contraction. Although it is almost double the 21.4 recorded in April, it is still lower than the 57.3 recorded in January 2020. We, therefore, assign it a score of -4.

  • Switzerland Consumer Confidence

In Switzerland, consumer confidence is used to evaluate households’ opinion on the overall economy and their financial position. Typically, consumer confidence is higher when there is high GDP growth, and the unemployment rate is low.

In the fourth quarter of 2020, the Swiss consumer confidence was -12.8, better than Q2 -39.3. Consumer confidence is used to show the likelihood of how much households will spend in the economy. Hence we assign it a score of -2.

  • Switzerland Government Gross Debt to GDP

The Swiss government debt is the totality of the government’s amount owed to both domestic and foreign lenders. This debt is expressed as a percentage of the GDP o help determine the indebtedness of the economy. Lenders also use this metric to determine if there is a possibility of default by the government. Typically, government debt that is less than 60% of the economy is considered ideal.

In 2019, Switzerland’s government gross debt to GDP was 41%, and it’s projected to hit 49% in 2020 due to increased government expenditure to curb the economic slowdown brought about by the coronavirus pandemic. However, the Swiss government’s gross debt to GDP has been steadily declining since 2004, averaging at around 37%. Based on our correlation analysis and the fact that it has marginally increased in 2020, we assign a score of -1.

Now we know that both USD and CHF have depreciated according to their respective endogenous indicators. Please check our next article to know if this pair is expected to be bullish or bearish in the near future according to their exogenous indicators. Cheers.

Categories
Forex Fundamental Analysis

AUD/USD Global Macro Analysis – Part 3

AUD/USD Exogenous Analysis

In the exogenous analysis, we will compare the differentials in the US and the Australian economies at an international level. We will use:

  • The differential in GDP growth in the US and Australia
  • The US and Australian interest rate differential
  • The differential in the US and Australian balance of trade

The differential in GDP growth in the US and Australia

Domestically, the value of USD and AUD are pushed by the changes in the macroeconomic factors that drive GDP growth. The dynamic of the AUD/USD exchange rate is affected by the difference in the GDP growth rate. The country with a faster GDP growth will see its currency appreciate more than the one with slower growth.

In Q3 of 2020, the Australian GDP increased by 3.3% compared to the 7% drop in Q2. The US economy expanded by 33.1% in Q3 2020 compared to a 31.4% drop in Q2. In the first three quarters, the US economy has contracted by 3.3% while the Australian economy has contracted by 4%. Therefore, the GDP growth differential between Australia and the US is -0.7%. Based on the correlation analysis with the AUD/USD pair, we assign a score of -2.

The US and Australian interest rate differential

This measures the difference between the interest rate set by the Reserve Bank of Australia (RBA) and the US Federal Reserve. In the forex market, carry traders tend to be bullish when a currency pair has a positive interest rate differential and bearish when it is negative. That is because more investor funds flow towards the country with a higher interest rate.

At the onset of the COVID-19 pandemic, the RBA cut interest rates from 0.75% to 0.1%, while the Federal Reserve cut interest rates from 1.75% to 0.25%. That makes the interest rate differential for the AUD/USD pair -0.15%. Based on correlation analysis with the exchange rate for the AUD/USD pair, we assign a score of -2.

The differential in the US and Australian balance of trade

The difference between the balance of trade for Australia and the US will help determine which currency is in higher demand in international trade. Note that increased demand in the forex market also increases the value of that currency.

In October 2020, Australia’s trade surplus increased to AUD 7.46 billion compared to 5.82 billion in September. However, it is still lower than the highest recorded AUD 9.62 billion surpluses in March. The US had a trade deficit of $63.1 billion in October, which has been expanding since January. The balance of trade differential is $68.633 billion between Australia and the US. Based on the correlation with the AUD/USD exchange rate, we assign a score of 6.

Conclusion

The exogenous score for the AUD/USD pair is 2. It means that we can expect that the pair will be on a bullish trend in the short-term.

In technical analysis, the short-term bullish trend is supported by the fact that the pair is trading above the 200-period MA and breaching the upper Bollinger Band. Cheers!

Categories
Forex Fundamental Analysis

AUD/USD Global Macro Analysis – Part 1 & 2

Introduction

In the global macro analysis of the AUD/USD pair, we will look at the endogenous economic factors that drive GDP growth in both Australia and the US. We’ll also analyze the exogenous factors that affect the exchange rate dynamic between the AUD and the USD.

Ranking Scale

We will use a sliding scale from -10 to +10 to rank the impact of the endogenous and exogenous factors. When the endogenous factors are negative, it means that they resulted in the depreciation of either the USD or the AUD. When positive, it implies they resulted in the appreciation of the individual currencies. Similarly, negative endogenous factors result in a bearish trend for the AUD/USD and a bullish trend for when they are positive.

USD Endogenous Analysis – Summary

A -19.1 score on Endogenous analysis on USD implies a deflationary effect on this currency. It means that the US Dollar has lost its value since the starting of 2020.

You can find the complete USD Endogenous Analysis here.

AUD Endogenous Analysis – Summary

The endogenous factors have an overall score of 3, implying that the AUD has appreciated in 2020.

  1. Australia Inflation Rate

The consumer price index in Australia is calculated quarterly. Housing accounts for 22.3% of the total CPI weight, food and non–alcoholic drinks 16.8%, recreation 12.6%, transportation 11.6%, household goods and services 9.1%, alcohol and tobacco 7.1%, healthcare 5.3%, financial service 5.1%, clothing, education and communication 10.2%.

In Q3 of 2020, the YoY Australian CPI increased by 0.7% from a drop of 0.3% in Q2. The QoQ CPI rose by 1.6% compared to 1.9$ in Q2. Note that the Q3 CPI is marginally lower than in the pre-pandemic levels in Q1. Based on inflation’s correlation with GDP growth, we assign a score of -1.

  1. Australia Unemployment Rate

The unemployment rate is the percentage of the labor force that is actively looking for employment opportunities. The unemployment rate can be used to show the state of the economy. When high, it means that the economy is shedding jobs faster and can be said to be contracting.

In October 2020, the Australian unemployment rate was 7% up from 6.9% in September. The increase in the Australian unemployment rate can be attributed to the prolonged COVID-19 crisis. Note that during the period, the employment rate increased to 61.2% from 60.4% in September. This was mainly driven by the surge in full-time, part-time job numbers coupled with a drop in the underemployment rate to 10.4% from 11.4% in September.

From January to date, the unemployment rate has increased by 1.7% while the employment rate has dropped by 1.4%. Based on its correlation with GDP, we assign a score of -5.

  1. Australia Mining Production

The Australian economy significantly relies on mining, which accounts for up to 11% of the GDP. Australia is among the top producers of precious metals in the world. Therefore, a significant portion of the labor market is dependent on the mining sector.

The YoY mining production increased by 1.2% in the second quarter of 2020, down from a 5.1% increase in Q1. In Q3, it is projected to increase by at least 2.5% and 5% by the end of 2020. This would mean that the end of year levels would be equivalent to the pre-pandemic levels.

Based on our correlation analysis, we assign Australia mining production a score of -3.

  1. Australia Business Confidence

The National Australia Bank (NAB) surveys about 350 leading companies in Australia to establish the prevailing business conditions. Typically, the present business sentiment can be used as a leading indicator of future business activities such as hiring, spending, and investments. We can say that business confidence is a leading indicator of GDP change.

Reading above 0 shows that business conditions are improving, while below 0 shows that business conditions are worsening.

In October 2020, Australian business conditions improved to 5 from -4 in September. The October reading is the highest since August 2019. The increase was primarily driven by improvement in sentiment profitability and employment in the mining and transportation sectors.

Based on correlation with GDP, we assign a score of 8.

  1. Australia Consumer Confidence

The Melbourne Institute and Westpac Bank aggregate consumer confidence in Australia. The survey 1200 households representative of the entire households in Australia. The index is based on the five year average of these components: anticipated economic conditions, personal finances, and purchase of essential household goods. Consumer confidence is a leading indicator of consumer expenditure, which is a significant driver of the GDP.

In November 2020, the Australian consumer confidence increased to 107.7 from 105 in October. This is the highest level in 7 years, indicating that consumers are highly optimistic about the future despite the COVID-19 challenges.

Based on correlation analysis with the Australian GDP, we assign it a score of 5.

  1. Australia Government Debt to GDP

This measures the levels of indebtedness of the Australian government. Domestic and foreign lenders use this ratio to estimate the ability of the government to service its debts without straining the growth of the economy. Generally, a ratio of below 60% is considered to be ideal.

In 2019, the government debt to GDP in Australia jumped to 45.1% from 41.5% in 2018. In 2020, it is projected to reach 50%. Therefore, we assign a score of -3.

  1. Australia Retail Sales

The change in retail sales shows the trend in household expenditure on final goods and services in the economy. An increased expenditure corresponds to an increase in GDP levels.

In October 2020, the MoM retail sales increased by 1.4% compared to a 1.1% drop in September. Based on the correlation with the GDP growth rate, we assign a score of 2.

Now we know that USD has depreciated and AUD has appreciated according to their respective endogenous indicators. In the very next article, let’s see if this pair is bullish or bearish according to the exogenous indicators.

Categories
Forex Fundamental Analysis

GBP/USD Global Macro Analysis – Part 3

Introduction

The exogenous analysis will cover international aspects that impact both the UK and the US and how they influence the GBP/USD price. These factors include:

  • Good trade balance
  • Interest rate differential
  • GDP growth differential

GBP/USD Exogenous Analysis – Summary 

The score for the exogenous analysis of the GBP/USD pair is -3. This deflationary score implies that we should expect that the pair will adopt a bearish trend in the near term.

Goods trade balance

The goods trade balance is the difference between the value of goods a country imports and its exports. When the balance is negative, it means that the country is importing more than it exports. If the goods trade balance is a surplus, it means that a country’s value of exports is more than its imports.

In September 2020, the UK’s goods trade deficit increased to £9.35 billion while that of the US increased to $80.29 billion. Based on the correlation between t goods trade balance and the price of GBP/USD, we assign it an inflationary score of 2. It means if the goods trade balance keeps widening between the two countries, we can expect that the GBP/USD pair will continue being bullish.

The UK and the US Interest rate differential

This is the difference between the interest rate set by the Bank of England and the interest rate fixed by the US Federal Reserve. Capital tends to flow towards the economy with a higher interest rate since investors are bound to earn higher returns.

The BOE has set the interest rate at 0.1%, while the FED has it at 0.25%. therefore, the interest rate differential for the GBP/USD pair is 0.1% – 0.25% = -0.15%. Based on the interest rate differential, the GBP/USD pair should have a bearish trend. Therefore, we assign it a score of -3.

GDP growth differential

The actual size of the GDP varies from country to country. However, we can compare the rate at which they grow and analyse the impact of this growth rate on the exchange rate.

In the third quarter of September 2020, the UK GDP expanded by 15.5% while that of the US expanded by 33.1%. Over the years, we can observe that the US GDP growth has been at a faster rate than that of the UK. In this case, we assign a deflationary score of -2 on the UK and the US GDP growth rate differential. That means if the US economy keeps expanding at a faster rate, we can expect a bearish GBP/USD in the near term.

Our technical analysis also supports the forecasted bearish trend in the near term. Note that the GBP/USD pair has failed to breach the upper Bollinger band forming a resistance level for the past two years.

We hope you found this analysis useful and informative. Let us know if you have any questions by commenting below. All the best.

Categories
Forex Fundamental Analysis

Everything About ‘Economy Watchers Current Index’ Economic Indicator

Introduction

It has long been posited that in any economy, the first people to experience growth or contraction are those who provide basic-everyday services to the households. These service providers are considered to be “in touch” with the realities of the economy since they directly interact with their customers. While most people do not pay close attention to this index, its fluctuations could provide valuable insights into the economy.

Understanding Economy Watchers Current Index

For this analysis, we will focus on the Japanese Economy Watchers Current Index. This index attempts to measure the present economic conditions in Japan, especially from the perspective of households. From its name ‘economy watchers,’ it directly measures the mood of businesses who are in constant touch with the final consumers.

The index is compiled by surveying about 2050 employees in every sector of the economy. Here is the list of the sectors surveyed in the economy.

  • In household activity related sectors
    • Retail establishments like supermarkets and automobile sellers
    • Food and beverage establishments like restaurants
    • Services to households such as transportation, telecommunication, and leisure facility operators
    • Housing services
  • Corporate activity related sectors, including:
    • Operators in the manufacturing sectors
    • Employees and operators in the nonmanufacturing sector
    • Employees in the primary sectors like agriculture, mining, and fishing
  • Employee-related sectors such as;
    • Temporary labour placement agents
    • Job magazine editors
    • Staffing agencies
    • Professionals who understand labour market trends

In all the above sectors, the data is compiled as per the regions in which it was collected. It is to say that the survey is divided based on the area being surveyed in japan. It covers the 11 regions in Japan.

The people who are surveyed are well-placed in positions that enable them to observe first-hand the changes in economic activities. These are the questions that the survey asks.

  • How they assess the current economic conditions and detailed reasons for their answer
  • Their assessment of future economic conditions and their reasons for this assessment

The survey is conducted monthly from the 25th to the end of that month. Note that the Japanese Cabinet Office selects regional research organisations to administer these surveys. Based on the responses obtained, a ‘diffusion index’ is compiled. This diffusion index is then converted into a percentage to give the Japanese Economy Watchers Current Index. Here’s how the responses are weighted in the diffusion index.

  • Better is +1
  • Slightly better is +0.75
  • Unchanged is +0.5
  • Slightly worse is +0.25
  • Worse is 0

Using Economy Watchers Current Index in Analysis

Any value above 50 indicates that respondents are optimistic about the future, while values below 50 show that they are pessimistic. Now, note that a rise in the Economy Watchers Current Index doesn’t mean that all sectors of the economy are optimistic. It just means that majority of the sectors in the economy are optimistic.

For example, economy watchers in every other sector might be optimistic, but those in the nonmanufacturing sectors are pessimistic. This scenario means that majority of economy watchers are optimistic. Similarly, when the Economy Watchers Current Index shows pessimism about the economy, it doesn’t mean that every sector in the economy shows pessimism. Some economy watchers could be optimistic.

When the economy watchers are optimistic about the future, it means that they expect the economy to grow. Remember that these economy watchers are sampled from virtually every sector of the economy in every region of Japan. For example, let’s say that economy watchers in the manufacturing sector are optimistic about the economy.

This means that they expect the manufacturing sector to expand, which means that the output from the sector will increase. Going back to the basic knowledge of the economy, we know that suppliers and producers take their cue from consumers. Therefore, an increase in production in the manufacturing sector, or any other sector, means that consumer demand has also increased.

Let’s think of the factors that drive an increase in consumer demand. The primary factor is the increase in money supply in the economy, which is driven by easy access to cheap finance or an increase in the employment rate. Here, consumers have increased disposable income, which means that the economy is expanding.

Conversely, when the Economic Watchers Current Index is decreasing and showing increased pessimism, it could mean that the economy is contracting. Let’s use the example of household activity related sectors. When they are pessimistic, it means that they are experiencing a shortfall in demand for their goods and services. Since we have established that household demand drives these sectors, a decrease in demand could mean that households are cutting back on their expenditures.

This reduction in consumption is a direct consequence of lower disposable income in the economy. When households have reduced disposable income, they will prioritise expenditure on only the most essential goods and services. It means that consumer discretionary industries will take a hit, as will the overall economy – GDP will fall as the economy contracts.

Observe in the graphs below that the fall in the Japanese Economy Watchers Current Index corresponds to the drop in Japanese GDP in Q1 2020.

Source: Trading Economics

Source: St. Louis FRED

Impact of the Japanese Economy Watchers Current Index on the JPY

We have seen that the Economy Watchers Current Index can directly be linked to the money supply in the economy.; which means it can also be used as a leading indicator of inflation.

When the Economy Watchers Current Index is continually rising, it can be taken as a sign that there is increasingly more money supply in the economy. In this case, governments and central banks might step in to implement contractionary policies like hiking interest rates. In the forex market, this will increase the value of JPY. Conversely, when the Economy Watchers Current Index steadily drops, it might trigger expansionary policies, which will make the JPY depreciate.

Data Sources

The Cabinet Office of Japan is responsible for the survey and publication of the Japanese Economy Watchers Current Index. In-depth and historical data is also available at Trading Economics.

How the Japanese Economy Watchers Current Index Affects The Forex Price Charts

The recent publication from the Cabinet Office of Japan was on October 8, 2020, at 2.00 PM JST. The release is available at Investing.com. The publication of the Japanese Economy Watchers Current Index is expected to have a low impact on the JPY.

In September 2020, the Japanese Economy Watchers Current Index was 49.3 compared to 43.9 in August 2020.

Let’s find out how this release impacted the JPY.

AUD/JPY: Before Japanese Economy Watchers Current Index Release on 
October 8, 2020, just before 2.00 PM JST

The AUD/JPY pair was trading in a weak uptrend before the publications of the Japanese Economy Watchers Current Index. The 20-period MA was merely slightly rising with candles forming just above it.

AUD/JPY: After Japanese Economy Watchers Current Index Release on 
October 8, 2020, at 2.00 PM JST

The pair formed a 5-minute “Doji” candles immediately after the publications of the index. Since the index showed pessimism in the Japanese economy, the JPY is expected to be weaker compared to the AUD. As expected, the pair subsequently traded in a renewed uptrend with the 20-period MA steeply rising and candles forming further above it.

Bottom Line

The article has shown the importance of the Economy Watchers Current Index in the Japanese economy. More so, the significance of the index has been evidenced by the price chart analysis. Note that although the index is usually a low-impact indicator. However, its significance is observed in the current coronavirus pandemic since it can be used as a leading indicator of economic recovery.

Categories
Forex Fundamental Analysis

Does ‘Retail Sales Monitor’ (RSM) Economic Indicator Impacts The Forex Market?

Introduction

The level of demand can be said to be the primary driving factor in any economy. In the long run, the fiscal and monetary policies that are implemented by governments and central banks can be traced back to the aggregate demand within the economy. The consumption by households accounts for over 65% of the national GDP. Since retail sales account for most of the consumption by households, monitoring retail sales data can provide a useful predictor of the GDP and inflation.

Understanding Retail Sales Monitor

The Retail Sales Monitor is a precise measure of the performance in the retail sector. The RSM is measured monthly in the UK by the British Retail Consortium (BRC), whose participating members represent about 70% of the UK’s retail industry.

Source: The UK Office for National Statistics

The BRC is comprised of over 170 major retailers and thousands of independent retailers. The BRC member businesses have sales of over £180 billion and with 1.5 million employees. Since the RSM measures the change in the actual value of same-store sales in BRC-member retail outlets in the UK, the data can be used as a confident measure of the UK’s retail sector health and the broader economy.

In the UK, the retail sector is the largest employer in the private sector, which means that tracking the retail sector changes gives an overview of the economy and business cycles and insights into the labor market.

Using Retail Sales Monitor in Analysis

The RSM data couldn’t be more relevant in the current climate of Coronavirus afflicted economy and post-Brexit operating environment. Here are some of the ways this data can and is used for analysis.

In any economy, growth is driven by demand. Household purchases account for over 65% of the GDP, which makes the RSM data a vital leading indicator of economic health. When the retail sales monitor shows an increase in households’ consumption, it means that more money is circulating in the economy.

Several factors can be attributed to increased demand by households. Firstly, increased employment levels in the economy or an increase in real wages mean that the economy’s overall disposable income also increases. As a result, households can now consume more quantities of goods and services. More so, the increased disposable income tends to lead to the flourishing of discretionary consumer industries and a general rise in the aggregate demand.

An increase in aggregate supply leads to the expansion of production activities hence overall economic growth. Secondly, increased demand can be a sign of easy access to affordable funding by the households. Generally, if households and businesses have easy access to cheaper financing sources, it forebodes an increase in economic activities, which leads to economic expansion.

As an economic indicator, the retail sales monitor can be used as an authoritative leading indicator of recessions and recoveries since its data covers over 70% of the retail sector. For example, when the economy is at its peak, it is characterized by RSM’s historical highs and lower unemployment levels. When the RSM begins to drop consistently, this can be taken as a sign that the economy is undergoing a recession. The period of recession is characterized by an increase in the rate of unemployment and lower disposable income, which makes households cut back on their consumption and prioritize essential goods and services.

Source: Retail Economics

Conversely, when the economy is at its lowest during recessions or depressions, it is characterized by historical lows RSM and a higher unemployment rate. In this scenario, when the RSM begins to rise steadily, it could be taken as a sign that the economy is undergoing recovery. This period will be marked by improving labor market conditions hence increased demand that drives the RSM higher.

Using the RSM as a leading indicator of recessions and recoveries can help governments and central banks implement fiscal and monetary policies. When the RSM drops and shows signs that the economy could be headed for a recession, expansionary fiscal and monetary policies could be implemented. These policies will help to stimulate the economy and avoid depression.

On the other hand, when the RSM is continually rising at a faster rate, contractionary monetary and fiscal policies could be implemented. These policies are meant to mop up excess liquidity of the money supply and increase borrowing costs, thus avoiding an unsustainable rate of inflation and an overheating economy.

Impact on Currency

There are two main ways in which the RSM data can impact a country’s currency. By showing the economic growth and as an indicator for potential monetary and fiscal policies.

When the RSM has been steadily increasing, forex traders can anticipate that contractionary policies will be implemented to avoid unsustainable economic growth. One of such policies involves interest rate hikes, which make the currency appreciate relative to others. Conversely, expansionary monetary and fiscal policies can be anticipated in the event of a persistent drop in the RSM. Such policies include cutting interest rates, which depreciates the local currency.

The currency can be expected to be relatively stronger when the RSM is increasing. In this case, economic conditions are improving, unemployment levels are dropping, and a general improvement in households’ welfare. On the other hand, a dropping RSM is negative for the currency because it is seen as an indicator of a contracting economy and worsening labor conditions.

Sources of Data

In the UK, the RSM data is collated by the British Retail Consortium and KPMG. The data is published monthly by the British Retail Consortium.

How Retail Sales Monitor Data Release Affects Forex Price Charts

The recent publication of the retail sales monitor data was on October 12, 2020, at 11.00 PM GMT and accessed at Forex Factory.

The screengrab below from Forex Factory; as can be seen, a low impact on the GBP is expected when the RSM data is published.

In September 2020, the BRC increased by 6.1%. This change was greater than the 4.7% change recorded in August 2020 and higher than the analysts’ expectation of a 3.5% change. Theoretically, this positive RSM is expected to have a positive impact on the GBP.

Let’s see how this release impacted the GBP/USD forex charts.

EUR/USD: Before the Retail Sales Monitor Release on October 12, 2020, 
Just Before 11.00 PM GMT

Before the publication of the RSM data, the GBP/USD pair was trading in a neutral pattern. As shown by the 5-minute chart above, the 20-period MA had flattened with candles forming just around it.

EUR/USD: After the Retail Sales Monitor Release on October 12, 2020, 
at 11.00 PM GMT

The pair formed a 5-minute ‘Inverted Hammer’ candle after the RSM data publication. However, the release of the data did not have any noticeable impact on the pair. The GBP/USD pair continued trading in the previously observed neutral trend with the 20-period MA still flattened.

Bottom Line

Most forex traders tend to pay attention to the retail sales data, which is usually scheduled for ten days after the RSM publication. The retail sales data are considered to cover the entire economy hence the low-impact nature of the retail sales monitor as an indicator in the forex market.

Categories
Forex Course

182. Summary – Market Sentiment

Introduction

If you have gone through the previous courses, you already have a solid knowledge of what market sentiment is. You should also be able to create your COT index indicator to spot market trends and points of potential reversals.

To recap, here are a few things you should have in mind by now.

  • The Commitment of Traders (COT) report is the best gauge of the forex market sentiment in
  • The COT report tracks the trading activities by commercial, non-commercial, and retail traders in the futures market.
  • In the futures market positioning, the commercial and non-commercial traders are usually on opposite sides. i.e., when non-commercial traders are long, commercial traders are short.
  • A market reversal can be anticipated when the spread between commercial and non-commercial traders is the widest.
  • The ‘Chicago Mercantile Exchange’ section of ‘Current Legacy Reports’ in the COT report is best suitable for forex traders.

Let’s now conclude this segment with a few things you MUST always keep in mind.

If you haven’t noticed by now, the COT report is best suited for long term trading. If you are a shorter-term trader, you might be inconvenienced if you solely rely on the COT report for a trading signal. You see, the trends established by the COT report index take time to form. But this shouldn’t discourage you; it’s always good to know how the market is trending.

For traders who opt to use the COT report to generate trading signals, the COT report trading indicator is not foolproof. Like thousands of other indicators in the forex market, it is bound to fail at some point. So, you should conduct thorough backtesting with different timeframes to get a proper feel of how the indicator works. Note that with backtesting, you can be able to spot instances where using the COT report can generate false signals, which will help you avoid such conditions in live trading.

Well, even after you have conducted your thorough backtest, you must know that the forex market trends are not solely driven by market sentiment. Several other factors could lead to reversals in the forex market other than the COT report. In any given month, hundreds of high-impact economic indicators and geopolitical developments can significantly influence trends in the forex market. So, be sure to double-check with your economic calendar to know what else is going on in the economy.

[wp_quiz id=”94030″]
Categories
Forex Fundamental Analysis

Everything About ‘Business Investment’ Fundamental Forex Driver

Introduction

The economy is intricately woven. Although consumption accounts for about 70% of the GDP, this consumption wouldn’t be met if the supply was cut short. The point here is – all aspects of the economy are intertwined. Therefore, a change in one aspect of the economy is bound to influence the others significantly. In this article, we will see how investments by businesses influence the economy and how it impacts the forex market.

Understanding Business Investment

In the most basic sense, business investment is defined as spending money to acquire assets, start a business, or expand a business with the anticipation of making profits.

As an economic indicator, Business Investment’ represents the change in capital expenditure in the private sector. This expenditure is an inflation-adjusted value.

Source: Ernst & Young UK

In the UK, for example, business investment data is published quarterly. The data in this report is usually segregated depending on the asset type. These categories include; private sector business investment, investment in transport equipment, investment in ICT equipment and machinery, investment in buildings and structure, and investment in intellectual property products. Cultivated biological resources and the manufacture of weapons are included in the calculation. Note that the following are excluded from the calculation of the data in this report: expenditure on residential dwellings, expenditure on land and existing building, and the cost of ownership or transfer of non-produced assets.

In the calculation of the Business Investment’ in the UK, the data from the Annual Business Survey (ABS) is used to establish a benchmark on investment for various industries.

Using Business Investment in Analysis

As we mentioned earlier, business investment is part of the GDP and is also correlated with other economic aspects. The fact business investment data measures the value of the inflation-adjusted value of capital expenditure gives us a dependable ‘real’ figure of the economic activities over a specific period.

The primary effect of business investment will be on the labor market. When business investment increases, it could mean that new business ventures are being set up or the existing ones are being scaled up and expanded. In both instances, it means that more labor will be required. Remember that business investment encompasses investments made in any profit-making venture; it could be in agriculture, in the financial markets, or the informal sector. As a result, increased business investment lowers the rate of unemployment in the economy.

Furthermore, the increased production leads to the growth of output hence higher levels of GDP.

Source: Ernst & Young UK

Conversely, when business investment decreases, it could imply that economic activities are being scaled down. Scaling down operation implies that less labor will be needed. The result is an increase in unemployment levels. More so, scaling down operations implies low economic outputs hence lower levels of GDP.

Business investment goes hand in hand with the level of demand in the economy. Business investment can be said to be responding to levels of demand. Therefore, when business investment increases, it means that there is a higher demand in the economy. By itself, the increased demand means that other aspects of the economy, such as the labor market, are performing well. On the other hand, decreasing business investment means that demand is falling. Demand Reduction is synonymous to a contracting economy.

The business investment data can also be used to analyze the business cycles and, as a result, help in forecasting recessions and recoveries in the economy. Using historical data on business investment, we can establish a pattern. This pattern will show us periods when business investments were slowing down, when they were stagnating, and when they were rapidly increasing. Naturally, periods when business investments are increasing can be regarded as the expansion stage. The recession stage is characterized by a continuous fall in business investments. When business investments have stagnated, this period could be considered the peak of the business cycle.

In predicting recessions and recoveries, let’s use the example of the coronavirus pandemic. Towards the end of the first quarter of 2020, business investments dropped continuously. The continuous drop in business investment was because investors anticipated the demand in the economy to be severely depressed, especially in the consumer discretion industry. While other sectors of the economy saw some increased investments, most sectors experienced a drastic reduction in business investments. The primary goal when making any investment is to earn profits. In this instance, due to the social distancing rules, massive losses were forecasted across the economy. As a result, business investment reduced as investors looked to reduce their exposure to a contracting economy.

At the beginning of the third quarter of 2020, business investment started increasing. This period signified the beginning of economic recovery from the coronavirus-induced recession. The recovery was prompted by a host of expansionary monetary and fiscal policies implemented by governments and central banks. These policies included lowering interest rates and offering economic stimulus packages of trillions of dollars. These policies signified the revival of the economy to the private sector, hence the increase in business investment.

Impact of Business Investment on Currency

In the forex market, the level of business investment can be used to foretell the policy actions of governments and central banks.

In any economy, the private sector is the single largest employer. Therefore, when the business investment is continuously falling, it can be anticipated that the labor market conditions will worsen, and demand in the economy will be severely depressed. This scenario may trigger expansionary fiscal and monetary policies to stimulate the economy and avoid a recession. Such policies make the domestic currency depreciate relative to others.

Conversely, the currency will appreciate when business investment increases. This increase can sign that the economy is performing well with an increase in the money supply. Contractionary monetary and fiscal policies may be implemented to avoid runaway inflation and prevent the economy from overheating. These policies make the domestic currency appreciate.

Sources of Data

In the UK, the Office for National Statistics publishes the quarterly business investment data. Trading Economics has in-depth and historical data on the UK business investment. It also publishes data on global business investment.

How Business Investment Data Release Affects The Forex Price Charts?

The most recent publication of the UK’s business investment data was on September 30, 2020, at 6.00 AM GMT. The release can be accessed from Investing.com. Moderate volatility is to be expected on the GBP when the data is released.

In the second quarter of 2020, business investment in the UK decreased by 26.5%, which was better than the -31.4% expected by analysts.

Let’s see how this release impacted the EUR/GBP pair.

EUR/GBP: Before the Business Investment Data Release on September 30, 2020, 
just before 6.00 AM GMT

The EUR/GBP pair was trading in a weak uptrend before the publication of the UK business investment data. As shown in the above 15-minute chart, candles are forming just above the 20-period MA.

EUR/GBP: After the Business Investment Data Release on September 30, 2020,
at 6.00 AM GMT

The pair formed a 15-minuted bearish ‘Doji’ candle after the news release. Subsequently, the pair adopted a bearish trend.

Bottom Line

While business investment is a significant indicator in the forex market, we may not entirely know the extent of its impact on the GBP. This is because its publication is scheduled at the same time as the GDP – which is a high-impact economic indicator.

Categories
Forex Course

178. Decoding The COT Report

In the previous lesson, we learned how, where, and when you can access the Commitment of Traders report. In this lesson, we will discuss the elements contained in the COT report. The CFTC prepares four COT report types: the Legacy Report, the Supplemental Report, the Disaggregated Report, and the Traders in Financial Futures report. For forex traders, the Legacy and the Traders in Financial Futures reports are of most importance.

The Legacy Report
The Legacy report is categorized by different exchanges. Forex traders pay attention to the reports from the Chicago Mercantile Exchange. The Legacy reports have categories for only futures report and a combination of both futures’ and options report. The open interest positions that are reportable are categorized into two: non-commercial and commercial traders.
The Traders in Financial Futures (TFF) Report

This report contains financial contracts, including the US Treasuries, currencies, the VIX, and Eurodollars. Like the Legacy report, it has two categories; only futures report and a combination of both futures’ and options report. The open interest positions in the TFF report are categorized into four: leveraged funds; dealer/intermediary; asset manager/institutional; and other reportable.

Understanding Terms used in the COT Report

Open Interest: The totality of all futures and options contracts that have not yet been executed but are yet to be offset by exercise, delivery, or transaction.

Reportable Positions: these are open interests that are equal to or exceed the reporting level set by the CFTC. These positions are reported to the CFTC by foreign exchange brokers, futures commission merchants, and clearing members. The reportable positions account for about 70% to 90% of all open interests in a given market.

Nonreportable positions: are calculated by subtracting the reportable positions from the total open interests in a given market. The traders involved in nonreportable positions are unknown, as is their classification on whether they are commercial or non-commercial. These are mainly small-scale retail traders.

Commercial Traders: are traders who participate in the futures and options market to hedge their core business activities. In forex futures, commercial traders seek to offset the risks of the spot market. The CFTC has set the definition that qualifies a commercial trader under Regulation 1.3 (z). Commercial traders do not seek to take possession of the assets underlying a futures contract.

Non-commercial Traders: are also known as large speculators. These traders participate in the futures market primarily as an investment by speculating on price movements. They have no intentions of taking ownership of the underlying asset to profit from the price difference.

Changes in commitments from previous reports: shows the difference between the data in the current and the immediate previous publication of the report.

Number of Traders: show the reportable traders in each category. For each category, a trader is counted if they have an open position. The number of traders in each category can exceed the total number of traders because a single trader can have open positions in different categories.

[wp_quiz id=”89679″]
Categories
Forex Fundamental Analysis

The Impact Of The ‘US Redbook’ News Release On The Forex Market

Introduction

The growth in any economy is primarily driven by the growth of retail sales to households. For this reason, monitoring retail sales data can be the most suitable way of gauging if the economy is expanding or not. In most national retail sales data, the data is collected through surveys. However, having an index solely based on the growth of same-store sales can help provide a more accurate sense of growth in the retail industry.

Understanding US Redbook

Redbook Research Inc. is an American company primarily dealing with market research on the momentum of retail sales, macro and quantitative analysis, and consumer demand factors in public and private retail sectors. The company publishes the Johnson Redbook Retail Sales Index, also known as the US Redbook, which is considered one of the most respected proprietary indicators on retail sales in the US.

The Redbook index measures the growth in the US retail sector. The index uses a sales-weighted of the year-over-year growth in sales of the same store. About 9000 large general merchandise stores primarily operating in the US retail sector are sampled. When these sampled stores’ monetary value is measured, their combined output accounts for about 80% of the national retail sales. Note that in the US, the official government retail sales data is compiled and released by the Department of Commerce.

The Redbook index is published weekly. In this publication, the report extensively analyses and explains the current trends in retail sales and the economy. Since households’ demand is highly elastic, the weekly US Redbook publication can capture the most recent trends in consumer demand. Thus, the Johnson Redbook Retail Sales Index provides advance data on the trends in retail sales in the US.

In this report, the comprehensive analysis covers the sales in the current month, the quarterly sales, year-on-year and annual sales, company rankings, and data on historical sales. The 9000 retailers are categorized into; Apparel Specialty, Sporting Goods, Home Improvement, Home Furnishings, Books, Toy & Hobby, Department, Discount, Footwear, Furniture, Drug, Electronic, Jewellery, and Miscellaneous.

Using US Redbook in Analysis

We have already established that the US Redbook’s retail index provides a comprehensive and advance trend in household consumption patterns.

When the weekly US Redbook retail index increases, it means that households’ consumption is on the rise. At its core, higher levels of consumption are driven by increased disposable income in the economy. An increase in household consumption means that there is a general increase in demand in the economy. When households’ demand increases, it could mean that the economy’s unemployment levels have reduced. Since more people are gainfully employed, there is increased disposable income for households, hence the increase in consumption represented by the rise in the Redbook index. Similarly, it could also mean that wages received by households are increasing, which increases disposable income.

Conversely, when the weekly Redbook retail index drops, it means that households have reduced disposable income. The reduction in disposable income could directly result from increasing levels of unemployment or a reduction in wages received by households. With less disposable income, people will be forced to cut back on their consumption. In both these cases, the US Redbook retail index increase implies that the economy is expanding; conversely, a drop in the index shows that the economy is contracting.

Source: Trading Economics

The US Redbook retail index can also be used as a precursor to economic recessions and recoveries. We already know that the majority of growth in the economy is driven by consumer demand. It is estimated that household consumption accounts for up to 70% of economic growth. Now, picture this. When the consumer demand is consistently dropping, suffice to say the GDP should also be expected to drop significantly. This period will be marked by a reduction in production and increased unemployment levels. Note that recession is described as a consistent drop in GDP for two successive quarters.

Source: St. Louis FRED

At the onset of the 2020 coronavirus pandemic, the weekly US Redbook retail index continuously dropped. From the period between March to May, the index dropped steadily. This period coincided with a drop in the US GDP. Due to the nationwide imposed lockdowns and social distancing rules, unemployment surged to historic highs of 14.7%. Naturally, demand in the economy was depressed.

In times of recessions, the US Redbook retail index can be handy in changes in household consumption. Policymakers can implement several expansionary policies meant to stimulate the economy. Since the official government retail sales data is published monthly, the US Redbook can be used to show any immediate response by households. The US Redbook index can therefore be used to show if the expansionary policies are working as they are expected to. One such instance can be seen after the US government implemented the 2020 stimulus package worth $2 trillion. The US Redbook retail index can be seen to be rising from the lowest points of May 2020.

Impact of US Redbook on USD

When the US Redbook retail index increases, we can expect the USD to appreciate relative to other currencies in the Forex market. A consistently rising index implies that the economy is steadily expanding, the unemployment rate is falling, and there is a general increase in money in the economy. In such a situation, governments and central banks might step in with contractionary fiscal and monetary policies. These policies are meant to prevent the economy from overheating and avoid unsustainable inflation levels due to the increase in the money supply. Such policies make domestic currency appreciate.

Conversely, a dropping US Redbook retail index shows that the general economy might be contracting. Consequently, expansionary fiscal and monetary policies like lowering interest rates might be implemented to stimulate the economy. Such policies make the domestic depreciate relative to others.

Sources of Data

Redbook Research Inc. published the weekly, monthly, and annual US Redbook Retail Sales Index. In-depth and historical data on the US Redbook Index is available at Trading Economics.

How US Redbook Index Release Affects The Forex Price Charts

Redbook Research Inc. published Retail Sales Index the latest data on October 20, 2020, at 8.55 AM EST. The news release can be accessed at Investing.com. This release is expected to have a low impact on the USD.

The MoM index increased by 1.0% in the latest publication compared to 0.4% in the previous reading. Similarly, the YoY index showed an increase of 2.5% compared to the previous 1.2%.

Let’s find out if this release has an impact on the USD.

EUR/USD: Before US Redbook Release on October 20, 2020, just before 8.55 AM EST

Before the release of the US Redbook data, the EUR/USD pair was trading in an almost neutral trend. The 20-period MA is seen to be flattening with candles forming just around it.

EUR/USD: After US Redbook Release on October 20, 2020, at 8.55 AM EST

The EUR/USD pair formed a 5-minute bearish candle immediately after the publication of the US Redbook report. Subsequently, the pair continued trading in the earlier observed subdued uptrend.

Bottom Line

This article has established that the US Redbook report is a crucial leading indicator of retail sales and consumer demand. However, in the forex market, its significance is diminished since most traders pay close attention to the US Department of Commerce’s monthly retail sales data.

Categories
Forex Fundamental Analysis

What Is Long Government Bond Auction and What Should You Know About It?

Introduction

Every government must finance its expenditures with a mixture of debt and revenue. Through debts, governments issue a mixture of short-term and long-term debt instruments to the public. When these debt instruments are being issued, they have an interest rate, one which government will pay the debt holders until maturity. For economists and financial market analysts, the interest rate paid can be used to analyze the government’s creditworthiness and the expected rate of inflation.

Understanding Long Term Bond Auction

A bond in finance is a fixed-income asset issued by an entity to borrow money from investors. Investors get to receive a fixed interest depending on the quantity they purchase. This fixed interest, called a coupon,  is usually paid at predetermined intervals until the bond reaches maturity.

Maturity is the duration in which an investor must hold the bond before they can redeem and get their principal back. It is the bond’s maturity that determines whether it is categorized as a short-term or long-term bond.

Long-term bonds are bonds that have maturities of more than one year.

On the other hand, long bonds are bonds with the longest possible maturity that the issuer can issue. For most governments, long bonds usually have a maturity of up to 30 years.

Long bond auction refers to when bond issuers offer the sale of long bonds to the public. It is at these actions where the rate is fixed. This rate is what bondholders will receive for holding the long bonds until maturity.

Bond yield is the return an investor can expect to receive from buying a bond. The bond yield usually comes into consideration when the bond starts trading in the secondary market. We will later see how this yield can be used for analysis.

Here is a list of long government bonds for the developed economies.

  • Austria 10-year bonds
  • The US 30-year bonds
  • Dutch 10-year bonds
  • Portugal 10-year bonds
  • Spain 50-year Obligation
  • France 30-year OAT
  • UK 30-year Treasury Gilts
  • Germany 30-year Bunds
  • Italy 30-year BTPs

The rate attached to these long bonds during auctions can tell us a lot about investor sentiment of these economies.

Using Government Long Bond Auction in Analysis

The rate ascribed to the bond at auction is what bondholders will expect to receive at predetermined intervals until maturity. Comparing this rate with the rates on past auctions, we can form an opinion about the debt situation of the country and the expected rate of inflation by the investors.

For investors, buying a bond is the equivalent of owning an asset that has a predetermined future cash flow. Since it is virtually unheard of for governments to default on interest rate payments or the repayment of principal upon maturity, long government bonds can be said to be risk-free. With this in mind, the only potential risk that bondholder faces is inflation. In fact, inflation has been called the “bond’s worst enemy.”

You see, a rise in inflation means that some percentage will erode the future purchasing power of money. This erosion of the value of future cash flows means that investors must demand a higher interest rate at long bond auctions. At the back of their minds, investors envision that the rate they demand at bond auctions must also include the expected inflation rate. Effectively, higher rates on bonds help mitigate the erosion in purchasing power of their future cash flows.

Source: St. Louis FRED

At the auction, the bond buyers would feel the need to bid for higher rates if they believe that the rate of inflation will remain relatively stable. In this scenario, they can be assured that the purchasing power of their expected cash flows won’t be eroded. So, what does long bind auction tell us about inflation? The rate at an auction will increase compared to the previous auction if investors believe that future inflation will rise. Conversely, the rate at the auction will decrease when investors hold the conviction that future inflation will remain relatively stable.

The other way government long bond auction can be used for analysis is by using the bond yield. For most economists and financial analysts, the yield is the most closely monitored aspect of a bond. The reason for this is because bond yield offers broad information about a country’s debt situation. Here’s the formula for calculation the bond yield.

Let’s use some simple calculations to illustrate how this works.

Say when the bond is being issued, it has a price of $1000 with an annual coupon payment of $50. Remember that the coupon payments are fixed and cannot change; investors can expect to receive this $50 until maturity.

In this case, the bond yield is 50/1000 * 100 = 5%

Now, imagine that the economic situation of a country is worsening, and it becomes increasingly indebted. In this case, the price of the bond will decrease, let’s say to $900, which means that the yield on the bond increases to 5.56%. Conversely, if the country’s economic performance improves, the bond prices will increase, meaning that the yield will fall. In our example, if the price increased to $1050, the yield will decrease to 4.76%.

Impact of Government Long Bond Auction on Currency

Using the yield on the long government bonds published during an auction, we can determine the economic performance. Therefore, when the yield increases, it means that economic performance in the country is worsening. To forex traders, this can be taken as a deep-seated economic contraction, which will make the domestic currency depreciate relative to others. On the other hand, if the yield falls during an auction, it could be considered a sign of economic prosperity. In this case, the domestic currency will appreciate.

Sources of Data

Globally, the central banks are responsible for auctioning long government bonds. Trading Economics has an exhaustive list of global government bonds and their yields. The United States Department of the Treasury, through TreasuryDirect, publishes the data on the US bond auctions.

How Government Long Bond Auction Affects The Forex Price Charts

The recent auction of the US 30-Year Bond was on October 8, 2020, at 1.00 PM EST and accessed at Investing.com. Low volatility is expected upon the release of the auction date.

In the October 8, 2020, auction, the yield on the US 30-year bond auction was 1.578% higher than the 1.473% of the previous auction.

Let’s see if this auction impacted the USD.

EUR/USD: Before Government Long Bond Auction on October 8, 2020, 
just before 1.00 PM EST

The EUR/USD pair was trading in a steady uptrend before releasing the US 30-Year Bond Auction yield. The 20-period MA can be seen rising with candles forming above it.

EUR/USD: After Government Long Bond Auction on October 8, 2020, at 1.00 PM EST

The pair formed a 5-minute bearish “hammer” candle immediately after the publication of the US 30-year bond yield. Subsequently, the pair traded in a subdued uptrend. The release of the data had no impact on the USD.

The auction of long government bonds serves a vital role in the economy. However, as we have observed in the above analyses, their impact on the forex market is not significant.

Categories
Forex Fundamental Analysis

US Crude Oil Inventories – Understanding This Fundamental Forex Driver

Introduction

Oil is one of the most universally used commodity. Its uses span every aspect of our lives, and we can’t escape from not using it. In the US, for example, the transportation sector consumes about 68% of the total oil in the economy while industries consume 26%. Therefore, by monitoring the inventories of crude oil, we can be able to deduce the changes in economic activities.

Understanding US Crude Oil Inventories

As an economic indicator, the US crude oil inventories measure the change in the stockpile of crude oil in major oil deports in the US. The US Energy Information Administration’s (EIA) publishes the crude oil inventories report weekly. This report tracks the changes in the number of barrels of commercial crude oil that is held by US firms.

The report is called Weekly Petroleum Status Report and is published on Thursday of every week. Below is a list of items from the report.

  • The US petroleum balance sheet
  • US crude oil refinery inputs
  • The daily average of US crude oil imports
  • The daily average of US commercial crude oil inventories. These inventories exclude those held by the Strategic Petroleum Reserve
  • The daily average of the total oil products supplied over the last four-week period

Using US Crude Oil Inventories

The uses of crude oil affect our daily lives. Although there has been a conscious shift towards green energy, crude oil, and its products are very much still part of our lives. To properly understand the implications of crude oil inventories on the US economy, we need to go back to supply and demand basics. Say that a supplier stocks inventory with the knowledge that there is consistent demand.

This demand is based on historical averages, of course. Now, if the supplier starts to notice that their inventory is increasing over time, it could mean that demand for their product is decreasing. Similarly, if their inventory gets depleted faster than average, it could indicate that demand for their product has increased over time. It is the same case with the US crude oil inventories.

When the crude oil invitatories increase, it is an indicator that demand for crude oil has gone down. The two significant consumers of oil in the US are the transportation sector and in industries. Suffice to say, when there is a substantial increase in the US crude oil inventories, the demand from these two sectors can be expected to have significantly declined. Let’s think about what we can infer about the economy using this logic. In nonfarm employment, the US industries are the largest employers in the labor market.

Since crude oil is used to run industries, crude oil inventories can be used as a leading indicator of economic health. A decline in demand for crude oil could mean that the industrial sector is cutting back on production and manufacturing. Being one of the largest employers in the US, scaling down industrial operations translates to massive job losses. There will be an overall increase in unemployment in the economy. The resultant unemployment also has its ripple effects on the consumer economy. Due to the decrease in disposable income, households will only spend on essential goods and services. As a result, the consumer discretionary industry will take a hit.

This increase in the US crude oil inventories can be witnessed towards the end of the first quarter in 2020. At the onset of the coronavirus pandemic, lockdowns and social distancing guidelines halted industrial activities and traveling. The demand for US crude oil took a hit, and inventories dramatically increased.

Source: Investing.com

Conversely, a continuous decrease in the US crude oil inventories could mean that crude oil demand is increasing. Any significant increase in the demand for crude oil can be taken as an increase in economic activities in the US’s transportation and industrial sectors. An increase in crude oil demand in the transportation sector could imply that more people are buying vehicles, which is an indicator of improved household welfare. In the industries, an increase in demand for crude oil means that industrial activities are expanding. This expansion translates to increased job opportunities and lower unemployment rates.

However, note that it is more plausible that a decrease in oil inventories can be a direct result of cutbacks in oil production by drilling companies. Back to the basics of the economy, the laws of supply and demand. It is inherent for any producer to strive to obtain the highest possible price in the market. According to the laws of supply and demand, oil producers might be attempting to stabilize the oil prices by cutting back on production. When prices are falling due to a decrease in demand, crude oil producers will try to cut back on drilling to stabilize the price. After all, it doesn’t make any economic sense to oversupply the market at lower prices while operation costs remain the same. This scenario was witnessed at the beginning of the second quarter of 2020. The graph below shows the decline in oil rigs that were operational in the US at the beginning of Q2 2020.

Source: Trading Economics

Due to depressed crude oil demand, crude oil prices were on a freefall, which led to cutbacks in production, hence a significant decline in inventories. Note that this decline in the US crude oil inventories does not coincide with economic expansion.

Impact of US Crude Oil Inventories on USD

We have observed that the increase in inventories can be associated with a decline in demand for crude oil. This decline in demand can imply that operations in major crude oil dependent sectors are scaling down. These are signs of economic contractions, which will make the USD depreciate in the forex market.

Conversely, when the inventories decrease, it could mean that the demand for crude oil has increased significantly. For economic sectors that are heavily dependent on crude oil, it means that they are expanding. Since this can be an indicator of economic growth, the USD can be expected to increase in value in the forex market.

Sources of Data

The US Energy Information Administration publishes the US crude oil inventories every week. Trading Economics has in-depth and historical time series data on the US crude oil inventories.

How US Crude Oil Inventories Release Affects The Forex Price Charts

The latest publication of the US Crude Oil Inventories was on October 21, 2020, at 9.30 AM EST. This release is available at Forex Factory. When the US crude oil inventories are published, low impact is expected on the USD.

In the latest release, the US crude oil inventories decreased by 1 million barrels compared to 3.8 million barrels in the previous week. This change was more than analysts’ expectations of a 0.5 million barrels decline.

Let’s see how this release impacted the USD.

GBP/USD: Before US Crude Oil Inventories Release on October 21, 2020, 
just before 9.30 AM EST

The GBP/USD pair was trading in a steady uptrend before releasing the US crude oil inventories data. The 20-period MA is seen to be steadily rising with candles forming above it.

GBP/USD: After US Crude Oil Inventories Release on October 21, 2020, 
at 9.30 AM EST

The pair formed a 5-minute bullish candle indicating the weakness of the USD. It continued trading in the steady uptrend for a while before adopting a neutral trend.

The US crude oil inventories data is a low impact indicator in the forex market. As shown above, the release of the data had no impact on forex price action.

Categories
Forex Fundamental Analysis

What Should You Know About ‘Mortgage Market Index’ Macro Economic Indicator

Introduction

In the recent past, the real estate market has been a critical indicator of economic performance. As with any other aspect of the financial market that intertwines with consumer demand, the significance of the mortgage market cannot be overstated. Knowing if mortgage applications have increased or reduced can tell a lot about the demand in the housing market and households’ welfare. This index can be a leading indicator of demand in the economy.

Understanding the Mortgage Market Index

Primarily, the mortgage market index tracks the number of mortgage applications over a specific period. In the US, for example, the mortgage market index is compiled by the US Mortgage Bankers Association (MBA). The MBA mortgage market index is released weekly. MBA has an association of about 2200 members encompassing the entire real estate financing industry. The companies included in the association are deal originators, compliance officers, deal underwriters, servicers, and information technology personnel. These companies are active in residential, multi-family, and commercial real estate.

Owing to its vast network of real estate companies across the country, MBA is in the best position to provide comprehensive coverage of the mortgage applications made. The published data shows both seasonally adjusted and unadjusted changes in the US’s number of mortgage applications. Furthermore, the report also includes the Refinance Index,  which shows the number of applications made by households wishing to refinance their mortgages. The report also includes seasonally adjusted and unadjusted ‘Purchase Index,’ which shows the number of outright purchases in the real estate sector during that week.

Furthermore, this weekly report analyses the change in the Adjustable-Rate Mortgage (ARM) applications. As the name suggests, the ARM is a mortgage in which the interest rate payable on the balance varies throughout its life. The number of the Federal Housing Administration (FHA) loans are also included in the report. It further analyses the average contract interest rate for 30-year fixed-rate mortgages with Jumbo loan balances and conforming loan balances. Jumbo loan balances are those above $510,400 while conforming loan balances are less than this amount. Finally, the MBA mortgage market weekly report analyses the change in the average contract interest rate for 15-year fixed-rate mortgages.

Using the Mortgage Market Index in Analysis

The change in the number of mortgages in an economy tells a lot about the prevailing economic conditions. These conditions range from demand in real estate to prevailing monetary policies. Both of these aspects are integral in the growth of an economy.

When the mortgage market index is rising, it means that the number of mortgage applications has increased. The increase in mortgage applications could imply that there is a growing demand for real estate. One thing you have to know, when people decide to invest in the housing market, it normally means that they have increased disposable income and have thus fulfilled all other intermediate needs.

An increase in disposable income in the economy means that more people are gainfully employed or that wages have increased. In both these circumstances, we can deduce that the economy is expanding. The reason for this deduction is because when demand in the real estate market expands, it means that demand in the consumer discretionary industry has also increased. Thus, the output in the economy is higher.

More so, when the mortgage market index rises, it could mean that households and investors in the economy have access to cheap finance. Either they are creditworthiness has improved, or the market interest rates are lower. When the interest rate is lower in the market, it is usually due to the central banks’ expansionary monetary policy.

Such expansionary policies are adopted when the central banks aim to stimulate the growth of the economy. It means that people have access to cheap money and can borrow more. When there is a growing money supply in the economy, households can increase their consumption, and investors can scale up their operations. Overall, the economy will experience an increase in output, thus in the GDP.

Furthermore, it could also mean that households who previously could not afford to service a mortgage can now be able to afford mortgages due to low-interest rates. This scenario played out towards the end of the first quarter of 2020 when the US Federal Reserve made a series of interest rate cuts. The MBA mortgage market index is seen to have hiked. This hike can be taken as a sign that households and investors were taking advantage of the expansionary policies by increasing their holding in the real estate sector.

Source: Investing.com

On the other hand, a drop in the MBA mortgage index means that the demand for demand in the housing market is waning. The decrease in demand could be synonymous with an overall contraction of demand in the economy. The contraction of aggregate demand can be taken as a sign that the overall economy is also contracting. Similarly, it can also be taken as a sign that the public has lost confidence in the housing market as during the 2007 – 2008 housing market crash.

Source: Investing.com

Impact of the Mortgage Market Index on Currency

In theory, the domestic currency should be susceptible to fluctuations in the mortgage market index.

When the index increases, it can be taken as a sign that there is an increased money supply in the economy. Under such circumstances, contractionary monetary and fiscal policies might be implemented, such as hiking the interest rates. When such policies are adopted, the domestic currency tends to increase in value compared to other currencies in the forex market.

Conversely, when the index is continually dropping, it can be taken as an indicator of overall economic contraction. In this instance, expansionary policies might be implemented, like lowering interest rates to encourage consumption and prevent the economy from slipping into a recession. These policies make domestic currency depreciate.

Sources of Data

In the US, the mortgage market index is compiled and published weekly by the Mortgage Bankers Association. A historical time series of the data is available at Investing.com.

How the US Mortgage Market Index Affects The Forex Price Charts

The latest publication by the MBA was on October 21, 2020, at 7.00 AM EST. As seen in the screengrab below, a low impact on the USD is expected when the index is published.

For the one week to October 21, 2020, the mortgage market index was 794.2 compared to 798.9 in the previous publication.

Let’s see how this publication impacted the USD.

GBP/USD: Before US Mortgage Market Index Release on October 21, 2020, 
just before 7.00 AM EST

Before the publication of the US Mortgage Market Index, the EUR/USD pair was trading in a weak uptrend. In the above 5-minute chart, the 20-period MA is almost flattened with candles forming slightly above it.

GBP/USD: After US Mortgage Market Index Release on October 21, 2020, 
at 7.00 AM EST

The pair formed a 5-minute bearish candle after the release of the index. It later traded in a neutral trend as the 20-period MA flattened, and candles formed around it.

Bottom Line

This article has shown that the US MBA Mortgage Market Index plays an essential role as an indicator of demand in the housing market. But as shown by the above analyses, this economic indicator has no significant impact on price action in the forex market.

Categories
Forex Videos

Forex Fundamental Analysis For Novices – New Zealand Visitor Arrivals!

Fundamental analysis for novices: New Zealand visitor arrivals

In this session, we will be looking at fundamental analysis for novices and taking a look at the New Zealand visitor arrivals’ economic data release and how it might impact the New Zealand dollar.
If this is the first time you have seen one of our fundamental analysis or novices videos, we place a great deal of emphasis on the importance of regularly studying an economic calendar for the release, by governments and agencies, of economic statistics, which paint a picture of the health of an economy.

These economic data releases happened weekly, monthly, quarterly, or annually with regard to statistics, but also so provide important information for upcoming events such as key policymaker speeches, upcoming interest rate decisions, and other significant future events which may cause shifts in exchange rates for the various currency pairs.

Obviously, if you are trading a currency pair and are unaware of such key market-moving data releases, it might adversely affect the trade you are in, causing losses.
All professional traders keep a close eye on their economic calendar because it is another tool in their arsenal to help them make the right call when trading.

This is a typical economic calendar. Most reliable brokers will offer this free of charge on their Website.

Typically they will have a filter section so that you can look at past or future economic events or adjust to the various types of impact that events might have, such as low medium or high impact, and the various categories including events such as holidays 0 filtering out events such as holidays auctions bond auctions inflation, or interest rate data.

The critical components of an economic calendar are the day and date, the type of event, the time of the event, the country, the likely impact that that data release will have on a currency pertaining to that country, which might be low impact, medium or high, and where the higher the impact level, the more likely you will see volatility around that currency, post-release.
As we can see here, the information relating to the event is populated on the calendar just underneath the titles section.


The economic events we are interested in this session is the New Zealand visitor arrivals, the data of which will be released at 22:45 British summer time for the month of August, where the impact level is low, and where we can see that the previous release was – 98.5% and a consensus is – 114.9%. The consensus is put together by leading economists. Here we can see that they have a gloomy outlook for visitor arrivals for September and where the consensus is that the figure will be worse than the previous month year-on-year basis.

The visitor arrivals data is collated and released by Statistics New Zealand, which is the official data agency, and it shows how many people visited New Zealand. This is significant because tourism is a key part of the country’s gross domestic product, and they are heavily reliant on visitors, which is therefore important for the health of the economy.

This graph from 2010 to 2020 by the SNZ shows a steady number of visitors over the years until the pandemic hit and where New Zealand closed its borders to tourism in order to protect itself from the disease.

In this graph of the New Zealand dollar to the US dollar, we can see that in the middle of March, at the peak of the pandemic, the currency pair hit a low of 0.57 before bouncing back to its current levels of 0.6670, proving that although the economy is suffering from a lack of visitors, confidence is returning to the New Zealand dollar, because of the way the government has handled the economic fallout, but this also factors in a weakening US dollar, which has not been faring so well, and where the USA is still pretty much in the grip of the pandemic.
Upon release, a better than expected reading, i.e., more visitors, would typically be seen as positive for the New Zealand economy, and therefore the New Zealand dollar would move higher against the United States dollar and perhaps other pairs it is trading against, while a low reading would be negative for the New Zealand economy, in which case we might expect to see the New Zealand dollar falling against those counter currencies.

However, as previously mentioned, the New Zealand dollar is proving extremely resilient at the moment, and where we might consider that traders are confident in the government’s handling of the crisis, where the infection rate is extremely low, and where the long-term view is favorable for the New Zealand economy.

Categories
Forex Fundamental Analysis

Foreign Securities Purchases Impact on Forex Currencies

Introduction

For the longest time, the performance of a country’s financial and capital markets has been touted as an indicator of economic health. On the other hand, foreign investors’ participation in the local financial and capital market can be taken as a sign of confidence in the local economy. Therefore, monitoring foreign securities purchases can be used as a gauge of investors’ confidence in the local economy.

Understanding Foreign Securities Purchases

Foreign securities purchases measure the involvement of foreigners in the domestic financial and capital markets. It includes the value of local bonds, stocks, and money-market assets bought by foreigners over a particular period.

The financial market is considered the backbone of any economy. Every sector of the economy is interconnected with the financial market, not just by transactions. Companies, businesses, and governments use the financial and capital markets as a source of funds. Through IPOs, companies can raise funds that will be used for business expansions. Governments issue bonds and treasury bills in the money markets, which are used to fund government expenditures. In the secondary markets, however, these financial assets’ prices tend to reflect investors’ sentiments.

Therefore, foreign investors’ level of participation in the local financial markets can be used as a leading indicator of economic sentiment.

Using Foreign Securities Purchases in Analysis

Primarily, the data of foreign securities purchases shows foreign interest in the domestic economy. This data has various applications to government agencies, investors, and even forex traders.

The stock and money markets are driven by sentiment. The basics of how the financial market works is that; you buy a financial asset when prices are low and sell when prices are high. For example, in the stock markets, the price of a company’s stock is tied to its financial performance. So, when its performance is well, the share price will rise, and when the performance is deteriorating, the share price will fall. Another critical factor that drives the fluctuation in share price is a sentiment about the company’s performance.

When traders anticipate that the company will have a windfall – either increased demand for its core products or the launch of a new product line – the share price will rise. The rise in the share price is driven by the fundamental laws of demand and supply. The price will rise when there is an increased demand from investors to buy the shares, which means that those buying exceed the number of those selling. The price will fall when investors are selling the shares, which increases its supply relative to those demanding to purchase it.

Using this aspect of the stock markets, when foreign investors flood the domestic market to purchase shares, it means that they anticipate that the companies will perform better soon. As we have explained, a better financial performance by a company could result from increased demand for its products or expansion in business operations.

Since the stock market is forward-looking, increased buying activity can be interpreted as a vote of confidence that economic conditions are going to improve. Let’s take the example of the S&P 500. On October 19, 2020, the index closed just above 3400 from lows of 2237 on March 23, 2020, at the height of the Coronavirus pandemic.

Therefore, a rebound in the stock markets can be taken as a sign that investor confidence is increasing and improving economic conditions.

Source: St. Louis FRED

However, note that there is a disconnect between the GDP and the performance of the stock market. Most people tend to make the mistake of assuming that the growth of the stock market is synonymous to an increase in the GDP. While this might be true in some cases, it is purely coincidental, because the stock market is only one component of the economy. While the economy’s growth tends to encompass all aspects ranging from the growth of the labor market to household consumption, the stock market is majorly a reflection of corporate profits. For example, while the S&P 500 recovered from March to October 2020, the GDP was on a steady fall.

Source: St. Louis FRED

The other way foreign securities purchases can be used for analysis is through the purchases in the money markets, especially government bonds and treasury bills. When foreigners swam the domestic market to purchase government securities, it can be taken as a sign that the domestic economy is offering better returns compared to other international economies.

Furthermore, increased foreigner participation in the domestic money markets can be taken as a sign that the local economy is regarded as a safe heaven. It is a vote of confidence that the domestic economy is stable and comparatively less volatile, which means that their investments will receive a steady return and no chances of an outright loss of capital.

Impact on Currency

As a leading indicator of economic sentiment, foreign securities purchase data can show what investors think about economic recoveries. When the foreign securities purchases increase in times of economic recessions or slump, it can be taken as a vote of confidence by the investors that the economy will rebound in the near term. The logic behind this is that no one would want to invest in an economy bound to fall or one that has no signs of recovery. In such an instance, the currency will appreciate.

Similarly, the local currency will appreciate relative to others since an increase in foreign securities purchases implies that the domestic economy offers better returns. These higher returns could be a direct result of higher interest rates. Higher interest rates mean that the local currency will appreciate.

Conversely, when the foreign securities purchases data is on a decline, it shows that investors are fleeing the domestic economy. They can either get better returns on investment in other economies or believe that the local economy is headed for rough times. In this case, the local currency will depreciate relative to others.

Sources of Data

Statistics Canada collates and publishes foreign securities purchases data in Canada. The data published is of the prior two months. A more in-depth and historical review of the foreign securities purchases in Canada is available at Trading Economics.

How Foreign Securities Purchases Data Release Affects Forex Price Charts

For this analysis, we will focus on the August 17, 2020, release of the foreign securities purchases data at 8.30 AM EST. The data can be accessed from Investing.com. Moderate volatility is expected when the data is released.

In June 2020, Canada’s net foreign securities purchases were -13.52 billion compared to 22.39 billion in May 2020.

Let’s see what impact this release had on the CAD.

GBP/CAD: Before Foreign Securities Purchases Release on October 17, 2020, 
Just Before 8.30 AM EST

From the above 5-minute GBP/CAD chart, the pair was trading in a steady downtrend before the release of the data. The 20-period MA was steeply falling with candles forming further below it. This trend shows that the CAD was strong during this period.

GBP/CAD: After Foreign Securities Purchases Release on October 17, 2020, 
at 8.30 AM EST

The pair formed a long 5-minute candle upon the release of the data. As expected, the negative net foreign securities purchases in Canada resulted in the weakening of the CAD. Subsequently, the pair traded adopted a subdued uptrend with the 20-period MA slightly rising and candles forming just above it.

Bottom Line

The foreign securities purchases data is a moderate-impact economic indicator. Since it only serves to show investor confidence in the economy, it does not result in high volatility when released. Cheers!

Categories
Forex Fundamental Analysis

The ‘Sentix Investor Confidence’: Revealing Market Sentiment

Introduction

The economy, financial, and forex markets are mainly driven by sentiment. Abstract aspects of demand and supply primarily drive these markets. A financial asset’s value will appreciate if a majority of investors believe that its future cash flows will increase. Conversely, the value of the asset will lower if these investors have a negative outlook on it. Therefore, knowing how most investors feel about the outlook of the economy can help you plan your future investments properly.

Understanding Sentix Investor Confidence

Investor confidence indexes are usually estimated by conducting surveys on investors and analysts throughout the economy.

In the EU, for example, the investors’ confidence is gauged using the ‘EU Sentix Investor Confidence’ index. Sentix is a German marketing and research firm predominantly dealing with behavioral finance. This index is compiled through a survey of about 2800 investors and analysts from across the 17-EU member countries. The primary role of the index is to obtain the confidence of the business people about the current economic climate and their anticipation about the future economy.

Sentix Investor Confidence Methodology

The Euro area Sentix economic report is categorized into the current situation and Expectations.

Current situation: This part of the report polls how the investors and analysts feel about the prevailing economic conditions. Ongoing geopolitical aspects inform the current economic conditions to the prevailing market conditions.

Source: Sentix

Expectations: As the name suggests, this part of the report concerns the future. Investors and analysts are polled to see what they think the future economic conditions will be. Do they expect the current conditions to improve, remain the same or deteriorate?

Both these parts of the report accommodate various economic indicators about the economy. The investors and analysts are asked their sentiments on various aspects of the economy, from the ease of doing business, labor conditions, interest rates to geopolitics.

As mentioned, Sentix surveys up to 2800 people who are mostly employees and investors in the private sector. The survey is conducted to ensure inclusivity of all economic sectors, thus obtaining a representative perspective about the state of the economy.

The results from the questionnaires are collated and indexed on a scale of -100 to 100. Readings of below 0 indicate that investors and analysts are pessimistic about the economy, with the severity of their pessimism increasing as the index approaches -100. On the other hand, a reading of above 0 shows optimism. The higher the index, the more optimistic the investors are about the economy.

Source: Sentix

Using Sentix Investor Confidence for Analysis

Keep in mind that the polled people for this index are experts – presumably authoritative in their various fields. Therefore, by following

Sentix

level of confidence in the economy can be incredibly helpful in making predictions about the economy at large.

Investments, in any economy, forms a major part of economic growth. When investors have a positive outlook about the economy, current, and future, we can expect them to make more investments in various sectors of the economy. Naturally, these investments create more jobs in the economy, increasing economic output, improving households’ welfare, and growing the GDP.

On the other hand, when the investors hold a negative outlook about the economy, they will halt any further investment plans. Some may go as far as cutting back on their investments. In this scenario, the industries in which they have invested in will be forced to scale down their operations. Consequently, the economy can expect a higher unemployment rate, depressed demand in the economy, reduced output, and a general contraction in the GDP.

Note that the current and the expectations of investor confidence aren’t always aligned. Policymakers can use this knowledge to make informed decisions on monetary and fiscal policies. When investors are confident about the current economic conditions but pessimists about the future, theoretically, governments and central banks could implement expansionary policies. Such policies will stimulate the economy and prevent any job losses, or adverse contractions of the economy in case investors shy away from further investing.

Furthermore, Sentix investor confidence is a vital indicator of recessions and recoveries. Let’s take the example of the ongoing coronavirus-induced recession. Towards the end of the first quarter of the year, investors were pessimistic about the future. They anticipated that the ravaging effects of the coronavirus would severely affect the economy. And true, as anticipated, the economy was ravaged. New investments during the months following the outbreak were at historic lows, and the unemployment levels globally were the highest ever witnessed. The Sentix investor confidence forestalls the current recession.

Similarly, the Sentix investor confidence index can be used to show signs of economic recoveries. Let’s still consider the example of the recent coronavirus pandemic; the Sentix investor confidence has been accurately used to show economic recovery signs. After governments and the European Central Bank (ECB) put in place economic expansionary measures, the Sentix investor confidence became less and less pessimistic. This showed that investors anticipated that the economy would recover.

Source: Sentix

Impact of Sentix Investor Confidence on Currency

As we mentioned earlier, sentiment is one of the major drivers of currency fluctuations. When the investor confidence is highly optimistic or improving from extreme pessimism, the domestic currency will appreciate. This appreciation is because investor confidence signals improvement in the economic condition, followed by lower unemployment levels, better living standards, and higher GDP levels.

Conversely, dropping levels in the Sentix investor confidence leads to the depreciation of the domestic currency relative to others. The depreciation is because forex traders will anticipate that adverse economic conditions will follow.

Sources of Data

Sentix conducts the surveys and publishes the Sentix Investor Confidence index for the Euro area.

How Sentix Investor Confidence Index Release Affects The Forex Price Charts

Sentix released the latest EU investor confidence index on October 5, 2020, at 8.30 AM GMT. The release of the index can be accessed at Investing.com. Since the investor confidence index is a low-impact indicator, low volatility is expected on the EUR.

In October 2020, the Sentix Investor Confidence index was -8.3 compared to -8.0 in September 2020. However, the October reading was better than the expected  -9.5.

Let’s find out how the October 2020 Sentix Investor Confidence index’s release impacted the ERU/USD price action.

EUR/USD: Before the Sentix Investor Confidence Index Release on October 5, 2020, 
just before 8.30 AM GMT

Before the release of the Sentix Investor Confidence Index, the EUR/USD pair was trading in a steady uptrend. The above 5-minute chart shows candles crossing above the 20-period MA and forming further above it.

EUR/USD: After the Sentix Investor Confidence Index Release on October 5, 2020, 
at 8.30 AM GMT 

After the release of the index, the EUR/USD pair formed a 5-minute bearish candle. However, the pair subsequently adopted a strong uptrend. The 20-period MA rose steeply with candles forming further above it. This trend shows that the EUR became stronger after the release.

Bottom Line

In the forex market, the Sentix Investor Confidence index is a low-impact indicator. In the current economic climate, however, this index can prove invaluable in predicting the directions of the economy – to show whether the Euro area economy is bouncing back from the effects of the coronavirus pandemic.

Categories
Forex Videos

Forex Fundamental Analysis For Novices – How To Trade Mortgage approvals!


Fundamental analysis for novices: Mortgage approvals


Thank you for joining this Forex academy educational video for novices. In this series, we will be looking at economic data releases by governments around the world, but specifically focusing on Western democracies and whereby this data acts as a barometer of the health of a country’s economy. In this session, we will be looking at mortgage approvals and focusing specifically on the United Kingdom.

If you are new to trading, one of the main reasons that new traders fail is because they are unaware of economic data releases, where governments release information in the form of statistics, which market analysts and traders use to value the health of a country’s economy. Such data causes various levels of impact on the financial markets, which is typically low, medium, or high, and where high impact data can cause a currency pair’s exchange rate to stop in its tracks and reverse, which is often detrimental to a trend and therefore may cause losses. By using an economic calendar, which is offered by most brokers, you will learn to use the data releases to your advantage and know when to trade and when to avoid the markets, especially at such time as high impact data is being released.

The critical components of an economic calendar are the time of the release, the type of event, the day and date, the likely impact that such data will have on the market, which is measured in 3 values, low medium, and high. The actual data will be populated on to the calendar very shortly after the data release and is typically subject to an embargo. The consensus, which is a value of the expected data release, is usually fairly accurate as put together by economists and analysts. And the previous data release which should also be used in conjunction with the consensus as a gauge. The larger the deviation between the actual release and that of the consensus will likely cause more volatility in the market, depending on the expected impact level.

Here we can see that’s on Tuesday the 1st of September 2020 at 9:30 AM BST, Great Britain will release data statistics for mortgage approvals for July, where the impact level is low, and where the consensus is 33.9 k and where the information that was released for June came in at 40.01 k. The data will be simultaneously released with market manufacturing PMI, net lending to individuals and consumer credit, plus M4 money supply.
Therefore, this information will be looked at holistically by traders, and because the manufacturing PMI is a medium impact, potentially there is room for greater volatility than just the information pertaining to mortgage approvals.

Mortgage approval statistics are released by the Bank of England each month and show the number of mortgages approved for July. This acts as a leading indicator for the housing market within the United Kingdom. Higher mortgage approvals mean that the economy is healthier and recovering from the pandemic. The higher the reading, the more positive for the pound, while a low reading is negative and shows that people are not confident with the economy and are therefore not buying homes. As such, this is bad for the pound and could see weakening against other currencies. As mentioned, always look at the whole basket of data releases rather than one single component.

Categories
Forex Fundamental Analysis

Importance Of ‘Existing Home Sales’ Forex Fundamental Indicator

Introduction

In any economy, the real estate market provides insights about households’ sentiment of the future and their present welfare. Policymakers, central bankers, businesses, economic analysts, and individual consumers track real estate data. They do so, to deduce, in one form or another, information about the state of the economy. The Existing Home Sales figure is estimated to account for up to 90% of total home sales. For forex traders, existing-home sales data provides an invaluable insight into the economy.

Understanding Existing Home Sales

Existing homes are homes owned and occupied before being listed in the market. Therefore, existing home sales as an economic indicator show the data on the sale of homes pre-owned and pre-occupied before being listed in the market.

Existing home sales data captures the prices and sales volume of existing homes in a country. It is worth noting that the existing home sales data strictly records transactions that have been completed. This record is unlike the new home sales, which includes data on partial payments and agreements of sale.

Calculating Existing Home Sales

Each month, a survey is done to determine the volume of existing-home sales and their prices. In the US, for example, a survey is done by selecting a nationally representative sample of 160 Boards and Multiple Listing Services. This sample represents about 40% of the total existing-home sales.

A non-seasonally adjusted data on existing home sales is derived by aggregating the raw data from the sample. The aggregated data is then weighted to represent the national existing home sales accurately.

A seasonally adjusted existing home sales data is arrived at by annualizing. This adjustment helps to smoothen out the disparities that arise due to seasons. Here’s how the disparity comes along. Research has shown that home resales are higher during spring and summer and slows down during winter. Therefore, from November to February, the resale of homes is lower. Typically, it is assumed that people tend to search for homes when the weather conditions are more agreeable, thus increasing demand and, with it, prices of homes. This seasonal difference is removed with annualizing, creating a more realistic trend in the existing home sales.

Note that the annualized existing home sales for a particular month show the resales the month represents if the resale pace for that month were to be maintained for 12 consecutive months.

Using Existing Home Sales in Analysis

As an economic indicator, existing home sales are regarded as a lagging indicator. However, since the data shows the changes in the number of home resales and the prices, it can provide invaluable insight into the trend of households’ welfare and the general economic health.

Most of the transactions in real estate involve mortgages. Let’s take an example of an increase in existing home sales shows that more households can afford and service mortgages. This increase could be for a number of reasons.

Source: St. Louis FRED

Firstly, it could show that the welfare of the households has improved. The improvement could result from an increase in disposable income or an increase in the rate of employment. Increasing disposable income means that households have more money to invest in the real estate market, whether speculatively or not. An increase in the employment levels, on the other hand, means that households who previously could not afford to buy a home are now eligible for mortgages. I both these instances, the existing home sales data shows that the economy is expanding and the welfare of households is improved.

Secondly, increasing home sales imply that interest rates are low, allowing more households to borrow cheaply. The availability of lower interest rates shows that the demand in the economy is bound to increase, which leads to economic growth.

Thirdly, since existing home sales involve the current homeowners selling their property, it means that they believe they can get better rates in the current market. This is especially true for speculative investors who participate in real estate to profit from price fluctuations over time. Now, a speculative homeowner buys a home at a lower price to resell when prices are higher. An increase in the price of homes means the economy is currently performing better than it previously did. Thus, an increase in the existing home sales shows economic improvement.

Similarly, current speculating home buyers offer the sentiment that they believe the economy is going to perform better in the near term. Therefore, existing-home sales data can be used to show periods of economic recoveries and forestall an impending recession.

Source: St. Louis FRED

Impact on Currency

As we have seen, existing home sales can be used to gauge how the economy is performing. Although it is lagging, it can be used as a leading indicator for the aggregate demand in the economy as well as the general economic health. Let’s see how this analysis affects the forex market.

An increase in the existing home sales shows that the economy has been performing well. It also indicates that households’ welfare is improving, with higher employment levels and increased disposable income, which can further influence the growth of the economy. Similarly, since an increase in the existing home sales offers the sentiment of a perceived economic improvement, it translates to the increasing value of the country’s currency.

Conversely, a country’s currency will depreciate as the existing home sales reduce. Continually dropping existing home sales imply worsening economic conditions for the households. These adverse conditions could result from increasing unemployment levels, higher income taxes, or general anticipation of challenging economic conditions that force households to cut back on discretionary expenditures.

Sources of Data

The National Association of Realtors is responsible for the survey and the publication of the US existing home sales data. An in-depth and historical review of the existing home sales data, both seasonally and non-seasonally adjusted, is published by St. Louis FRED. Trading Economics publishes global existing home sales data.

How the Monthly Existing Home Sales Data Release Affects Forex Price Charts

The most recent existing-home sales data in the US was released on September 22, 2020, at 10.00 AM ET and can be accessed at Forex Factory.

The screengrab below is of the monthly existing home sales from Forex Factory. To the right is a legend that indicates the level of impact the fundamental indicator has on the USD.

As can be seen, this is a low-impact indicator.

In August 2020, existing home sales were 6m compared to 5.86m in July. The sales were lower than analysts’ expectations of 6.05m.

Now, let’s see how this release made an impact on the Forex price charts.

EUR/USD: Before Existing Home Sales Release on September 22, 2020, 
Just Before 10.00 AM ET

The pair was trading in a new-found steady downtrend. This trend can be seen with the 20-period MA steeply falling with candles forming further below it.

EUR/USD: After Existing Home Sales Release on September 22, 2020, at 10.00 AM ET

After the news release, the pair formed a 5-minute ‘Doji’ candle. Subsequently, the pair continued to trade in the earlier observed downtrend.

Bottom Line

As expected, the existing home sales release had a negligible effect on the EUR/USD pair. Therefore, we conclude that in the forex market, existing-home sales data is a negligible indicator.

Categories
Forex Videos

Forex Fundamental analysis for novices – Dallas Fed Manufacturing Index!

Fundamental analysis for novices: Dallas Fed Manufacturing Index


Thank you for joining this forex academy educational video. In this session, we will be looking at fundamental analysis for novices and discussing the Dallas fed manufacturing index.

Most brokers offer an economic calendar where you will see economic data release events that fall due daily, weekly, or even monthly.
It is critical that you know when these events are going to occur because many of them cause extreme volatility in the market and may affect any open trades or trades that you are about to take, while not realising that an event is about to happen and where these events might reverse price action, to your trading detriment. Professional traders plan around such events, and you should do the same so that you understand what is going on in the marketplace at all times.

The key components of an economic calendar are the day and the date, the time, the type of event, the impact, which is a barometer of the likelihood of the event causing volatility and which is normally low, medium, or high, and which is measured on this calendar with the strength indicator filling the box, the more likely volatility will occur, and where the high volatility impact releases will typically fill the box in solid red.
Also, the actual data box will be populated very quickly after the embargo announcements, and you can also see a general consensus of what the market believes the data is likely to be as compiled by market analysts and economists. And you will also see the previous data, whether that is for the previous week, month, quarter, or year.


Here we have scrolled forward to Monday the 31st of August, and we can see that at 3:30 BST, the Dallas Fed manufacturing business index for August was due to be released and where the impact value is low, there is no consensus available, and the previous figure was -3.
The United States Dallas fed manufacturing index pertains to the state of Texas, which is the second-largest state in America, with a gross state product of nearly 2 trillion$. Many of the top fortune 500 companies are domiciled in the state of Texas.

The index itself measures the performance of manufacturing in Texas, where the information is taken from around 100 businesses and is based on output orders, and prices, and employment within Texas. Therefore, it is an important indicator of the economic health of one of the largest states in America.

Although no the economic calendar impact box shows this as being low for potentially causing market volatility, the American economy is in a precarious position with the covid virus still highly prevalent across all states, and where the American economy is struggling to regain anywhere near the levels, it reached before the pandemic started.

Therefore, traders should be mindful that any information regarding economic activity in any of the States is likely to cause volatility. Traders will be looking for a figure better than –3, which would be considered to be strong for the United States dollar, which might firm, and if the number is worse than –3, it will be bad for the economy and where you might find the American dollar loses ground against the other major currency pairs.

Categories
Forex Videos

Forex Fundamental analysis for novices HICP!

Fundamental analysis for novices: HICP

Thank you for joining this forex academy educational video for novices. In this session, we will be looking at fundamental analysis for novices, and we will be discussing h I c p.

If you are new to trading, you will need to have access to an economic calendar, such as the one shown here, where governments around the world release economic statistics, usually weekly, monthly, quarterly, or annually, and whereby the financial markets look at these statistics in order to try and gauge the strength or weakness of an economy based on the release of this information. Such data releases can cause the relating currency of that country to stay the same or gain in strength, or lose value against other currencies. Therefore, it is vitally important that you understand how economic calendars can help your trading.

The most important aspects of an economic calendar are the time of the release, the type of event, the day and the date, the impact level likely to be received by the market, which is usually low, medium, or high, the actual data, which is usually subject to an embargo and will be populated on the calendar usually just a few moments after its release. The consensus, or what the market thinks that information is going to be based on forecasts formed by economic and financial analysts, and the previous data, whether that be weekly or monthly, etc.

Here we can see on the economic calendar for Monday the 31st of August 2020 at 8 a.m. BST that Spain will be releasing their harmonized index of consumer prices or h I c p data and simultaneously releasing consumer price index information for both month on month and year on year, and these are all preliminary readings.
Spain has the 13th largest economy by gross domestic product in the world, and because it is part of Europe, it is measured as the 6 largest EU member in Europe. The harmonized data is a component of the overall data for the eurozone. Therefore, because Spain is a relatively smaller component of the overall picture for the eurozone index of consumer prices, it has a low impact upon its release. The statistics are weighted and are used as a way of measuring inflation and price stability across the eurozone. Inflation is tightly monitored by the European Central Bank, which will have a benchmark target of around 2%, which is fairly typical for Western economies, although the United States has raised that bar slightly due to the ongoing pandemic and the devastating effect it is having in America at the moment.

Typically, a high reading is positive for the euro, and a low reading is negative. However, all economic data is taken very seriously due to the fallout from the pandemic, but economists and therefore the consensus reading is usually fairly accurate with the smaller member states, which typically means there are fewer shocks and again because Spain is a smaller member of Europe, it is unlikely to cause market volatility upon its release. Nonetheless, one should always be guarded, just in case.


Categories
Forex Videos

Forex Fundamental Analysis for Novices – US Construction spending!


Fundamental Analysis for Novices US Construction spending

Thank you for joining this fundamental analysis for novices’ educational video. In this session, we will be looking at construction spending data releases and, in particular, within the United States.


If this is the first time you have viewed one of our fundamental analysis videos for novices, please make sure you search for the many other videos in this series which will help you understand the importance of such data releases when they hit the market and which are usually subject to an embargo.
You should refer to your economic calendar every single day and make sure you plot your trades around these risk events.

The most important sections of an economic calendar of the time of day and date of the release the type of event. For example, here we can see that the first one on the list is the right move house price index month on month for August for Great Britain, which was due for release at 00:01 on Monday, August 17th, where the impact was low.

Most economic calendars will provide you with the likely volatility impact of such news releases, and these will typically be released as low, medium, or high impact. Here we can see that the strength of the impact is measured by a bar where low-impact is a third of the bar coloured in orange, a medium impact such as the EURO group meeting at 1:00 takes up a third of the bar in orange, and a high impact bar which we can see at 12:50 in the morning, where the Japanese gross domestic product was considered to be a high impact and where the bar was completely coloured in red.

Economic calendars will also show you the previous data, which could be weekly, monthly, quarterly, or annually, and they will provide you with a general consensus as compiled by market experts and economists, and of course, the actual release section will be populated shortly after the embargo.

Here we can see a recent data release of us construction spending, which came out on Monday, August 3rd, and was simultaneously released at 3 p.m. BST with other important United States data including ISM manufacturing employment and manufacturing orders and prices.

While the market will look at all of this information simultaneously, some of this has been covered in previous videos, which we would ask you to take a look at. Still, in this video, we will only be focusing on the construction spending component, which was month-on-month for June, where we can see here came in at – 0.7%.

The information is released by the United States census bureau and is a measurement of the total amount of spending in the United States for various construction types. Because it includes a residential component, it is useful for predicting new home sales and mortgages. A high reading is seen as positive for the United States dollar while a low reading he seen as negative or perish for the United States dollar.

While the impact indicator considers this to be of low importance, when taken into to context with the other data being released simultaneously, traders will need to take a holistic view, especially in the current economic climate where the pandemic is still in the grips of the United States at the time of writing this article and where even low impact data can cause shock waves and market jitters. In which place, it is better to be prepared for this and wait for the market to react to the news before spotting trends and trying to get on them.

Categories
Forex Fundamental Analysis

Everything You Should Know About ‘Reserve Assets’ As A Macro Economic Indicator

Introduction

In the current age of globalization and increasing international trade, every country strives to have a favorable balance of payment and a stable currency in the international market. As is with any other market, a currency’s exchange rate is majorly determined by the forces of demand and supply. For stability of its exchange rate, a country might opt to purchase its currencies from the international market to reduce its supply, using its reserve assets.

Understanding Reserve Assets

In finance, reserve assets refer to foreign currencies held and controlled by a country’s central bank. The central banks are mandated to use the reserve currency as they deem fit to benefit the local economy. A reserve currency is supposed to be a universally accepted currency whose value is relatively stable over time. The US dollar is the most preferred reserve currency. Other major currencies include the Euro and GBP.

Purposes of the Reserve Assets

A country’s central bank can use the reserve assets it controls in several ways.

The reserve assets can be used to influence the exchange rate of the local currency against international currencies. Countries can do this whether their exchange rate is fixed or floating. For a fixed exchange rate, a country will peg the exchange rate of its currency against a reserve currency. Pegging the local currency against another one means that the local currency’s value will adjust at the same rate as the other currency.

In this case, when the local government wants to increase its currency value, it uses the reserve assets to buy its currency from the international market. In turn, the demand for the local currency goes up along with its value. The main goal for currency pegging is to remove inflation or changes in the interest rates from impacting the trade between two economies.

Source: St. Louis FRED

For countries whose exchange rate is floating, the central banks use the reserve assets to adjust their currencies relative to that of the reserve currency. If a country wants to weaken its currency to make its exports competitive in the international market, it will sell its currency to buy reserve assets. Conversely, if it wants to increase its currency value, it will use the reserve assets to purchase its currency from the international market.

Another function of the is to shore up the economy in case of natural or human-made disasters. In such disasters, economic activities in the country may be crippled, which significantly lowers the exports. Consequently, the foreign exchange earned in the international market. The central banks use the reserve assets to ensure there is enough liquidity of foreign currency for importation.

Furthermore, in such disasters, investors may flee the country by withdrawing from the local banks. The resultant shortage of foreign currency will reduce the value of the local currency. The central banks can use the reserve assets to buy the local currency to prevent over-inflation and keep the local currency stable.

The country’s reserve assets are also used to meet its financial obligations, such as debt repayment. When a country borrows from the international markets, the interest payments are usually demanded to be paid in the reserve currency. Debtors prefer the reserve currency since it guarantees them that their cash flow is protected from rapid inflation. Therefore, having adequate reserve assets gives investors and creditors confidence that their capital is protected.

Using the reserve assets data for analysis

There is a minimum limit of reserve assets that a country is recommended to hold. This minimum threshold is meant to ensure that in case of any economic shocks, the country can fund essential imports in the short term. Furthermore, the minimum reserves should cover all the country’s debt obligations for about a year.

Therefore, when the reserve assets held by a country are dropping, it could indicate that the economy is experiencing shocks, and the central banks have stepped in to mitigate. When these levels are continually dropping, it means that the economic shocks being experienced are not reducing.

Source: St. Louis FRED

Considering that the reserve assets increase when the balance of payments accounts is improving, a drop in the reserve assets signals that a country in exceedingly becoming a net importer. A reduction in the number of exports or a drop in the value of exports results in net imports. Either way, it implies that the country’s living standards have deteriorated, and unemployment is on the rise.

All these factors point towards a shrinking economy. Conversely, a constant increase in reserve assets implies that the country is a net exporter, which could increase the quantity of exports or quality through value addition. These two factors signal a growing economy with possibly improving labor market conditions.

Impact on Currency

Apart from the direct influence of the exchange rate by buying and selling the reserve assets, here are some of the ways changing levels of a country’s reserve assets impact its currency. Higher reserve assets levels show that the country is well prepared to deal with any unforeseen economic shocks. For investors, this is a sign of stability and encourages them to invest in the country, which leads to lower unemployment and economic growth. Thus, increasing levels of reserve assets lead to a currency’s appreciation.

Conversely, a persistent drop in the reserve assets is negative for the currency. Dropping reserve assets is an indicator that the local currency is under pressure, and the central banks are selling reserve assets to stabilize the currency. Similarly, it could mean that exports in the economy have been reducing over time. Both these instances point towards an adversely affected economy.

Sources of Data

In the US, the data on reserve assets is published monthly by the US Federal Reserve Board, while in the EU, it is published by the European Central BankThe IMF publishes data on global reserve assets balances.

How Reserve Assets Data Release Affects Forex Price Charts

The most recent release of the EU’s reserve assets data was on September 15, 2020, at 10.00 AM GMT. The release can be accessed at Investing.com. The screengrab below is of the monthly reserve assets from Investing.com. To the right is a legend that indicates the level of impact the FI has on the EUR.

As can be seen, this low volatility is expected upon the release of the reserve assets data.

In August 2020, the EU’s total reserve assets were 915.08 billion compared to 923.07 billion in July 2020.

EUR/USD: Before the Reserve Assets Data Release on September 15, 2020, 
Just Before 10.00 AM GMT

Before the publication of the reserve assets data by the ECB, the EUR/USD pair was trading in a neutral trend. The 20-period MA was flattening with candles forming just around it.

EUR/USD: After the Reserve Assets Data Release on September 15, 2020, 
at 10.00 AM GMT

After the news release, the pair formed a 5-minute “Doji” candle. Subsequently, the pair adopted a bullish trend with candles crossing and forming above the rising 20-period MA.

Bottom Line

The total reserve assets that a country holds is a crucial indicator of its economic health and balance of payments condition. But as can be seen in the above analyses, this indicator has no significant impact on the forex price action. We hope you found this article informative. Let us know if you have any questions in the comments below. Cheers!

Categories
Forex Fundamental Analysis

Understanding ‘Employment Trends Index’ and The Impact Of Its News Release On The Forex Market

Introduction

In any economy, the employment rate can be said to be the primary driver of economic growth. Due to its importance, several fundamental indicators track the labor market changes and many more attempting to predict the future of the labour market. Government and central banks’ policymakers may feel comfortable poring through all these economic indicators for the labour market, but for regular forex traders and households, keeping track of all these labour market indicators can be tiresome and even confusing. The Employment Trends Index (ETI), one of the most relevant labour market indicators, is making it easier to understand the labor market trends.

Understanding the Employment Trends Index

The Employment Trends Index is made by aggregating eight labour market economic indicators. The ETI report breaks down which labour market indicators positively impact the ETI and ranks them from the most positive to the least. Through the aggregation of these indicators, the “noise” in the labor market trend is filtered out. It is worth noting that these labour market indicators have shown to be accurate in their areas. These indicators are explained below.

Initial unemployment claims: This labour market indicator is collated and published by the U.S. Department of Labor. The indicator is published the Thursday of every week, and it shows the number of people who filed for the unemployment benefits for the first time. It is thus considered the latest indicator of unemployment.

Job openings: The U.S. Bureau of Labor and Statistics publishes this economic indicator. These job vacancies show the gap in the labour market that needs to be filled. It indicates the unfulfilled demand in the labour market and the desirable skills sought by employers. It further shows the potential of households to be gainfully employed in the short term.

Number of Employees Hired by the Temporary-Help Industry: The U.S. Bureau of Labor Statistics publishes this statistic. It shows the relationship between the labour market and business cycles since most businesses hire more temporary workers during peak periods and expansion phases.
The ratio of Involuntarily Part-time to All Part-time Workers: Published by the U.S. Bureau of Labor Statistics, this indicator shows the number of employees who are forced to work part-time. The indicator can be correlated to sub-optimal economic conditions, which would make filling positions full time uneconomical. An increasing ratio indicates worsening economic conditions.
Industrial Production: This indicator shows the level of output in sectors such as mining, manufacturing, and energy. The U.S. Federal Reserve Board publishes it. An increasing industrial production indicates that the employment levels are increasing while dropping industrial production levels signals higher levels of job loss.

Source: St. Louis FRED

Percentage of Respondents Who Say They Find “Jobs Hard to Get”: This indicator shows the scarcity of employment opportunities in the economy. Higher percentage signals either a stagnating or a shrinking economy. The Conference Board Consumer Confidence Survey publishes it.
Percentage of Firms With Positions Not Able to Fill Right Now: This statistic shows the lack of particular expertise in the labour market. It is published by the National Federation of Independent Business Research Foundation.
Real Manufacturing and Trade Sales: This indicator shows the level of engagement in the labour market, and the U.S. Bureau of Economic Analysis publishes it.

How to use the Employment Trends Index an analysis

The fact that the ETI aggregates most of the crucial labour market indicators makes it an ideal tool for analyzing the economy.

Since the labour market is considered one of the primary drivers of the economy, monitoring its trend can be used to detect the onset of recessions or recoveries. Here’s how. When the ETI is continually dropping, it indicates that the labor market conditions are worsening progressively. This condition is accompanied by a constant drop in the aggregate demand and supply, most consumer discretionary industries will go out of business, and the economy will progressively contract. Conversely, during a period of economic recession, an increase in the ETI signifies that the economy is on a recovery path.

An increase in the ETI does not necessarily mean that each of the underlying eight labour maker indicators improved. A higher ETI could mean that most of these indicators were positive, or they all were. In either of these instances, it means that the overall labour market is improving – it shows that labour conditions are improving. One of the most notable impacts of an improving labour market is the improvement of households’ welfare, which increases the aggregate demand and supply in the economy.

Source: St. Louis FRED

Conversely, a dropping ETI could be caused by a majority of the underlying labour market indicators being negative or all of them being negative. In either of these instances, the labor markets’ conditions are deteriorating, a condition usually punctuated with higher unemployment levels.

Impact on Currency

The ETI could be associated with contractionary and expansionary monetary and fiscal policies. Here are some of the ways that the ETI could impact a country’s currency. A continually increasing ETI means that the labour market has been enjoying a long period of constant growth. Such an instance signifies that the economy has been expanding, the welfare of households improving, and the unemployment levels low.

In any economy, if these conditions are not sustainable, an overheating economy with unsustainable levels of inflation becomes prevalent. In this case, the governments and central banks may be induced to implement contractionary monetary and fiscal policies. Thus, in the forex market, an increasing ETI can be a precursor for higher interest rates, which makes the currency appreciate relative to others.

A constantly dropping ETI is negative for the currency. The dropping ETI means that the overall labour market has been performing poorly. It means that more people are losing their jobs, wages are low, overall aggregate demand is dropping, and the economy is shrinking. With higher unemployment levels, governments and central banks tend to implement expansionary fiscal and monetary policies to stimulate demand and prevent the economy from sinking into a recession. These expansionary policies, such as lowering interest rates, makes the currency drop in value relative to others. In the U.S., the ETI data is published monthly by The Conference Board.

How the Employment Trends Index Report Release Affects Forex Price Charts

The latest release of the ETI report was on September 8, 2020, at 10.00 AM ET and accessed at Investing.com. The screengrab below is of the monthly ETI from Investing.com. To the right is a legend that indicates the level of impact the fundamental indicator has on the USD.

As can be seen, low volatility is to be expected.

In August 2020, the ETI was 52.55 and increase from 51.37 in July 2020.

Now, let’s see how this release made an impact on the Forex price charts.

EUR/USD: Before the ETI Report Release | September 8, 2020. Before 10.00 AM ET

As seen in the above EUR/USD chart, the pair went from trading in a neutral trend to a steady downtrend. The 20-period M.A. is steeply falling with candles forming further below it.

EUR/USD: After the ETI Report Release on September 8, 2020, at 10.00 AM ET

After the ETI report release, the pair formed a bearish 5-minute “Doji” candle. Subsequently, the pair adopted a weak bullish trend with candles forming just above the 20-period M.A.

Bottom Line

In the forex market, traders rarely pay close attention to the ETI. Most traders prefer gauging the underlying aggregated indicators separately, which explains the lack of impact by releasing the ETI report since the index shows what traders already know. It only serves to show the trend.

Categories
Forex Indicators

Everything About ‘Treasury Bill Auction’ Macro Economic Indicator

Introduction

One of the primary ways any government funds its budget is through debt – borrowing. When borrowing, a government can do this from the international markets or locally, from its citizens and businesses. When taking debt locally, a government uses treasury bills and bonds. As is with any form of debt, borrowing using treasury bills, the government is obligated to pay interest upon the maturity date.

The interest rate that the government offers for its treasury bills gives an invaluable insight into the confidence investors have in the economy. Therefore, to understand the borrowing patterns of the government, the interest rates it is obligated to pay, we need to understand treasury bill auctions.

Understanding Treasury Bill Auction

To better understand how the treasury bid auction works, we first need to understand a few terms.

Treasury bill is a short-term debt instrument used by governments to borrow money over a short period – usually less than one year. Because the central banks back the treasury bill, they are considered to be of lower risk and secure form of investment.

Treasury bill auction is a weekly public offering of treasury bills by the central government with maturities ranging from one month to one year. The auction is the official avenue through which central banks issue their treasury bills.

Maturity is the maximum time that a treasury bill holder can hold it before they are eligible for redemption. Treasury bills have maturities ranging from days up to one year. Note that the longer the maturity period of a treasury bill, the higher the interest rate will be.

Discount is the difference between the price at which the treasury bills are issued and the face value of the treasury bills. It is customary for the treasury bills to be issued at a discount and be redeemed at face value upon maturity.

During the auctions, participants are generally divided into two categories – competitive and non-competitive bidders. Before the auctioning process begins, the central banks make public the following information about the treasury bills: the date of the auction; the day of the treasury bill issue; eligibility of auction participants; the amount of the bills being auctioned; and the time when the bidding ends.

When the auction begins, the competitive bids are accepted first to determine the discount rate for the treasury bills. These competitive bills are submitted on a pro-rata share of every Treasury bill auction. It is worth noting that the winning bid determines the interest rate that will be paid out on each issue of a treasury bill. Furthermore, the demand for treasury bills is determined by the prevailing market and economic conditions and sentiment. It is this demand and the interest rate that will be of importance in our subsequent analyses.

Since the pricing of the treasury bills is done through a bidding process, the winning bid is usually one that has the lowest discount rate. Such bids are preferred to ensure that the interest rate the government pays investors is kept as low as possible.

After investors have purchased the treasury bills, they are then free to sell, trade them, or hold until maturity.

How can treasury bills auction be used for analysis?

Using the auction of the treasury bills in the analysis is relatively straightforward. The biggest draw of the treasury bills is because of the presumed zero risks of default since the government backs them. As we mentioned earlier, the primary determinant of the discount rate at the treasury bill auction is the demand. This demand is driven by factors such as macroeconomics, market risks, and monetary policies.

When other markets such as equity markets appear to be less risky or offer better returns, investors in the treasury bills will demand higher discounts. The higher discount translates to a higher interest rate attached to the treasury bills. Furthermore, when the rate of inflation is rising, investors will demand a higher discount rate for the treasury bills to offset the effects of inflation.

Source: St. Louis FRED

When there is rapid economic growth, investors have several options that could earn them higher returns. Therefore, they will demand a higher discount from the government, which results in a higher rate. Similarly, when the economy is heading towards a recession, investors deem treasury bills as safe-haven investments. The resulting excess demand for the treasury bills leads to lower discounts received by the investors.

Thus, the change in the yield attached to the treasury bills gives us significant insight into the state of the economy.

Impact on currency

We have seen that the rate of the treasury bills being auctioned is a reflection of the prevailing market conditions or anticipated economic performance.

When the rate received at auction is higher, it signals that the economy is performing well. Furthermore, higher rates for the treasury bills imply that there will be increased interest in investment opportunities in the country, which results in increased demand for the local currency. Higher rates could also translate to the increasing rate of inflation, which forestalls contractionary monetary and fiscal policies. For the forex market, this translates to a well-performing economy hence the appreciation of the currency relative to other currencies.

Conversely, when the rate of treasury bills at auction are falling, it implies that the economic fundamentals are performing poorly. There will be a net outflow of capital and investment. Furthermore, the forex market would anticipate expansionary monetary policies, which result in the depreciation of the currency relative to others.

Sources of Data

In the U.S., the treasury bills are auctioned by the U.S. Department of Treasury. You can access the latest data on the auction of treasury bills here. The data on the upcoming auction of the U.S. treasury bills can be accessed from TreasuryDirect, which allows you to buy and redeem securities directly from the U.S. Department of the Treasury in paperless electronic form. You can access the in-depth review of the current and historical data on the U.S. treasury bills from St. Louis FRED. You can access the global data on Treasury bills from Trading Economics.

That’s about Treasury Bill Auction and the respective details related to this fundamental indicator. We did not see any reaction at all on the Forex price charts related to this indicator, but as explained above, we know the relative impact. We hope you have found this article informative. Cheers!

Categories
Forex Fundamental Analysis

What Should You Know About ‘Asylum Applications’ Fundamental Indicator

Introduction

People from war-ravaged countries seek refuge in neighboring countries for their protection and survival. There are countries where military conflicts, wars, and political tensions were so adverse that people had to leave their homeland to go to an entirely different country to protect their life and survive barely. An understanding of the refugee movements, the price neighboring countries pay, and the corresponding economic impacts for the host countries is worth knowing.

What are Asylum Applications?

It is essential that we first clarify the fundamental differences between the terms refugee, migrant, asylum seeker before we understand asylum applications.

Refugee: They are the people fleeing from their home country to neighboring countries due to armed conflict, political wars, and persecution. Their conditions are so adverse that the only way to save their life is to seek shelter in neighboring countries. The prospect of a career, financial independence are out of the question, and it is just a matter of survival for these people.

Migrants: These are the people who move out of their country of origin in pursuit of a better standard of living and to improve life quality. The reasons can include better education, finding work, or reuniting with families. Unlike refugees, migrants can return to their native safely. Migrants are subject to the immigration laws of the recipient countries.

Asylum seekers: Asylum seekers are people who have claimed to be a refugee, but their status has not been yet evaluated. This individual would have applied for asylum (place to stay) because he/she will be persecuted if returned to their homeland. Not all applicants will qualify as a refugee but will have to go through the due process to become one. Asylum applications refer to the number of people who have come from other countries to seek asylum in the host country.

How can the Asylum Applications numbers be used for analysis?

War-ravaged countries primarily produce refugees in such large numbers that the neighboring countries would need to provide aid by providing protection, shelter, food, clothing, and water. The provisions for these asylum applicants would have to be provided by the local and central Government. Based on the available resources that can be dispensed to provide aid, countries may choose to close their gates and refuse entry too.

It is difficult to give accurate estimates of the effect of asylum applications on the economy due to lack of before and after data estimates. Some researches have shown poorer host countries have had a negative impact while developed nations have had zero or some positive impact. It has also been found that the applicants have actively sought work to improve their living conditions in the host country.

It is worth noting that the countries from which people flee are often surrounded by countries of similar economic strength, meaning the host countries are also underdeveloped nations. For such countries hosting a large influx of asylum seekers would also be burdensome and negatively impact their economic conditions. Only in a few cases, there are scenarios that people have sought asylum in a developed nation. Most of the time, people move to a developed nation as migrants to seek better work and not as a refugee.

Some researches have also shown that the funds received through the relief providing organizations and programs like the World Food Program (WFP), which provide in cash or directly food, add to the income of the host country, thus boosting the economy. Adding people into the host country also increases consumer demand, as well as revenue generated through the refugees who have found work also boosts the economy.

The influx of the refugee is generally small and lies on the border sides of the country. The overall impact on the economy is many a time negligible and is significant only when the host country is a small economy in itself and is underdeveloped. The way the host country’s Government manages refugee situations also determines whether they lose or benefit out of it.

Only when the influx of asylum seekers increases suddenly due to an overnight development of some critical situations is the effect felt on the host country. Under such circumstances, the host country may need to allocate resources to provide aid, which would impact the Government spending budget. The more the funds allocated for such rescue programs, the lesser the funds available for the Government to spend on economy-boosting activities.

Large scale influx of asylum seekers can also add to unemployment in either the refugee camps or the jobs taken away from host country citizens by the refugees. Refugees are desperate for work and would offer their labor at a very minimum rate compared to the citizens of the host country. All these effects come into play during extreme war-like situations in neighboring countries; otherwise, the economy comes to a natural equilibrium in due time with negligible impact.

Impact on Currency

The impact of Asylum applications on economy and currency is not always clear due to lack of sufficient before and after scenario data. Asylum application data comes into use during critical times when we are trying to trade currencies of the host or the crisis countries. Any volatility in the market created would be through the general market sentiment reacting to the news and not from the statistics.

Hence, asylum applications are a low-impact indicator that is only useful in critical times for data gathering and analysis. Therefore, the currency markets overlook it as they would have priced in any economic shocks presented through media ahead of the statistics.

Economic Reports

The United Nations Refugee Agency (UNHCR) publishes monthly reports on asylum application count as and when they receive reports from the Government authorities of different countries. The consolidated data of the same reports are also available on Trading Economics.

Sources of Asylum Applications

We can find refugee briefs on UNHCR official website for reference and latest updates on refugee migration. Asylum Applications for available countries are consolidated and available on Trading Economics.

That’s about Asylum Applications and their importance. We hope you find this article informative and useful. Let us know if you have any questions in the comments below. Cheers!

Categories
Forex Fundamental Analysis

The Impact Of ‘Total Vehicle Sales’ Data On The Forex Market

Introduction

Vehicle sales figures offer us much insight into the consumer demand and overall health of the economy. Changes in vehicle sales figures could also be used for predicting the near-future direction of economic growth. Understanding how vehicle sales figures can be used to infer upcoming trends in crucial economic indicators could always give us the advantage of being ahead of the market trend.

What is Total Vehicle Sales?

Total Vehicle Sales represent the overall number of domestically produced vehicles that have been sold. The reports could be monthly, quarterly, or even yearly, depending on the reporting vehicle manufacturing companies. In other words, Total Vehicle Sales is the annualized new vehicles sold count for a given month.

The automotive industry represents a vital component of the United States economy. It makes up about 3% of the total GDP and remains the largest industry in the manufacturing sector. It is responsible for employing lakhs of people in the United States and transacts in billions each year.

How can the Total Vehicle Sales numbers be used for analysis?

At first, the importance of the vehicle sales figure may not be apparent, but vehicle sales serve useful for economic analysis. A vehicle is a significant purchase for people. People buy vehicles when they are confident about their ability to make payments. It is possible only when they have considerable disposable income or procure loans at lower interest rates.

When people’s disposable income is considerable, it means the people are affluent financially and reflects the good health of the economy. On the other hand, when loans are available to more people at lower interest rates, it means there is sufficient monetary stimulus from Central Banks to promote economic growth and money is easy to come by. Such inflationary pressures stimulate economic growth and indicate that the economy is likely to grow steadily.

The increase in vehicle sales figures reinforces the positive affirmations forecasted by other economic indicators like consumer spending or interest rates. As consumer spending comprises more than two-thirds of the GDP, an increase in vehicle sales likely indicates a healthy two or three quarters that are going to continue in the economy.

Equity markets respond and perform exceptionally well around the Total Vehicle Sales figures, as the increasing figures in sales imply increasing profits for the related companies. The increase in profits due to sales is doubled down by the stock prices soaring higher, and vice-versa also holds. Hence, the vehicle sales figures are given much-deserved attention every month by the equity traders and the media. To some degree, currency markets feed off from the equity markets, but the effect is noticeable only when the changes are significant.

Vehicle purchases are considered to be discretionary spending, and when people are paying for such items, it indicates the economy is flourishing. The relation between vehicle sales and economic growth also becomes more apparent during recessions, where vehicle sales drop significantly. During the Great recession of 2007-2009, vehicle sales fell by 3 million.
With rapid development in the automobile industry, more durable vehicles that last longer, unlike older models, are coming into the market.  It means people need not buy new vehicles as frequently as before. Hence, recent trends should incorporate this factor also into the statistics.

Alongside this, there is a shift in the industry due to disruptive brands like Tesla introducing electric cars as a contrast to combustion engines. It affects the industry and the dependent oil and gasoline industries as well. Self-driving and Artificial Intelligence equipped automobiles are catching up with the people, and this could soon invalidate many traditional jobs that came as a result of the regular gasoline cars and trucks.

The current COVID-19 pandemic already cost the economies of most countries much than they could handle, and many industries suffered heavy losses. The silver lining for the automotive industry is coming from the fact that as people resume their regular life by going back to their work require a safe commute. Things are looking brighter for the automobile industry as more people are considering the safety assured through private commute over the risk involved in the public transportation system.

Impact on Currency

Vehicle Sales acts as a coincident indicator that reflects the health of the economy at the current state. The currency markets are focused more on the leading indicators before the trends pick up. Total vehicle sales prove to be more useful for the equity markets for trading on the automobile and other related industries, but currencies require more than just vehicle sales.

Hence, overall Total Vehicle Sales are a low-impact indicator for the FOREX market and are useful in double-checking or reaffirming our leading indicator predictions. Economists and business analysts will use total vehicle sales data to report current economic health, but currency traders can overlook this indicator for other macroeconomic leading indicators.

Economic Reports

The Bureau of Economic Analysis (BEA) provides monthly reports on total vehicle sales on its official website. Apart from this, the St. Louis FRED website also details the same figures historically in a more comprehensive and visually depictive way.

Sources of Total Vehicle Sales

We can obtain Total Vehicle Sales figures for the United States from BEA.

For analysis purposes, the St. Louis FRED website offers better resources and ease of access for Vehicle Sales figures.

We can obtain Global Total Vehicle Sales figures for the majority of the countries from Trading Economics.

How Total Vehicle Sales Data Release Affects The Price Charts

In the US economy, total vehicle sales data is an important leading indicator of consumer spending and consumer confidence. It measures the annualized number of new vehicles sold domestically in the reported month. The most recent data related to this was released on August 3, 2020, at 7.00 PM ET. The total vehicle sales is a combination of all car sales and all truck sales data and can be accessed from Investing.com here. The historical data of total vehicle sales can be accessed from Trading Economics here.

The screengrab below is of the monthly total vehicle sales from Investing.com.

As can be seen, the total vehicle sales data is expected to have a low impact on the USD upon its release.

The screengrab below shows the most recent changes in the monthly total vehicle sales data in the US. In July 2020, the monthly total vehicle sales were 14.5 million compared to 13.1 million in June 2020. This increase is expected to be positive for the USD.

Now, let’s see how this release made an impact on the Forex price charts.

EUR/USD: Before Monthly Total Vehicle Sales Release on August 
2020, Just Before 7.30 PM ET

From the above 15-min EUR/USD chart, the pair can be seen to be trading on a neutral trend before the release of the total vehicle sales data. This trend represents a period of relative market inactivity with candles forming near a flattening 20-period Moving Average.

EUR/USD: After the Monthly Total Vehicle Sales Release on 
August 2020, 7.30 PM ET

After the data release, this Forex pair formed a 15-minute bearish candle, indicating that the USD became stronger as expected due to the increase in total vehicle sales. The data release was, however, not significant enough to cause any market volatility as the pair continued to trade in a neutral trend with the 20-period Moving Average flattening.

GBP/USD: Before Monthly Total Vehicle Sales Release on August 
2020, Just Before 7.30 PM ET

Similar to the trend that we have observed with the EUR/USD pair, the GBP/USD was trading in a neutral pattern before the data release with candles forming around a flattening 20-period MA.

GBP/USD: After the Monthly Total Vehicle Sales Release on 
August 2020, 7.30 PM ET

After the news announcement, this pair formed a 15-min bearish candle but continued trading in the neutral trend observed before the data release.

AUD/USD: Before Monthly Total Vehicle Sales Release on August
2020, Just Before 7.30 PM ET

AUD/USD: After the Monthly Total Vehicle Sales Release on 
August 2020, 7.30 PM ET

As observed with the EUR/USD and the GBP/USD pairs, the AUD/USD traded within a subdued neutral trend before the data release. The pair formed a 15-minute bearish candle after the news release, but unlike the other pairs, it continued trading in a weak uptrend.

Although it plays a vital role as an indicator within the economy, it is evident that the total vehicle sales indicator does not cause any significant impact on the price action in the forex markets.

Categories
Forex Fundamental Analysis

Understanding What ‘GDP Deflator’ Is & Its Relative Impact On The Forex Market

Introduction

Investors and traders are continuously trying to determine which country is growing relatively faster to make currency investment decisions. Assessing growth for capitalist economies that use inflation as fuel can be tricky to understand. The differentiation between nominal and real growth, effects of inflation, and the role of a deflator are necessary to understand to arrive at correct conclusions from statistics.

What is GDP Deflator?

Most of the economies that we have today are capitalist economies and use inflation as the primary fuel for growth. Currency traders want to go “long” on currencies of countries that are experiencing relatively higher growth than other countries. Hence, a correct assessment of growth is crucial.

The broadest and most widely used measure of the growth of economies is the Gross Domestic Product (GDP). The GDP is the monetary measure of all goods and services produced within a country for a given period (quarter or year). Although, before GDP, Gross National Product (GNP) was widely used to compare growth amongst economies. GNP measures growth beyond borders and has certain limitations in its usage as a growth measure.

GDP Deflator

It is also known as GDP Price Deflator or Implicit price deflator. It measures the price changes in all goods and services produced within an economy. It measures inflation at the macroeconomic (or national) level. As prices of commodities increase over time, the GDP values are “inflated” over time.

For instance, a country that has a GDP of 10 million dollars for the year 2019 and 12 million dollars for the year 2020 would appear to have grown 20%. If the inflation rate for the duration was 10%, meaning the prices rose by 10% for all the commodities, then 1 million dollars out of 12 million dollars came purely through increased prices and not increased production. Hence, in 2020, the real GDP was only 11 million dollars. Therefore, real growth was only 10% instead of 20%.

The Nominal and Real GDP figures are vital to understand and measure the level of inflation by calculating the GDP deflator. The following formula gives the GDP deflator:

Here, the nominal GDP is the total dollar value of all commodities produced in an economy without accounting for inflation. It is a direct monetary measure of goods and services. Real GDP is the inflation-adjusted value of GDP. It strips away the effect of inflation from Nominal GDP to show real growth.

Deflators like the Real GDP also have a base year against which all other years’ figures are compared. For the United States, 2012 is the base year, meaning GDP deflator value for the year 2012 would be 100 (as nominal and real GDP would be equal due to zero inflation). Subsequent years will have higher or lower values accordingly to indicate inflation and deflation, respectively. The base year varies from country to country.

How can the GDP Deflator numbers be used for analysis?

It is essential to understand how inflation masks the real growth and leads us to make the wrong conclusions. As seen in the above example, countries may show higher and higher GDP figures, but in reality, they may have only achieved little or no growth at all. When comparing growth over several years, the GDP deflator is key to the analysis to strip away the effects of inflation. By employing the equation above, if we get a deflator score of say 110, it would indicate there is a 10 percent inflation during the observed period.

The Consumer Price Index (CPI) is the most popular and widely used indicator to measure inflation. The GDP deflator has some advantages over the CPI. As the CPI measures inflation for a fixed basket of goods and services, which does not change frequently, the GDP is a macroeconomic aggregate measure of inflation. The GDP deflator factors in any change in economic output and investment patterns. Any new change in the goods produced or change in the consumption patterns of people is accounted in by the GDP deflator, unlike CPI. The CPI basket is static and cannot account for commodities price changes that are not in the basket, whereas the deflator is all-inclusive in this regard.

It is also necessary to know that CPI includes the most commonly used goods and services that have an impact on the economy. It updates its basket as patterns change over the years. Hence, over time the GDP deflator and the CPI have similar trends and can be used interchangeably.

Impact on Currency

The GDP deflator is a basic measure of inflation that erodes currency value. It is an inversely proportional lagging indicator. High values of the deflator are bad for the currency value and vice-versa. Since it is one of the measures of inflation, it is a low-impact lagging indicator as it is not as popular and as frequent as the CPI. It is a quarterly statistic, whose effects are already priced in through more frequent inflation measuring statistics.

Economic Reports

The Bureau of EA releases quarterly reports of the GDP price deflator alongside the quarterly GDP figures on its official website for the United States. GDP and deflators are essential macroeconomic indicators, and therefore are available on the World Bank and many other international organizations like the OECD, IMF, etc.

Sources of GDP Deflator

The BEA releases its quarterly GDP deflator statistics on its official website for the public.

The World Bank also maintains GDP and GDP deflator statistics for most countries on its official website.

Deflator figures for most countries can be easily found on the Trading Economics website.

How GDP Deflator Data Release Affects The Price Charts

In the US, the GDP deflator is released by the Bureau of Economic Analysis quarterly, about 30 days after the quarter ends. It measures the annualized change in the price of all goods and services included in gross domestic product; and is the broadest inflationary indicator. The most recent data was released on July 30, 2020, at 8.30 AM ET can be accessed at Investing.com here. An in-depth review of the GDP deflator data release can be accessed at the Bureau of Economic Analysis website.

The screengrab below is of the GDP deflator from Investing.com. On the right, a legend indicates the level of impact the fundamental indicator has on the USD.

As can be seen, GDP deflator data is expected to have a medium impact on the USD after its release.

The screenshot below shows the most recent changes in the GDP deflator in the US. The GDP deflator changed by -2.1%, worse than analysts’ expectations of a 1.1% change. This change is expected to the negative for the USD.

Now, let’s see how this release made an impact on the Forex price charts.

EUR/USD: Before the GDP Deflator Data Release on July 30, 
2020, Just Before 8.30 AM ET

Before the news release, the EUR/USD pair traded in a neutral pattern. This trend is evidenced by the 15-minute candles forming on an already flattened 20-period Moving Average, as shown in the above chart.

EUR/USD: After the GDP Deflator Data Release on July 30, 
2020, at 8.30 AM ET

After the data release, the pair formed a 15-minute “hammer” candle. This trend is as expected since the USD weakened against the EUR. The data release was significant enough to cause a change in the market trend. The market adopted a steady bullish stance as the pair traded in an uptrend with the 20-period Moving Average steeply rising.
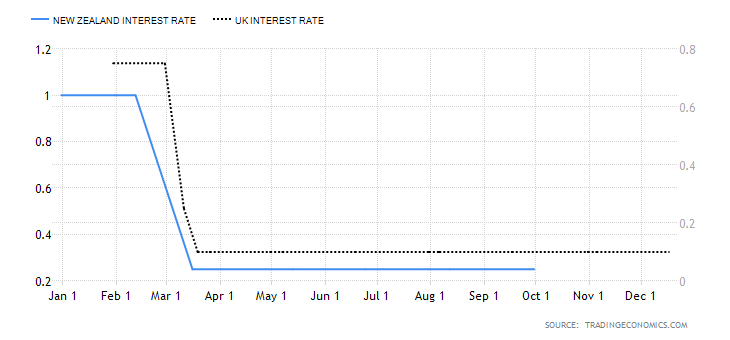
GBP/USD: Before the GDP Deflator Data Release on July 30, 
2020, Just Before 8.30 AM ET

Unlike the EUR/USD pair, the GBP/USD pair was trading in a steady uptrend before the data release.

GBP/USD: After the GDP Deflator Data Release on July 30, 
2020, at 8.30 AM ET

After the data release, the pair formed a bullish 15-minute candle. It subsequently traded in a renewed uptrend with the 20-period Moving Average steeply rising similar to the EUR/USD pair.

NZD/USD: Before the GDP Deflator Data Release on July 30, 
2020, Just Before 8.30 AM ET

NZD/USD: After the GDP Deflator Data Release on July 30, 
2020, at 8.30 AM ET

The NZD/USD pair was trading in a similar neutral pattern as the EUR/USD pair before the data release. Similar to the EUR/USD and the GBP/USD pairs, the NZD/USD pair formed a 15-minute bullish candle after the data release. Subsequently, the pair adopted an uptrend with the 20-period Moving Average steadily rising.
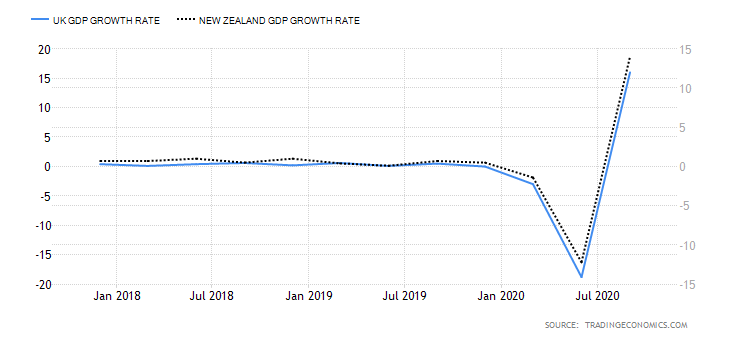
Bottom Line

As observed in this analysis, the GDP deflator has a strong impact on the price action, enough to alter the prevailing market trend upon its release. Forex traders should avoid having any significant open positions before the GDP deflator data release to avoid being caught on the wrong side of the news release.
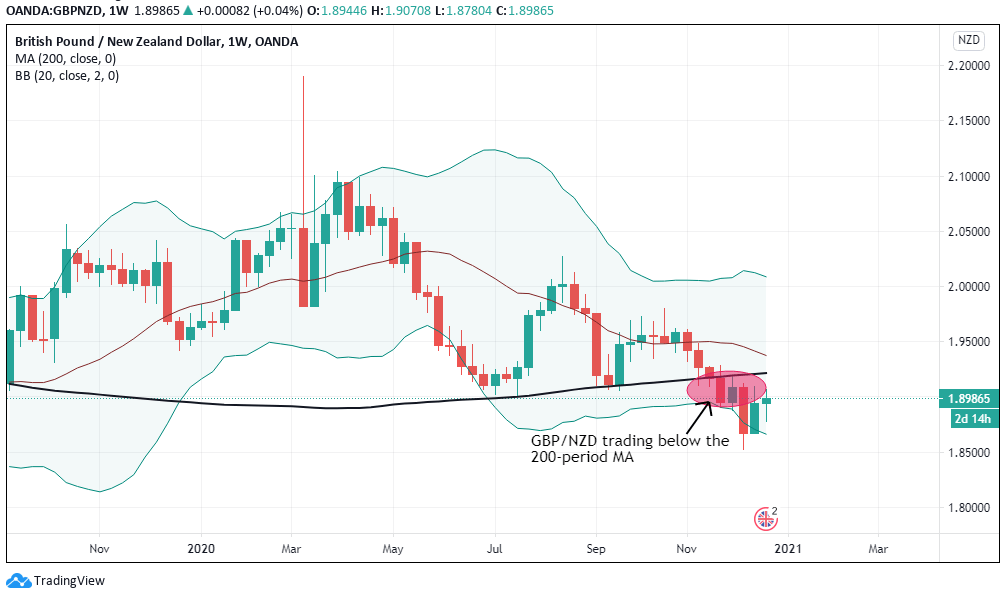
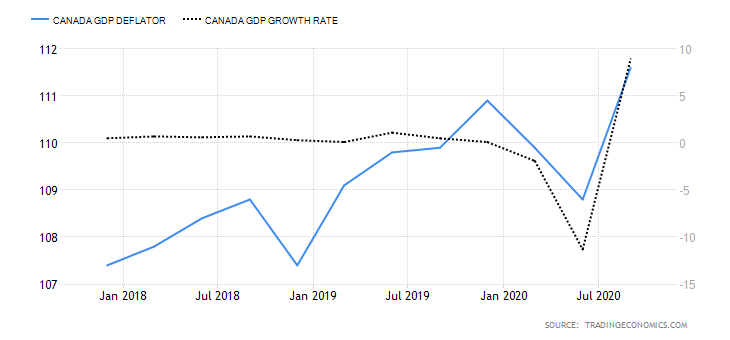
Categories
Forex Fundamental Analysis

The Importance of ‘Loan Growth’ as a Forex Macro Economic Indicator

Introduction

Loan Growth is a suitable parameter for us to check whether the monetary strategies implemented by the Central Authorities are coming into play yet or not. Loan Growth also helps us to gauge the health of the economy in terms of liquidity. Loan Growth percentage serves as a litmus test, especially in a capitalist economy, where credit and inflation primarily drive the economy forward.

What is Loan Growth?

Loan: It is a debt incurred by an individual or entity. The lender is generally a bank, financial institution, or the Government. The lender credits the borrower a sum of money. The borrower agrees to specific terms and conditions that can include finance charges, interest payments, due dates, and other conditions.

Loans can be secured or unsecured. In secured loans, the loan is given out against collateral with a financial value like a property, mortgages, or securities, etc.

Loan Growth: Loan Growth refers to the percentage increase in the number of loans issued overall by banks in a particular region over a particular time frame. The time frame can be monthly, semi-annual, or annual.

Most modern economies today we see are capitalist economies, i.e., they grow through capitalism. A capitalist economy requires money to expand and grow. Hence, credit is an inevitable fuel required for economic growth.

How can the Loan Growth numbers be used for analysis?

A healthy increase in the percentage of Loans is suitable for a stable and healthy economy. But as with any case, there is no perfect economy, and there are two sides of analysis to Loan Growth.

First Scenario

A healthy economy means it is growing at a stable rate year over year with mild inflation each year. Credit fuels economic growth in this type of economy. In this type of economy, an increase in the number of loans taken can be considered a positive sign for the economy.

Businesses can grow beyond just cash in hand. Householders can purchase homes without saving the entire cost before purchase. Governments can meet their spending needs without relying solely on tax revenues. Be it a business, householder, or a Government can smoothen out their economic activities in terms of money. They will take credit when in deficit and payback when in surplus.

An increase in Loan Growth can imply that more people are creditworthy, and more businesses are taking credit to expand and grow. Both of these scenarios are good for the GDP and is a good sign for the economy.

Second Scenario

The first scenario takes into the assumption that the economy is strong and stable. In reality, currently, most of the developed nations are struggling to maintain their economic growth. For example, the United States debt to GDP ratio is above 100%, which indicates that even if the entire GDP were given out to repay the debt, it would still be in some debt. Most of the developed nations have taken substantial credits to keep the economy from ticking over.

Keeping economic growth and global competency in mind, most countries have invested heavily in overgrowing in the short-term. By taking on more and more debts, countries may have achieved the necessary growth and needs now but have pushed their problems to the future.

Economists argue that eventually, there would be a time when countries cannot afford any more debt and would be backed into a corner. The only way out then would be at a considerable cost of losing out more than what they had made. Studies also show that rapid loan growth than the long term average also has seen an increase in underperforming or bad loans.

It is also essential to know that increase in Loan Growth should be accompanied by the fact that no bad loans are given out. Giving loans to people and businesses who do not have the eligibility but just because money is lying around is also a problem.

In the United States itself, the Government has been injecting money into the economy since the financial crisis in the form of Money Supply and Quantitative Easing programs to inflate their way out of depression or recession. Until now, the Government has not been able to reduce debt and is only taking on more debt to sustain the current growth.

An increase in loans is good or bad for the economy remains debatable for many. Without credit, sector growth is almost unimaginable in present times. For our analysis, we can use the Loan Growth rate as a litmus test to see whether the injected money from the Central Authorities has started reaching the public and businesses.

When the Central Authorities want to inflate the economy, they reduce interest rates by injecting money into the interbank market. The injected money takes time to get into the economy, and loans are one form in which this money gets circulated.

Overall, for our analysis, once Loan Growth shows increasing numbers, we can assume that the injected money is reaching the intended sectors, and consequent effects could be predicted on businesses and consumers. Loan Growth is indicative of a growing economy in general and is more prominent in developing countries.

Impact on Currency

Loan Growth is a by-product of a reduction in interest rates from the Central Banks of the country and an increase in employment and business growth. An increase in Loans indicates that money is “cheaper” to borrow. It is inflationary for the economy and is given out to induce growth (which may or may not happen).

An increase in Loan Growth depreciates currency as more money is competing against the same set of goods and services. A decrease in Loan growth appreciates the currency as the reduced liquidity forces goods and services to come at reduced prices.

Overall, Loan Growth is a low-impact indicator, as the Central Bank’s interest rates are the leading indicators, and the desired effect from increased loans can be traced from other leading indicators like Consumer and Business surveys.

Economic Reports

Since Loan Growth is not a significant economic indicator, official publications for significant countries are not explicitly published but can be obtained through reports analysis. For our reference, the Trading Economics website consolidates the Credit Growth in different sectors for data available countries on its official website. Since it is a consolidation, frequency and time of publication vary from country to country.

Sources of Loan Growth

Loan Growth consolidated available data for different countries are available here.

“The impact of bank lending on Palestine economic growth: an econometric analysis of time series data” has been referenced for this article.

How Loan Growth Affects The Price Charts

Loan growth is not a statistic. Most forex traders keep an eye when making their trades. The lack of interest is because it is considered a their-tier leading indicator. It is, however, essential to know how the release of this fundamental economic indicator affects the forex price charts.

In the EU, loan growth data is released monthly by the European Central Bank about 28 days after the month ends. It represents the change in the total value of new loans issued to consumers and businesses in the private sector. The most recent release was on July 27, 2020, 8.00 AM GMT can be accessed here. A more in-depth review of the economic news release can be accessed at the ECB website.

Below is a screengrab of the Forex Factory website. On the right, we can see a legend that indicates the level of impact the Fundamental Indicator has on the EUR.

As can be seen, low impact is expected on the EUR.

The screengrab below is of the most recent change in the loan growth in the EU. In June 2020, private loans grew by 3% as compared to the same period in 2019. This change represented a flat growth from the previous release. Based on our fundamental analysis, this should be positive for the EUR.

Now, let’s see how this positive news release made an impact on the Forex price charts.

EUR/USD: Before Loan Growth release on July 27, 2020, 
Just Before 8.00 AM GMT

From the above chart, the EUR/USD pair is trading on a neutral trend before the data release. The candles are forming around the flattening 20-period Moving Average. This trend is an indication of relative market inactivity.

EUR/USD: After Loan Growth release on July 27, 
2020, 8.00 AM GMT

After the news release, the pair forms a 15-minute bullish candle as EUR becomes stronger as expected. However, the news release was not strong enough to cause a shift in the pair’s trend since the pair continued to trade in the previously observed neutral trend.

Now let’s see how this news release impacted other major currency pairs.

EUR/JPY: Before Loan Growth release on July 27, 2020, 
Just Before 8.00 AM GMT

Before the news release, EUR/JPY traded in a similar neutral trend as observed with the EUR/USD with the candles forming around a flattening 20-period Moving Average.

EUR/JPY: After Loan Growth release on July 27, 
2020, 8.00 AM GMT

As observed with the EUR/USD pair, EUR/JPY formed a 15-minute bullish candle after the news release as expected. The subsequent trend does now significantly shift.

EUR/CAD: Before Loan Growth release on July 27, 2020, 
Just Before 8.00 AM GMT

EUR/CAD: After Loan Growth release on July 27, 2020, 
8.00 AM GMT

The EUR/CAD pair shows a similar neutral trading pattern as the EUR/USD and EUR/JPY pair before the news release. After the news release, the pair forms a 15-minute bullish candle but later continued trading in the earlier observed neutral trend as the 20-period Moving Average flattens.

The release of the loan growth data has an instant short-term effect on the EUR. The data is, however, not significant enough to cause any relevant shift in the prevailing market trend.