Forex indicators use mathematical calculations to measure things like volume, exchange rates, open interest, etc. about a currency pair to let traders know if they should enter or exit a trade. There are a lot of different indicators out there, such as Bollinger Bands, Stochastic oscillator, Relative Strength Index (RSI), and many more. Most people use indicators to help make more confident trading decisions without as much guesswork.

Those with programming skills can create their own software to run on the MetaTrader 4 or 5 platforms, which can make your life as a trader much easier. Of course, those that aren’t interested in developing their own software can rent or purchase indicators for a low price in most cases. If you’re looking at indicators, you’ll want to choose one that is suited for your personal trading strategy. In our opinion, the most useful indicators work with many different strategies while offering clear signals and helpful information. Below, we will go into detail about the five best indicators that are available.
Moving Averages
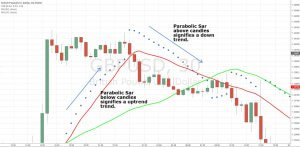
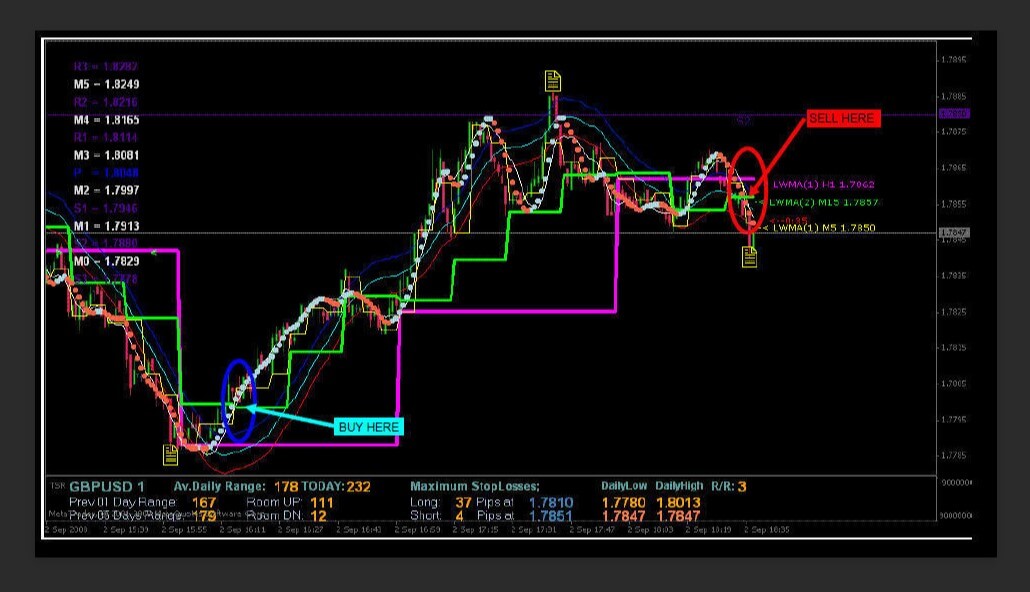
Moving averages gauge momentum and define areas of support & resistance in the market. These indicators are primarily used to give one an idea of the underlying direction or trend of the market. Traders can also use one or more moving averages for trading signals, for example, the point where a shorter moving average crosses above or below a longer moving average.
There are five main types of moving averages:
- Simple moving average (SMA)
- Exponential moving average (EMA)
- Weighted moving average (WMA)
- Smoothed moving average
- Hull Moving Average (HMA)
Moving average is a lagging indicator, meaning that it reacts to events that have already happened, rather than predicting future events. The indicator focuses more on confirmation and analysis.
Relative Strength Index (RSI)
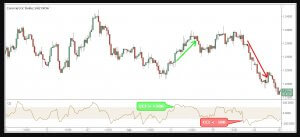
The RSI has been a favorite trading indicator for many traders since it was created by analyst J. Welles Wilder in 1978. It is a momentum-based indicator that compares the amount of a currency pair’s most recent exchange rate increases against its most recent exchange rate drops. This helps it to identify overbought or oversold conditions in the market.
The RSI is displayed as a line on a graph that moves between two extremes with a reading from 0 to 100. Traders usually interpret a reading above 70 as an indication that a security is being overbought, which will likely result in a trend reversal or corrective pullback in price. A reading of 30 or below would, therefore, indicate oversold or undervalued conditions in the market.
Bollinger Bands
John Bollinger developed the Bollinger Bands technique in the 1980s. The indicator uses a moving average with two trading bands above or below it to add and subtract a standard deviation calculation. Bollinger Bands measures volatility so that it can adjust to market conditions and provide all needed price data between the two bands.
On a chart, you’ll see a centerline, which is an exponential moving average, with two price channels (or bands) above and below it. The two price channels are the standard deviations of the asset that is being looked at. Volatile price action causes the bands to expand, or contract when the price is bound into a tight trading pattern. Looking at examples online can help one to recognize these patterns.
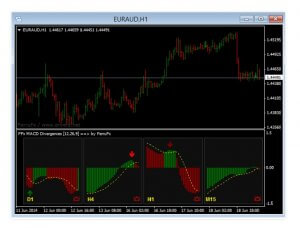
Moving Average Convergence Divergence (MACD)
The MACD indicator is a trend-following, momentum-based indicator that shows the relationship between the two moving averages for an instrument’s price.
The indicator comes up with its calculation by subtracting the 26 period EMA (Exponential Moving Average) from the 12 period EMA, resulting in the MACD line. It also includes a smoothed moving average (SMA) line of 9 periods to signal trades.
The Stochastic Oscillator
A Stochastic oscillator is a momentum-based indicator that compares the closing price of a security against the range of prices it experienced over a specific time period. The primary use of this indicator is identifying overbought or oversold conditions and providing trading signals.
The indicator provides traders with a number that ranges from 0 to 100. Readings over 80 are considered to fall in the overbought range, while readings of 20 or less are considered undersold. Of course, the exact line where one would consider conditions overbought or oversold can fall to personal interpretation. The indicator consists of two lines. One reflects the value of the oscillator for the session, the other reflects its simple three-day SMA.
Conclusion
Throughout this article, we have identified some of the best indicators that one can have at their disposal: moving averages, relative strength index (RSI), Bollinger Bands, moving average convergence divergence (MACD), and the stochastic oscillator. Several of these options are momentum-based and they can help to identify trends and overbought or oversold conditions, or to provide helpful trading signals. If you plan on using any of the indicators we have outlined above, be sure to check out some visual examples online first. On the contrary, if you’d prefer to trade without the use of any indicators, then you should consider naked trading.