Categories
Forex Course

152. Knowing The Fundamental Factors That Affect The Currency Values

Introduction

Many fundamental factors affect currency value. Therefore, whether we trade based on technical analysis fundamental analysis, we should know these factors to understand the currency markets.

Important Fundamental Factors That Affect Currency Values

Fundamental factors are economic releases and events that have a direct impact on currency value. If we want to trade based on fundamental analysis, we should focus on these releases and make a decision based on the result. Let’s have a look at the important fundamental factors that affect currency values

Interest Rate

Interest rate is the amount that a central bank charges if anyone takes loans from the bank. Central banks change the interest rate to control the country’s money supply; therefore, it directly affects the currency value.

Inflation Rate

Inflation is the buying power of money. Lower inflation means higher buying power, and higher inflation, the lower buying power.

Consumer Price Index (CPI)

CPI or CPI inflation is the price of consumer needs. Any increase in CPI is bad for the currency, while a decrease in CPI is good for the currency.

Producer Price Index (PPI)

PPI is the price of products or elements of businesses. An increase in PPI means businesses need additional money to buy raw materials that may increase the finish product rate.

Retail Sales

Retail sales indicate the number of products and services bought by consumers. An increase in retail sales indicates higher consumer activity in the market that is good for the currency value.

Foreign Exchange reserve

Foreign exchange reserve is the amount of money that is reserved in the central bank. An increase in foreign reserves is positive for a country’s economy and currency value.

Non-Farm Payroll (NFP)

On the first Friday of every month, US Labor Statistics releases the number of unemployed persons in the USA. As the US dollar is the most used currency globally, any change in NFP affects the overall forex market.

Central Bank Meets

In every quarter, central banks of every country provide an outlook of the domestic and international economy. In this meeting, any hawkish tone creates a positive impact on the currency value, while any dovish tone creates a negative impact on the currency value. We should keep an eye on how central banks are reacting to the central banks meeting to get an outlook of the currency value.

Conclusion

Besides the above-mentioned fundamental factors, there is a political movement, trade natural disaster, etc. also impacts the currency market. Moreover, in an uncertain market condition, no trading strategy works well, whether based on technical or fundamental analysis. Let’s dig deeper into each of these fundamental factors and more interesting aspects in the upcoming lessons. Cheers.

[wp_quiz id=”86366″]
Categories
Forex Daily Topic Forex Fundamental Analysis

Understanding The Impact of ‘Sales Tax Rate’ News Release On The Forex Market

Introduction

The sales tax rate usually comes as an afterthought to many. But for forex traders, understanding how the rarely-talked about sales tax rate could prove useful in the long-run. This article defines what sales tax rate is and further shows how they impact a country’s economic development and, by extension, its currency.

Understanding the Sales Tax Rate

A sales tax rate is the percentage of the total cost of the goods or services being sold. Sales tax is a consumption tax that is imposed by governments or local authorities on the sale of goods and services. The sales tax rate is calculated as a percentage then added on the cost. These taxes are usually collected at the retail point of sale on behalf of the imposing authority.

As structured, any business that is offering goods or services is liable for the payment of the sales tax in a given jurisdiction. Depending on the laws, this occurs is they have a physical location within the jurisdiction, an official employee, or an affiliate.

How Sales Tax Work?

The sales tax is collected at the end of the supply chain, only after resale to the consumer has occurred. Since consumers are the ones paying the tax, businesses receive a resale certificate to show that the sales tax is not yet due. The purpose of this certificate to the resellers is to ensure that no sales tax is paid on purchases of items to be resold.

The administration for the sales tax is triggered by whether or not a particular business has a presence within the tax jurisdiction. To be eligible to collect sales tax from its customers, the business has to apply for a sales tax permit from the relevant authorities.

Depending on the jurisdiction, the goods and services that are eligible for a sales tax vary. Groceries and medications are exempt from sales tax, as are goods and services purchased by nonprofit organizations.

Sales Tax Rate as an Economic Indicator

The sales tax rate can serve as a leading indicator for the shifts in demand and supply within the economy. Higher sales tax rates reduce the purchasing power and, with it, the aggregate demand and aggregate supply. The lowered demand and supply within the economy result in reduced economic activities, which could have an unintended ripple effect throughout the economy. With lowered demand and supply, unemployment as a result of job cuts in the affected sectors is another unintended consequence of a higher sales tax rate.

On the other hand, lowering sales tax increases the purchasing power of consumers, which in turn increases the aggregate demand and aggregate supply. These increases lead to job creation in various sectors and boost a flourishing economy. With a lower sales tax rate, the GDP growth within the country is guaranteed to bring about a strengthening currency as a result of improved economic conditions.

How the Sales Tax Rate Affects the Economy

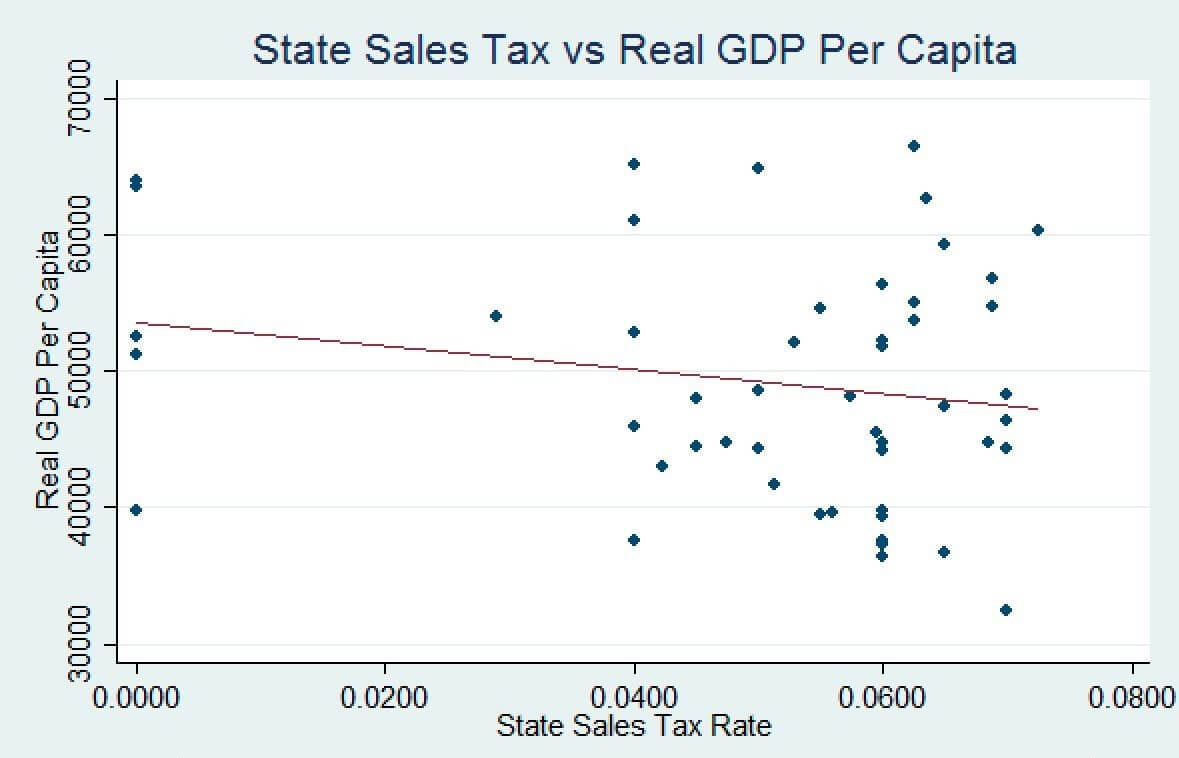
In general, the sales tax rate has a negative correlation with the GDP. This negative relationship is shown in the scatterplot graph below of the US state sales tax rate against the GDP.

Source: Georgia Tech Library

At its core, sales tax is a revenue stream for the government. Thus, it can be said that a higher sales tax rate increases government revenues. The increase in government revenues increases government expenditure, hence higher GDP. In this scenario, a conflict arises. This conflicts because sales tax is an extra cost passed on to the consumer.

Thus, in general, the sales tax rate reduces the purchasing power of the consumers.  The reduced purchasing power leads to lesser sales taxes collected by the government, hence lower GDP. As a result of the diminished purchasing power, the consumers will spend less, resulting in a reduction in the aggregate demand within the economy. This reduction in demand leads to a reduction in the economic output hence lower GDP.

On the other hand, a lower sales tax rate returns some of the purchasing power to the consumers. They will spend more of their disposable income hence increasing the aggregate demand and supply within the economy. The increase in demand and supply increase the economic output. Furthermore, spending more implies that the government is bound to collect more revenue in the form of the applicable sales tax. An increase in revenue will increase the government expenditure within the economy, thus increasing the GDP.

How Sales Tax Rate Impacts Currency

The strength of any currency is usually seen as a direct reflection of its economic performance. As already discussed, the sales tax rate is considered to be leading indicators of aggregate demand and aggregate supply within an economy, and by extension, the unemployment levels. An increase in the sales tax rate will result in a drop in the aggregate demand and aggregate supply. This drop leads to increased unemployment levels and consequently reduced GDP. Long term currency traders can take their cue from an increased sales tax rate as an impending loss of strength in the country’s currency.

This loss in the currency’s strength can be brought by the expectations that, in the long run, central banks and the government will employ the use of expansionary fiscal and monetary policies to stimulate a stagnating economy. These policies harm the currency.

On the other hand, lowering the sales tax rate signifies that in the long run, the economy will be stimulated to grow. This growth is brought about by increased demand and supply. For forex traders, a country that is lowering the sales tax rate or entirely removing the sales tax can expect its currency to strengthen. The currency strength is because the traders can anticipate that in the long run, the government and the central banks may be forced to employ deflationary monetary and fiscal policies to avoid an overheating economy. These contractionary policies are good for the country’s currency.

Therefore, it can be expected that an increase in sales tax corresponds to a weakened currency against other pairs while a decrease in the sales tax rate corresponds to the strengthening of the currency.

How Sales Tax Rate News Release Affects The Forex Price Charts

The sales tax rate is not an indicator forex traders consider when placing their trades because it is a low-impact leading indicator. However, it is useful for forex traders to know just how much the impact of this low-level indicator is on the price charts.

In the US, the national government does now impose the sales tax. However, the various local governments set their own local sales tax rates. The detailed list of the US states and the sales tax rate applicable in each state can be found on the Sales Tax Institute website. The data on annual GDP growth can be accessed from the World Bank website. A forecast of the sales tax rate through to 2020 can be found on the Trading Economics website.

Below is a screengrab of the Sales Tax Institute showing the most recent changes sales tax rate in Washington.

In the latest release, Washington state lowered the sales tax rate applicable from 8.0 % to 6.5% in an attempt to alleviate the strain on consumers as a result of the Coronavirus pandemic.

Now, let’s see how this news release made an impact on the Forex price charts.

EUR/USD: Before Washington Sales tax rate release July 1, 2020

As can be seen in the chart above, we have plotted a 20-period Moving Average on a one-hour EUR/USD chart. From the chart, the pair is one a steady uptrend, represented by the candlesticks forming above the Moving Average. Before the news release at 1730GMT, the pair can be seen to be on a recovering uptrend. This uptrend can also be observed in the AUD/USD pair, as shown by the chart below.

AUD/USD: Before Washington Sales tax rate release July 1, 2020

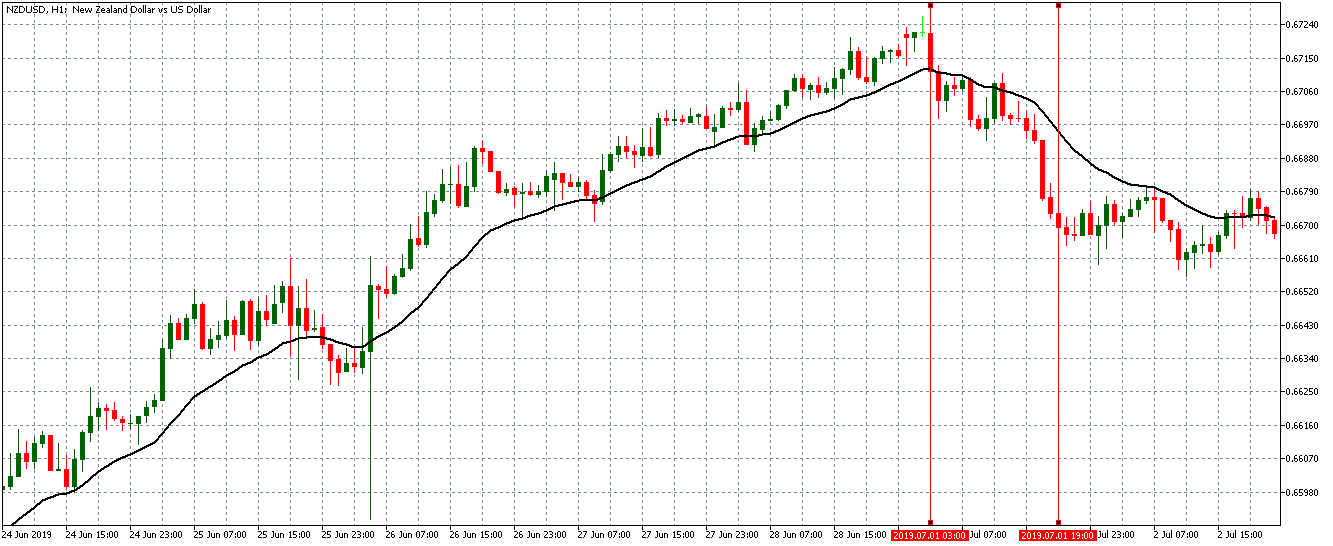
For the NZ/USD, the pair is on a steady downtrend for hours preceding the news release. This trend is shown in the chart below.

NZD/USD: Before Washington Sales tax rate release July 1, 2020

For long-term forex traders, the pattern offers an excellent opportunity to go long on the EUR/USD and AUD/USD pairs while short on NZD/USD, since the prevailing market trends would favor them. Let us now see how the price action responded to the release of the sales tax rate in Washington State.

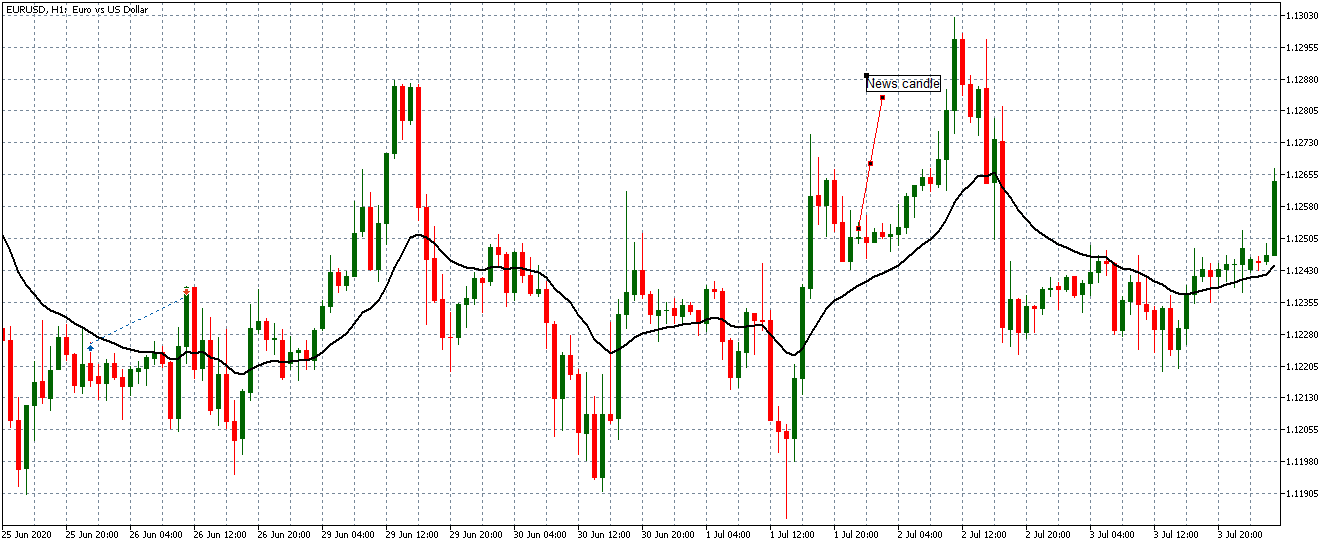
EUR/USD: After the sales tax rate release July 1, 2020

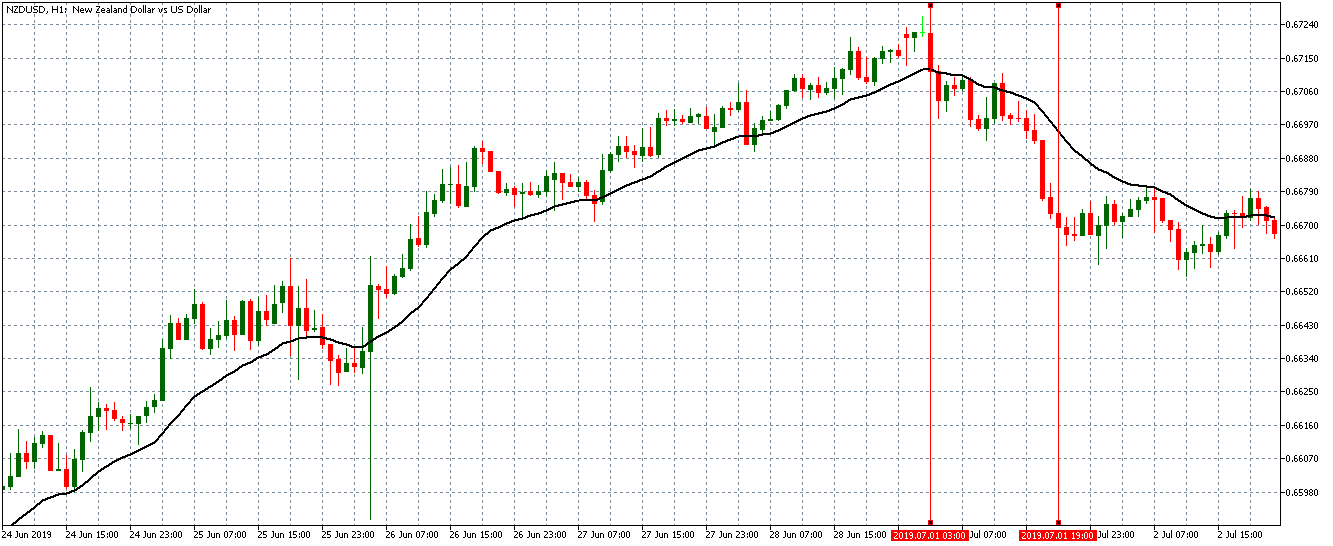
Lowering the sales tax rate should have a strengthening effect on the USD. However, as shown in the chart above, the news release of the sales tax rate had no impact on the EUR/USD since the uptrend continued with the same magnitude as before. The same trend can be observed on the AUD/USD and NZD/USD pairs since the previous trends were no reversed. This trend is shown in the charts below.

NZD/USD: After the sales tax rate release July 1, 2020

AUD/USD: After the sales tax rate release July 1, 2020

It is evident from the after-news charts that the release of the sales tax rate does not have any impact on the price action. Although it is has a significant impact on the GDP, it is a low-level economic indicator in the forex market. Cheers!

Categories
Forex Fundamental Analysis

What Should You Know About ‘Income Tax’ As A Fundamental Indicator?

What is the Income Tax?

An Income Tax is a percentage of our income that the government takes in the form of taxes. Income Tax is paid by individuals and entities depending on the level of earning and gains during a financial year. In most of the countries, a single income tax does not usually apply to the entire income, but rather various rates apply to different portions of the “taxable income.” The different tax rates and the income levels at which they apply vary widely.

Types of Income which attracts Tax 

Income Tax is a direct tax that is levied on the income and other types of earnings of an individual in a financial year. Below are some types of incomes and taxation rules.

Income from Salary: This includes basic salary, taxable allowances, and profit in lieu of salary, pension received by the person who himself has retired from the service. They all fall under the category of taxable income.

Income from business/profession: This includes presumptive incomes from business and professions that individuals do in their capacity and maybe their part-time work. This is also added to the taxable income after adjustment of the allowed deductions.

Income from properties: A taxable person may also own one or more house properties. These properties can be self-occupied or rented out or even vacant. The rules of Income Tax state that rent from house properties is to be treated for the purpose of calculation of taxable income. An income tax assessee can, however, claim certain deductions for house maintenance in certain areas.

Capital Gains: They are the gains that one makes from selling capital assets like Gold, house properties, stocks, mutual funds, securities, etc. Although capital gains are a part income tax, they are not added to taxable income, as they are taxed at different rates.

Economics and Income Tax

Tax plays a major role in maintaining a balance between people, businesses, and governments,  which broadly represents the economic activity of a country. Here are two ways in which changes to Income Tax affects the economic activity and well being of people.

Tax Incentives

By granting incentives, taxes can affect both supply and demand in an economy. Reducing marginal tax rates on wages can motivate workers to work more. Expanding the income tax credit can bring more low-skilled workers into the labor force. Reducing Tax rates can also encourage to employed persons to invest in stocks and bonds, which improves the capital flow of companies.

Budget Deficit

Large Tax cuts can slow economic growth by increasing budget deficits. When the economy is operating at its potential, a sudden reduction in tax rates may provoke the government to borrow capital from foreign investors and institutions. They will also divert some funds allocated to private investment, reducing productive capacity relative to what it could have been. Either way, deficits increase and thus reduce well-being.

The Economic Reports

The Income-tax rates are announced every year by the Finance Ministry during a press release, which puts out all the slabs and tax brackets based on the income level. This is usually the Central Government tax rate, but there is also a yearly announcement made by all the states, which impose income taxes in the same way the federal government does. In some countries, a single tax rate is applicable to everyone, regardless of the income level. This is called a “flat tax.”

Analyzing The Data

Investors, when analyzing a currency Fundamentally, give extreme importance to the Capital Gains tax of that country. Income Tax is not a major concern for investors when taking a position in the market. But a major deviation from the standard Income Tax rates catches the attention of investors. However, if the Federal government has been maintaining a fixed rate over the years without any major changes, there is no reason to worry, as they fell, the economy is stable. However, an increase in Capital Gains tax is not taken well by the institutional investors, which changes their stance on the economy and the currency, mostly to negative.      

Impact on the currency

A study conducted by economists examined the impact of taxes on the real exchange rates through their effects on economic activity. Their report says that an increase in the capital interest tax rate leads to depreciation in the currency, while an increase in the wage or consumption tax leads to a real domestic currency appreciation. This hypothesis is supported by the data estimations of annual data from 10 OECD countries over 17 years.

A marginal increase in Income Tax is considered to be good for the economy as it increases the revenue of government organizations, but a substantial increase in tax rate can have a reverse effect on the economy, and this will be unbearable for salaried persons.

Source of information on Income Tax rates

Income Tax rates are available on the official website of the finance department of the country, where one can also find the rates for previous years as well (of more than 30 years). Using this information, a trader can analyze the trend in the Income Tax rates over the years. Here is a list of major countries of the world with their Income Tax rates.

Links to Income Tax information sources

GBP (Sterling)USDEURCHFCADNZDJPY

Income Taxes is a compulsory contribution to state revenue, levied by the government on workers’ income and business profits. This gives the ability to the government to provide basic safety and community systems for the public. This ensures freedom and basic living standards that citizens expect. Therefore, it is the duty of citizens to timely file Income Tax returns and be a responsible civilian.  

Impact of the Income Tax news release on the price chart 

After having a clear understanding of the Income Tax and its role in the economy, we will now extend our discussion and study the impact of the same on the value of a currency. Investors and traders mainly consider the Capital Gains tax rates, which is also a form of Income Tax. Any major changes to the Capital Gains tax cause extreme volatility in the currency pair and a change in the outlook for that currency. Thus, the income tax alone is not explicitly taken into account by traders.

In the upcoming sections, we will analyze the change in volatility in the currency pair due to the announcement of Income Tax rates. The above image shows the Federal Tax rates of Canada for 2020, where we can see the percentage of income that will be levied as Income Tax on individuals of the country. This is also known as ‘Tax Bracket.’ The maximum Income Tax rate stood at 33%, and this rate has been maintained from the past four years. This data is published by the Canada Revenue Agency, where one can find other tax rates as well.

GBP/CAD | Before The Announcement

We start our discussion with the GBP/CAD currency pair, where the above image shows the behavior of the chart before the news announcement. Price action suggests that the price seems to be retracing the big uptrend and is at a key ‘support’ level. If the Income Tax rate announcement comes out to be negative for the Canadian economy and not per expectations, one can take a ‘buy’ trade in the above pair. Whereas positive data might not result in a trend reversal as the overall trend is up.

GBP/CAD | After The Announcement

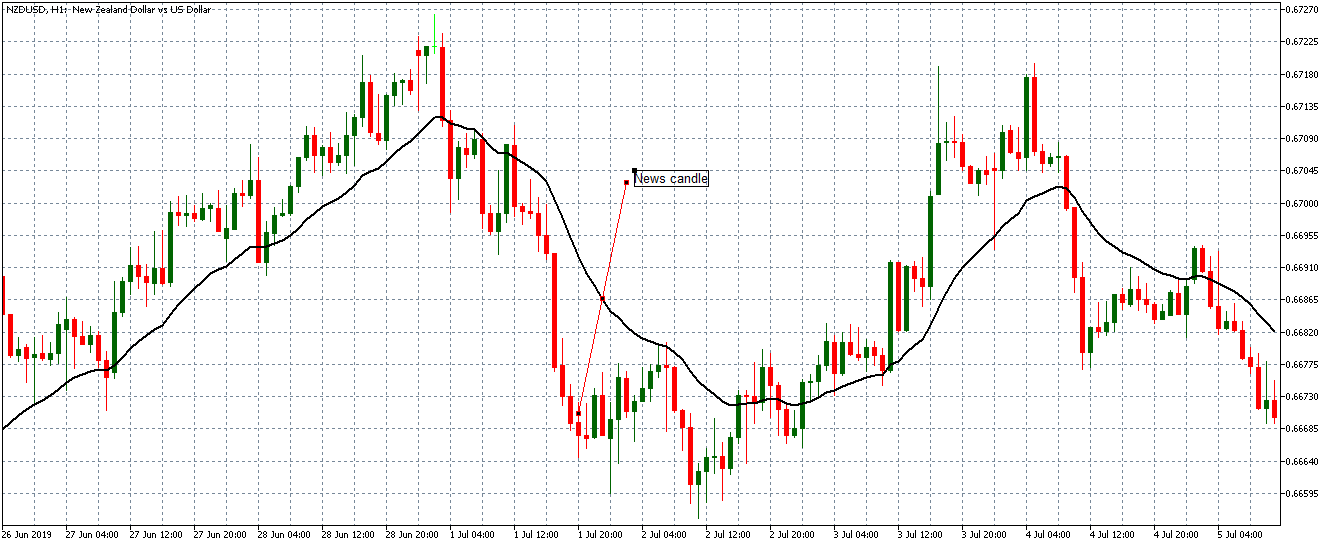
After the announcement, we see that the price moves higher, and it closes with a fair amount of bullishness. The increase in volatility to the upside is a sign of continuation of the trend, and this shows that the data was not very positive for the Canadian dollar. The bullish ‘news candle’ indicates a weakness in the currency where traders find the data to be negative for the economy. As the market moves higher, once can go ‘long’ in the market with a stop loss below the ‘news candle’ and ‘take profit’ at the recent ‘high.’

EUR/CAD | Before The Announcement


EUR/CAD | After The Announcement

The above images represent the EUR/CAD currency pair. In the first image, we see that the price is moving within a range, and just before the announcement of Income-tax rates, the price is at the bottom of the range. Since the price is at an optimal place for going ‘long’ in the market, aggressive traders can buy the currency pair with a strict stop loss of a few pips below the ‘support’ area.

We are essentially advantage of the increased volatility and movement in the pair. After the Income Tax rates are published, the market moves higher similar to the GBP/CAD pair, but later, the market gets sold into, and the candle closes with a large wick on the top. We can say that the news data was neutral to negative for the economy. Thus, there some confusion among traders can be seen. As the ‘news candle’ is not a bullish candle, it is wise to wait for the price to cross above the moving average and then a ‘buy’ trade.

CAD/JPY | Before The Announcement

CAD/JPY | After The Announcement

Lastly, we discuss the CAD/JPY currency pair, where the characteristics of the chart appear to be different from the above two pairs. Since the Canadian dollar is on the left-hand side, an uptrend in the first image signifies a great amount of strength in the currency. As the market is continuously moving higher before the announcement, we need a lot of confirmation from the market in order to go ‘short’ in the market. I

f the news data is positive for the economy, the move gets accelerated to on the upside and, in that case, once can join the trend after a retracement. After the news announcement, the market crashes, and volatility increases to the downside, thereby indicating a possible reversal. The bearish ‘news candle’ shows that the Income Tax rates were not very positive for the economy, and thus traders sold Canadian dollars. One should take ‘short’ trade only after the price goes below the moving average.

That’s about Income Tax and the impact of its new release on the Forex Market. Let us know if you have any questions in the comments below. Cheers.

Categories
Forex Fundamental Analysis

Impact of Unemployment Rate On A Nation’s Economy & It’s Currency

Introduction

The unemployment rate is a fundamental indicator of macroeconomics. Before getting into defining the unemployment rate, let’s first understand what even unemployment is. Later, we shall get deep into understanding the unemployment rate and its effects on the economy and the currency (using price charts).

What Is Unemployment?

To put it in simple terms, Unemployment is a scenario where a person is constantly looking for work but is unable to find it. So, works are considered to be unemployed if they do not work but are capable and are willing to do so. This is a great factor in determining the health of the economy. And the measure of unemployment is what is termed as the unemployment rate.

Understanding Unemployment Rate

The unemployment rate can be defined as the percentage of unemployed workers in the total labor force, where the total labor force comprises of all the employed and unemployed citizens within an economy. Mathematically, it is the number of labor force divided by the number of unemployed people. And as mentioned, to be considered unemployed, the person must have an active history of them looking for jobs. So, if you’ve given up looking for a job or work, you will not be considered unemployed.

More about Unemployment

Unemployment is a vital economic indicator as it indicates the inability of the workforce to obtain work to contribute to the productive output of the economy. The simple implication of unemployment would be less total production than that could have been possible. Also, an economy with high unemployment would have lower growth output with disproportional fall in the requirement for basic consumption.

On the flip side of things, a low unemployment rate implies that the economy is producing goods almost at its full capacity, having a commendable output, and rising standard living standards. Talking it further, an extremely low unemployment rate would mean an overheating economy and signs for inflationary pressures. It could be a hard time for businesses that would be in need of additional workers.

Types of Unemployment

Now that the definition of unemployment is clear, let us go ahead and understand how economists have classified unemployment. Unemployment is broadly classified into two types, namely, voluntary and involuntary. Voluntary unemployment is the case when the person has quit the job voluntarily in search of another job. But, in the case of Involuntary unemployment, the person has been fired by the organization. Now, the person must look for other employment. Voluntary and involuntary unemployment can be further divided into four types.

  • Frictional Unemployment
  • Cyclic Unemployment
  • Structural Unemployment
  • Institutional Unemployment
Frictional Unemployment

Frictional Unemployment is the most obvious type of unemployment. This occurs when a person is in between jobs. When a person quits a company, it takes some time to search for a new job. However, this unemployment is typically short-lived. Moreover, this type of unemployment does not really cause problems for the economy. Frictional unemployment is something natural, as ideally, it is not possible to find a job right after a person leaves a job.

Cyclic Unemployment

Unemployment varies based on the cycles of the economy is termed as cyclic unemployment. During the course of economic growth and declines, there is variation in the number of unemployed workers. For example, during economic recessions, unemployment rises, and during economic growth, unemployment decreases.

Structural Unemployment

This type of unemployment causes due to the advancements in the technology, or the structure through which the labor markets operate. The technological advancements could be the automation of manufacturing or the use of automobiles in place of horse-drawn transport. Such things lead to unemployment because there is no requirement of labor for it.

Institutional Unemployment

The consequence of permanent or long-term institutional factors and incentives in the economy could be unemployment. Such unemployment is called institutional unemployment. Some of the factors leading to institutional unemployment include

Government policies
  • High minimum wage floods
  • Generous social benefit programs
  • Restrictive occupational licensing laws
Labor market phenomena
  • Efficiency labor
  • Discriminatory hiring
Labor market institutions
  • A high rate of unionizations

How the Unemployment Rate Affects the Economy

We know that the unemployment rate is a vital indicator, as it gauges the joblessness in an economy. This, in turn, gauges the economic growth rate as well.

The unemployment rate economic indicator is a lagging indicator. This indicator does not predict that the market is going to rise or go under recession, but it measures the effect of the economic events. Based on the event, this indicator makes a move. For example, the unemployment rate does not rise until the recession has officially begun. But, a point to note is that the unemployment rate continues to rise even after the recession starts to fade away.

There are two reasons for it. One of them is that the companies are reluctant to lay off their people when the economy takes a downside. For large companies, it might take a few months to come up with a layoff plan. Secondly, the companies are more reluctant to hire new workers until they have a confirmation that the economy has stepped into the expansion phase of the business cycle.

For example, during the well-known financial crises that happened in 2008, the recession actually began during the first quarter of the year. The US GDP had 1.8 percent. Until May 2008, the unemployment rate was 5.5 percent. But, when the recession came down, and the economy started to do well, the unemployment rate hit 10.2 percent in October 2009.

So, with this, we can entitle the unemployment rate as a powerful confirmation indicator rather than a lagging indicator. For example, if the other leading indicators are already showing an expansion in the economy, and the unemployment rate has started to decline, then you are confident that the companies are yet again going to hire people.

Unemployment Rate and its Impact on the Currency

As already discussed, unemployment signals the economic growth of a country. If the economy is doing is bad, then then the unemployment rate rises. And if the economy is growing fairly, the unemployment rate declines. When it comes to currency, it is proportional to the economic growth of a country. This, in turn, implies that unemployment is inversely proportional to the value of the currency.

Frequency of the release of the Unemployment rate

The unemployment rates are released by the Bureau of Labor Statistics on Friday of every month. Typically, the present values are compared with the previous month’s values. Sometimes, a year-to-year comparison is made as well.

Dependable Sources of Information 

With the list of sources mentioned below for different countries, one can obtain valuable statistical information on the unemployment rates. Specifically speaking, one can get a visual representation of the historical values over a period of as high as 25 years. Apart from that, users get access to information regarding the actual, previous, highest, lowest unemployment rates as well.

USD | CAD | CHF | AUD | JPY | EUR | GBP

How the ‘Unemployment Rate’ News Release Affects the Price Charts?

Now that we have a good amount of theoretical information on the Unemployment rate, let’s get a little technical. In this section, we shall analyze how the prices of the currencies are affected after the release of the reports.

As mentioned, the reports on the unemployment rate are released by the Bureau of Labor Statistics on a monthly basis, typically on Fridays. As a usual effect, it is said that the actual data less than the forecasted data is good for the currency.

Also, note that, as per sources (Forex factory), this news is expected to have a high impact on the currency. For our illustration, we have taken into account of the Unemployment rate of the US released on 7th February.

In the below image, we can see that the Actual percentage is 3.6%, which is 0.1% higher than the forecasted percentage (3.5%). Also, it is higher than the previous month’s value. So, we can conclude that the unemployment rate in the US has increased in February compared to January.

When it comes to the effect on the forex exchange market, we can expect the US dollar to drop as the unemployment rate has increased (which is not good for the economy).

Now, let’s see its effect on few USD charts by pairing it with other major currencies.

USD/CAD | Before Announcement – 7th February

Below is the candlestick chart of USD/CAD on the 15min timeframe. If we were to look at the recent trend, we could see that the market is in an uptrend. Now, we need to see if the trend continues after the release of the news or reverses its direction.

USD/CAD | After Announcement – 7th February

Below is the candlestick chart of USD/CAD on the 15min timeframe after the release of the news. The news candle is indicated as shown. We can see that when the news was released, the market just plunged down. Here, we can infer that the market moved as the way we expected it to move. Also, the volatility surged up when the news came out. If you look at the volume indicator as well, we can see that the volume shot up high.

However, in hindsight, the market recovered from the drop and left a wick on the bottom. With this, we can conclude that the drop in price was consumed by the strong buyers. The buyers did not let sellers reverse the market.

EUR/USD | Before Announcement – 7th February

In the below chart of EUR/USD, we can see that the market is in a downtrend, where the purple line represents the support and resistance line. Currently, before the release of the news, the market is in the S&R area. We need to see how the market will react after the news.

EUR/USD | After Announcement – 7th February

When the news was announced, we can see that the market went up, came down, and closed below the open price. There was strength from both sides, and the volatility was pretty high. If you look at the volume bar corresponding to the news candle, we can see that the volume too was high at that point in time.

In this currency pair, EUR is the base currency, and USD is the quote currency. According to the impact of the news, the market was supposed to shoot up. The market did try to go higher but got rejected by the sellers. So, basically, the seller’s market was more dominated than the news in this case.

 GBP/USD | Before Announcement – 7th February

GBP/USD | After Announcement – 7th February

Below is the chart of GBP/USD on the 15min timeframes after the release of the news. We can see that this chart is very similar to the EUR/USD chart. The news candle initially shot up, but came down and closed red. The volatility during this time was quite high, which can be inferred from the corresponding volume bar below. And according to the news, the market was supposed to go north, but the market continued its downtrend.

Bottom line

The unemployment rate, though a lagging indicator, should not be taken for granted. It is as vital as the other economic indicators such as GDP, inflation rate, interest rate, etc. Employment is one of the primary reasons for the economies do well. Economies with high unemployment rates are being hit hard. Coming to the investors’ and traders’ point of view, one must keep an eye on the rate of this indicator and treat it as a powerful confirmation tool rather than just a lagging indicator.