Categories
Forex Course

194. Introduction To The US Dollar Index (USDX)

Introduction

The U.S. dollar index is referred to as a measure of the value of the U.S. dollar, which is relative to the value of a series of currencies that are the most important trading partners of the country. The USDX is similar to other forms of trade-weighted indexes that also use the exchange rates from the leading currencies.

U.S. Dollar Index – A Brief History

In the year 1970, the U.S. Dollar Index switched between 80 and 110. This was the time when the U.S. economy was witnessing recession and rising inflation levels. With the Federal Reserve increasing interest rates to cut inflation, money flowed into the U.S. dollar, resulting in a rise in the USD index. In February 1985, the USD Index hit 164.720; this is the highest it has ever been.

However, this caused significant issues for the U.S. exporters whose goods were no longer competitive internationally. Subsequently, strong actions were taken by the U.S. government to make the currency more competitive, with five nations agreeing to manipulate the U.S. dollar in the forex markets.

This made the Dollar Index dropped by 51% over the course of four years. Since that time, the index has tracked the performance of the economy as well as liquidity flows.

Fundamentals of U.S. Dollar Index

This index is presently calculated by factoring in the exchange rates of six leading world currencies, including Euro (EUR), British Pounds (GBP), Canadian Dollar (CAD), Swiss Franc (CHF), Swedish Krona (SEK), and Japanese Yen (JPY). The biggest component of this index is the EUR, which accounts for approximately 58% of the basket. The weights of the rest of the currencies in the index include –

  • GBP (11.9%)
  • JPY (13.6%)
  • SEK (4.2%)
  • CAD (9.1%)
  • CHF (3.6%)

What Impact The Price Of The USD Index?

The USD Index is primarily impacted by the demand for and the supply of the U.S. Dollar. Related currencies of the baskets are also an important factor. These factors impact the price of each pair of currency in the formula that is being used to calculate the value of the U.S. Dollar’s value. The demand and supply of currencies are determined by monetary policies.

In the upcoming course lessons, we will be learning more about the US Dollar index. So, stay tuned. Please take the quiz below before you go. Cheers.

[wp_quiz id=”97429″]
Categories
Forex Fundamental Analysis

EUR/USD Global Macro Analysis – Part 3

EUR/USD Exogenous Analysis

In the exogenous analysis, we’ll analyze the economic fundamentals that impact the Euro-US Dollar exchange rate. For this analysis, we’ll focus on:

EU and the US GDP Growth Difference

The primary drivers of GDP growth in an economy are domestic demand and international trade. When a country’s exports increase, it means that the demand for its currency also increases, which makes it appreciate.

The US and the EU GDP change are in tandem. In Q3 of 2020, the EU GDP expanded by 11.6%, while that of the US expanded at an annualized rate of 33.1%. Although this change seems much, the US GDP level is still about 3.5% lower than the pre-coronavirus pandemic levels.

Based on the correlation analysis of the GDP differential and the EUR/USD pair changes, we assign a deflationary score of -2. It implies that the difference in GDP growth between the EU and the US will lead to a bearish EUR/USD.

Trade Balance Difference

For each country, the trade balance shows if an economy is running on deficits in international trade. The trade balance is simply the difference between exports and imports. Surplus trade balance happens when an economy exports more than it imports. A negative trade balance means an economy is importing more than it exports.

The EU recorded a trade surplus of €24489.40 million in September 2020, while the US had a $63.9 billion trade deficit in the same period. The trade balance has a high correlation with the exchange rate of the EUR/USD pair. Therefore, we assign it an inflationary score of 7, meaning we expect a widening trade balance between the EU and the US to result in bullish EUR/USD.

EU and US Interest Rate Differential

This indicator measures the difference between the interest rates in the EU and that in the US. The economy with a higher interest rate will attract more investments from foreigners seeking higher returns.

In the US, the Federal Reserve has kept the interest rate within a range of 0% – 0.25%. In the EU, the ECB interest rate is 0%. Since the interest rate differential between the two economies is low, we do not expect it to impact the EUR/USD exchange rate. Therefore, we assign a deflationary score of -1. That means we expect it to result in a mild bearish trend for the EUR/USD pair.

Conclusion

The exogenous analysis of the EUR/USD fundamentals gives an inflationary score of 4. This implies that in 2020, the EUR/USD pair has had a bullish trend. In the short term, this bullish trend is expected to persist.

Note that the EUR/USD pair has formed a support level along with the middle Bollinger band. Therefore we can say that our Fundamental analysis is being supported by our Technical Analysis as well. Cheers!

Categories
Forex Fundamental Analysis

GBP/USD Global Macro Analysis – Part 1 & 2

Introduction

To properly understand the dynamics of the price of the GBP/USD pair, we’ll conduct endogenous and exogenous analyses of the UK and the US economies.

The endogenous analysis will focus on the significant fundamental economic indicators that drive economic growth in either country. The exogenous analysis will dig deeper into how both the US and the UK economies interact with each other in terms of international trade that impact the currency exchange.

Ranking Scale

Both the endogenous and the exogenous factors that we will analyse will be ranked on a sliding scale from -10 to +10. A negative score means that the indicator resulted in currency depreciation, while a positive score implies that it led to currency appreciation.

USD Endogenous Analysis – Summary

The USD endogenous factors recorded a score of -19.1, implying a deflationary effect on the USD. This essentially means that according to these indicators, the USD has lost its value since the beginning of this year.

You can find the complete USD Endogenous Analysis here.

GBP Endogenous Analysis – Summary

The endogenous analysis of the UK economy results in an expansionary score of 2. Therefore, we could expect the GBP increased in 2020.

Markit Manufacturing PMI

This is a survey done on about 600 purchasing managers in the manufacturing industry, who rate the level of the business environment such as prices, new orders, inventories, supply deliveries, labour conditions, and production levels.

This is a leading indicator for the economy because businesses react almost instantly to the changing operating environment, and the purchasing managers have the most relevant insight. In November 202, the UK Manufacturing PMI was 55.2, showing that the economy is undergoing a sustained recovery. Due to its low correlation with the GDP, we assign an inflationary score of 3.

UK inflation

The CPI is based on a monthly survey done by the Office for National Statistics. This is done by comparing the current average of sample consumer items by the previous month’s prices. The BOE uses the data to adjust interest rates and QE levels to set inflation targets for the economy.

Rising inflation levels lead to higher interest rates, which makes CPI a vital currency valuation indicator. The UK inflation rate increased by 0.7% in October 2020 but is still lower than the rate in the pre-pandemic period. Based on our correlation analysis. We assign it a score of -4.

Manufacturing Production

It measures the change in the total value of inflation-adjusted output by the manufacturers in the whole economy. It is a leading indicator of the economy’s performance since production levels adjust quickly to the business cycles and heavily dependent on consumer conditions like employment changes and earning levels.

Manufacturing contributes about 80% of the UK’s industrial output and accounts for up to 42.4% of GDP changes. The year-on-year manufacturing production change in September 2020 was -7.9%. This marks the smallest decline since the onset of the coronavirus pandemic. Due to its high correlation with GDP, we assign it an inflationary score of 6.

Claimant count change

It measures the change in the number of people who are seeking unemployment benefits. Hence, it is the primary indicator of unemployment levels, which makes it a vital signal of consumer expenditure levels and labour market conditions. In the UK, claimant count change is considered the best measure of the employment situation, and it accounts for 30% of changes in the GDP.

In September 2020, the number of people in the UK who claimed unemployment benefits dropped by 29800. However, the unemployment rate remains at yearly highs of 4.8%. For this reason, we assign a score of -5.

Industrial Production

It measures the change in output from the mines, manufacturers, and utilities, adjusted for inflation. While manufacturing makes up 80% of the industrial production, mines and utilities make up 20%, and their effects on the real economy are thus overshadowed.

It is a significant leading indicator of the economy’s health since industrial activities correspond to labour market conditions and sensitive to business cycles. In September 2020, the UK industrial MoM production increased by 0.5%. However, on a YoY basis, it is down 6.3% from September 2019. In this case, we assign industrial production a score of -3.

Retail Sales

It measures the change in the inflation-adjusted value of all sales at the retail level in the whole economy. It is the primary measure of how much consumer expenditure accounts for most of the country’s economic activity.

In October 2020, the UK MoM retail sales increased by 1.2%, which is the 6th consecutive increase in retail sales from the slump recorded at the height of the coronavirus pandemic. Based on its correlation with GDP, we assign retail sales an inflationary score of 4.

Markit Services PMI

This is a survey on about 400 purchasing managers in the services industry, who rate the business environment using factors such as employment, new orders, pricing, inventories, and supplier deliveries. A score of above 50 signifies an expansion, while below 50 indicates a contraction in the services industry.

In November 2020, the Marking UK Services PMI was 45.8 – a significant drop from 51.4 in October. Although the Services PMI has increased from the April lows, it is still lower than in January 2020. Combined with its low correlation with the UK GDP, we assign a deflationary score of -3.

United Kingdom Public Sector Net Debt to GDP

This is also called Government Debt to GDP Ratio. Most investors, bilateral and multilateral lenders use this ratio to determine a country’s ability to service any debt they take on. Naturally, when the ratio is higher, it means that the government is piling on more debt, but the GDP is not increasing at the same rate. Since higher GDP would mean higher sources of revenue, if the GDP is not increasing at the same pace as the amount of debt, it implies that the government might struggle with debt repayment.

In 2020, the UK Public Sector Net Debt to GDP is projected to reach historic highs of 96.6%. This increase is mainly attributed to governments’ efforts to prop up the economy through aggressive expansionary policies during the pandemic. Based on our correlation analysis, the increase in the United Kingdom Public Sector Net Debt to GDP in 2020 served its purpose to avoid irreversible recessions. We, therefore, assign an inflationary score of 4.

In our next article, we will analyze the Exogenous factors of both USD and GBP to come to an appropriate conclusion.

Categories
Forex Course

156. Why Interest Rates Matter While Trading Forex Currency Pairs

Introduction

The interest rate is one of the major fundamental indicators of a currency pair. Any increase in interest rate is a positive sign for an economy. However, there are some other factors that a trader should know.

What is the Interest Rate?

The interest rate is the charge that the Central Bank takes on loans and advances to control the money supply. The interest rate is usually revised quarterly based on the economic condition of a country.

The main aim of changing the interest rate is to control inflation and stabilize the country’s currency exchange rate. The interest rate is one of the most significant fundamental indicators for a country that directly affects the country’s economy both inside and outside.

Image Source: https://www.ecb.europa.eu/

When the country’s economic condition is excellent, and the targeted inflation is achieved, the central bank tries to discourage people from taking loans from the Central by increasing the interest rate.

On the other hand, when the economic condition is not right, Central Bank tries to expand the country’s economic activity by attracting people to take more money from the bank with a cheaper interest rate.

How interest Rate Impact on a Currency Pair?

In the forex market, traders usually trade in currency pairs instead of a single currency. Therefore, they should evaluate two separate countries’ economic conditions to determine which country is more reliable. Based on this knowledge, we can say that increasing the country’s interest rate will influence the currency to be strong against other currencies.

For example, we want to take a trade in the USDCHF pair, and we are waiting for the USD’s interest rate decision. When the news came, we saw that the Federal Reserve increased the interest rate from 2% to 2.5%. As a result, the USD became stronger immediately against the CHF, and the USDCHF goes up.

This is how the interest rate impacts on a currency. However, the opposite reaction might happen when the Federal Reserve decreases the interest rate from 2 % to 1.5% instead of increasing. In that case, the EURUSD might be stronger and move higher.

How to Make a Profit from the Interest Rate Change?

Making money from interest rates is an effective and solid way to trade based on the fundamental analysis. However, as a trader, we should focus on other fundamental releases and events to understand a currency pair’s overall structure. The significant economic releases of a country are interrelated. For example, if the inflation and GDP are good, an increase in interest rate is evident for the central bank.

Therefore, before taking a trade based on the interest, we should focus on what the other fundamental releases are telling about the currency.

Conclusion

After the above discussion, we can say that the interest rate is the most significant fundamental indicator of a currency pair. However, as the forex market consists of several uncertainties, we should focus on money management strongly. We may face some market conditions where the price might react against our expectations. So, the only way to make a consistent growth of our trading balance is to follow strong trade management.

[wp_quiz id=”86408″]
Categories
Forex Course

152. Knowing The Fundamental Factors That Affect The Currency Values

Introduction

Many fundamental factors affect currency value. Therefore, whether we trade based on technical analysis fundamental analysis, we should know these factors to understand the currency markets.

Important Fundamental Factors That Affect Currency Values

Fundamental factors are economic releases and events that have a direct impact on currency value. If we want to trade based on fundamental analysis, we should focus on these releases and make a decision based on the result. Let’s have a look at the important fundamental factors that affect currency values

Interest Rate

Interest rate is the amount that a central bank charges if anyone takes loans from the bank. Central banks change the interest rate to control the country’s money supply; therefore, it directly affects the currency value.

Inflation Rate

Inflation is the buying power of money. Lower inflation means higher buying power, and higher inflation, the lower buying power.

Consumer Price Index (CPI)

CPI or CPI inflation is the price of consumer needs. Any increase in CPI is bad for the currency, while a decrease in CPI is good for the currency.

Producer Price Index (PPI)

PPI is the price of products or elements of businesses. An increase in PPI means businesses need additional money to buy raw materials that may increase the finish product rate.

Retail Sales

Retail sales indicate the number of products and services bought by consumers. An increase in retail sales indicates higher consumer activity in the market that is good for the currency value.

Foreign Exchange reserve

Foreign exchange reserve is the amount of money that is reserved in the central bank. An increase in foreign reserves is positive for a country’s economy and currency value.

Non-Farm Payroll (NFP)

On the first Friday of every month, US Labor Statistics releases the number of unemployed persons in the USA. As the US dollar is the most used currency globally, any change in NFP affects the overall forex market.

Central Bank Meets

In every quarter, central banks of every country provide an outlook of the domestic and international economy. In this meeting, any hawkish tone creates a positive impact on the currency value, while any dovish tone creates a negative impact on the currency value. We should keep an eye on how central banks are reacting to the central banks meeting to get an outlook of the currency value.

Conclusion

Besides the above-mentioned fundamental factors, there is a political movement, trade natural disaster, etc. also impacts the currency market. Moreover, in an uncertain market condition, no trading strategy works well, whether based on technical or fundamental analysis. Let’s dig deeper into each of these fundamental factors and more interesting aspects in the upcoming lessons. Cheers.

[wp_quiz id=”86366″]
Categories
Forex Fundamental Analysis

Do You Know That ‘IP Addresses’ of A Nation Is Also Considered A Macro Economic Indicator?

Introduction

The advent of the Internet and the rapid growth of technology over the years has dramatically changed the way we define development and living standards. The number of literate people nowadays do own an electronic gadget with access to the Internet. It was not the case long before, but now access to the Internet is seen as a growth measure for countries. Understanding the IP addresses count as a means to assess how developed a nation is fascinating to acknowledge and look back on how the Internet changed the world.

What is an IP Address?

Each electronic gadget with internet access has a unique identifier called its IP address. An analogy would be like the “from” address in a post letter. Successful transfer of to-and-fro of data from mailer to recipient is possible when “from” and “to” addresses are clear. The unique address of your computer machine is used to relay data across a network in either direction.

The majority of the networks today use TCP/IP (Transmission Control Protocol/Internet Protocol) as a means to communicate with other machines over a network. The unique identifier for a computer is known as its IP address.

There are two standards for IP address: IPv4 and IPv6 (v stands for version). All computers have the IPv4 address, and it is the prior version consisting of (24 =32 bit binary digits). At the same time, it will soon exhaust all possible combinations as more people start accessing the Internet. A sample IP address would look like “138.23.45.23” this. The IPv6 (26 = 128-bit binary digits) is the later implementation that came into the picture when we realized the limitation of IPv4 as the Internet was not an immediate trendsetter during its initial launch. The IPv6 will have six numbers as part of the address and would look something like “12.158.23.61.3.23” this.

How can the IP Addresses numbers be used for analysis?

Ten-twenty years ago, this article would be invalid as the Internet’s popularity grew exponentially until today to become an indispensable part of most economies. The Internet is now the primary source of information and communication. In today’s world countries, where the majority of people do not have access to the Internet are seen as third-world countries. It is a meaningful inference, though. Countries that have high literacy rates are bound to be aware of the Internet, computers, and similar electronic gadgets. People are rapidly incorporating technology all across the world and, through the Internet, are more connected than ever before.

Even if we look at the statistics and see the countries with one of the highest number of IP addresses are generally the most developed nations. Likewise, countries with the least number of IP addresses are generally underdeveloped nations. As more people are educated, have enough money to own a computer or electronic gadget, and have access to the Internet are likely to have a better living standard than those who do not.

One likely drawback of this type of inference would be that the IP address count is also a function of the population. Countries like India or China that have a large population count would easily surpass those who have a relatively small area of land and population. In that case, a percentage of the total population could be used to compare how many people have access to the Internet. In this digital age, the Internet is a powerful tool to incorporate new technologies, take advantage of access to external resources, and rapidly grow.

Businesses that do not have a “.com” are typically seen as not an established brand themselves. A digital presence of a business is almost mandatory as it has become one of the primary sources through which people know about the company. People, businesses, corporations, and governments are all accessible to us via the Internet. Hence, IP addresses count can give us more insight into how developed a country is than we think.

For instance, Bangalore, a city in India, is nowadays referred to as the Indian Silicon Valley due to a massive number of IT and Software companies operating as a primary business center there. With India incorporating electronic gadgets and the Internet (3G, 4G, and now 5G soon) boosted the economy, providing rapid growth and for consecutive years had one of the highest GDP growth rates globally. In this sense, the IP address count trend can be used to forecast growth trends in other developing countries.

Internet is a gold mine, companies like Facebook, Google have a net worth in billions, and the traditional definitions of large businesses do not apply to internet giants. Making proper use of the Internet and the available resources can potentially help in earning huge revenues. Even currency or stock trading are all done online for which we need internet access. Even this very article you are reading requires an internet connection and a computer (or a mobile) to begin-with.

Impact on Currency

The IP address count of countries serves as a general measure of prosperity. The relative growth of countries by the count and percentage share can be used to understand how open and adaptive countries are to the latest technologies. The countries with increasing IP addresses are likely to undergo a transformation and achieve high economic growth. We can forecast long-term trends through these statistics due to which it is a low-impact leading economic indicator as currency markets focus on current economic trends.

Economic Reports

The global count of IP addresses across countries is available through an internet company known as Akamai. However, the quarterly consolidated and graph plots of these statistics of most countries are available on Trading Economics.

That’s everything about IP Address Forex fundamental driver. It is obvious that there won’t be any impact on the price charts after the news release of this economic indicator. Cheers!

Categories
Forex Fundamental Analysis

The Importance of ‘Wages’ In Determining The Economic Condition of a Nation

Introduction

It is completely fair to say that it would be difficult to sustain a country’s economy in the absence of households’ consumption. The amount of money that employees are typically paid determines their purchasing power and their level of demand. Wages can, therefore, be said to be the best leading indicators of consumer inflation. More so, we can establish a direct correlation between the wages paid and the growth of the economy. For this reason, forex traders need to understand how wages drive the economy and the currency.

Understanding Wages

Wages are compensation that an employer pays their employees over a predefined period. It is the price of labour for the contribution to the production of goods and services. Thus, wages can be regarded as anything of value an employer gives an employee in exchange for their services. Wages include salaries, hourly wages, commissions, benefits and bonuses.

There are two categories of wages: nominal and real wages.

Nominal wages: are the amount of money that an employee is paid for the work done. Nominal wages are expressed in terms of pure monetary value.

Real wages: are the wages received by the employees adjusted for the rate of inflation. Real wages show the purchasing power of money. They are meant to guide on how the overall living standards have changed over time.

Therefore, Real wages = nominal wages – inflation

How Wages can be used for analysis

Their levels of disposable income determine the purchasing power of the households. The disposable income is directly proportional to the wages received. Therefore, the amount of wages paid for labour affects not only the quality of life of the households but also economic growth.

Growth in the wages received can be considered as a source of demand. Wages contribute a significant proportion of income for the middle- and low-class households who do not have other sources of income from investments. Assuming no corresponding increase in taxation, an increase in the wages corresponds to an increase in the amount of disposable income. Higher wages also give households the capacity to borrow more from financial institutions at competitive rates. The cheaper loans significantly contribute to increased aggregate demand. In this case, more goods and services will be demanded. The increase in aggregate demand compels producers to increase their scale of production to match the supply and demand. Consequently, the employment levels increase while the economy expands.

Source: St. Louis FRED

Conversely, decreasing wage growth implies that a decrease in disposable income. A reduction in the aggregate demand and supply will follow. Producers will be forced to scale back their operations, increasing the unemployment rate and consequently a slow-down in the economic growth.

Investments and savings rate rise with the growth in wages. These investments create employment opportunities and spur innovation within the economy. Contrary to this, the decrease in wages forces households to prioritise consumption over investments and saving. The resultant effect is fewer new job opportunities and stifled innovation. As can be seen, changes in the level of wages have a multiplier effect on the economy.

A rise in the rate of inflation is primarily driven by a disproportionate increase in demand driven by a rise in wages. Rising wages lead to a wage push inflation. This particular type of inflation is a result of an increase in prices of goods and services by producers to maintain corporate profits after an increase in the wages. Furthermore, since the responsiveness of supply to an increase in demand is not instant, increasing wages results in inflation since more money will be chasing the same amount of goods.

Impact of Wages on Currency

Forex traders monitor the fundamental indicators to gauge economic growth and speculate on the central banks’ policies. Central banks set their average inflation targets which guide their monetary policies. In the US, the inflation rate target is 2%.

When the wages increase, it forestalls a growth in the economy due to increased investments, aggregate demand and supply. An increase in employment levels also accompanies it. Since the value of a country’s currency is directly proportionate to its economic performance and outlook, wages growth leads to the appreciation of the currency. More so, consistent growth in wages is accompanied by wage push inflation. To keep this inflation under control, the central banks may implement contractionary policies to increase the cost of borrowing money and encourage savings and investments. These policies appreciate the currency.

A decrease in wages implies that the economy could be contracting due to declining aggregate demand and supply within the economy. If the central banks fear that this might result in a recession, they will implement expansionary monetary policies such as lowering interest rates. These policies tend to depreciate the currency.

Sources of Data

This analysis will focus on Australian wages. The comprehensive indicator of wages is Australian Wage Price Index which measures Wages, salaries, and other earnings, corrected for inflation overtime to produce a measure of actual changes in purchasing power. Thus, it measures the change in the price businesses, and the government pay for labour, excluding bonuses.

The real earnings data is released quarterly by the Australian Bureau of Statistics. The statistics can be accessed here.

Statistics on the global wages by country can be accessed at Trading Economics.

How Real Earnings Data Release Affects The Forex Price Charts

The most recent real earnings data in Australia was released on August 12, 2020, at 1.30 AM GMT. A summary review of the data release can be accessed at the Australian Bureau of Statistics website. The screengrab below is of the monthly real earnings from Investing.com.

As can be seen, the release of the real earnings data is expected to have a moderate volatility impact on the AUD

The screengrab below shows the most recent change in the Australian wage price index. In the second quarter of 2020, the wage price index grew by 0.2%. This growth is slower than the 0.5% increase in the first quarter of 2020. More so, the change in the second quarter was lower than analysts’ expectations of a 0.3% increase.

In theory, this improvement should lead to depreciation of the AUD relative to other currencies.

Now, let’s see how this release made an impact on the Forex price charts of a few selected pairs

AUD/USD: Before the Wage Price Index QoQ Data Release on 
August 12, 2020, Just Before 1.30 AM GMT

From the above 15-minute chart of AUD/USD, the pair can be seen trading in a subdued downtrend before the data release. This trend is evidenced by candles forming just below an almost flattening 20-period Moving Average.

AUD/USD: After the Wage Price Index QoQ Data Release 

After the data release, the pair formed a long 15-minute bearish candle indicating the weakening of the AUD as expected. The weak wages price index data resulted in the selloff of the AUD, which led to the pair adopting a steady trend. This downtrend is shown by the steeply falling the 20-period MA with subsequent candles forming further below it.

Now let’s see how this news release impacted other major currency pairs.

GBP/AUD: Before the Wage Price Index QoQ Data Release on 
August 12, 2020, Just Before 1.30 AM GMT

The GBP/AUD pair traded in a neutral trend before the wages data release. As shown above, the 15-minute candles are forming just around an already flat 20-period MA. This trend indicates that traders were inactive waiting for the data release.

GBP/AUD: After the Wage Price Index QoQ Data Release 

As expected, the GBP/AUD pair formed a long 15-minute bullish candle indicating the selloff of the AUD due to the weaker than expected data. Subsequently, the pair adopted a bullish trend as the 20-period MA steadily rising with candles forming further above it.

EUR/AUD: Before the Wage Price Index QoQ Data Release on 
August 12, 2020, Just Before 1.30 AM GMT

EUR/AUD: After the Wage Price Index QoQ Data Release

The EUR/AUD pair traded in a similar neutral pattern as the GBP/AUD pair before the wages data release. 15-minute candles can be seen forming just around a flattened 20-period MA. Similar to the GBP/AUD pair, the EUR/AUD formed a long 15-minute bullish candle immediately after the wages data release. Subsequently, the pair adopted a strong bullish trend as the 20-period MA rose steeply with candles forming further above it.

Bottom Line

From the above analyses, it is evident that the wages data has a significant effect on price action. Although the wage price index is categorised as a medium-impact indicator, its impact was amplified by the ongoing effects of the coronavirus pandemic. The worse than expected wages data indicated that the Australian labour industry is yet to recover from the economic shocks of Covid-19.

Therefore, traders should avoid having significant positions open with pairs involving the AUD before the release of the quarterly wage price index.

Categories
Forex Fundamental Analysis

Understanding The ‘Inflation Rate MoM’ Macro Economic Indicator

Introduction

The GDP and Inflation rate are two of the most closely watched macroeconomic statistics by economists, business analysts, investors, traders, government officials, and the general population. The inflation rate has an impact on everyone, and no one is exempt from it. Understanding its effect on the currency, economy, living conditions, and how to use it for our analysis is paramount.

What is Inflation Rate, MoM?

Inflation: The increase in the prices of commodities over time is called inflation. It is the rise in the cost of living over time where the purchasing power of the currency depreciates. Inflation erodes the value of the currency, meaning a unit of currency can procure lesser goods and services than before.  Inflation occurs when more currency is issued than the wealth of the country.

Inflation Rate: The percentage increase in price for a basket of goods and services for a particular period is called the inflation rate. It is used to measure the general increase in the cost of goods and services. It is contrasted by deflation, which refers to the appreciation of the currency and leads to decreased prices of commodities. When more currency chases, fewer assets inflation occurs.

Inflation Rate MoM: The general measure of the inflation rate is YoY, i.e., Year-over-Year. It serves as a means to measure how currency has faired over the year against inflation. The rate tells how fastly prices increased. The inflation rates are often low and incremental over time and hence make more sense for a YoY comparison for general use. However, for traders and investors, MoM is more useful for close monitoring to trade currencies.

How can the Inflation Rate MoM numbers be used for analysis?

As inflation continues, the standard of living deteriorates. Inflation is an essential economic indicator as it concerns the standard of living. Hence, it requires much attention to understand and analyze. Inflation can occur due to the following reasons: cost-push inflation, demand-pull inflation, and in-built inflation.

Demand-pull inflation: When too few goods are chased by too much money, we get demand-pull inflation. It is the most common form of inflation. The demand for commodities is so high that people are willing to pay higher prices.

Cost-push inflation: It occurs when there is a limit or constraint on the supply side of the demand-supply equation. A limited supply of a particular commodity makes it valuable, pushing its price higher. It can also occur when the cost of manufacturing or procuring raw materials increase that forces businesses to sell at higher prices.

Built-in inflation: It occurs out of people’s adaptive expectations of future inflation. As prices surge, workers demand higher pay due to which manufacturing costs increase and form a feedback loop. It forms a wage-price spiral as one feeds of another to reach a new higher equilibrium.

Inflation mainly affects middle-class and minimum wage workers as they immediately experience the effects of inflation. Generally, the monthly inflation rates would be less than 1% or 0.00 to 0.20% in general. Such increments can be useful for currency traders to short or long currency pairs by comparing relative inflation rates.

Central authorities are committed to ensuring a low and steady inflation rate throughout. The policies are also drafted to counter inflation or deflation. The central authorities would likely intervene with a loose-monetary policy to inject money into the system and induce inflation when the economy is undergoing a slowdown or deflation. A tight monetary policy (withdrawing money from the economy) would be used to induce deflation to counter hyperinflation.

Impact on Currency

The monthly inflation rates are essential economic indicators for both equity and currency traders. It is an inversely proportional high-impact coincident indicator. An increase in the inflation rate deteriorates currency value and vice-versa. As it has a direct impact on the currency, the volatility induced as a result of significant changes in the inflation rate is also high.

Economic Reports

There are multiple indices to measure the inflation rate. The CPI, Producer Price Index (PPI), Personal Consumption Expenditures (PCE), GDP Deflators are all popular statistics used for measuring inflation in a variety of ways.

The Bureau of Labor Statistics (BLS) of the United States releases the CPI and PPI reports on its official website every month. The GDP Deflator is published by the Bureau of Economic Analysis (BEA) every quarter. The PCE is also published by BEA every month.

Sources of Inflation Rate MoM

BLS publishes the Consumer Price Index (CPI) and Producer Price Index (PPI) on its official website. The data is available in seasonally adjusted and non-adjusted versions, as inflation is also affected by business cycles. A comprehensive and visual representation of these statistics is available on the St. Louis FRED website. The BEA releases its quarterly GDP deflator statistics and monthly Personal Consumption Expenditure (PCE) on its official website for the public. Consolidated statistics of monthly inflation reports of most countries are available on Trading Economics.

How the Monthly Inflation Rate Data Release Affects The Price Charts

For this analysis, we will use the monthly consumer price index (CPI) to measure the rate of inflation. The Bureau of Labor Statistics releases the MoM CPI data in the US. It measures the change in the price of goods and services from the perspective of the consumer. The most recent data was released on August 12, 2020, at 8.30 AM ET and can be accessed at Forex factory here. An in-depth review of the latest CPI data release can be accessed at the BLS website.

The image below shows the most recent changes in the MoM CPI in the US. In July 2020, the US CPI changed by 0.6%, the same increase as that of June.

Now, let’s see how this release made an impact on the Forex price charts.

EUR/USD: Before Monthly CPI Release on August 12, 2020, 
Just Before 8.30 AM ET

From the above 15-minute chart of the EUR/USD, the pair can be seen to be on a steady uptrend before the CPI data release. The 20-period MA in steeply rising with candles forming above it.

EUR/USD: After Monthly CPI Release on August 12, 2020, 
8.30 AM ET

After the data release, the pair formed a long 15-minute bullish candle indicating that the news release negatively impacted the USD. The pair subsequently continued trading in the previously observed uptrend.

Now let’s see how this news release impacted other major currency pairs.

AUD/USD: Before Monthly CPI Release on August 12, 2020, 
Just Before 8.30 AM ET

The AUD/USD pair traded in a subdued uptrend before the data release. The 15-minute candles are forming just around an almost flattening 20-period MA.

AUD/USD: After Monthly CPI Release on August 12, 2020, 
8.30 AM ET

Like the EUR/USD pair, the AUD/USD formed a long bullish 15-minute candle after the news release. Afterwards, the 20-period MA steeply rises as the pair adopted a steady uptrend.

NZD/USD: Before Monthly CPI Release on August 12, 2020, 
Just Before 8.30 AM ET

NZD/USD: After Monthly CPI Release on August 12, 2020, 
8.30 AM ET

Before the data release, the NZD/USD pair traded within a neutral pattern with the 15-minute candles crisscrossing an almost flattening 20-period MA. As observed with the other pairs, the NZD/USD formed a long 15-minute bullish candle after the news release. It subsequently traded in a steady uptrend with the 20-period MA steeply rising.

Bottom Line

In theory, an increasing rate of CPI should be a strong USD, but as observed in the above analyses, a high CPI resulted in a weakening USD. The CPI is often considered a leading indicator for interest rate; hence, a rising CPI is accompanied by a rising interest rate. However, since the US Fed had already indicated that it has no intention of increasing the interest rate, a high CPI implies a depreciating USD. It is, therefore, imperative that forex traders have the Fed’s decision in mind while trading with CPI data.

Categories
Forex Fundamental Analysis

Impact of ‘Employment Rate’ Economic Indicator On The Forex Market

Introduction

Employment is crucial for consumer spending, which makes more than two-thirds of the GDP for many countries. Understanding the employment rate and the cascading effect it has on the economy is paramount for fundamental analysis. The factors affecting the employment rate and business cycle patterns all inherently impact economic growth and currency valuation. Hence, understanding employment as an economic indicator will strengthen our analysis.

What is Employment Rate?

Employment Rate:  It is defined as the ratio of employed to the total available labour force. Here the labour force is defined as the sum of employed and unemployed persons. It is also considered as a measure of the extent to which the labour force is being used.

Unemployment is a state where an individual is actively searching for employment but cannot find work.

Unemployment Rate: It is defined as the percentage of unemployed people to the available labour force. It is the other half of the employment rate. Employment and unemployment rate combined should yield results as 100% as it equals the total available labour force.

How can the Employment Rate numbers be used for analysis?

Employment and unemployment can be considered as the two sides of the same coin. We can derive our fundamental conclusions from either direction. Employment Rate is essential for our analysis because it has a direct and cascading impact on consumer spending. In the US, consumer spending accounts for about 70% of the total GDP.

A high employment rate indicates that more people in the labour force have income that they can spend on purchasing goods and services. When consumer spending is on the rise, businesses flourish, leading to better wages, or even more employment. Overall, employment in one sector has an indirect positive effect on dependent sectors and a direct positive effect on the economy.

The Government is also politically committed to ensuring a low unemployment rate; otherwise, citizens will not favour them in the next elections. By providing proper support to local businesses, the Government can increase employment in the short run.

A high unemployment rate is very damaging to the economy. As more people are unemployed, there is a direct negative effect on consumer spending. In this scenario, also the cascading effect works and makes the situation worse. It also hurts the employed people.

Increased unemployment in the economy can bring down the employed morale, making them feel guilty for being employed while their colleagues are unemployed. It can also make employed people feel less secured and discourage their spending habits, and they may end up saving for a rainy day. Employed people may feel lucky enough to have a job that inhibits them from applying for better opportunities amid high unemployment.

Employment and Unemployment rates can also help investors to keep a pulse on the health of the economy. Overall it is essential to make sure the employment rate is always high and does not take a dip. Even when the unemployment rate rises linearly, it has an exponential impact on economic growth, and hence the central authorities try to avoid it at all times.

It is also essential to understand that employment rates are sensitive to business cycles in the short run. Hence, seasonally adjusted versions of the same are more useful for analysis. In the long run, the employment rates are significantly affected by government policies on higher education and income support. Policies that focus on the employment of women and disadvantaged groups also help increase the employment rate.

Both developing and underdeveloped countries’ governments have to focus on education policies and employment opportunities for their labour force if economic growth is the primary concern. Literacy and higher education in underdeveloped and developing nations have helped the economies grow stronger year-on-year.

Employment rates are coincident indicators and can also be used to predict or confirm oncoming recessionary or recovery periods, if any. The onset of a recession is accompanied by a massive unemployment rate or decreased employment rates. Hence, despite the propaganda of the media and Government, we can use employment data actually to confirm whether the economy is growing or stagnating. Accordingly, during recovery periods, employment rates start on a recovery trajectory back to its previous normal.

Impact on Currency

As an increase in employment rate points towards a growing economy, a high employment rate is good for the GDP and the currency. Hence, the employment rate is a proportional coincident indicator. An increase or decrease in employment rate is suggestive of improving or deteriorating the economy, respectively.

The forex market watches the unemployment rate more closely than the employment rate itself. Significant changes in the employment rate or the unemployment rate tend to have a considerable impact on market volatility. Still, generally employment rate in itself is a low impact indicator compared to the unemployment rate.

Employment change, initial jobless claims also precede unemployment rates, and the desired effects are already factored into the market before the employment rates are released. Hence, overall it is a low impact indicator.

Economic Reports

In the United States, the BLS surveys and tracks monthly employment and unemployment within the country. It classifies them based on geography, sex, race, industry, etc. The Employment Situation report is also published by the BLS, and it goes as far back as the 1940s. It is released by BLS on the first Friday at 8:30 AM Eastern Standard Time every month.

Sources of Employment Rate

The US BLS publishes monthly employment and unemployment reports on its official website. We can also find the same indexes and statistics of various categories on the St. Louis FRED. We can also find employment rate statistics published by the OECD countries here. Consolidated reports of employment rates of most countries can also be found in Trading Economics.

How Employment Rate News Release Affects The Price Charts

As we have already established, an increase or decrease in the employment rate can be used to gauge whether the economy is performing well or poorly. For forex traders, it is therefore imperative to understand how the news release of this macroeconomic indicator will impact the price action on various currency pairs.

In the US, employment reports are released monthly, usually on the first Friday after the month ends. The latest, expected, and all historical figures are published on the Forex Factory website. We can find the most recent release here. Below is a screengrab of the US unemployment rate from the Forex Factory website. On the right, we can see a legend that indicates the level of impact the Fundamental Indicator has on the corresponding currency.

As shown, the unemployment rate is a high impact indicator. The snapshot below shows the change in the US unemployment rate as released on August 7, 2020, at 1230GMT. For July 2020, the unemployment rate declined from 11.1% to 10.2%, beating the 10.5% decline forecasted by analysts.

Now, let’s see how this news release made an impact on the Forex price charts.

EUR/USD: Before Employment Data Release August 7, 2020, Just Before 1230GMT

The 30-minute EUR/USD chart above shows the market is on a downtrend from 0200 to 1200 GMT with the candles forming below the 20-period Moving Average. More so, the market was trading within a narrow price channel of between 1.1850 and 1.1810, indicating a calm market with traders waiting for the latest employment data to gauge the economic recovery.

EUR/USD: After Employment Data Release August 7, 2020, 1230GMT

As can be shown on the chart above, immediately after the news release, we can observe a sudden downward spike with a retraction. This spike indicates the market is having mixed reactions to the positive employment news hence the strong USD.

After the initial spike, the market can be seen to ‘absorb’ the positive news. The pair adopted a bearish outlook with the price breaking and staying below the earlier observed 1.1810 resistance level.

Since the pair had not shown any unexpected sudden swings before and after the new release, trading the news would have been profitable. For such a high impact economic indicator, it is advisable to open positions after the news release to avoid being caught on the losing end of the trend.

Now, let’s quickly see how this new release has impacted some of the other major Forex currency pairs.

GBP/USD: Before Employment Data Release August 7, 2020, Just Before 1230GMT

GBP/USD: After Employment Data Release August 7, 2020, 1230GMT

The GBP/USD pair showed a similar trend as the one observed with EUR/USD. The pair can be seen to have traded within a narrow price channel of 1.3122 and 1.3071 from 0700 to 1200 GMT. After the economic data release, the pair similarly had a sudden spike. It later adopted the same bullish stand as the EUR/USD pair, with price breaking and trading below the observed resistance level.

AUD/USD: Before Employment Data Release August 7, 2020, Just Before 1230GMT

GBP/USD: After Employment Data Release August 7, 2020, 1230GMT

Similar to the EUR/USD and the GBP/USD pairs, the AUD/USD traded within a price channel of 0.7221 and 0.7196 and no unexpected spikes before the news release. After the news release, a sudden spike can be observed with an accompanying retraction, and later the pair adopted a bullish stance breaking below the observed resistance level.

From the above analysis, the subdued market volatility before the release of the employment data and the subsequent volatility, it is evident that the employment rate is high impact indicator anticipated by forex traders.

Categories
Forex Videos

Everything You Need To Know About The Forex Market Right Now!

When the fundamentals lag behind the technicals

In recent weeks you will have noticed that the financial markets are in complete turmoil, with extreme volatility in all sectors, but especially in the oil markets more recently, and where stock markets seem to be propped up by hope more than fundamentals; after all, many indices have been rallying while the world economies have ground to a halt. And where volatility has also spilled over into the currency market.

At the end of March 2020, we saw huge moves in currency pairs including a spike in cable, which only a few short weeks ago was trading at 1:14 and yet has recently spiked up to 1.2640, and where fundamentals for the British economy do not support this huge increase in the value of the pound.

So what is going on? Well, one thing is for sure, British economic data releases are not really showing the true extent of the fallout of the Covid-19 pandemic yet. And so, the fundamentals are lagging the technicals. In other words, the markets are being driven by technical analysis rather than fundamental analysis, in some circumstances.
Something that has stuck out like a sore thumb with regard to fundamentals lagging technicals is the USDCAD pair’s recent choppy price action. Let’s drill down in a little more detail to try and establish what is going on.


Before we do that, let’s take a look at the West Texas Intermediate or WTI, price action chart of the last 12-months. WTI is the benchmark for crude oil, and from 2019 to 2020, the price of a barrel of crude oil ranged between $50 to $66. West Texas Intermediate is a specific grade of crude that is used around the world and is seen as a benchmark in pricing oil.


In this chart, we can see that in the same 12-period, USDCAD ranged between 1.2966 to 1.3575. Obviously, this was just before the virus pandemic. But in case you didn’t know, Canada is the fourth-largest producer and fourth-largest exporter of oil in the world, with 96% of Canada’s oil exports going to the United States.
Production and exportation of all products, including gas and electricity in Canada, contributed to around 170 billion in Canadian Dollars to it’s 1.8 trillion dollars of gross domestic product, which equates to around about 10% of GDP. And so oil is big business in Canada. And anything that upsets the production and exportation of oil will have a dramatic effect on Canada’s gross domestic product, and a spillover will, of course, be the value of the Canadian dollar, where we would expect price action volatility.
In fact, Canada has huge reserves of crude oil in Alberta’s Oil Sands and large deposits off the coast of Atlantic Canada. Oil is such a big business here, including exploration, drilling, production, field processing, as well as storing and the transportation of oil.

The Canadian dollar is sometimes referred to as the Loonie because of the loon bird, as depicted on the Canadian $1 coin. The Canadian dollar is one of the major currency pairs. It is widely traded in the financial markets and has been subject to extreme volatility during the current crisis.
However, we have also noticed that the USDCAD price action has become out of kilter recently, and this can be attributed to price action falling out of line with fundamental analysis and where traders have been preferring to trade on the basis of technical analysis. But be warned, fundamental reasons will catch up eventually and make the relevant corrections.
let’s set out our reasoning behind this theory:


In this daily chart of the USDCAD, pair we can see that the price action, which had previously been contained within the 1.2966 to 1.3575 area, has spiked higher to reach a multi-year high at 1.4664 on the 19th March 2020. There are several reasons for this, including the perceived Covid-19 related hit to the Canadian economy, which affected and devalued the Canadian dollar.


But if we take a look at this chart of WTI, we can also see that the 2019 to 2020 price of a barrel of crude oil range of $50 to $66 has spiked lower to $21 per barrel and therefore this would have been the main contributor for the Canadian dollar spiking higher because traders envisaged that the low price of oil, which is attributed to a global slowdown and a lack of demand, would devalue the Canadian dollar and that is exactly what happened; Oil price lower, Canadian Dollar value lower.


Let’s move forward to 30th April where the price of oil has continued to collapse, at one point going into negative territory to – $40 a barrel for WTI for May’s futures contract, which is the first time in history that this has ever happened. But at this point, we can see that price has somewhat recovered to $11 dollars per barrel. And we might, therefore, expect that the Canadian dollar has also weakened.


However, on the same day of the oil low, 30th April, the Canadian dollar has rallied higher in value, with the USDCAD showing a low of 1.3843, its highest level in six weeks. Before moving higher again to 1.4100 where it currently sits.
While some of the increase in the value could have been attributed to the oil price coming off of its low, especially the minus figures, on hopes of a fuel demand recovery, the prospects of further economic stimulus by the Canadian government, and the gradual reopening of western economies, we can be in no doubt that there has been a lag in fundamental analysis, and where traders have preferred to move with technical analysis, during the period of 19th March to 30th April.
However even if things began to get back to normal, this is going to be an extremely long process, and yet many oil-producing countries such as Saudi Arabia and Russia keep pumping out oil in a high volume regardless of the slowdown in global economic growth and where the

surplus of oil in storage all around the world is not likely to be consumed until 2022, according to some analysts.
Therefore no matter what type of recovery we see, and it won’t be rapid until there is a cure for Covid-19, on the basis of supply and demand, we will see low oil prices for a long time to come. Therefore we should expect the US dollar CAD to continue to rise, perhaps to previous highs of $1.46, as the fundamentals catch up with the technicals.

Categories
Forex Fundamental Analysis

‘Labor Force Participation Rate’ & It’s Impact On The Forex Market

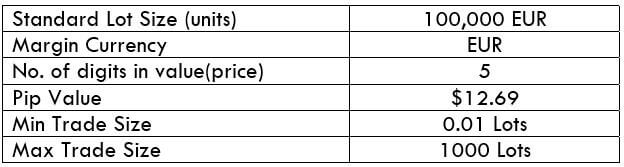
What is the Labor Force Participation Rate?

Labor force participation rate can be defined as the group of the population who are between the age of 16 and 64 in the economy that is currently employed or unemployed (seeking employment). The other set of the population, including the ones who are still undergoing studies, people who are above the age of 64, and the housewives, do not fall into the labor force participation rate. As far as the formula for this concerned, it is the sum of all the employed people and the people seeking employment divided by the total noninstitutionalized, civilian working-age population*.

LFPR = Labor Force / Civilian Non-Institutionalized Population

Where Labor Force = Employed + Unemployed

Working-age population – this is the population of people in an area that is considered to be capable of working in a predetermined age range criterion.

More about Labor Force Participation Rate

The LFPR is a measure to evaluate the working-age population in an economy. This working-age population is a dataset of only those people who are between the age of 16-64.

Since the LFPR involves the calculation of the number of employed and unemployed people, this indicator is closely related to the unemployment rate. The LFPR is a vital metric when the economy is under recession or is slowing down. This is when the people get their eye caught into the unemployment data.

When the market is under recession, the labor force participation rate tends to go down. The reason to account for it is simple. At the time of recession, the economic activity is feeble, which results in fewer jobs across the nation. This, in turn, discourages the people from focusing on their employment and hence leads to a lowering of the participation rate. In addition, the participation rate is an important factor in understanding the unemployment rate.

The group of people who are not interested in working or are in some sort of insignificant type of job is not included in the participation rate. But, when it comes to the understanding of the unemployment rate in detail, we do take the participation rate into account. A population that has a majority of them who are aging, it can have a negative impact on the economy of any country. And this is when the labor participation rate comes into play. If the value is on the higher side, this is a good sign for the economy. But, for smaller values, the countries need to be cautious of their economies. This is the reason, both participation rate, as well as the unemployment rate, must be looked carefully into and simultaneously to get a clear understanding of the overall employment status in the economy.

What do the trends have to say?

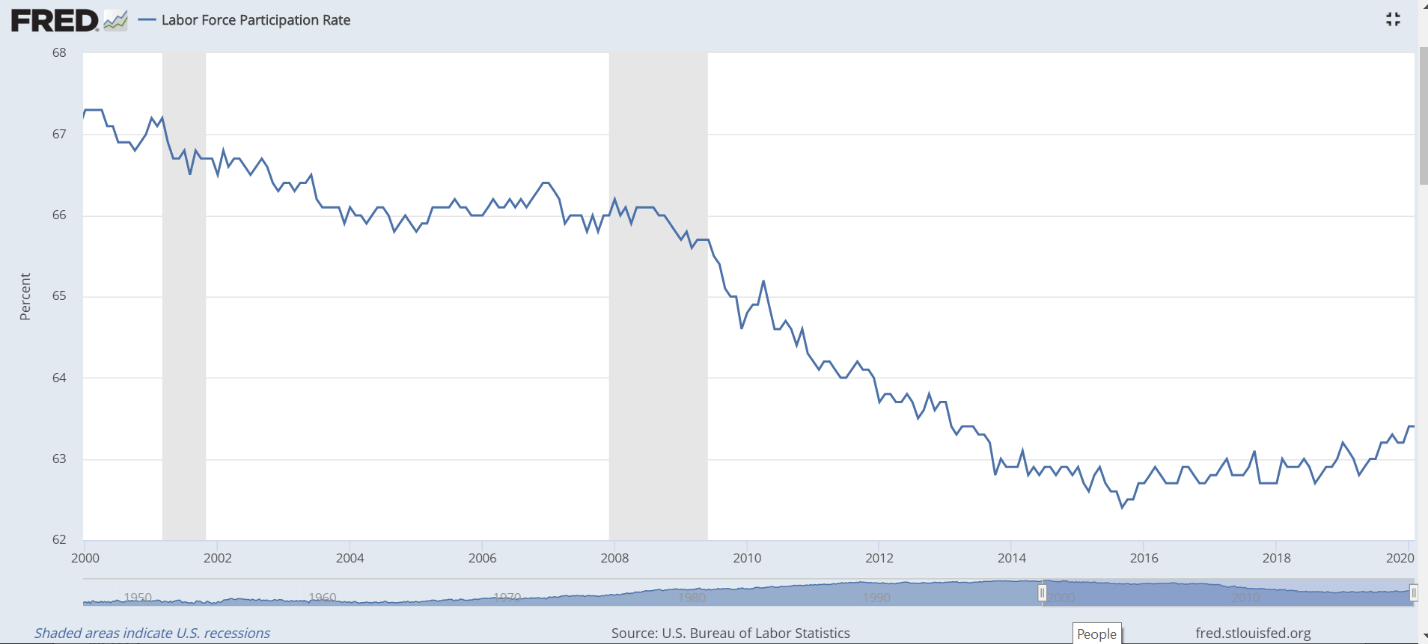
Consider the above chart representing the labor force participating rate in the U.S. for two over two decades from 2000 to the present year. Defining as per the chart, the labor force participation rate is the population of people who are able to work as a percentage of the total population.

Going behind the specified period, the rate increased from 1960 to 2000, as women came into the picture of the workforce. At the beginning of 2000, the rate peaked at 67.3 percent. But, due to the recession that happened the very next year, the rate dropped to 65.9 percent by April 2014. Similarly, the recession in 2008, lowered the labor force participation rate even more to 62.3 percent by October 2015. In the coming years, though there wasn’t any significant financial crisis, the rate had risen only to 62.9 percent.

The primary implication to drop could be the falling of the supply of workers. So now, fewer works should manage to negotiate for higher wages. But things turned out to be different. The income inequality increased, and as a result, the average income workers were hit hard. And understandably, they could not put up a competition with robots. Moreover, businesses replaced capital equipment instead of hiring more labor as they found it be cost-effective.

The consistent falling rates of the labor force participation can be boiled to the four points listed below:

  • An aging population
  • Long-term unemployment, leading to structural unemployment
  • Increased opioid dependency
  • Sickness to the extent that they cannot work

How the ‘Labor Force Participation Rate’ Impacts the Economy?

The countries whose population has a skilled and mobile labor force that can adapt to the changing business needs, tend to have a good labor force and stable participation rate.

Investment in human capital plays a role in the valuation of the LFPR. When countries invest more in human capital and stand better than the crowd (rest of the countries), their economy tends to stay above the average mark.

Labor mobility acts as a great add-on to the labor force as well as the economy. The nations with mobile workers have the skill set to negotiate workers, change employers, and start new businesses. The U.S. is one such example of the same. They are much better than other developed countries when it comes to moving to find a job.

Impact of Labor Force Participation Rate on the Currency

The labor force participation rate determines the population in an economy who are employed and unemployed in a certain predefined age range. And this goes hand in hand with the unemployment rate of an economy. Hence, we can conclude that the impact of the currency from LFPR correlates with the unemployment rate.

A rise in the labor force participation rate implies an increase in the participation rate. And this is a positive sign for the economy of a country. Thus, an increase in the participation rate can lead to an appreciation in the value of a currency.

Contrarily, a downfall in the labor force participation rate implies that the labor force is dropped due to the bad performance of an economy. This typically happens during recession times. Therefore, to sum it up, a decline in the LFPR could indicate a negative effect on the currency.

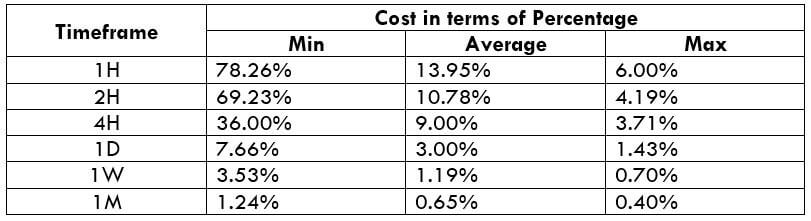
Reliable Sources for Statistics on Labor Force Participation Rate

Firstly, the frequency of release of reports on the Labor Force Participation Rate is 30 days. All the data is expressed as a percent.

Below is a list of links through which one can access the participation rate data for different countries. The information that can be retrieved from the sources are as follows:

  • Actual, previous, highest, and lowest data
  • Graphical statistics for a period of more than 25 years
  • Forecast

USD | GBPEUR

For the rest of the countries, you may click the link here to access the reports.

Impact of Labor Force Participation Rate Announcement on the Price Charts

Now that we’ve understood pretty much on the theoretical concepts of Labor Force Participation Rate, let’s get a little technical and see how the reports of this economic indicator affect the prices of the currency. Basically, we will be seeing the movement in the charts before the release of the news and then observe its effects after the release of the news.

As already mentioned, this data is released on a monthly basis for most of the countries. For our discussion, we shall be considering the LFPR of the United States. That is, we will be analyzing how the LFPR affects rates of the U.S. Dollar.

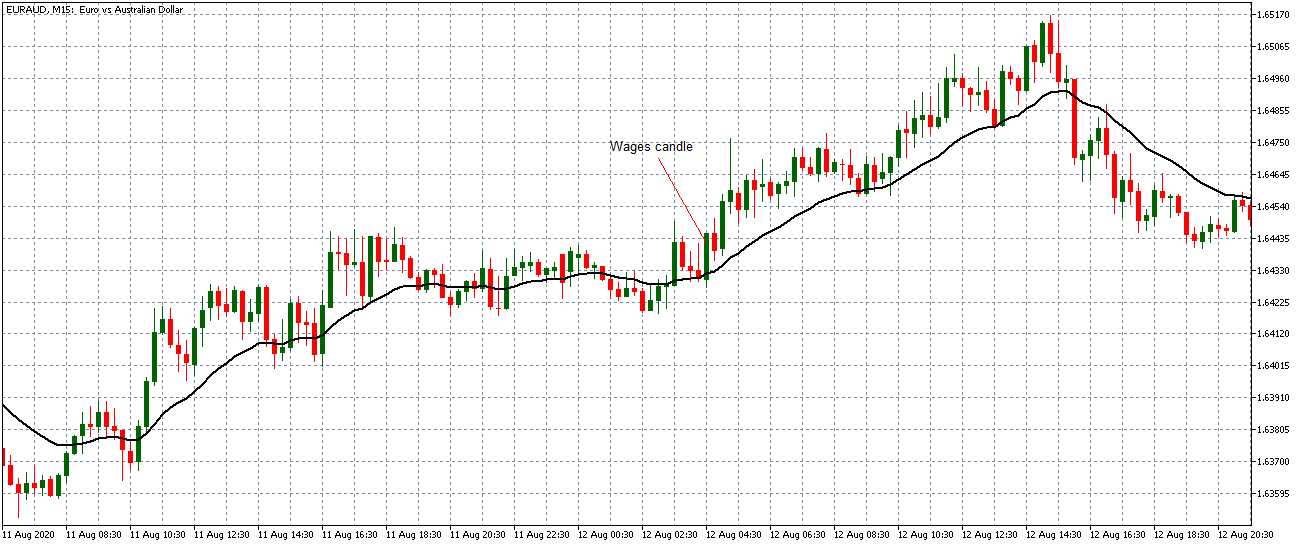
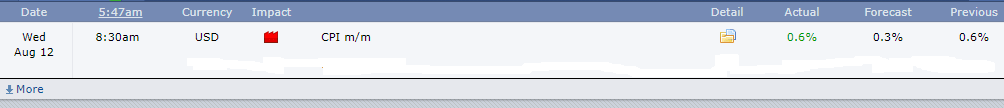
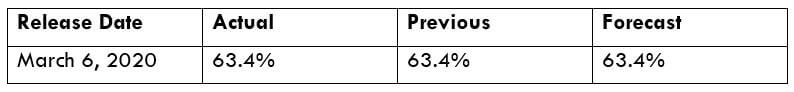
Consider the below report released by the U.S. Bureau of Labor Statistics. The Labor Force Participation Rate in the United States has remained unchanged at 63.4 percent in February 2020. Note that, though the data is released in March, in reality, it is the reports for the month of February.

Now that we know the actual value is the same as the previous data, as well as the forecasted data, let us examine how it has affected the prices of the U.S. Dollar.

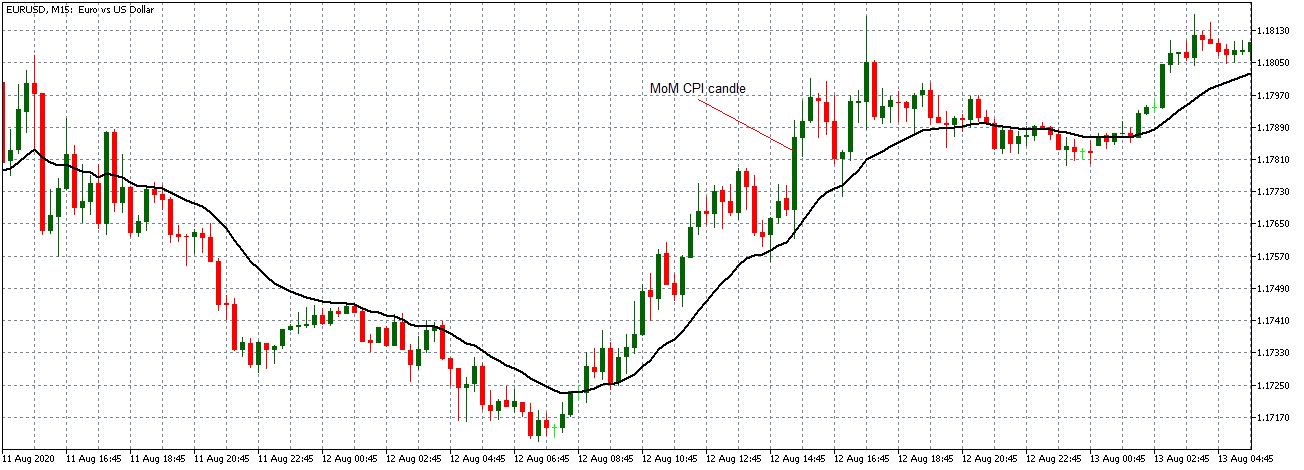
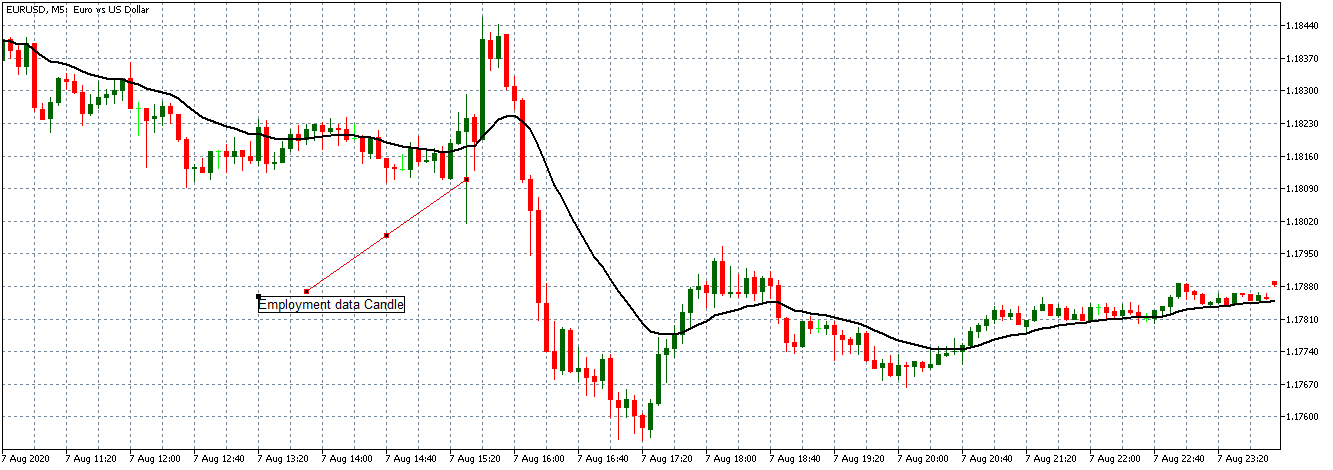
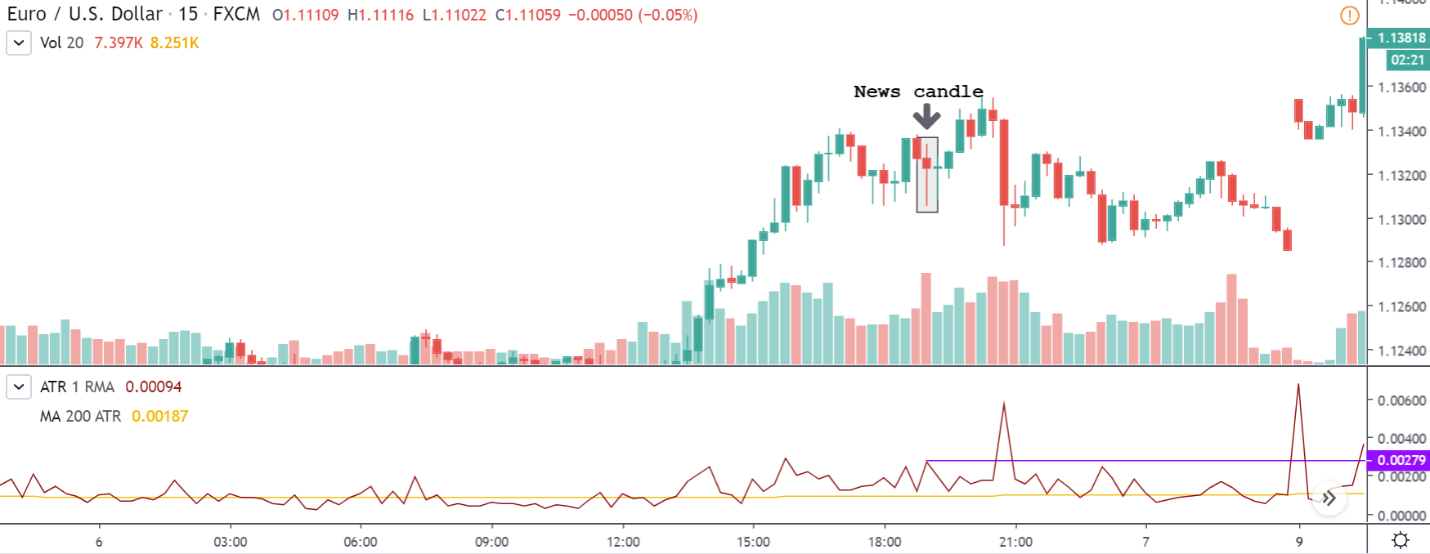
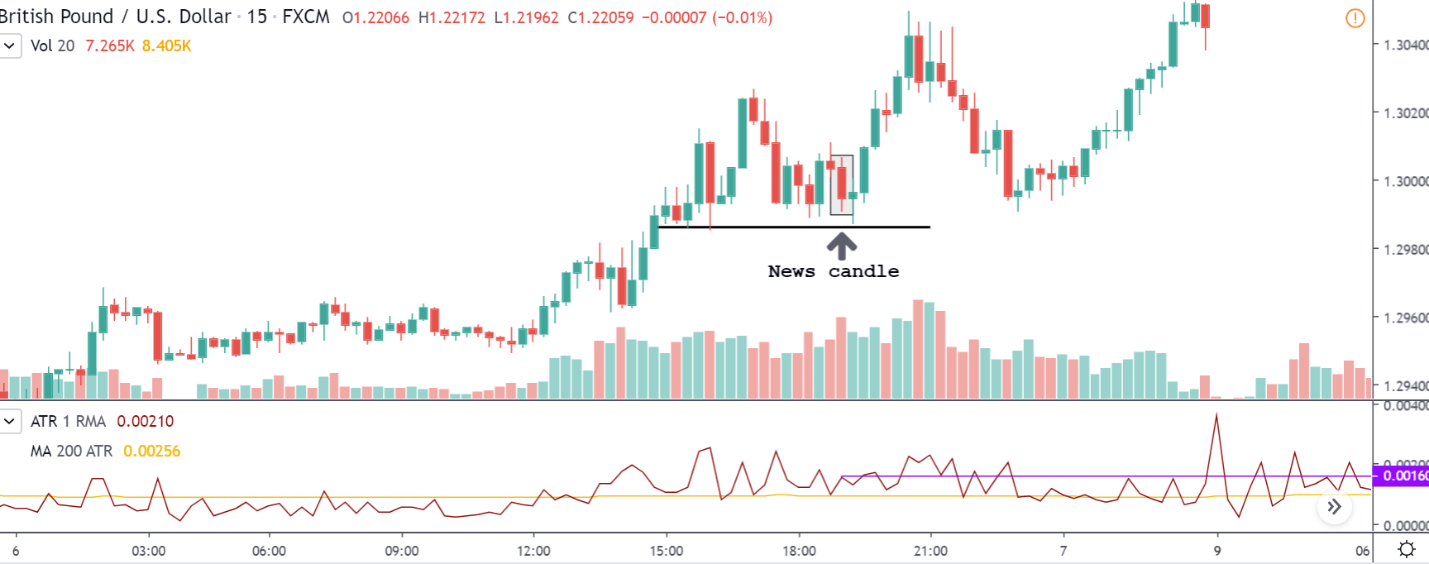
EUR/USD | Before the Announcement (March 6, 2020)

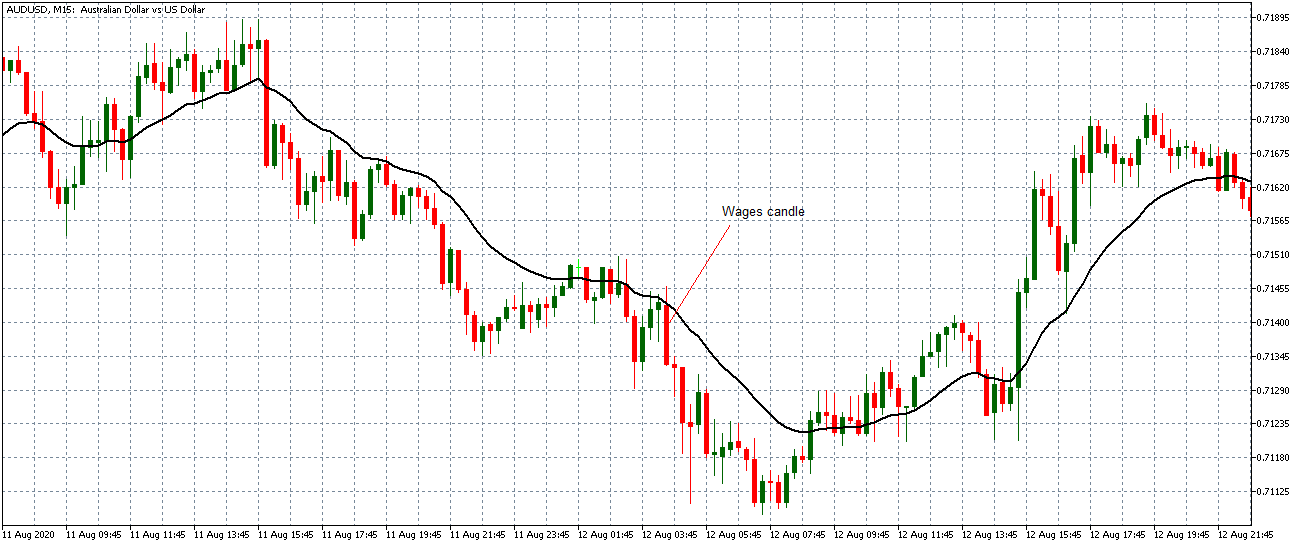
Consider the EUR/USD chart on the 15min timeframe. At this point in time, we can see that the market is in an uptrend and is presently moving sideways. Let’s see how the price is affected when the news comes out the next candle.

EUR/USD | After the Announcement (March 6, 2020)

Below is the same chart, but after the announcement of the news. The news candle is clearly represented in the chart as well.

We can see that after the news was released, the candlestick left a small wick on the top and a long wick on the bottom and closed a few pips below the open price. We can infer that the news didn’t much create a drastic move in the market. This is because the actual rate was the same as the previous rate. However, the volatility of the market showed an increase. The ATR indicator indicated that the current market volatility was ten pips. But, the volatility after the news release jumped to 27 pips. The volume too increased after the release of the news, which can be seen at the bottom of the chart.

This also means that the news could not really affect the current trend of the market. So, traders can still look out to buy entries after the release of the news. For instance, the wick in the bottom could be interpreted as the strength of the buyers in the market.

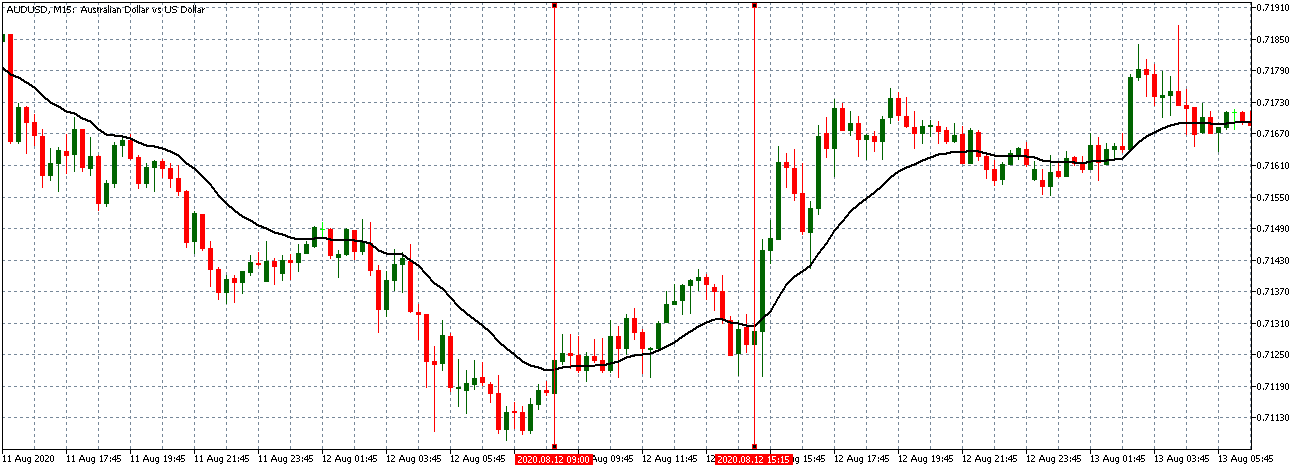
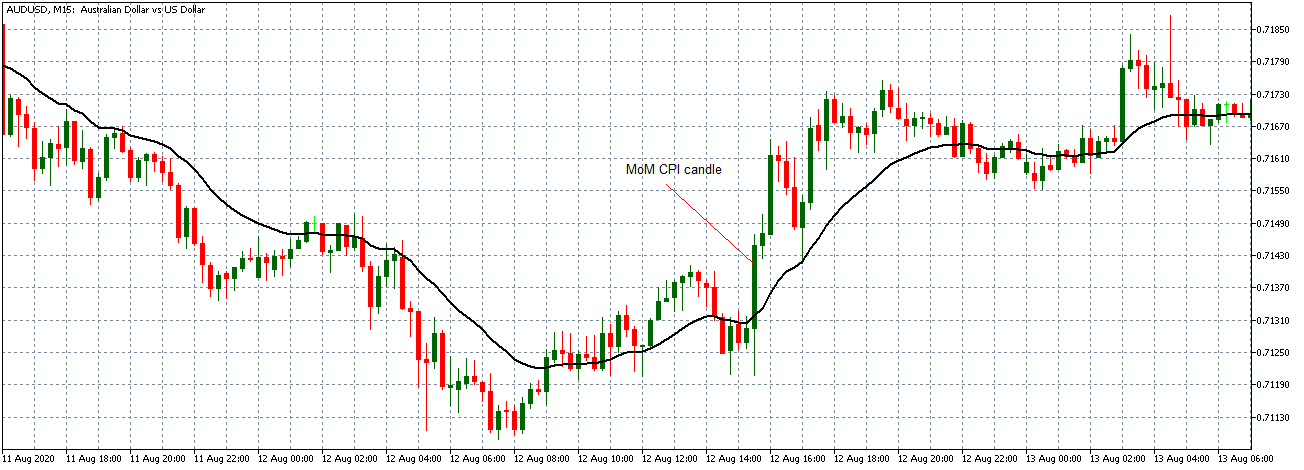
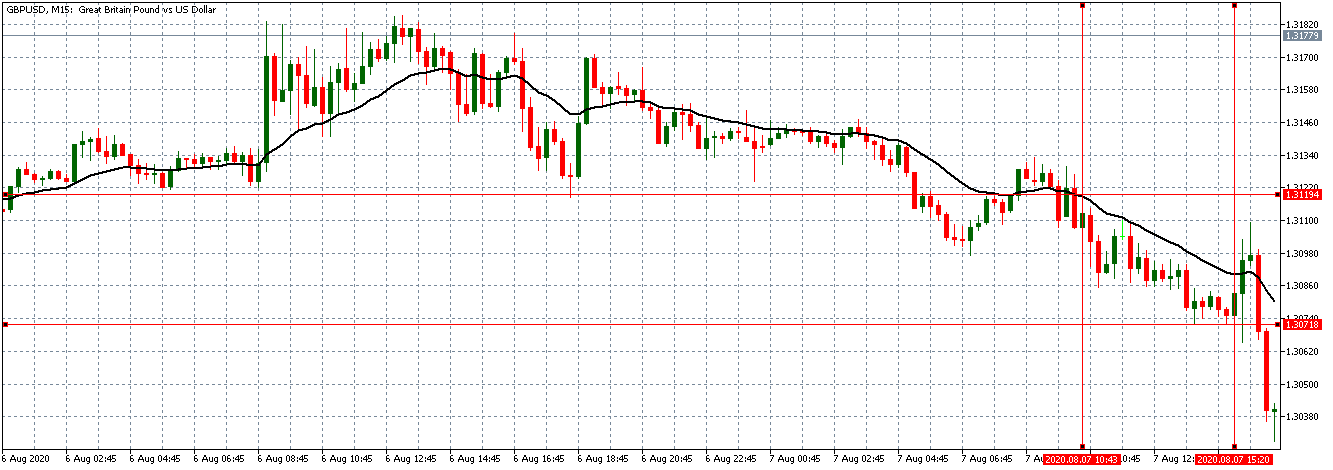
GBP/USD | Before the Announcement (March 6, 2020)

Below is the chart of GBP/USD on the 15min timeframe. The market is in an uptrend and currently is at the support (black line). We need to see if the news will respect the support or will break through it.

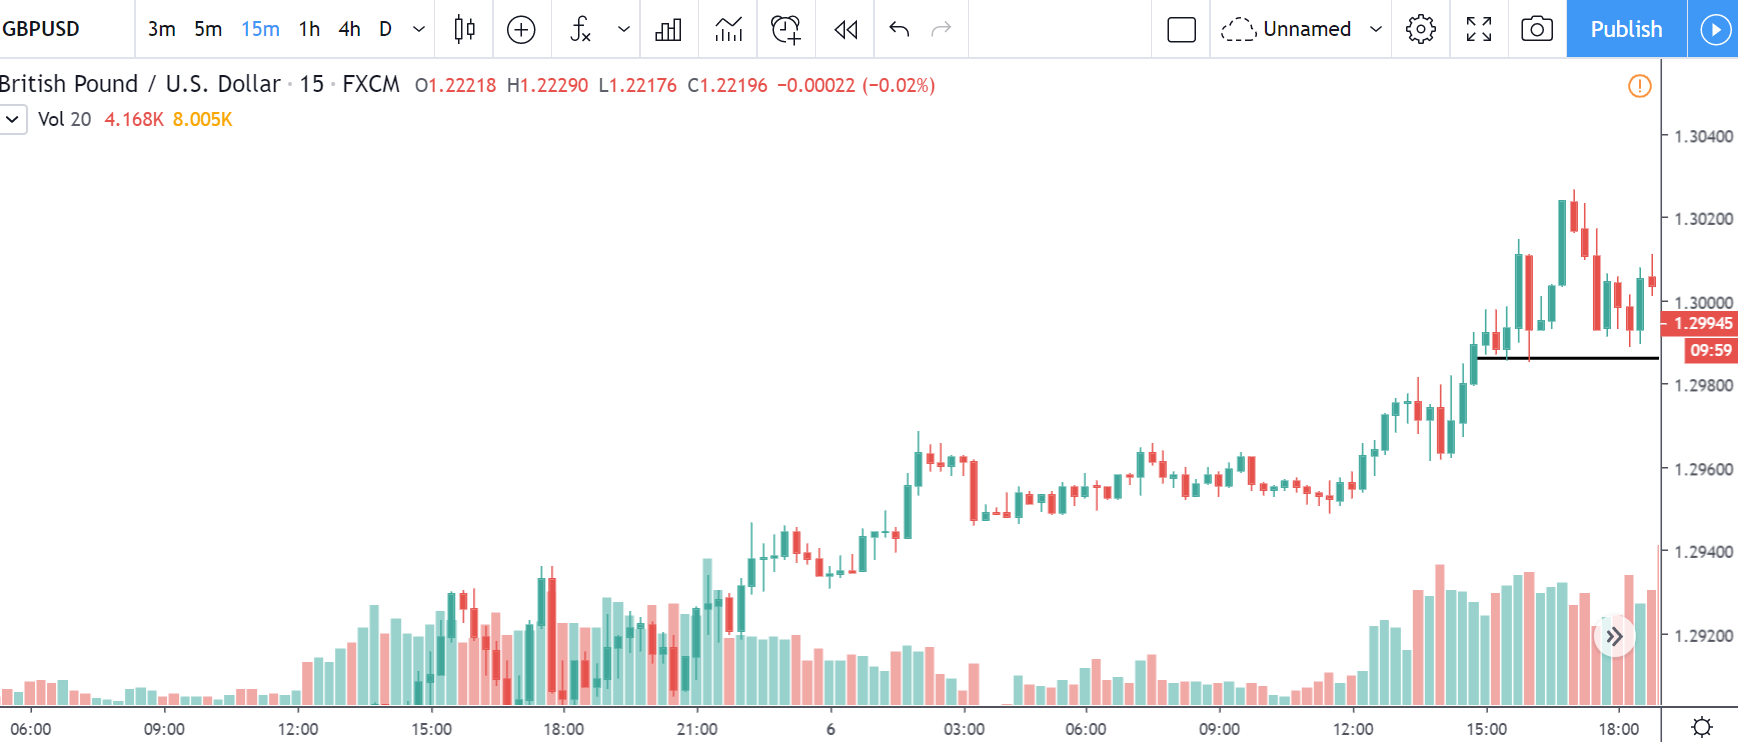
GBP/USD | After the Announcement (March 6, 2020)

Below is the same chart of GBP/USD after the announcement of the news. We can see that the news was positive for the USD. However, the USD wasn’t strong enough to break below the support. And this was because the actual value was the same as the previous value.

Coming to the volatility, the average volatility was ten pips, and when the news came out, the volatility increased 16 pips, which was decently above the average value. There was a slight increase in the volume as well.

As far as trading this pair is concerned, we can prepare to go long when a doji-like candle was formed at the support area.

Conclusion

Labor Force Participation rate is that economic indicator that measures the workforce of a country by considering a specific age group. As mentioned, the LFPR and the unemployment rate are closely related to each other. That is, for assessing the unemployment rate, having an idea about the participation rate is quite vital. The labor force participation rate has a good weightage in the valuation of the economy of a nation. It has its effects on currencies as well. So, this indicator turns to be handy for economists as well as traders and investors.

Categories
Crypto Guides

Understanding The Fundamentals Of Blockchain

Introduction

We have understood the basics of DLT in the previous guide. In this article, let’s see one of the most popular applications of DLT, which is known as the blockchain. Many say that the blockchain technology is the new internet. By allowing information to be distributed not copied and tampered, blockchain did create the backbone of a new type of internet. Initially, blockchain found its application only in digital currencies, but today’s tech has now found other potential uses for the technology.

Blockchain, a distributed ledger, is a time-stamped series of immutable records of data that is controlled by different nodes in the network and not owned by any single entity. The records are stored in blocks that are secured and bound to each other by cryptographic principles.

The blockchain technology is completely decentralized. There is no central regulatory body on the blockchain network. The ledger on the blockchain is shared and immutable. The information in it is open to anyone to access. Hence, the blockchain is transparent in nature, and everyone involved in the network is accountable for their actions.

How does the Blockchain function?

In a blockchain, information is passed from one source to another in a fully automated and secure manner. When a party makes a transaction via blockchain, the peers in the network create a block for this transaction, which is secured using cryptography. This block is verified by several nodes (computers) distributed across the network. Once the block is successfully verified, it is added to the chain. Each block in the chain has a unique record with a unique history. Falsifying a single record means to falsify millions of instances in the chain. This is virtually impossible.

Features that hold Blockchain Strong

There are three properties of blockchain technology, which have helped it gain widespread applause.

  • Decentralization
  • Transparency
  • Immutability

📌 Decentralization

Before the appearance of Bitcoin, the public was used to only the centralized systems. And the idea of centralized systems was simple. There is a centralized entity that stores user’s information. To get this information, the user must interact solely with this entity. The main drawback of centralized systems is the absence of transparency.

Imagine if the centralized system was taken out. Everyone in the network can now view the data. It simply eliminates the existence of a third party. The data now can be shared one to one without any intermediary. This will eradicate the costs to be paid to the intermediaries as well. And this system is referred to as a decentralized network, making it a great property of the blockchain.

📌 Transparency

Transparency is another property that makes blockchain much appealing. Some say that blockchain is transparent, while some say it is private. Though it may sound counter-productive, blockchain is both transparent and private. When a transaction is made between two parties, one cannot see ‘who’ has sent it to ‘whom.’ Instead, we will be able to see something called the hash of a transaction. And this will be visible to everyone. Hence, this brings both transparency and privacy in the blockchain.

📌 Immutability

The blocks in the blockchain are immutable. It is impossible to tamper with. Technically speaking, blockchain is a linked list whose structure contains data and a hash pointer to the next block, hence creating a chain. This chain makes blockchain immutable.

For instance, let’s say a hacker hacks block 3 in the chain and tries to change the data. But, a slight change in the block will affect the other blocks drastically. That is, a change in block 3 will change the hash stored in block 2. This continues up to block 1. This will change the entire blockchain, which is impossible. Hence, making blockchain immutable.

Above are just the primary properties of the blockchain. There are other beneficial properties too, which is the reason blockchain has still sustained and is developing at a rapid pace.

Categories
Forex Assets

What Should You Know About EUR/GBP Forex Pair Before Trading

Introduction

EURGBP is the abbreviation for the currency pair Euro area’s euro against the Great Britain pound. This pair, unlike the EURUSD, USDCAD, GBPUSD, USDCHF, etc. is not a major currency pair. This pair is classified under the minor currency pairs and the cross-currency pairs. In EURGBP, EUR is the base currency, and GBP is the quote currency.

Understanding EUR/GBP

The current market price of EURGBP depicts the required number of pounds to purchase one euro. For example, if the value of EURGBP is 0.8527, then one needs to pay 0.8527 pounds to buy one euro.

EUR/GBP Specification

Spread

Spread in trading is the difference between the bid price and the ask price. The spread is not the same on all brokers but depends on the type of account. It also varies depending on the volatility of the market. An average spread on an ECN account and an STP account is shown below.

Spread on ECN: 0.8 | Spread on STP: 1.5

Fees

On trade a trader takes, there is some fee associated with it. Fees, again, depends on the type of account. There is no fee on STP accounts, but few pips on ECN accounts.

Slippage

When a trader executes a using the market order, they don’t really get the price they had intended. There is a small pip difference between the two prices. And this difference between the prices is referred to as slippage. The slippage is usually within 0.5 to 5 pips.

Trading Range in EUR/GBP

Understanding the volatility of the market is essential before opening or closing a position. It shows how much profit or loss a trader will be on a particular timeframe. For example, if the volatility is on the 4H is 10 pips, the trader can expect to gain or lose $1269 (10 pips x 12.69 value per pip) in a matter of about 4 hours.

The table below illustrates the minimum, average, and maximum pip movement on the 1H, 2H, 4H, 1D, 1W, and 1M timeframe.

EUR/GBP PIP RANGES

Procedure to assess Pip Ranges

  1. Add the ATR indicator to your chart
  2. Set the period to 1
  3. Add a 200-period SMA to this indicator
  4. Shrink the chart so you can assess a large time period
  5. Select your desired timeframe
  6. Measure the floor level and set this value as the min
  7. Measure the level of the 200-period SMA and set this as the average
  8. Measure the peak levels and set this as Max.

EUR/GBP Cost as a Percent of the Trading Range

An application of the volatility would be the determining of cost on each trade. As in, the ratio between the volatility and the total cost on each trade is calculated and is expressed in terms of percentage. The percentage depicts the cost for a particular timeframe and volatility. The comprehension of it shall be discussed in the subsequent section.

ECN Model Account

Spread = 0.8 | Slippage = 2 | Trading fee = 1

Total cost = Slippage + Spread + Trading Fee = 2 + 0.8 + 1 = 3.8

STP Model Account

Spread = 1.5 | Slippage = 2 | Trading fee = 0

Total cost = Slippage + Spread + Trading Fee = 2 + 1.5 + 0 = 3.5

The ideal way to trade the EUR/GBP

With the above two tables, let us figure out the ideal way to trade this currency pair. Note that the higher the percentage, the higher is the cost on a trade and vice versa. It is evident from the chart that the percentages are highest for the minimum column and lowest for the max column. In other words, the cost is high when the volatility of the market is low, and the cost is low when the volatility is high. So does this mean it is ideal to trade when the volatility is high? Well, that’s not the right approach to it, as trading in high volatility is risky. So, it is ideal to take trades during those times when the volatility is around the average range. Doing that will ensure marginal cost as well as decent cost. For example, a 4H trader must take trades during those occasions when the volatility is around 20 pips.

Note: One can apply the ATR indicator to determine the current volatility of the market.

Another feasible way to reduce costs is by canceling out the slippage cost. Cancel slippage costs can simply be done by placing limit orders. With limit orders, the slippage automatically becomes 0.

The difference in the cost percentage when the slippage goes to zero is illustrated as follows.

We hope you find this Asset Analytics informative. Let us know if you have any questions in the comments below. Cheers!

Categories
Crypto Guides

Beginners Guide to Cryptocurrency Mining

Introduction

There is a significant difference in how cryptocurrencies and fiat currencies are generated and issued to the ecosystem. Fiat currencies are created and printed by the government bodies in response to orders by the state authority. At the same time, cryptocurrencies are issued to the public by going through the blockchain network according to a preset algorithm. There are different schemes assigned for mining, such as the Proof of Work, Proof of Stake, Proof of Authority, etc. These are referred to as consensus algorithms. The in-depth working of these processes is complicated. So, we shall stick on the basic working of it.

Definition

Cryptocurrency mining is the procedure to bring up new coins into the current flowing supply, by verifying the coins through a system. The ones that mine these coins are called miners.

Procedure to Mine Cryptocurrency

  • When a transaction is performed over the blockchain network, i.e., when a user sends coins to another address, the transaction information is recorded and put onto a block.
  • This block must be encrypted and made secure. This is where the miners come in.
  • To encrypt a blockchain, miners solve a complicated cryptographic puzzle to find the appropriate cryptographic hash for the code. For this, miners typically make use of large rigs of application-specific hardware to increase their chances of being the first one to verify and secure the block.
  • Once the block is successfully secured, it is then added to the blockchain, where other nodes on the blockchain network verify it. This verification process is known as consensus.
  • When the block successfully clears through the nodes in the network, the block is officially said to be verified and secured. And for securing a block, the miner is rewarded new-created coins. Hence, the complete above procedure of work is called Proof of Work.

Reward system in Cryptocurrency mining

Mining is a complicated process. Each day, miners commit a thousand watts of electricity towards mining cryptocurrencies. People mine coins though it is an expensive process because they receive a good number of Bitcoins for it, which has value in various markets.

As mentioned above, the reward is released to the miners when they successfully solve a block in the blockchain. The compensation received is pretty decent; in fact, it compensates a thousand watts of electricity. Having that said, the reward cannot be very high, as it could cause an oversupply in the market and depreciate the value of the currency.

Supply and Demand of a Cryptocurrency

Buying and selling cryptocurrencies is different from buying and selling of stocks, bonds, etc. Also, unlike investing in traditional currencies, cryptocurrencies are not issued by the central banks. Therefore, the monetary policy, inflation rates, and other economic factors do not apply to the cryptocurrencies. They are influenced majorly by factors such as the supply of the coins and the demand for it, the number of competing coins, and also the exchanges it trades on.

The supply of cryptocurrencies is impacted by the cryptocurrency protocol, which permits the creation of a new coin (same type) at a fixed rate. A number of coins are introduced into the market when miners verify the blocks of transactions. And the rate at which these new coins are introduced is designed such that it slows down over time. This is done to create a scenario in which the demand for coins increases faster than the supply, which hence causes the prices to shoot up.

Hence we can say that mining & miners have a crucial role in maintaining the supply & demand of any cryptocurrency!

Categories
Crypto Guides

Blockchain Technology – The Fundamental Aspect Of Most Of The Cryptocurrencies

Introduction

In this crypto guide, we have seen various articles about cryptocurrencies so far. In this article, let us examine the underlying technology, which essentially enables the working of these cryptocurrencies. It is none other than the revolutionary blockchain technology. Bitcoin and blockchain terminologies have been synonymous for a long time, but not anymore. The true potential of blockchain is realized in the past decade, and its applications are being widespread in many industries currently. The adoption is still in its nascent stage, like any other new technology in its initial days. The industries which have adopted the technology are reaping benefits in millions if not in billions already. So, it is important for us to understand what this technology is all about.

What is blockchain?

Blockchains are open global distributed ledgers, which are necessarily a chain of blocks. These blocks contain transactions or records bundled together with encryption techniques called cryptographic hash functions to form a blockchain. This is the simple definition of blockchain. The concept is as simple as it sounds, but it revolutionized the way the records are maintained in any industry.

Blockchain platforms are peer-to-peer networks. Making the ledger open and distributed; this means everyone involved in the system will have a copy of the ledger. The transactions being committed in the network are validated using a consensus algorithm. Say a block has a capacity of 1 MB of transactions, these transactions are verified and sealed in a block. This new block is linked to its previous block using cryptographic techniques. Once the block is linked in the blockchain to the last block, the contents of this block can never be changed. This property is called ‘immutability,’ a significant feature of blockchain.

What are these cryptographic hash functions?

Cryptographic hash functions are standard algorithms designed by the National Security Agency (NSA) of the USA. Any information can be sent through this algorithm, and the output we get is the hash of the input, and it is a unique value. Every block in the blockchain is linked to its previous block using the hash value of the last block. This hash value of a block is generated by all the transactions of a block plus the hash of the previous block. Thus, if we make any change in a block that is mined already, the hash value of that block is changed. All the blocks before that block would be disturbed. Thus, the property of immutability comes into the picture. This is the basics of how blockchain technology works in general.

Different blockchain platforms:

Since realizing the true potential of blockchain, different blockchain platforms are developed for various industrial use cases.

Hyperledger platforms: These platforms are developed for cross-industry applications. It is an umbrella of open source platforms like Hyperledger Fabric, Hyperledger Sawtooth, Hyperledger Iroha, and so on, designed for each industrial use.

Ethereum: Ethereum is, again, a platform developed to deploy self-executed contracts known as smart contracts. Also, a platform to create decentralized apps (Dapps) to use the blockchain functionalities in everyday apps we use.

R3 Corda: This is a consortium of around 300 different firms working together in the financial background to nurture and develop the technology to revolutionize the financial sector.

These are only some of the various platforms in use today.

Bottom line

Blockchain, as a technology, has a vast potential to revolutionize many industries. Blockchain developers will be required on a massive scale in the coming future to bridge the gap and to fulfill the requirements. The world where privacy is at stake at the moment, blockchain is a savior to ensure our privacy and security of digital information.

Categories
Crypto Guides

The Evolution & Properties Of Cryptocurrency!

Introduction

We could say that the type of currencies we use today is employed as a medium of exchange for goods and services. In the olden days, transactions used to happen in the barter system. Barter system implies that goods are exchanged for goods. With this system, it took time to trade products and services as it is challenging to find people to accept their goods for the goods they want. Hence came the era of coins in gold or some other metal with a denomination printed on it. As some standard is associated with it, the trading of goods and services has become easy. Then came the paper notes making it easy to carry large amounts of cash, which was not possible with coins. We are this point where these paper notes are known as currencies. Each country has its respective currency (The US Dollar, Japanese Yen, Indian Rupee, etc.)

Evolution Of Cryptocurrency

Even though the purpose of the money didn’t change much, the way we use it kept changing throughout history. Banks came into existence to ease out the financial transactions. They played a significant role in global trade in terms of transferring money across different countries, thus improving the economy of each country. Physically minted cash would be less than 10% of the entire currency in the world. Remaining exists in the form of virtual currency as electronic money in online accounts. Central banks in each country control these accounts. Since power is vested within these financial institutions, the entire banking process is centralized. Hence the necessity of an alternative currency has emerged. These are termed as cryptocurrencies, and the primary purpose of their invention is to create a decentralized currency system where the entire network is not controlled by anyone at all.

What Are Cryptocurrencies?

Cryptocurrencies are digital or virtual currencies where cryptographic techniques are used to generate the units of currency and monitor the transfer of funds without a central bank. Thus, making it a decentralized way of producing and using money.

Cryptocurrencies are generated by using a blockchain platform that uses distributed ledger technology. The first-ever cryptocurrency that has come into existence is The Bitcoin in 2009, though the white paper related to this concept was released in October of 2008. Thus, 2009 signals the beginning of the era of cryptocurrency. There has been no looking back since then.

Properties Of Cryptocurrency

The three fundamental features of cryptocurrencies are Trustlessness, Immutability, and Decentralization. Let us understand these properties using the example of Bitcoin.

Trustless

Though the word trustless creates confusion to the readers, it merely means there is no need not trust anyone or anything to send or accept a cryptocurrency. If we say an environment is trustless, that means there is no need for you to trust anyone in the network. The Bitcoin network is a trustless environment. There was no currency before Bitcoin that was not monitored by a central bank. Every node in the blockchain network has a copy of the ledger; thus, there is no need to trust any authority.

Immutability

Immutability means that it cannot be undone. It is highly improbable to rewrite the history of the transactions in Bitcoin blockchain. Since all the transactions are recorded in the blockchain, the cryptographic techniques make it highly impossible to change any transactions. If any fraudulent transactions happen in the case of our bank accounts, the banks have the authority to change the transaction. But in the case of cryptocurrency, it is not possible. Thus, removing the concept of centralization and trust from these digital currencies.

Decentralization

It is the keyword when it comes to cryptocurrencies. Decentralization offers different types of tolerances. Tolerance concerning the infrastructure, component failures, hacking, and collusions. In the Bitcoin network, the ledger where the transactions are recorded is distributed among every node in the network. Any component failures don’t cause any problem to the functioning of the network. Hacking the blockchain is extremely difficult and a costly process. When it comes to traditional banking, individual entities can collide with each other to make profits at the expense of loss to others. This plot is not possible in the case of a cryptocurrency network, thus offering tolerance to collusion. Apart from all of these, there are many more advantages of a decentralized system over a centralized banking network.

Bottom Line

Therefore, Cryptocurrencies offer plenty of opportunities in today’s digital world, which traditional currency couldn’t provide. We will be further discussing the purpose of cryptocurrency and more properties of cryptocurrency in our upcoming articles. Stay Tuned. Cheers!

Categories
Forex Course

Introduction To The ‘Ultimate Forex Course’ By The Forex Academy!

At Forex Academy, we give utmost importance to education. To be successful, you need to learn before you Earn. So for that same purpose, we have designed a proprietory course helped by industry experts. This extensive course will cover almost everything one needs to know about the Forex market. All relevant aspects of the trading business will be discussed here, starting right from the fundaments to the advanced trading concepts. We will be publishing one article per day so that it will be a continuous learning process. And guess what? The curse is entirely free for our readers.

Introduction To The Course

In this one-of-a-kind course, we will explain everything you need to know about Forex trading. The Forex market has evolved rapidly in recent times. It is not the same that you would have seen or heard a decade ago. The fundamentals are changing, psychology is changing, and complexity has increased. Technology not available in the 90s has now become robust and is being used extensively by traders and banks. As retail traders, we should prepare as best as possible to meet these global changes.

We have created this course, keeping in mind the rapid changes happening in the forex market. You need to use a structural method of learning, which is what we have done. Education shouldn’t be in bits and pieces, this will only create confusion, and you cannot gain anything from that knowledge. You will gain an insight into fundamental and technical expertise and how you can use them together to make the best trades. We have compiled this information from the best sources. Most importantly, the course contents have been written based on the personal experience of the writers. Forex.Academy is the right place to start for any person looking to start his trading career.

Why should you take up this course?

If you want to achieve your investment goals, this course is for you. Trading is not an easy game. It requires a lot of hard work and dedication. This journey begins with learning, and learning starts here. This course is a complete package for all the aspiring traders. Also, experienced traders who are willing to expand their knowledge must try this course. The articles are more reader-friendly, where topics are explained in simple language. The most complex strategies are described in the easiest way possible. Without having the right knowledge, it is impossible to succeed in trading.

Structure of the course

The course is divided into 37 chapters which comprise of 350+ articles, where a wide range of topics are covered. The chronological order of topics is in such a manner that every chapter is linked to the next. We have made sure that it does not lead to confusion at any point. You will find information on fundamentals, technical analysis, and price action. Market psychology is one such topic, which has been written with a lot of attention. And you too, should follow these principles to gain control over your mind.

Keep track of your learning with the quizzes

At the end of each article, we have included a quiz that will test your understanding of the topic. To be confident about what you have read, try to answer all of them correctly. If you are unable to answer, that means you need to reread the article. Rereading the article will clear all your doubts and make you an expert. Once you got all the answers right, you are ready to go ahead to the next section.

What will you learn by the end of this course?

By the time you reach the end of the course, you will be halfway through your trading journey. The only thing left for you to do is to practice the trading strategies discussed along the course. You will have all the knowledge you need to be a successful trader. See you on the course.

All the best! Happy Learning!

Categories
Forex Courses on Demand Forex Videos

Buying Rumour & Selling Fact – Forex Fundamental Secrets

The following presentation is brought to you as a courtesy of forex Academy!This is part of our service courses on demand, if you find this interesting and wish to be updated on new releases, please subscribe to our YouTube channel or join our community at Forex dot Academy, and receive all of our services for free! You’re like is also highly appreciated enjoy!

Let’s have a look at buy the rumor sell the fact! And how market participants can gear up for these trading opportunities. Buy the rumour or selling the fact is a piece of trading, the device developed in early stock market trading, it relates to a situation where the price of a stock would move higher due to traders buying, because of rumour. It is simply heard about!Possible company acquisitions, or higher than expected earnings reports. So there is many different examples that could start the rumor mill, where traders would actually say to trade off these rumours, and actually position themselves in the market with the impression the rumor will eventually come true.

Actual buy-side volume is created, so that’s what happens now. It should be worth noting, depending on the rumor sell-side volume can be and created as well it’s not always on the buy-side. Particularly it has more of a common approach to buy-side volume when we discuss buying the rumor selling the fact, and equity trading inevitably when the news or economic event occurs, and the rumor turns out to be untrue. The sell, the fact sentiment takes hold of the market, the company earnings perhaps come out negative which causes a quick sell side shock to the market in question. So that’s a classic example of hearsay, where traders interact with the market based on a rumour of a possible acquisition or perhaps very good earning reports. when the fallacy turns out to be untrue, then the market of course reacts differently, and then the trade is sell the fact. We have a picture here with our financial traders, particularly I think equity traders and I would like to just read the quote at the bottom, indicative of high market participants can gear themselves and trade off hearsay and rumours.

“The good news sir is that Harris was able to sell off or losing stock the bad news is that Simpson here bought them from Harris”.

So there is certainly indicative of, how market traders can involve themselves willy-nilly trading off rumours. I’m actually looking to profit and speculate from such rumours, but then obviously the outside factor may come in when the story unwinds. It should be worth noting in the forex markets, buying the rumor selling the fact is interpreted differently, mainly because rumors are not as common. On the vast number of variables affecting forex markets, would make it very difficult for a rumor to cause any real momentum, or movement in price now unless the rumor is an absolutely huge, groundbreaking rumor that will totally rearrange the forex markets. It is very unlikely that it will cause sustained, or a very large shock to to price in a forex markets, given the liquidity and given the the depth of the forex markets.

Indeed the Forex equivalent to buy the rumor sell the fact, is to trade in anticipation of current news releases. Traders often see news releases as a way of making a lot of money very quickly! Now it’s not always the case, but many traders do take very small positions in preemptive positions, before news relations are about to occur. An economic announcement like the monthly non-farm payrolls figure, can cause dramatic changes in asset prices, and many traders conduct fundamental analysis and trade in anticipation of speculative prices. By the time the news has been released, many traders have traded based on the forecasted number, and are now ready to sell a fact, so let’s just rewind, let’s just think about this for a moment. We have perhaps a non-farm payrolls, we believe it’s going to be very strong, given the forecast, and before the figure comes out. We actually make a trade, as a trader as fundamental analysis under decision making, and we’ve actually made a pre-emptive decision to enter the market before the figure. We’re not guessing we’re using a fundamental, a discussion of the of the markets in question and positioning for the move itself, Now the figure may come out I’m very positive indeed we’re on the right side of the market, well that’s fantastic, the market trades up and we’re in a profitable position. What is our decision now? Well obviously if we decided to many traders could could have very well made the same speculative position, we could sell or trade for a nice profit and then what we could do, is actually sell the fact! We could look for a pullback in that price given, that many traders may have expected, or the market has already pressed in this move to the upside and we know you’re looking to sell the fact. More often than not we actually do see very strong pull backs in trades like this.