Categories
Forex Fundamental Analysis

Does ‘Retail Sales Monitor’ (RSM) Economic Indicator Impacts The Forex Market?

Introduction

The level of demand can be said to be the primary driving factor in any economy. In the long run, the fiscal and monetary policies that are implemented by governments and central banks can be traced back to the aggregate demand within the economy. The consumption by households accounts for over 65% of the national GDP. Since retail sales account for most of the consumption by households, monitoring retail sales data can provide a useful predictor of the GDP and inflation.

Understanding Retail Sales Monitor

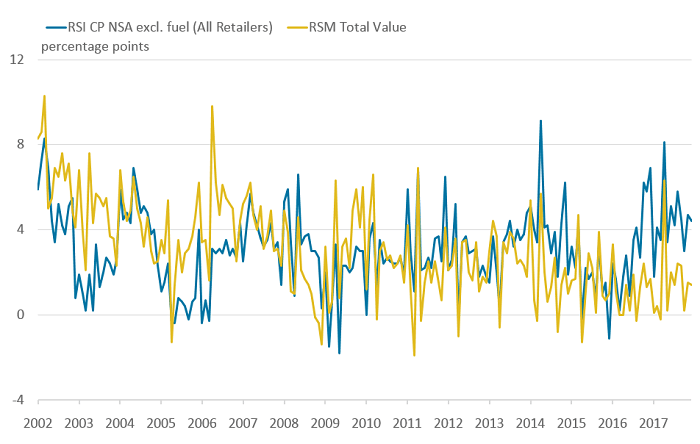
The Retail Sales Monitor is a precise measure of the performance in the retail sector. The RSM is measured monthly in the UK by the British Retail Consortium (BRC), whose participating members represent about 70% of the UK’s retail industry.

Source: The UK Office for National Statistics

The BRC is comprised of over 170 major retailers and thousands of independent retailers. The BRC member businesses have sales of over £180 billion and with 1.5 million employees. Since the RSM measures the change in the actual value of same-store sales in BRC-member retail outlets in the UK, the data can be used as a confident measure of the UK’s retail sector health and the broader economy.

In the UK, the retail sector is the largest employer in the private sector, which means that tracking the retail sector changes gives an overview of the economy and business cycles and insights into the labor market.

Using Retail Sales Monitor in Analysis

The RSM data couldn’t be more relevant in the current climate of Coronavirus afflicted economy and post-Brexit operating environment. Here are some of the ways this data can and is used for analysis.

In any economy, growth is driven by demand. Household purchases account for over 65% of the GDP, which makes the RSM data a vital leading indicator of economic health. When the retail sales monitor shows an increase in households’ consumption, it means that more money is circulating in the economy.

Several factors can be attributed to increased demand by households. Firstly, increased employment levels in the economy or an increase in real wages mean that the economy’s overall disposable income also increases. As a result, households can now consume more quantities of goods and services. More so, the increased disposable income tends to lead to the flourishing of discretionary consumer industries and a general rise in the aggregate demand.

An increase in aggregate supply leads to the expansion of production activities hence overall economic growth. Secondly, increased demand can be a sign of easy access to affordable funding by the households. Generally, if households and businesses have easy access to cheaper financing sources, it forebodes an increase in economic activities, which leads to economic expansion.

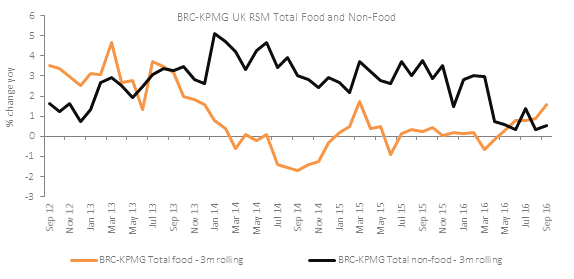
As an economic indicator, the retail sales monitor can be used as an authoritative leading indicator of recessions and recoveries since its data covers over 70% of the retail sector. For example, when the economy is at its peak, it is characterized by RSM’s historical highs and lower unemployment levels. When the RSM begins to drop consistently, this can be taken as a sign that the economy is undergoing a recession. The period of recession is characterized by an increase in the rate of unemployment and lower disposable income, which makes households cut back on their consumption and prioritize essential goods and services.

Source: Retail Economics

Conversely, when the economy is at its lowest during recessions or depressions, it is characterized by historical lows RSM and a higher unemployment rate. In this scenario, when the RSM begins to rise steadily, it could be taken as a sign that the economy is undergoing recovery. This period will be marked by improving labor market conditions hence increased demand that drives the RSM higher.

Using the RSM as a leading indicator of recessions and recoveries can help governments and central banks implement fiscal and monetary policies. When the RSM drops and shows signs that the economy could be headed for a recession, expansionary fiscal and monetary policies could be implemented. These policies will help to stimulate the economy and avoid depression.

On the other hand, when the RSM is continually rising at a faster rate, contractionary monetary and fiscal policies could be implemented. These policies are meant to mop up excess liquidity of the money supply and increase borrowing costs, thus avoiding an unsustainable rate of inflation and an overheating economy.

Impact on Currency

There are two main ways in which the RSM data can impact a country’s currency. By showing the economic growth and as an indicator for potential monetary and fiscal policies.

When the RSM has been steadily increasing, forex traders can anticipate that contractionary policies will be implemented to avoid unsustainable economic growth. One of such policies involves interest rate hikes, which make the currency appreciate relative to others. Conversely, expansionary monetary and fiscal policies can be anticipated in the event of a persistent drop in the RSM. Such policies include cutting interest rates, which depreciates the local currency.

The currency can be expected to be relatively stronger when the RSM is increasing. In this case, economic conditions are improving, unemployment levels are dropping, and a general improvement in households’ welfare. On the other hand, a dropping RSM is negative for the currency because it is seen as an indicator of a contracting economy and worsening labor conditions.

Sources of Data

In the UK, the RSM data is collated by the British Retail Consortium and KPMG. The data is published monthly by the British Retail Consortium.

How Retail Sales Monitor Data Release Affects Forex Price Charts

The recent publication of the retail sales monitor data was on October 12, 2020, at 11.00 PM GMT and accessed at Forex Factory.

The screengrab below from Forex Factory; as can be seen, a low impact on the GBP is expected when the RSM data is published.

In September 2020, the BRC increased by 6.1%. This change was greater than the 4.7% change recorded in August 2020 and higher than the analysts’ expectation of a 3.5% change. Theoretically, this positive RSM is expected to have a positive impact on the GBP.

Let’s see how this release impacted the GBP/USD forex charts.

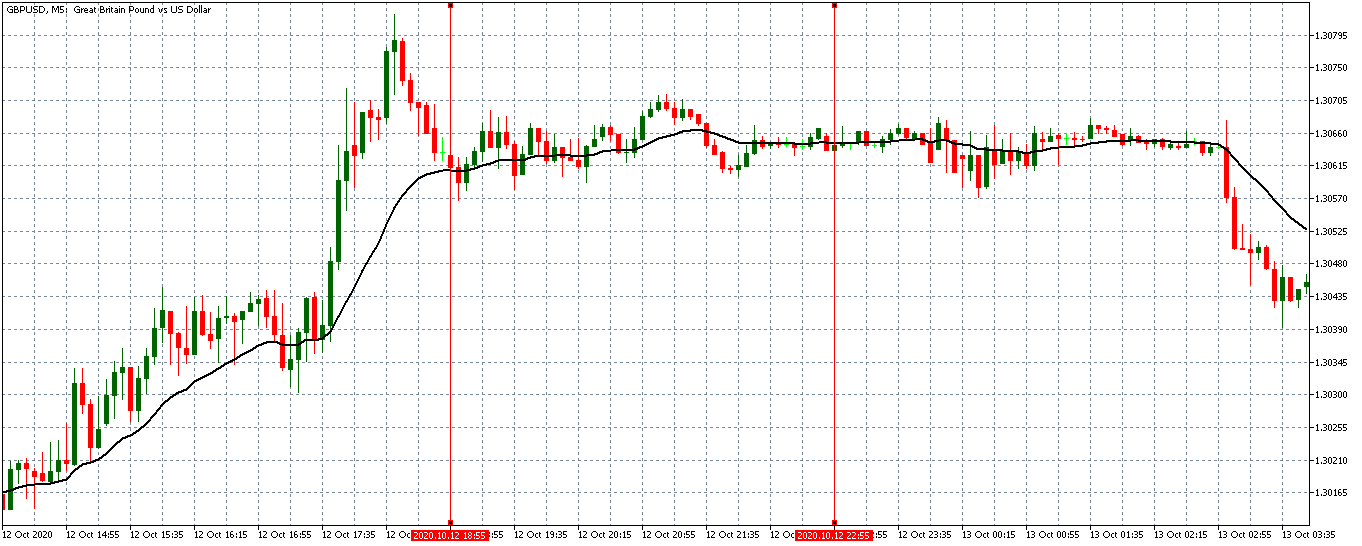
EUR/USD: Before the Retail Sales Monitor Release on October 12, 2020, 
Just Before 11.00 PM GMT

Before the publication of the RSM data, the GBP/USD pair was trading in a neutral pattern. As shown by the 5-minute chart above, the 20-period MA had flattened with candles forming just around it.

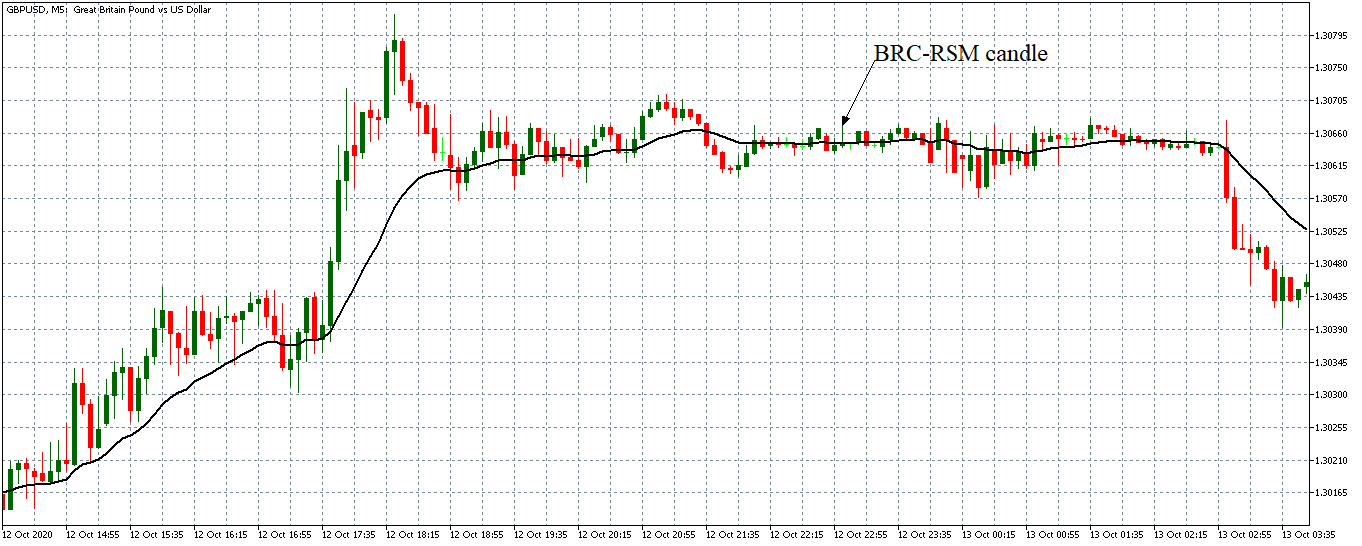
EUR/USD: After the Retail Sales Monitor Release on October 12, 2020, 
at 11.00 PM GMT

The pair formed a 5-minute ‘Inverted Hammer’ candle after the RSM data publication. However, the release of the data did not have any noticeable impact on the pair. The GBP/USD pair continued trading in the previously observed neutral trend with the 20-period MA still flattened.

Bottom Line

Most forex traders tend to pay attention to the retail sales data, which is usually scheduled for ten days after the RSM publication. The retail sales data are considered to cover the entire economy hence the low-impact nature of the retail sales monitor as an indicator in the forex market.

Categories
Forex Fundamental Analysis

Understanding ‘Social Security Rate For Employees’ Forex Fundamental Driver

Introduction

The Social Security Program of the United States is the government insurance program for retirees, disabled, and survivors. It is one of the most extensive Government Spending programs and affects the majority of its population. Hence, it is a macroeconomic statistic, and changes in the same results a significant impact on its citizens. An insight into the Social Security Rates and how it affects the individual and the economy as a whole can help us understand the monetary structure of the United States.

What is Social Security Rate For Employees?

The Social Security Program (SSP) is managed by the Social Security Administration (SSA) of the United States. The SSA is a federal agency and defines the SSP as a protection program against income loss due to retirement, disability, or death. The Social Security Program is officially called the Old-Age, Survivors, and Disability Insurance (OASDI) program.

The funds collected by the SSP are divided between two funds, namely the Old-Age and Survivors Insurance (OASI) and Disability Insurance (DI) Trust Funds. Retired workers and their families, or survivors (ex: wife of an expired husband) receive benefits from the OASI funds. The DI trust funds provide benefits to the disabled and their families. The benefits are paid out monthly to the eligible people.

The Social Security Programs receives its funds primarily from the currently active employees enrolled in the program, employers, and as well as self-employed citizens. The funds received at present are not stored for the future, instead, they are utilized to pay out for the currently eligible retirees. The cycle goes on, and it means the current employee pays out for the already retired people, and when the employee himself retires would be paid out through funds collected from the paying employees at that time.

Apart from the employee, employer, and self-employed, funds receive income from investments and interests on investments, and taxations of benefits. For the year 2020, the Social Security Rate is 12.4%, which is evenly divided amongst the employer and the employee. Hence, the employee pays 6.2% of their income. Generally, It is deducted monthly from their income. On the other hand, the self-employed people like small shop owners or freelancers are subject to pay the full 12.4% themselves.

The benefits apply to people who have enrolled and have paid for a minimum of ten years. The retirement age at which they are eligible for collecting their pension is 62, while people who wait longer, like the age of 66 or 70, receive higher and better benefits accordingly. The Social Security Tax has a cap limit of $137,700, above which the earned income is not subject to the tax deduction.

How can the Social Security Rate For Employees numbers be used for analysis?

Since the Social Security deductions are directly taken out from the gross salary, it directly affects the Personal Consumption Expenditure (PCE) and thereby Consumer Spending. Both of these are macroeconomic indicators bearing high significance in terms of currency market volatility. Suppose the taxes increase, Consumer Spending decreases, which can drive the economy into a recession. Consumer spending makes up two-thirds of the United State’s GDP.

The program collects from millions of people and pays out to millions of people. The transactions are in billions of dollars every year. Any change in the percentage is bound to affect a large chunk of the country’s population directly. Hence, the changes in the rates are less frequent over the years and change only during significant policy reforms.

The regressive nature is often criticized, meaning the more affluent section of the society ends up paying lesser than the lower-income bracket people due to the tax cap limit. Also, the model of the Social Security Program is a cause of worry for many as the increased life expectancy and the diminishing worker-to-retiree ratio will ultimately result in depletion of funds soon.

As the population stops to grow, and more people retire than the number of people actively working will ultimately force the Government to either raise taxes or retirement age-limit or decrease benefits. None of those above options is favorable, and the Government needs to plug this gap in funds sooner than later.

 Impact on Currency

The Social Security Rate for the employees is revised every year. Most of the time, it tends to remain constant and changes only in small incremental steps over a few years at a time. Therefore, the volatility induced in the currency markets is negligible unless significant changes occur. Above all, the changes would be priced into the market through news updates long before official statistics are published. Hence, Social Security Rate for employees is a low-impact indicator and can be overlooked for more frequent statistics in the currency markets.

Economic Reports

The Social Security tax rates for both the employee and employer are provided by the Social Security Administration of the United States on its official website. The historical figures of the same are also available. The OECD (Organization for Economic Co-operation and Development) also maintains the tax rates for employees of its member countries on its official website.

Sources of Social Security Rate For Employees

Social Security Rates for employees is available on the Social Security Administration website.

Social Security Rates for employees is also available on the OECD’s official website.

Social Security Rates for employees (similar policies with different names) across the world can be found in Trading Economics.

How Social Security Rate For Employees Announcement Affects The Price Charts

For employees, the social security tax is deducted through payroll withholding by the employer. This rate is split in half between the employee and the employer. Since the social security rate in the US is 15.3 %, an employee contributes 7.65% of their earnings up to $137,700.

The screengrab below shows the current social security rate for companies in the US from Trading Economics.

The latest review of the US social security rate was on October 10, 2019, at 4.00 PM ET, and the press release can be accessed here.

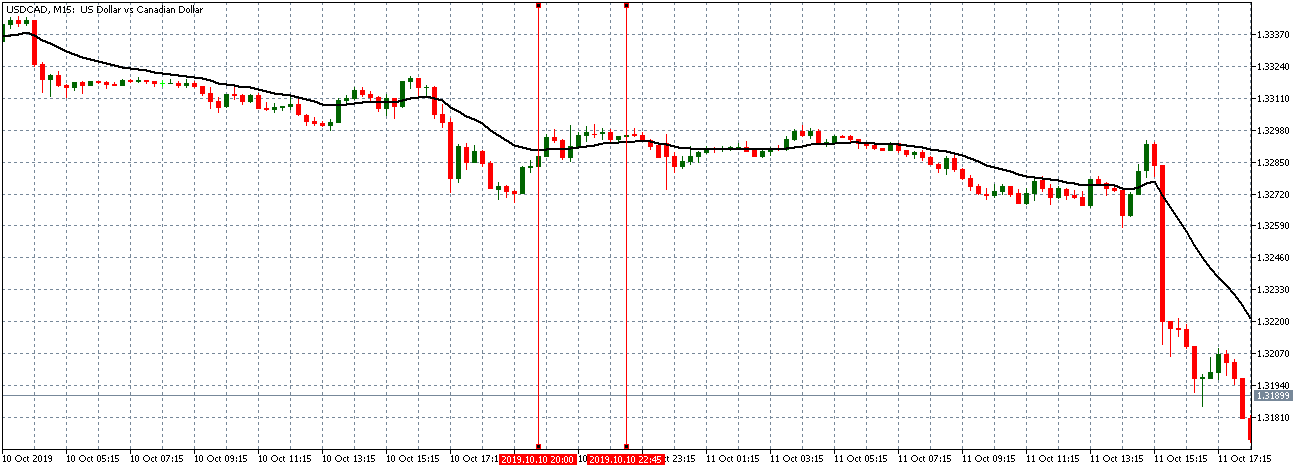
USD/CAD: Before Employee Social Security Rate Release October 
10, 2019, just before 4.00 PM ET

As can be seen on the above 15-minute chart, the USD/CAD pair was trading on a neutral trend before the news release. This trend is shown by the candles forming around an already flat 20-period Moving Average. This trend signifies relative market inactivity at this time.

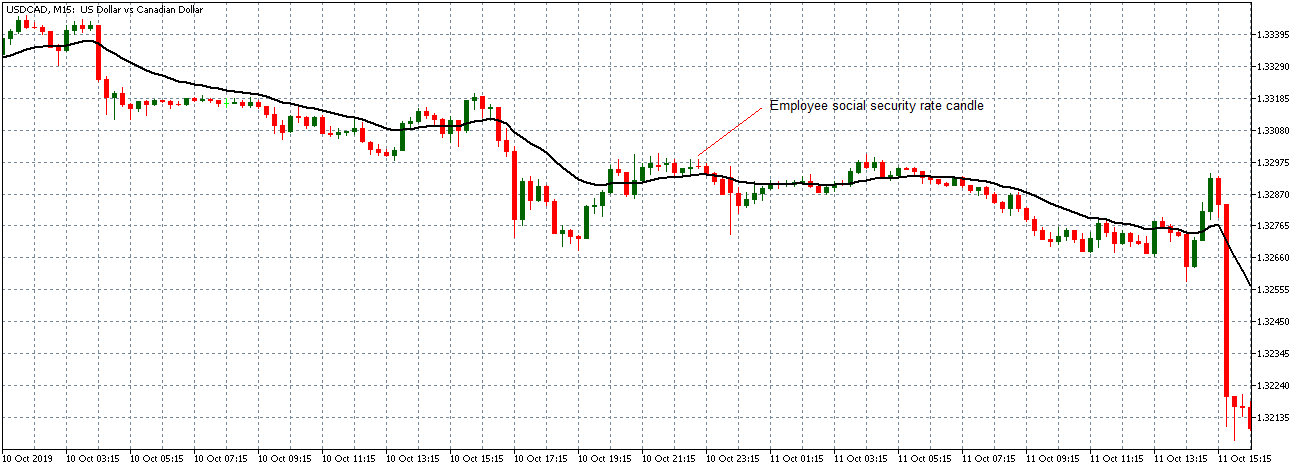
USD/CAD: After Employee Social Security Rate Release October 
10, 2019, at 4.00 PM ET

After the news release, no market volatility is observed. The US/CAD pair forms a 15-minute “Shooting Star” candle. Afterward, the pair struggled to alter the trading pattern with the candles attempting to cross below the 20-period Moving Average but subsequently continued trading in the previously observed neutral pattern.

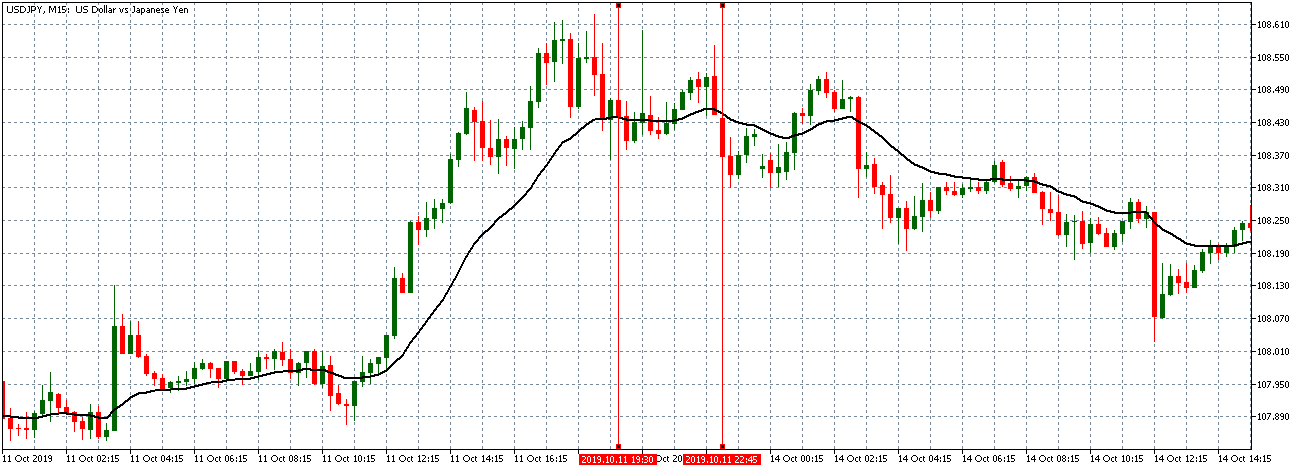
USD/JPY: Before Employee Social Security Rate Release October 
10, 2020, just before 4.00 PM ET

Before the news release, the USD/JPY market is on a weak uptrend. The pair can be seen struggling to maintain this trend as observed by multiple bearish spikes. The pair adopts a downtrend 30 minutes before the news release.

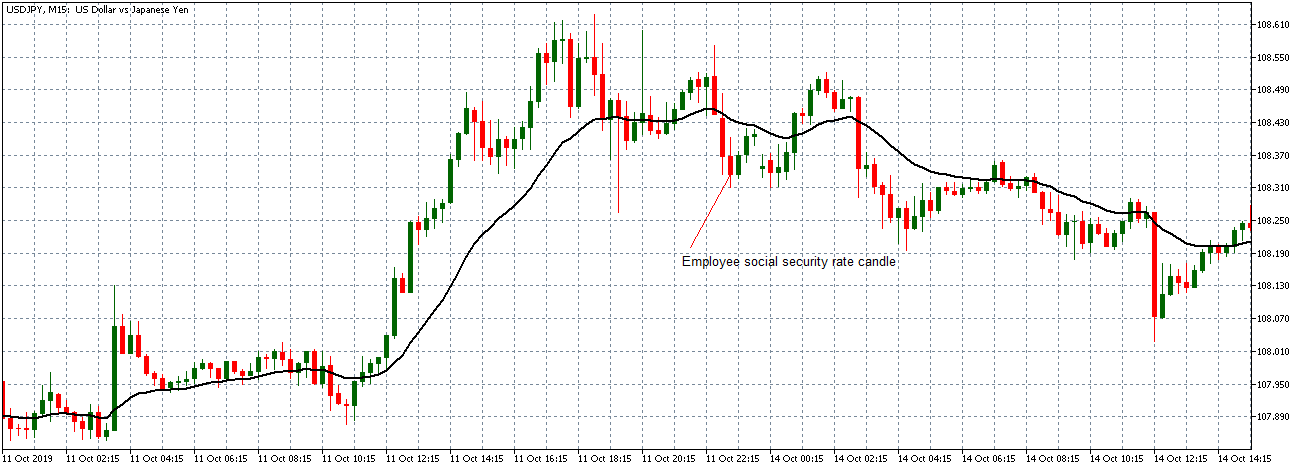
USD/JPY: After Employee Social Security Rate Release October 
10, 2019, at 4.00 PM ET

After the news release, the pair forms a 15-minute bearish candle. However, the news is not significant enough to maintain the earlier observed downtrend.

USD/CHF: Before Employee Social Security Rate Release October 
10, 2020, just before 4.00 PM ET

USD/CHF: After Employee Social Security Rate Release October 
10, 2019, at 4.00 PM ET

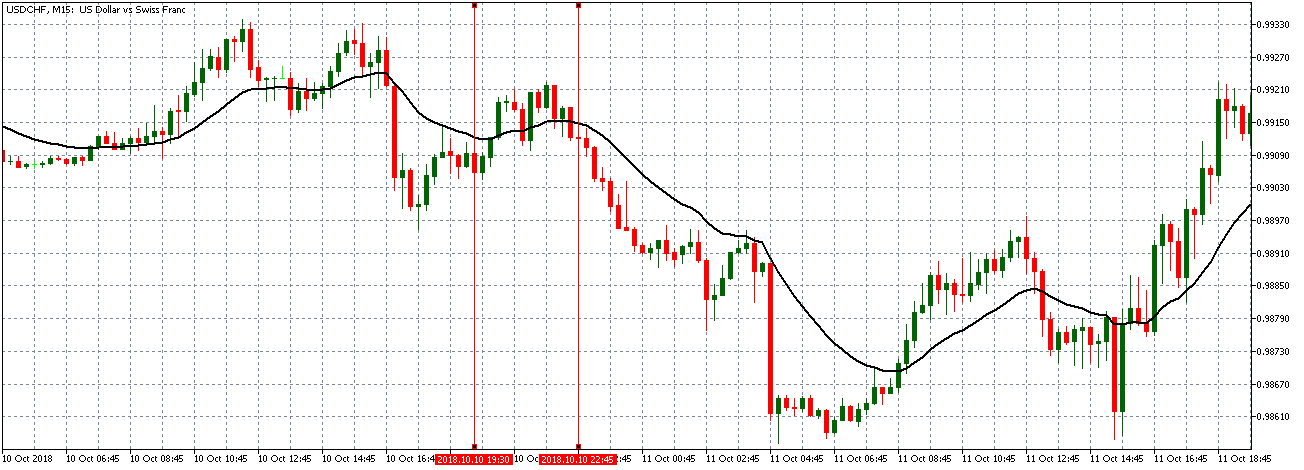
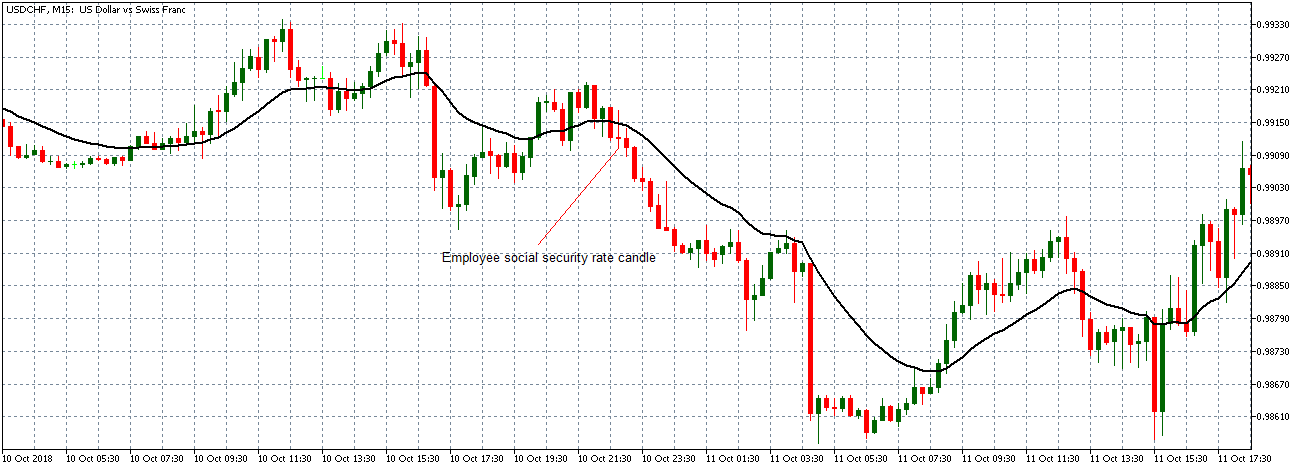
Before the news release, the USD/CHF pair shows a similar trading pattern as the USD/CAD pair. The pair was trading on a neutral trend with 15-minute candles forming around a flattening 20-period Moving Average. As the USD/JPY, the pair showed signs of reversing into a downtrend 30 minutes before the news release. After the release, USD/CHF formed a 15-minute “Shooting Star” candle. It later continued trading in a downtrend with subsequent candles forming below the 20-period Moving Average.

Bottom Line

On October 10, 2019, the US effectively increased the social security rate. Theoretically, this is supposed to be positive for the USD. However, as shown by our analyses, this news release had no significant price action impact on any currency paired with the US dollar.

Categories
Forex Fundamental Analysis

Understanding The ‘Inflation Rate MoM’ Macro Economic Indicator

Introduction

The GDP and Inflation rate are two of the most closely watched macroeconomic statistics by economists, business analysts, investors, traders, government officials, and the general population. The inflation rate has an impact on everyone, and no one is exempt from it. Understanding its effect on the currency, economy, living conditions, and how to use it for our analysis is paramount.

What is Inflation Rate, MoM?

Inflation: The increase in the prices of commodities over time is called inflation. It is the rise in the cost of living over time where the purchasing power of the currency depreciates. Inflation erodes the value of the currency, meaning a unit of currency can procure lesser goods and services than before.  Inflation occurs when more currency is issued than the wealth of the country.

Inflation Rate: The percentage increase in price for a basket of goods and services for a particular period is called the inflation rate. It is used to measure the general increase in the cost of goods and services. It is contrasted by deflation, which refers to the appreciation of the currency and leads to decreased prices of commodities. When more currency chases, fewer assets inflation occurs.

Inflation Rate MoM: The general measure of the inflation rate is YoY, i.e., Year-over-Year. It serves as a means to measure how currency has faired over the year against inflation. The rate tells how fastly prices increased. The inflation rates are often low and incremental over time and hence make more sense for a YoY comparison for general use. However, for traders and investors, MoM is more useful for close monitoring to trade currencies.

How can the Inflation Rate MoM numbers be used for analysis?

As inflation continues, the standard of living deteriorates. Inflation is an essential economic indicator as it concerns the standard of living. Hence, it requires much attention to understand and analyze. Inflation can occur due to the following reasons: cost-push inflation, demand-pull inflation, and in-built inflation.

Demand-pull inflation: When too few goods are chased by too much money, we get demand-pull inflation. It is the most common form of inflation. The demand for commodities is so high that people are willing to pay higher prices.

Cost-push inflation: It occurs when there is a limit or constraint on the supply side of the demand-supply equation. A limited supply of a particular commodity makes it valuable, pushing its price higher. It can also occur when the cost of manufacturing or procuring raw materials increase that forces businesses to sell at higher prices.

Built-in inflation: It occurs out of people’s adaptive expectations of future inflation. As prices surge, workers demand higher pay due to which manufacturing costs increase and form a feedback loop. It forms a wage-price spiral as one feeds of another to reach a new higher equilibrium.

Inflation mainly affects middle-class and minimum wage workers as they immediately experience the effects of inflation. Generally, the monthly inflation rates would be less than 1% or 0.00 to 0.20% in general. Such increments can be useful for currency traders to short or long currency pairs by comparing relative inflation rates.

Central authorities are committed to ensuring a low and steady inflation rate throughout. The policies are also drafted to counter inflation or deflation. The central authorities would likely intervene with a loose-monetary policy to inject money into the system and induce inflation when the economy is undergoing a slowdown or deflation. A tight monetary policy (withdrawing money from the economy) would be used to induce deflation to counter hyperinflation.

Impact on Currency

The monthly inflation rates are essential economic indicators for both equity and currency traders. It is an inversely proportional high-impact coincident indicator. An increase in the inflation rate deteriorates currency value and vice-versa. As it has a direct impact on the currency, the volatility induced as a result of significant changes in the inflation rate is also high.

Economic Reports

There are multiple indices to measure the inflation rate. The CPI, Producer Price Index (PPI), Personal Consumption Expenditures (PCE), GDP Deflators are all popular statistics used for measuring inflation in a variety of ways.

The Bureau of Labor Statistics (BLS) of the United States releases the CPI and PPI reports on its official website every month. The GDP Deflator is published by the Bureau of Economic Analysis (BEA) every quarter. The PCE is also published by BEA every month.

Sources of Inflation Rate MoM

BLS publishes the Consumer Price Index (CPI) and Producer Price Index (PPI) on its official website. The data is available in seasonally adjusted and non-adjusted versions, as inflation is also affected by business cycles. A comprehensive and visual representation of these statistics is available on the St. Louis FRED website. The BEA releases its quarterly GDP deflator statistics and monthly Personal Consumption Expenditure (PCE) on its official website for the public. Consolidated statistics of monthly inflation reports of most countries are available on Trading Economics.

How the Monthly Inflation Rate Data Release Affects The Price Charts

For this analysis, we will use the monthly consumer price index (CPI) to measure the rate of inflation. The Bureau of Labor Statistics releases the MoM CPI data in the US. It measures the change in the price of goods and services from the perspective of the consumer. The most recent data was released on August 12, 2020, at 8.30 AM ET and can be accessed at Forex factory here. An in-depth review of the latest CPI data release can be accessed at the BLS website.

The image below shows the most recent changes in the MoM CPI in the US. In July 2020, the US CPI changed by 0.6%, the same increase as that of June.

Now, let’s see how this release made an impact on the Forex price charts.

EUR/USD: Before Monthly CPI Release on August 12, 2020, 
Just Before 8.30 AM ET

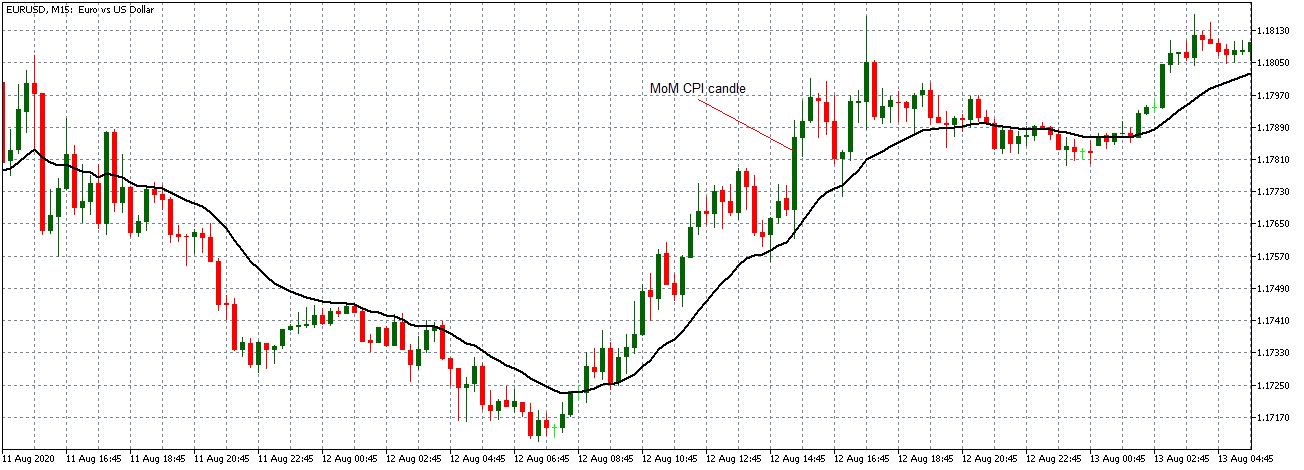
From the above 15-minute chart of the EUR/USD, the pair can be seen to be on a steady uptrend before the CPI data release. The 20-period MA in steeply rising with candles forming above it.

EUR/USD: After Monthly CPI Release on August 12, 2020, 
8.30 AM ET

After the data release, the pair formed a long 15-minute bullish candle indicating that the news release negatively impacted the USD. The pair subsequently continued trading in the previously observed uptrend.

Now let’s see how this news release impacted other major currency pairs.

AUD/USD: Before Monthly CPI Release on August 12, 2020, 
Just Before 8.30 AM ET

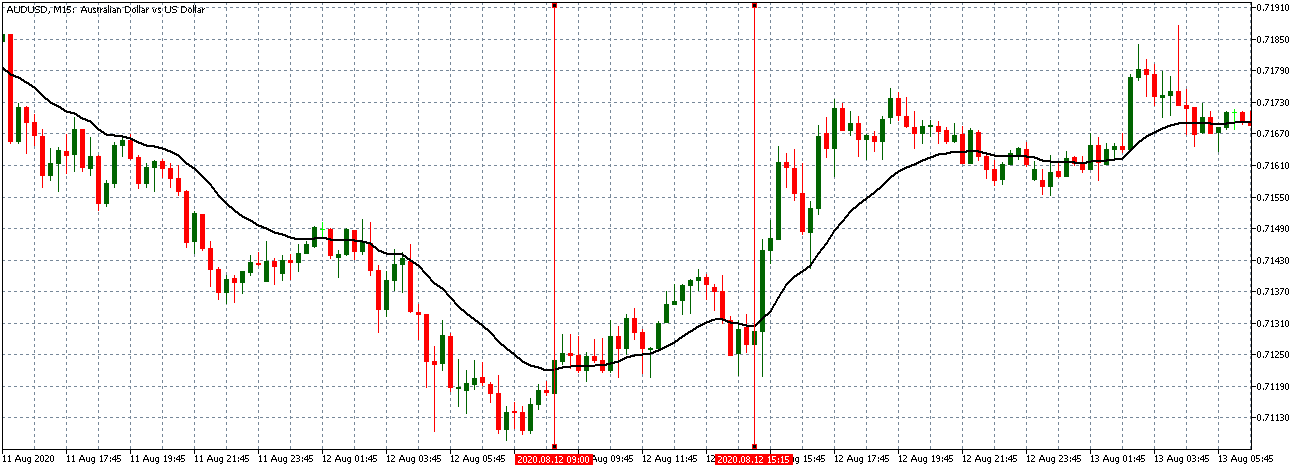
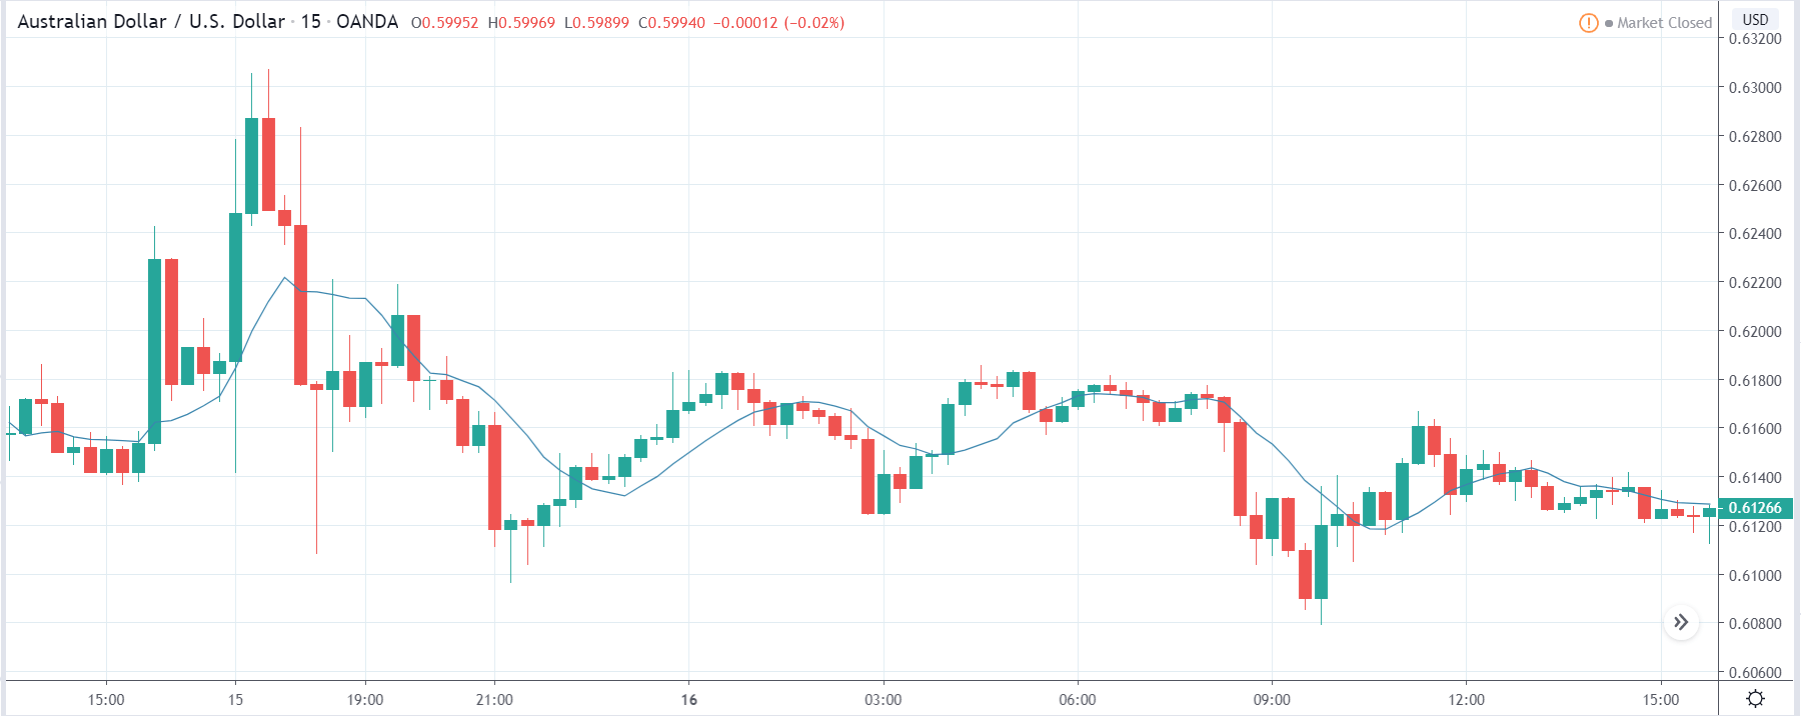
The AUD/USD pair traded in a subdued uptrend before the data release. The 15-minute candles are forming just around an almost flattening 20-period MA.

AUD/USD: After Monthly CPI Release on August 12, 2020, 
8.30 AM ET

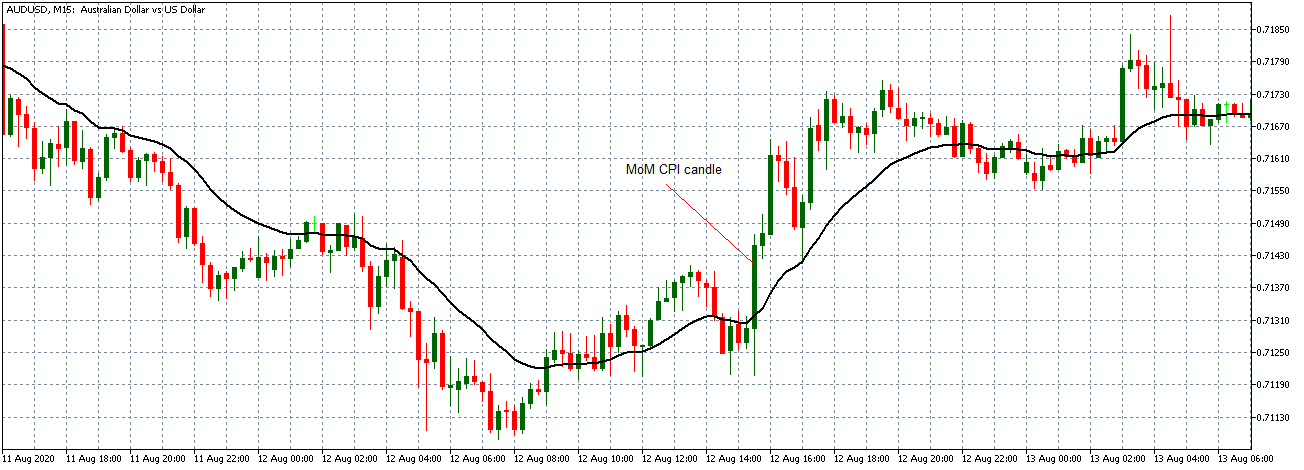
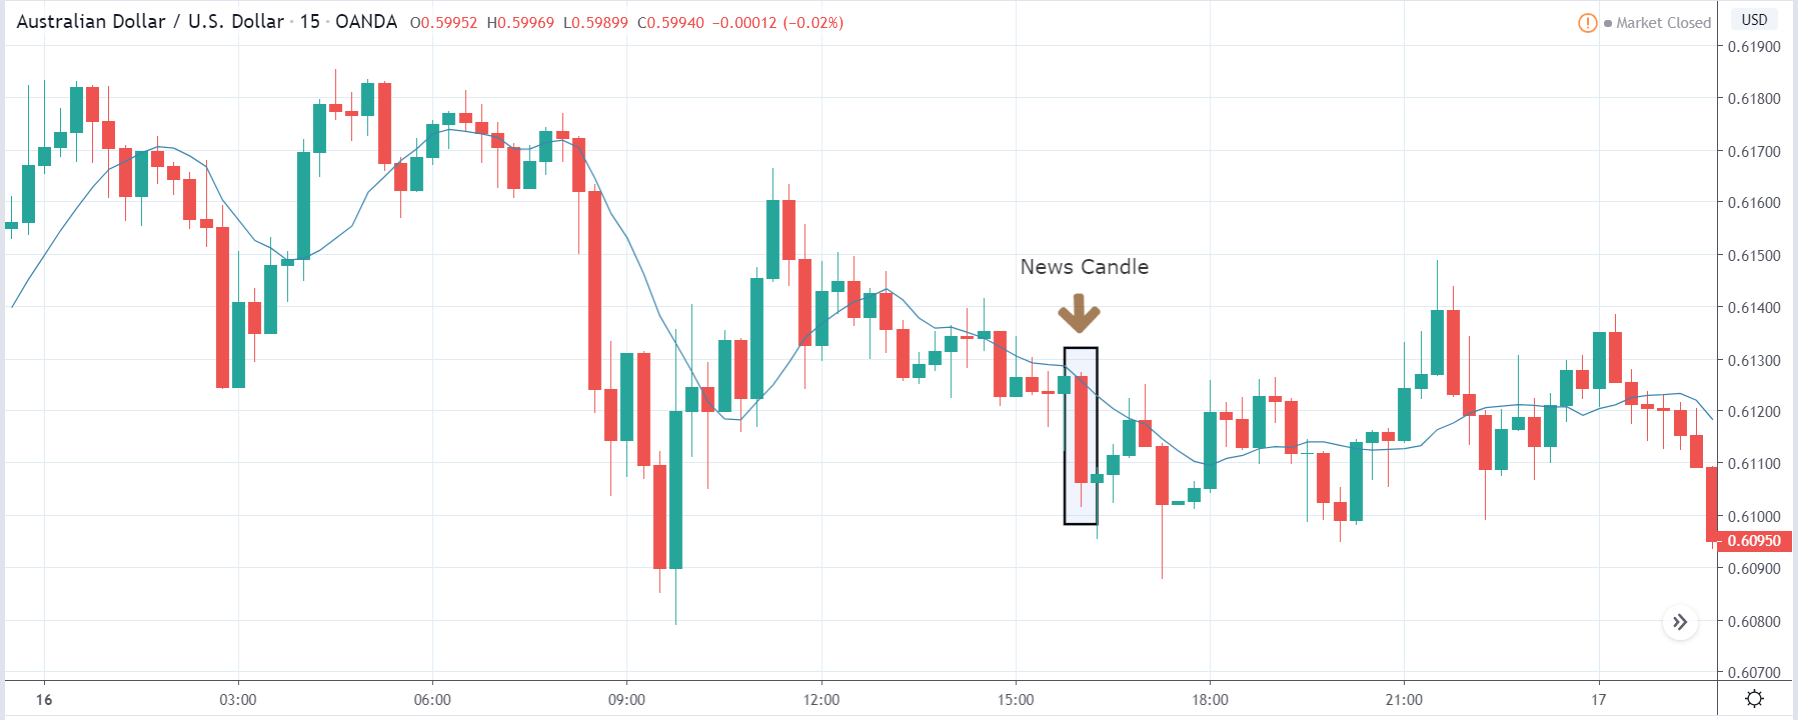
Like the EUR/USD pair, the AUD/USD formed a long bullish 15-minute candle after the news release. Afterwards, the 20-period MA steeply rises as the pair adopted a steady uptrend.

NZD/USD: Before Monthly CPI Release on August 12, 2020, 
Just Before 8.30 AM ET

NZD/USD: After Monthly CPI Release on August 12, 2020, 
8.30 AM ET

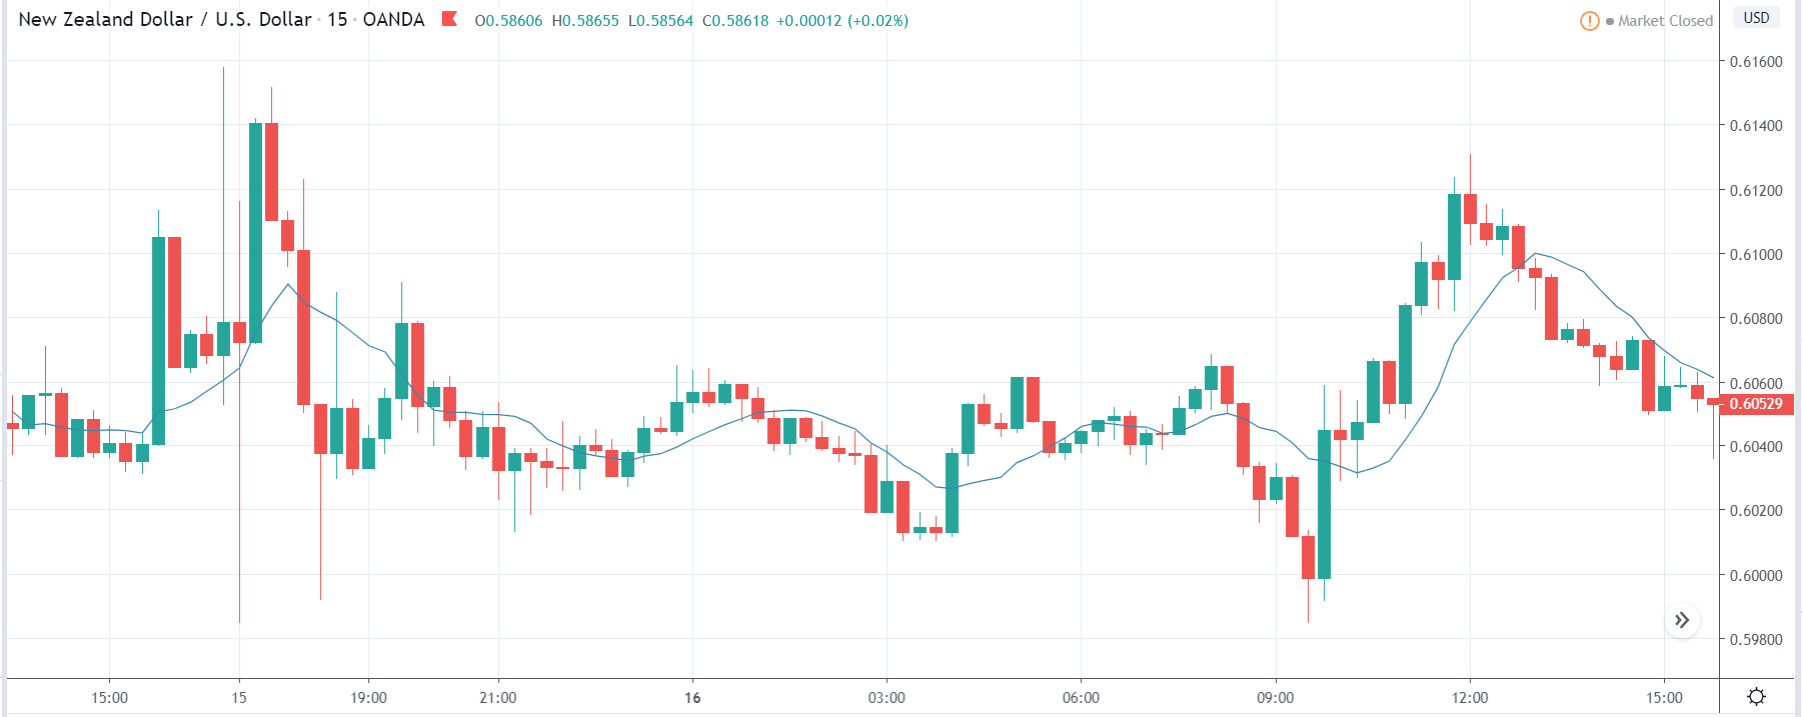
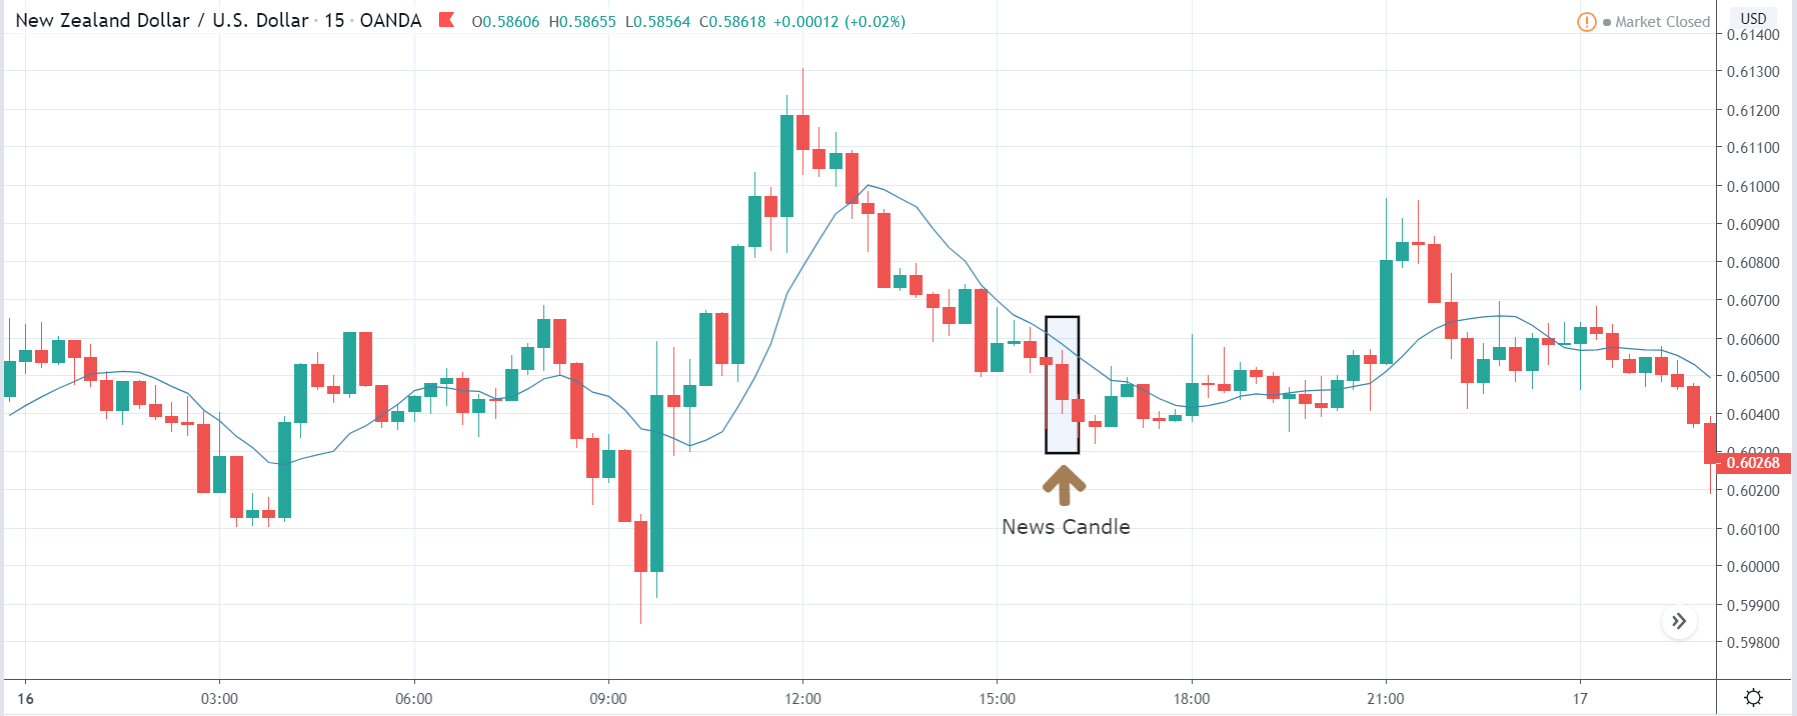
Before the data release, the NZD/USD pair traded within a neutral pattern with the 15-minute candles crisscrossing an almost flattening 20-period MA. As observed with the other pairs, the NZD/USD formed a long 15-minute bullish candle after the news release. It subsequently traded in a steady uptrend with the 20-period MA steeply rising.

Bottom Line

In theory, an increasing rate of CPI should be a strong USD, but as observed in the above analyses, a high CPI resulted in a weakening USD. The CPI is often considered a leading indicator for interest rate; hence, a rising CPI is accompanied by a rising interest rate. However, since the US Fed had already indicated that it has no intention of increasing the interest rate, a high CPI implies a depreciating USD. It is, therefore, imperative that forex traders have the Fed’s decision in mind while trading with CPI data.

Categories
Forex Fundamental Analysis

Comprehending ‘Capital Flows’ As A Macro Economic Indicator

Introduction

Capital Flow is a useful indicator to assess the relative strength of economies and sectors within an economy. Capital always tends to flow towards growing, improving, and strengthening regions, be it industries, economies, or even currencies. Tracking the flow of Capital can help us understand the expanding areas within a nation and also throughout the world. It also gives us an insight over which sectors are contracting or experiencing a slowdown. Hence, understanding Capital Flow is crucial for investors and traders to make critical investment decisions.

What is Capital Flows?

Capital Flow refers to the money movement within an economy amongst different classes or economies in the broader sense. Capital movement from one sector to another can be for various purposes like an investment, trade, or business operations. On a small scale, individual investors can direct their savings and investment capital into securities such as mutual funds, bonds, or stocks, etc.

On the medium scale, It can include money flow within corporations in the form of investment funds, capital spending on business operations, and R&D. For example, Big tech Giants like Apple or Microsoft can direct their funds on expanding their production sites in other countries. In this case, Capital flows out of the country, or they may choose to invest in Research and Development Sector to develop new products and services, where Capital flows into that division, which is usually headquartered in the native country, in this case, the United States.

On the larger scale, Capital Flows are directed by Government from their federal tax receipts to many outlets like public spending programs, regulatory operations, foreign trades, currencies, and foreign investments, etc. On what aspects the Government decides to direct the flow of Capital can imply many things like development, employment, inflation, foreign goods, imports, etc.

As the entire world runs on money, directing the flow of money is essential. An excess of influx or deficit of money flow can be detrimental for any sector. Hence, the Government segregates Capital Flows into different types for studying, regulating, and policy-making purposes. The following are the Capital Flow types:

Asset-class movements: It refers to the changes of Capital between liquid currency, stocks, bonds and other financial instruments like real estate, metals (ex. Gold, Iron, etc.)

Venture Capital: It refers to the shift in trends of capital movements directing towards startup businesses. Which sector new startup businesses are seeing capital inflow and which are not is tracked through Venture Capital statistics.

Mutual Funds Flow: It tracks the overall addition or withdrawal from the underlying classes of its funds, which can be bonds, stocks, banks, or other mutual funds. Inflow and outflow from one segment to others can imply many things for investors. In general, the influx of Capital Flow into a sector is positive, while outflow is depreciating for that segment class.

Capital Spending Budgets: It refers to the Capital movements for the corporate institutions and is used to monitor growth and expansionary plans of the corporate based on their budget allocation patterns.

Federal Budgets: This is the critical component amongst Capital Flows as it has a long-term impact on the economy and can either attract or drive-off foreign investors. It refers to the budget plans allocated for public spending, running economic operations and regulations, etc.

How can the Capital Flows numbers be used for analysis?

Money accompanies the growth period. Money always follows where there is growth or improvement. In the financial markets, this is called “hot money,” which refers to the funds from investors throughout the world. Whenever a stock market performs good, or an industrial sector improves or comes up with an innovation, it is followed by an increase in the inflow of Capital.

The capital flow can assess the relative strength of capital markets into and out of the markets or the liquidity of that stock market. As the United States is the world’s largest economy and accordingly, it is having the top two stock exchanges, i.e., the New York Stock Exchange (NYSE) and Nasdaq (NASDAQ) beating all the global stock exchanges.

At the corporate level, the flow of Capital helps investors assess the current financial stature of the company and their probable future plans. For example, Investments into expansionary plans are likely to generate more revenue in the future.

The Government’s Federal Budget can be used to analyze how much growth can be expected based on the current public spending and what portion goes into servicing debts. For instance, Higher budget allocation for public spending is indicative of an effort to stimulate the economy in a positive direction. Similarly, interest rates, bond yields can all determine Capital flow in and out of the economy.

Impact on Currency

When Capital flows into the country, the currency appreciates and vice-versa. For example, when the USA regularly imports foreign goods resulting in dollars going out of the country, this results in excess of U.S. dollars in the global economy due to which the value depreciates. On the other hand, if the USA continuously exports its goods, for this other countries send dollars into the USA, creating a deficit in the rest of the world. Accordingly, the demand for dollar increases and currency appreciates.

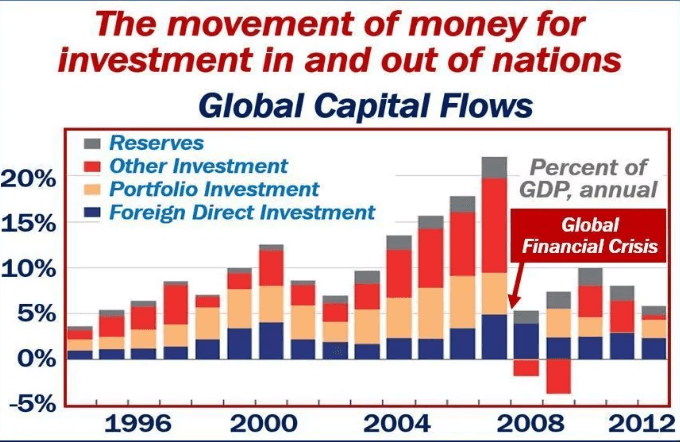
Generally, High yield rates (ex: Treasury Bonds), bank interest rates deposits relative to other economies attract Capital into the economy. When markets experience a slowdown or heading for a crash, it is amplified by the outflow of cash as it propels the de-liquefication and further drives down the confidence of people. Hence, healthy Capital inflow is essential to maintain the economy and for the currency to hold its value against other currencies. The same is illustrated in the below plot:

(Chart Credits – Market Business News)

Economic Reports

Capital Flow is a broad metric with several components, as discussed. The corporate balance sheets and press releases can be used to understand the Capital Flow within corporate sectors, which they usually release quarterly, or annually on their own official websites. The Federal Reserve System releases of the United States releases its Federal Budget and its recent revisions on its official website. There are many online platforms to track the status of the global stock exchanges themselves to observe the Capital Flow.

Sources of Capital Flows

Fed Balance Sheet Data & Information can be accessed here.

Information on major indices can be found here.

Capital Flow metrics with illustrative graphs for analysis can be found here.

Impact of the ‘Capital Flows’ news release on the price chart 

Now that we have understood the importance and significance of Capital Flows in a country, we shall study the impact of the same on the value of a currency. Capital Flows does not only mean the movement of funds across countries, but it is also measured in terms of investment in asset-classes, venture capital, federal budget, mutual funds, and government spending.

Capital Flows have quite an impact on the economy, if not a major effect. The revenue of the local Exchange Market, money supply and liquidity are some of the parameters which fall prey to any disturbances in the Capital Flows. Traders and Investors keep a watch on the Capital Flows data and monitor the trend of Flows. They will be interested in investing in the country only if they feel that there is growth potential looking at the monthly data.

In this section, we will be looking at the Capital Flows data of the U.S. collected in the Month of February and analyzed the impact on various currency pairs. This data is collected and published by the Department of Commerce’s Bureau of Economic Analysis. A higher than expected reading should be taken to be positive for the currency while lower than expected data is considered to be negative.

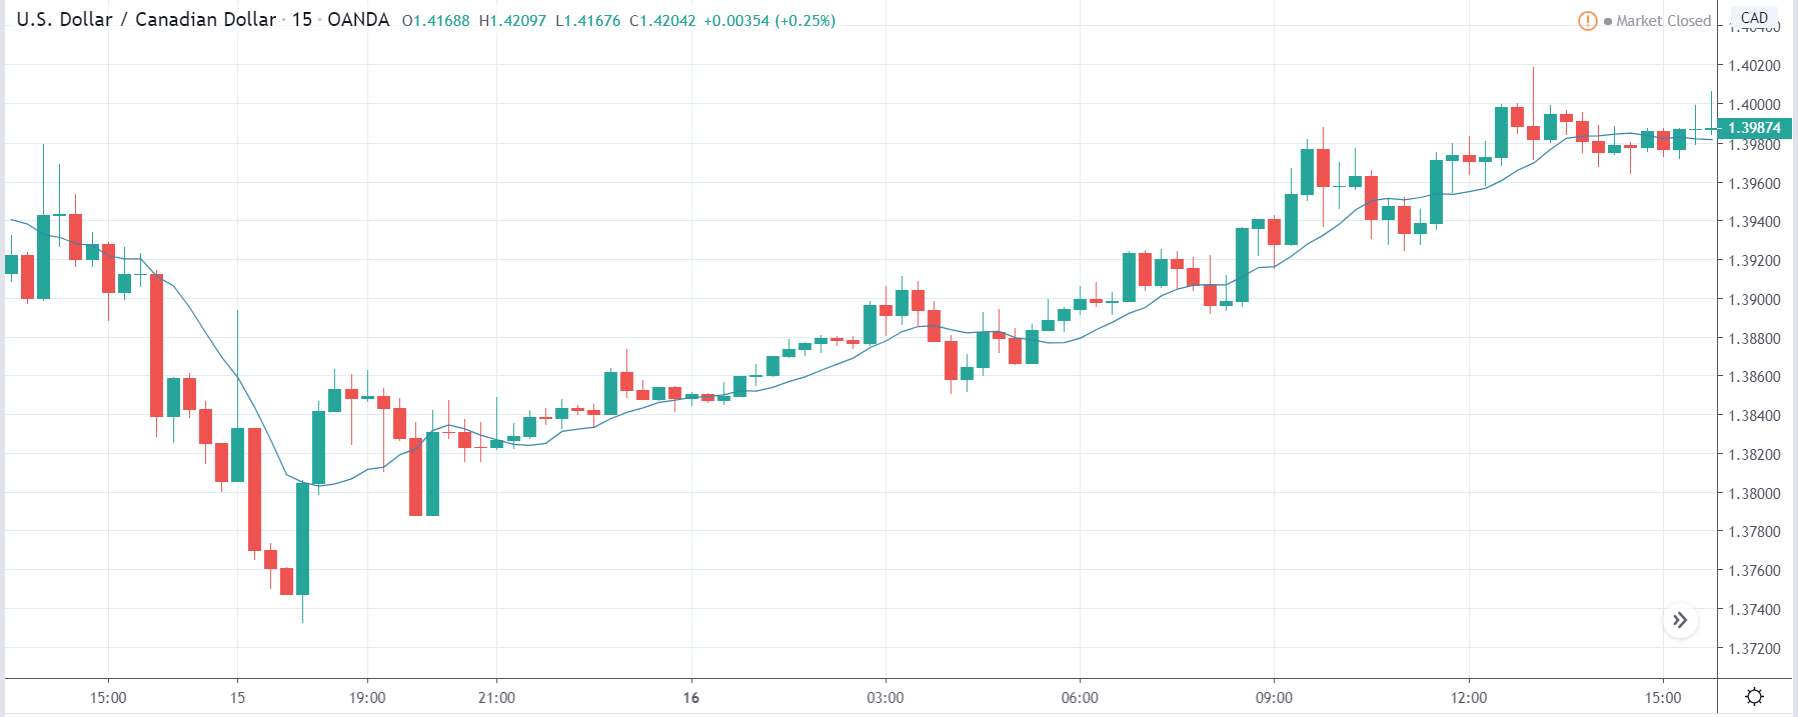
USD/CAD | Before The Announcement

Let us first analyze the USD/CAD currency pair. The above image shows the characteristics of the chart before the announcement was made, and we see that the pair in a strong uptrend moving aggressively higher. The uptrend could be due to another fundamental reason which we are not sure about. Thus, we should not be taking ‘short’ trades based on the forecasted data as we don’t see any signs of reversal on the chart.

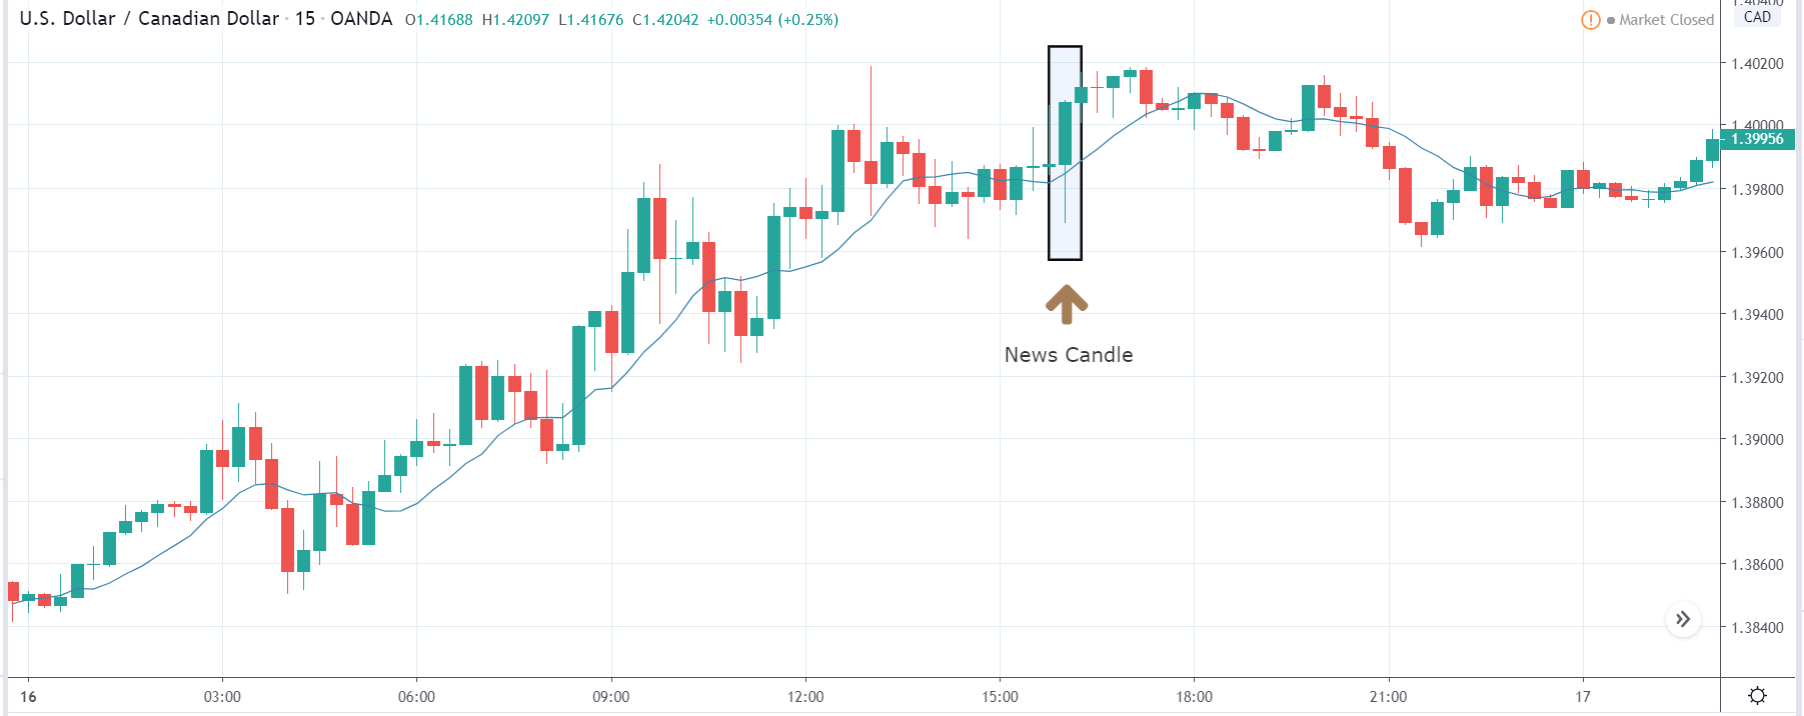
USD/CAD | After The Announcement

After the Capital flows data is published, we witness a large amount of volatility in the market, and finally, the price closed as a bullish candle. Due to the increased volatility, the price initially went lower, but later, when traders apprehended the numbers, they bought U.S. dollars aggressively, and the ‘news candle’ closed with great strength. This reaction was because the Capital Flows data was largely above expectations and much higher than last time. However, one should not chase the market and enter for ‘buy’ but instead wait for a retracement to join the trend.

AUD/USD | Before The Announcement

AUD/USD | After The Announcement

These are the images of the AUD/USD currency pair, where the first image shows the state of the chart before the announcement is made. In the first image, we see that the price is mostly moving in a ‘range,’ and there is a fair amount of volatility on both sides. Just before the news release, the price is a little above the ‘support’ area, and one can expect some green candles from this point.

This means one should be cautious before taking any ‘sell’ trade from here. After the news announcement, the price sharply drops lower, and we see a rise in the volatility to the downside. Traders again bought U.S. dollars in this pair, and the price closed as a strong bearish candle exactly at the ‘support.’ One could use the supply point of the ‘news candle’ and then take a ‘short’ trade with a  stop loss above the recent high.

NZD/USD | Before The Announcement

NZD/USD | After The Announcement

Next, we discuss the NZD/USD currency pair where before the announcement is made, the market is range-bound, and currently, the price is in the middle of the range. Aggressive traders who wish to ‘buy’ the currency pair based on the forecasted data can do so, but they do should be willing to close their positions after the release if there is a huge difference in the actual data.

But as the volatility is high to the downside, it is advised to wait for the news outcome and then trade based on the market reaction. After the news release, traders sell the currency pair owing to wonderful Capital Flows data for the U.S. economy, and here too, the price closes as a bearish candle. Now we are sure that the weakness could be increasing in the pair, and one can take a risk-free ‘short’ trade with a stop-loss above the ‘resistance’ of the range.

That’s about Capital Flows and the impact of its new release on the Foreign Exchange price charts. Let us know if you have any questions in the comments below. Cheers.

Categories
Forex Fundamental Analysis

Understanding The Impact Of ‘Corporate Tax’ On The Forex Price Charts

Introduction

The Corporate Tax is one of the most poorly understood economic indicators when it comes to fundamental analysis of currency pairs and the broader stock market. Most economists have concluded that the Corporate Tax is among the least efficient and least defensive Tax. Although, there is an ongoing debate among economists about the efficiency of Corporate Tax collection from various companies. Beurocrats have agreed that it causes significant distortions in economic behavior.

The common person on the street believes that the Tax is directly paid by Corporations, which is not true. Owners and Managers of corporations often assume that the Tax is simply passed along to consumers—the vagueness about who actually pays the Tax accounts for its continued popularity among officials.

What is Corporate Tax?

The Federal Corporate Tax differs from the individual income tax in two ways. First, the Tax is levied on the net income and not on gross income. This means the profit of the organization is also included in the net income with permissible deductions of business costs. Second, it applies only to businesses that as registered as Corporations and not as partnerships or sole proprietorships.

The Corporate Tax is levied at different rates for different brackets of income. For example, in the U.S., 15% on taxable income under $50,000, 25% on income between $50,000 – $75,000 and rates varying from 34% to 39% on income above that. The federal government has kept the rates low for small corporates with a lower turnover as it can benefit companies to a greater extent. However, lower rates have little economic significance. More than 90% of all the Corporate Tax revenue came from 1.5% of corporations with assets higher than $10 million.

States levy further income taxes on these corporations, the rates ranging from 3 to 12 percent. One of the main reasons behind low State Corporate Tax is that the states can easily relocate out of states that impose unusually high taxes.

Effect on Capital Flow due to Corporate Tax

Today, economists are of the opinion that the burden of Corporate Tax falls entirely on the owners of capital. The latest research says that, since capital is mobile, it will flow to investments that produce the highest after-tax returns. High Corporate Tax raises the cost of capital and reduces after-tax returns in the corporate sector, thus leads to relocation of capital into Tax-exempt sectors of the economy.

When governments reduce the rates under various tax brackets, it has two major effects. Firstly it increases the supply of capital available to corporations, and secondly, it increases the rate of return on investments in the non-corporate sectors as capital becomes more plentiful there.

The major drawback of the relocation of funds due to higher tax rates is that the burden of Tax ultimately shifts to workers and employees. The workers, over time, become less productive and earn lower real wages.

The Economic Reports

The Economic Reports of Corporate Tax are announced on a yearly basis for most of the countries. However, during economic emergencies, changes to the Tax rates will be made by the Finance Ministry to stabilize the money flow into the companies. In the U.S., the Corporate Tax data is published and maintained by the Internal Revenue Service (IRS), which is the government agency responsible for the collection of taxes and enforcement of tax laws. The IRS also handles corporate, excise and estate taxes, including mutual funds and dividends. People in the U.S. refer to the IRS as the “tax man.”

Analyzing the Data

Corporate Tax plays a vital role in the long term growth of a country. Most investors pay close attention to the Corporate Tax rate of a nation as it determines the development of the Manufacturing sector and GDP as a whole. Institutional traders compare the Corporate Tax rates of different economies and invest in those countries where the Taxes are low. They feel that lower tax rates lay down the path of growth for companies, and they will also be able to pay dividends to their shareholders.

Impact on the currency

When the government reduces tax rates, companies will be able to retain their profits, and hence this will lead to reinvestment in the company. This directly leads to the expansion of the business and will be able to increase production. When the Manufacturing sector starts to perform well, investors will be prompted to invest in the economy either by purchasing shares of a company or in the currency. When large investors invest, smaller fund houses also start buying the currency, which leads to an appreciation in the currency.

Sources of information on Corporate Tax

Corporate Tax data is available on the official website of every country’s Finance department, which also provides a comprehensive analysis of the same. Here are the Corporate Tax rates of some of the major countries of the world.      

Sources to find more information on Corporate Tax 

GBP (Sterling)AUD | USD | CAD | NZDJPY

There are many arguments in favor of the removal of Corporate Tax, but this is from the perspective of industries. When we think from the government’s point of view, the Corporate Tax is said to increase the revenue of the government, which is very much needed for running the nation. Executives believe that ‘an old tax is a good tax’ holds validity even today. Any major change in the tax regime imposes new costs and complications during the transition period.

Impact of Corporate Tax rates news release on price charts

We understood in the previous section of the article, the meaning of Corporate Tax, and the role it plays in an economy. In the following section, we will see how the Corporate Tax announcement impacts the value of a currency and cause volatility in the pair. The data of this economic indicator is keenly watched by long term investors and representatives of the manufacturing sector. In the below image, we can see that the Corporate Tax rate announcement has a moderate to high impact on the currency, and in most cases, the announcement is made by the Deputy Governor.

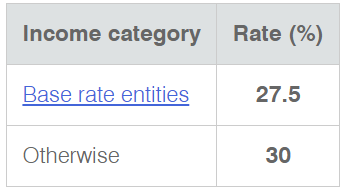
Today we will be analyzing the Corporate Tax rate of Australia, which shall be imposed on the companies for the current financial year. It is published on the official website of the Australian Taxation Office, which gives statistics of previous data as well. The below image shows that the Base Rate was fixed at 27.5%, while for the general category, the Tax rate was fixed at 30%. There were no changes in the Tax rate as compared to the previous year. Let us see how the market reacts to this data.


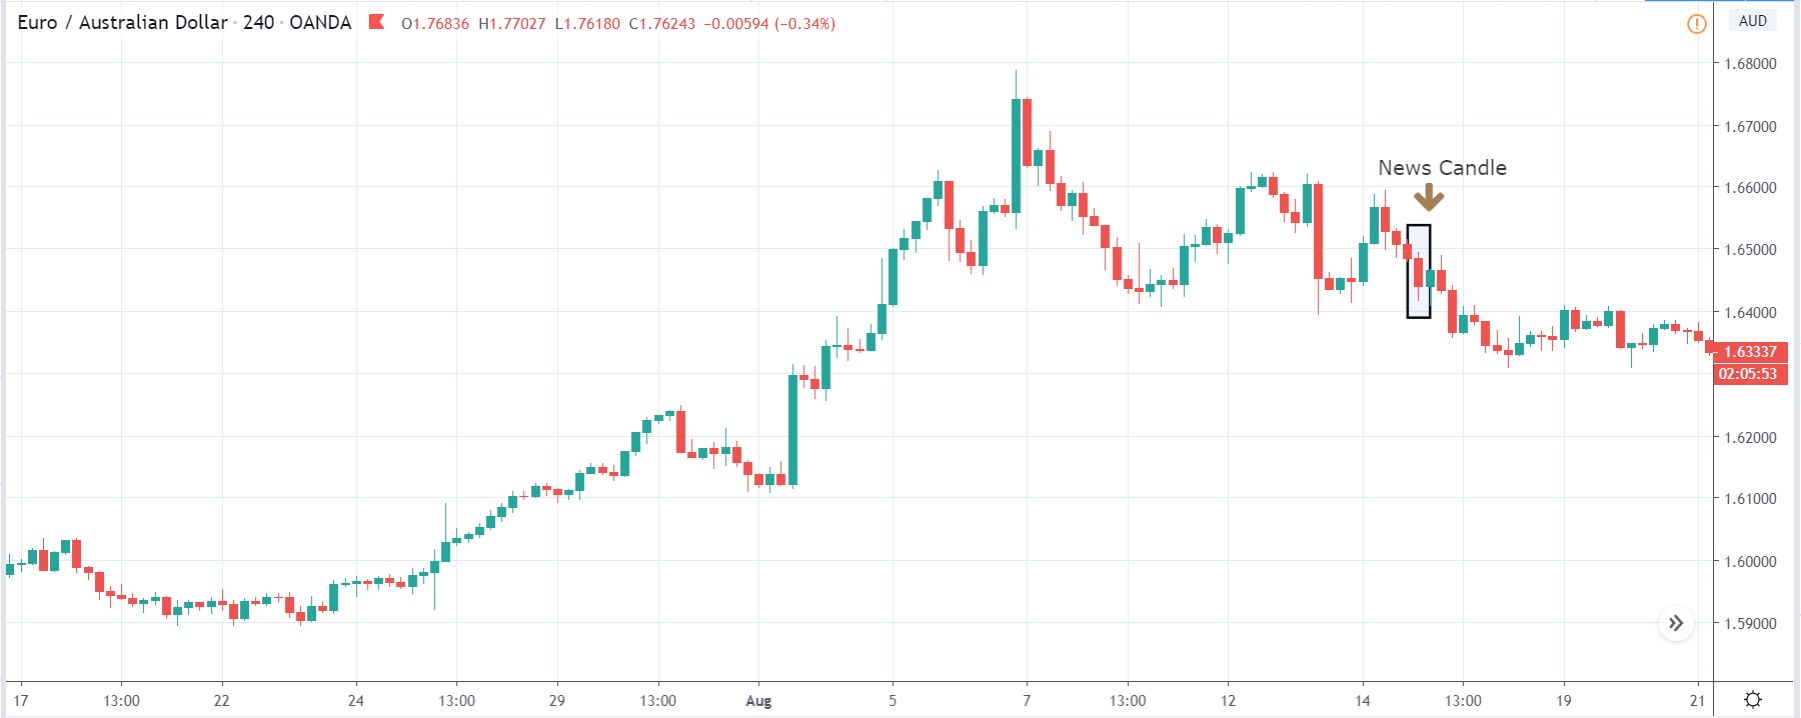
EUR/AUD | Before The Announcement

We shall first look at the EUR/AUD currency pair, where the above image signifies the state of the chart before the announcement is made. What we see is that the overall trend is up, and recently, the price has been moving within a range. We should be cautious before taking any sell trades in such chart patterns, as the price is at the bottom of the range, and the major trend is up. Depending on the news data, we shall trade the currency pair.

EUR/AUD | After The Announcement

After the Corporate Tax announcement is made, market crashes below, and we witness selling a fair amount of pressure, which takes the price lower, thereby strengthening the Australian dollar. One of the reasons behind the sudden downfall is that the Corporate Tax rates were maintained at the same level as before, which is said to be good the economy (due to overhead costs of changing rates). At this point, we cannot immediately go ”short” in the market as the price is the key ”support” level. Therefore, we should wait for the price to break the ”support” and then take a ”breakdown trade.” In such trades, the ”take profit” should be small based on the overall trend.

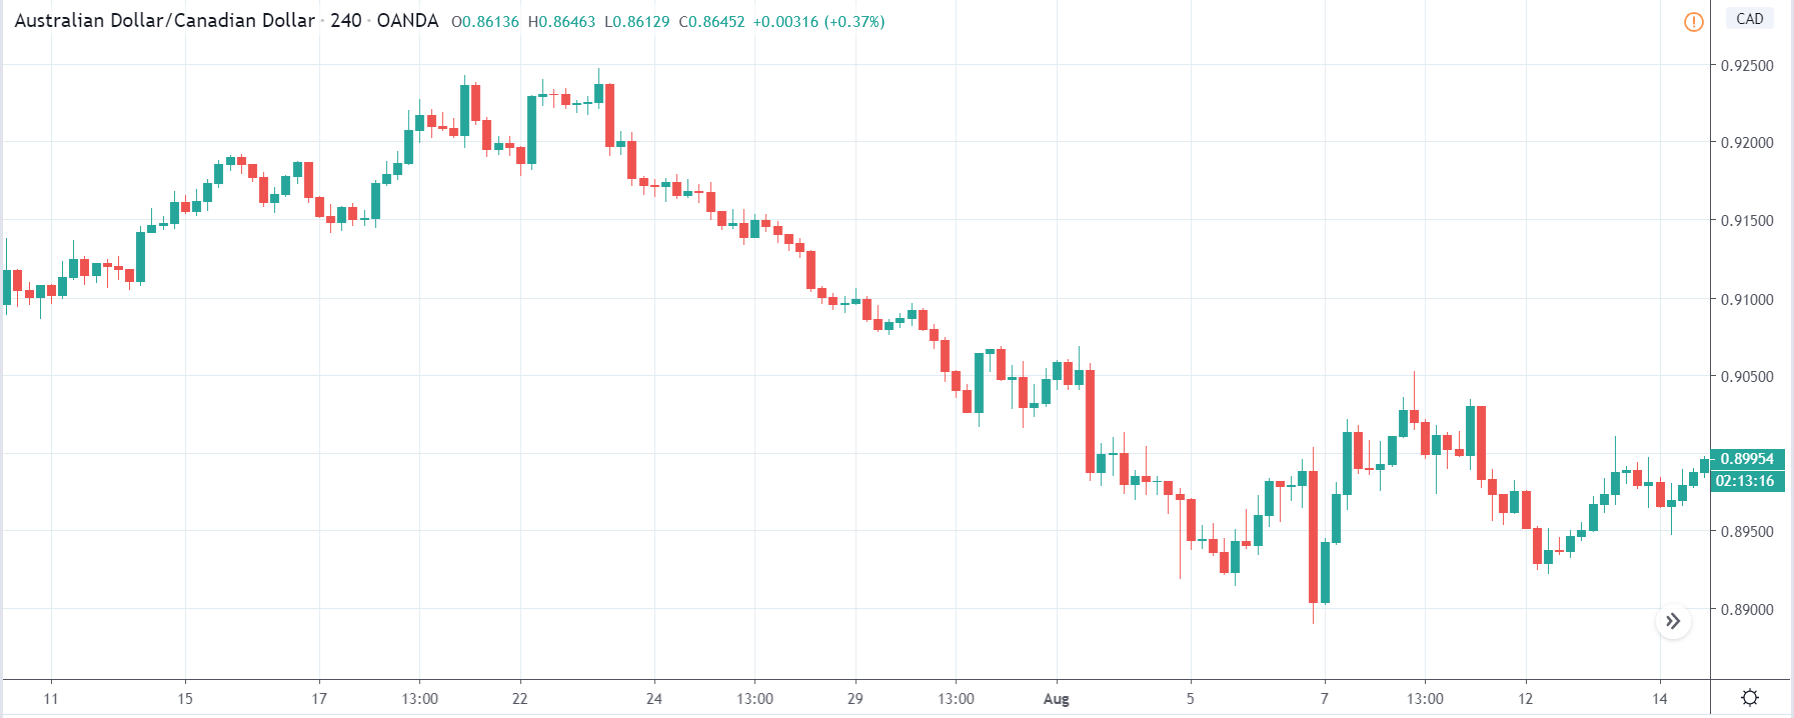
AUD/CAD | Before The Announcement

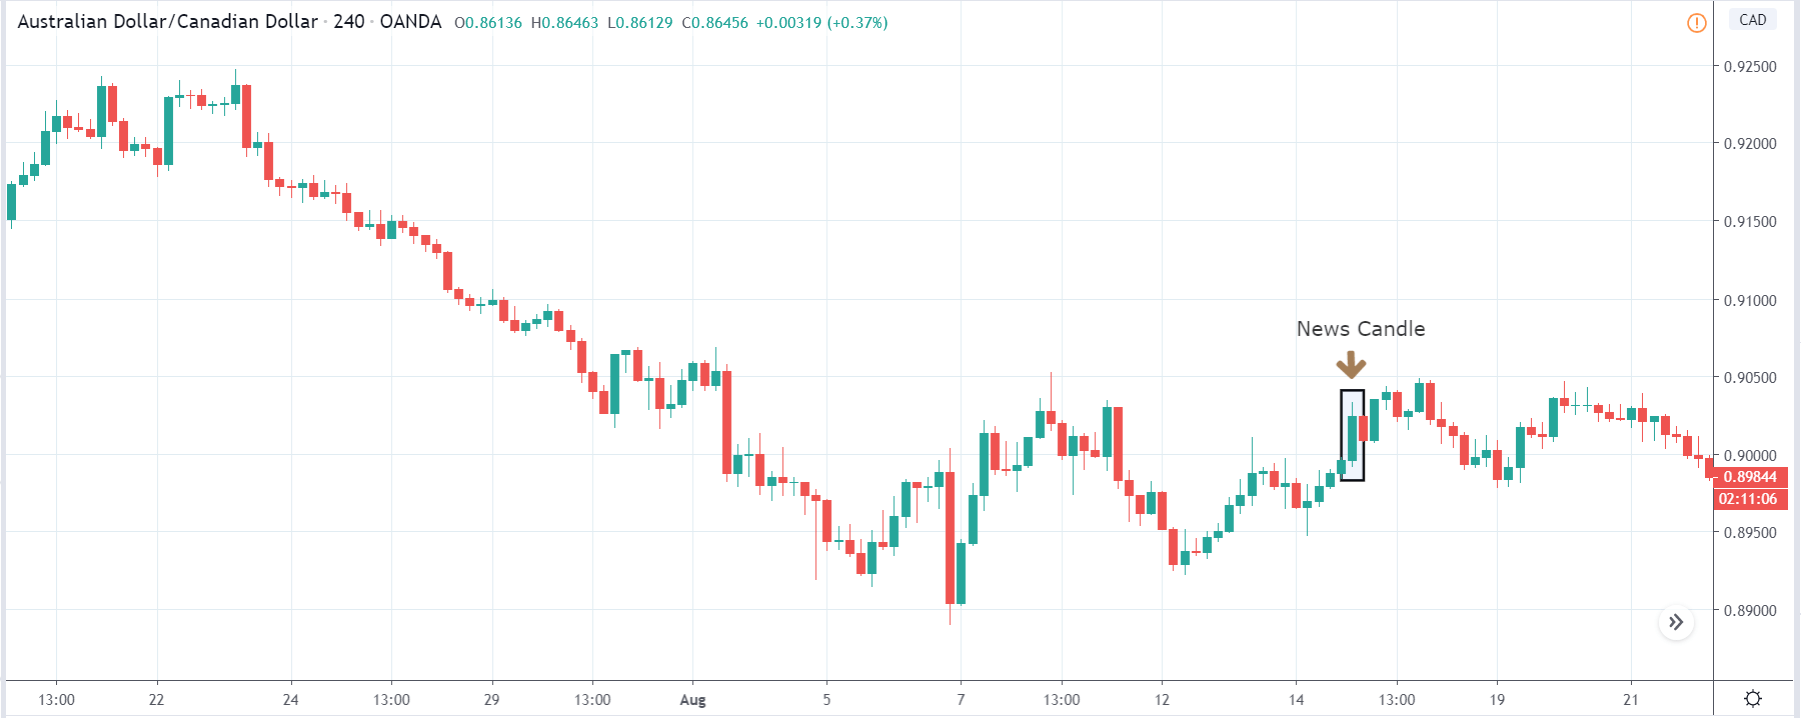
AUD/CAD | After The Announcement

The above images represent the AUD/CAD currency pair, and in the first image, we see that the overall trend is down, suggesting weakness in the Australian dollar, and now the price seems to be retracing the down move. If the data were to be positive for the Australian economy, we need to be extra cautious before attempting a buy trade as the trend is down, and there is a high chance that it might get sold into. However, bad news can work in our favor and might result in a further down move. After the news announcement, we see an increase in volatility to the upside, and the price closes with a bullish ”news candle.” Traders buy Australian dollars after they realize that the Corporate Tax rate was unchanged, which is good news for the manufacturing sector, particularly. One should be trading the pair on the long side, only after suitable reversal patterns are seen in the market.

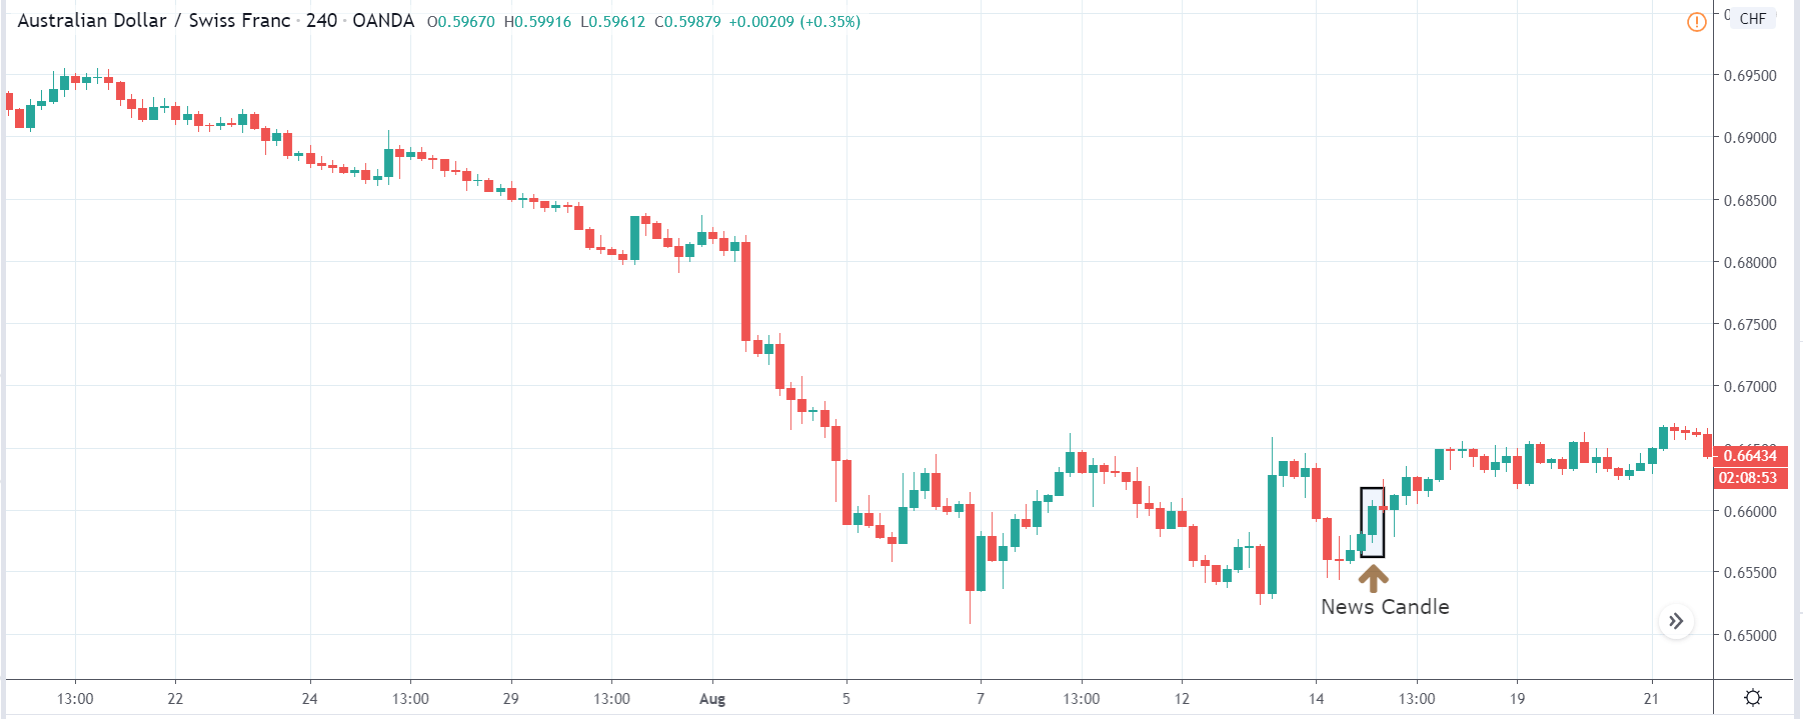
AUD/CHF | Before The Announcement

AUD/CHF | After The Announcement

This is the AUD/CHF currency pair, where the chart characteristics appear to be similar to the AUD/CAD currency pair. Also, here the market has recently formed a range and currently at the bottom of the range. In this pair, positive news data can prove to the ideal case for going ”long” in the market as the price is at a point from where some buyers can pop up anytime. In any case, it is advised to analyze the data and then trade. After the Corporate Tax rate announcement, the market again moves higher, and volatility increases on the upside, which strengthens the Australian dollar by little. The sudden surge in price is because of the positive Corporate Tax data, and thus traders turn bullish on the currency. One can go ”long” in the market with a ”take-profit” at the ”resistance” of the range and stop-loss below the ”support.

That’s about Corporate Tax rates and the impact of its new release on the price charts. Let us know if you have any questions in the comments below. Cheers.

Categories
Forex Fundamental Analysis

‘Non Farm Payroll’ as a Macro Economic Indicator & Its Impact On The Forex Market

Introduction

The NFP is one of the most important fundamental indicators in the Forex market, which causes large price movements in currency pairs. This article will explain the basics of NFP, the role of NFP in economics, and how to interpret the NFP data after its release.

What is the Nonfarm Payroll (NFP)?

The Nonfarm Payroll report gives the number of jobs added or lost in a country compared to the previous month. These numbers do not include agricultural farmers, employees belonging to the non-profit organization, self-employed individuals, private households, and employees of military agencies. NFP also provides the statistics of the long-term employment and youth unemployment rates. This indicator tells which sector of the economy is generating jobs and which are not. The government investigates these numbers carefully and takes appropriate actions to improve the employment situation of that sector.

The economic reports of NFP

The ‘Employment Situation’ report is a monthly report that is released by the Bureau of Labor Statistics (BLS) on the first Friday of every month. The report is released at approximately 8:30 in the morning. The NFP report is a comprehensive report that is made after the survey of two major sectors of the economy. The two sectors are the ‘Household Sector’ and the ‘Establishment Sector.’ The ‘Household Survey’ gives the employment rate of individuals in various categories, and the ‘Establishment Survey’ provides the number of new nonfarm payroll jobs added within the economy.

Survey of the ‘Household Sector’

Key components of this survey include

  • The total unemployment rates
  • Unemployment rate based on Gender
  • Unemployment rate based on Race
  • Unemployment rate based on Education
  • Unemployment rate based on Age
  • Reason behind unemployment
  • Participation (for employment) rate by individuals

Survey of the ‘Establishment Sector’

Key components of this survey include

  • The total nonfarm payrolls added by industries of durable goods, non-durable goods, services, and government
  • Hours worked by employees
  • Average hourly earnings of employees

Analyzing the Data

The economic report of NFP is an essential factor of fundamental analysis that investment managers evaluate before making investment decisions. This data is crucial when determining the strength of the economy and, thus, the value of the currency. One can analyze the data by comparing the release of the current month to that of the previous month. This comparison helps to determine if the country has generated more jobs for its people or have, they lost more jobs compared to the previous month.

Based on the month on month numbers, we can conclude if the economy is strengthening or deteriorating. We can also anticipate if the US economy will perform at the expected growth rate, or there will be a reduction in the GDP.

Impact on currency

When unemployment rates are low, banks and institutions gain confidence in that economy and will be willing to invest in that country. When several other banks invest in the country, it leads to an appreciation of the currency and the economy. Forex traders and investors consider this factor as a very important indicator for predicting the future value of a currency.

NFP data has a direct impact on most of the asset classes, including Forex, commodities, equities, and Index CFDs. It is seen that the market reacts quickly to the data with a huge rise in volume. During the news announcement, all major market players and institutions take new positions in the market or exit their existing positions. As millions of positions are created and removed at the same time, one can witness heavy volatility during the news release. The condition of the job market has a direct link to consumer spending, which represents the health of the economy. When people of a nation are employed, they use their wages for purchasing various goods and services to fulfill their needs.  This means the consumer spending automatically increases.

Sources of information on NFP

The Bureau of Labour Statistics (BLS) releases the typical NFP data on the first Friday of each month. However, the first round of data is released on the third Friday after the end of the reference week. But as traders, we need to focus on the data that is released on the first Friday of each month and monitor it carefully. We also need to keep with us the previous month’s data and the forecast for the current month. There are many financial websites that give a graphical representation of the historical data that will give a clear understanding of how the NFP data has changed over time.

Sources of information for major economies  

USDCHFCAD

Nonfarm Payroll is vital because it is released monthly and is a very good indicator of the current state of the economy. This data can be found on the ‘economic calendar’ of every broker. When the unemployment rate is high, policymakers tend to have a monetary that will increase economic output and increase employment. There are timely revisions that take place to review the components of NFP, and the components may change if necessary. Another aspect of unemployment is the number of working hours and hourly wages. It is possible that people are employed but will be working part-time or earning less for that work.

The NFP data release is accompanied by increased volatility and widened spreads, which means in order to avoid getting stopped out, we recommend using larger stop loss without changing the risk to reward ratio. This is possible is we use no leverage at all during NFP news release and enter with a smaller position in the market. We need to do 90% of the analysis even before the news is released so that when the actual data is out, we should quickly be able to decide if we have to go ‘long’ or ‘short’ in any given Forex pair.

Impact Of NFP News Release On The Forex market

The non-farm-payroll (NFP) is a key economic indicator that measures the health of the economy for the United States. The NFP represents the number of jobs added in a period of one month that excludes farmers, government employees, and employees of other non-profit organizations.

So, a higher than expected reading should be taken as positive for the US dollar, while a lower than expected reading is taken to be negative for the US dollar. NFP releases generally cause large movements not only in the forex market but also in the commodity and stock market. In this section of the article, we will explain the impact of NFP on the price chart and see how to apply the NFP data in our trading strategy.

The below image was taken from Forex Factory, and the red indication there implies that this Fundamental Indicator’s new release will have a strong impact on the Forex price charts.

The below image shows the latest NFP data that was collected for the month of February. The NFP data is published by the Bureau of Labor Statistics (BLS), which also carries out surveys across the country. Based on the NFP data, traders and investors from all over the world take suitable positions in the market, which is the reason behind increased volatility. The expected NFP results for March 8, 2020, was around 175k (job additions), and the actual data came out to be 273K (job additions), which was much better. Even though this should be positive for the US economy, let us see how the market reacted.

EUR/USD | Before the announcement | March 6th, 2020

We shall start with the most liquid currency pair in the world and see the impact of NFP news release on it. In the above chart, EUR/USD is in strong uptrend signifying the weakness of the US dollar. One of the reasons behind the weakness is lower NFP expectations from economists as compared to the previous data. The market feels that there were fewer job creations in the month of February, and hence they don’t want to buy US dollars. From a technical perspective, the market is just going up without a retracement, and we cannot take a position on any side at this point. When there is constant movement on one side, it is better to wait for the news outcome, and then based on the data, one can enter the market.

EUR/USD | After the announcement | March 6th, 2020

The NFP numbers were the same as before, and an equal number of jobs were created this time too. This was more than what the market was expecting and optimistic data for the US dollar. In the above chart, we see that the price falls soon after the NFP data was announced, and the US dollar strengthens all of a sudden. The volatility expands on the downside as NFP data was above expectations, but it could not result in a reversal of the trend. The ‘news candle’ leaves a wick on the bottom, and the price rallies further up. Since the current data was no better than previous data, some traders consider it to be negative for the economy and hence sell US dollars. Until one gets clear reversal patterns, he/she should not go ‘short’ in the market, thinking that the data is positive.

USD/JPY | Before the announcement | March 6th, 2020


USD/JPY | After the announcement | March 6th, 2020

The above images represent the chart of the USD/JPY currency pair, where the market is in a strong downtrend, again showing the weakness of the US dollar. Since the impact of NFP is high, robust data can result in a reversal of the trend, and a weak to not-so-positive data can result in trend continuation. For risk aversion, one needs to go ‘long’ in the market with a great amount of caution, and we need to combine the news outcome with technical analysis. However, it is much easier to go ‘short’ in the pair if the NFP data is not good. After the news announcement, we see the bullish candle and witness increased volatility on the upside. But this NFP data was not sufficient to talk the price even to the recent ‘higher high,’ this means the data was mildly positive for the US economy.

AUD/USD | Before the announcement | March 6th, 2020

AUD/USD | After the announcement | March 6th, 2020

In the AUD/USD currency pair, the US dollar is much stronger than other pairs where the price is below the moving average before the news announcement. Since the US dollar is already showing strength, we can say that a mildly positive data can take the currency lower and result in an extended downward move. And only a negative NFP data can result in an up move. After the NFP data is released, we see a formation of the ‘Doji’ candlestick pattern, indicating indecision in the market. As the price continues to remain below the moving average, we can expect the volatility to increase on the downside.

That’s about Nonfarm Payrolls and its impact on the Forex market. If you have any questions, let us know in the comments below. Cheers.

Categories
Forex Economic Indicators Forex Fundamental Analysis

Forex Fundamental Indicator – What you need to know about the GDP & GDP Growth

There are several components that make up fundamental analysis, but one of the most influential indicators is The Gross Domestic Product and the GDP growth rate. GDP is a well-known metric of economics and is one of the most important components when doing your fundamental analysis due diligence of a currency pair.

What is GDP

The Gross Domestic Product is defined as a monetary measure of the market value of all the final goods and services produced in a specific time period, often annually”- Wikipedia

This is the total economic activity generated by both private and public companies within a country in a specific time period.

Nominal GDP vs. Real GDP

Nominal GDP is the market value of all goods and services produced in an economy with inflation adjustments. Real GDP is the Nominal GDP, which has been adjusted for inflation.

Components of the GDP

The GDP is broken down into four components and is an indication of what a country is good at producing: Personal consumption expenditures of goods and services, business investments, government expending, and net exports of goods and services.

Personal Consumption expenditures

Consumer spending is one of the main contributors to production and is the best way to compare using data from different years. This is subdivided by the BEA into goods and services.

Goods are further subdivided into durable and non-durable goods. Durable goods are cars and furniture, for example, and have a lifespan of three or more years. Non-durable goods are fuel, clothing, food, etc.

Services include commodities that cannot be stored are consumed when purchased.

Business investments

This includes purchases that companies make to produce consumer goods, and not every purchase is counted as purchases must go to creating new consumer products. Again the BEA divides this component into two subcomponents;

Fixed Investment – It is a non-residential investment that consists of business equipment like software, capital goods, and manufacturing equipment, and this also includes commercial real estate construction and residential construction. This component is based on monthly shipment data from the BEA durable goods order report.

Change in private inventory – this is how many companies will add to their inventories of goods they plan to sell. As orders increase, companies may not have enough goods in stock and therefore order more to ensure supply and the increase in private inventories contributes to GDP. If there is a decrease in inventory orders, then companies will halt manufacturing, and if it persists, then staff reductions are next.
Government spending

This is an indication of the size of government across countries. There is a large variation in this indicator and highlights the countries’ approach to delivering public goods and services.

Net exports of goods and services

Imports and exports have an opposite effect on GDP as exports add to the GDP and imports subtract from the GDP data.


The economic reports

The economic reports of the GDP cover quarter or annual data periods, and this data is reviewed periodically until the final GDP data is released. There are some countries that release this data on a monthly basis, like the USA. However, the majority opt to release this data quarterly and annually.

Analyzing the DATA

The economic reports of the Gross Domestic Product are such an integral measure of economic activity that it is a vital component of fundamental analysis in a currency pair. The GDP data is a key measure in determining the strength of a country’s economy and hence the strength of its currency. By comparing the two sets of data on both currencies and comparing each set of GDP data to that of previous releases. This comparison helps to determine which of the two currencies is stronger, and enjoying a strong economy.

When analyzing this data, it is necessary to compare like for like economies as each country is at a different level of development. When we look at developing economies, we can anticipate seeing annual growth rates that exceed the norm, and for the emerging economies, annual growth rates can climb to double digits.

What is the GDP Growth Rate

The GDP growth rate measures how fast an economy is growing and is the next comparison, which is necessary in order to evaluate the previous years’ data is in line with the previous years for the same period. This collection of data shows the expansion or contraction of economic activity within a country.

What determines growth

A nation’s GDP growth rate determines its economic health. If the growth rate is positive, it indicates that the wealth of the nation is improving, and the economy is doing well. If the GDP growth rate is negative, meaning it has fallen below the previous period, it is a clear indication that the economy is declining. This decline in the GDP growth rate has serious ramifications as unemployment rises with the downturn of production.

Economic reports

The GDP economic reports are a vital measure of economic activity and integral to the fundamental analysis for any currency pair you wish to trade. This data is vital in determining the benefits of a particular economy and the strength of its currency. By comparing this data to previous years or periods, one is able to ascertain the progression of the expansion or contraction of the economic activity and thus evaluate if it is equivalent to the same period of previous years.

Impact on currency

The GDP growth rates are a massive driving factor in a currency’s performance because of the results that economic activity has on a currency. This means that higher levels of economic activity will generate a higher demand for a specific currency, and an increase in economic activity will also generate an increase in the total value of that economy.  The more value that a specific country’s economy has, the higher the value of its currency. What traders are looking at when analyzing this data is the difference found between the two currencies’ growth rates. As a rule of thumb, the currency which has a higher growth rate will generally experience an appreciation of its currency.


Sources of information on GDP

Most nations release their GDP data on a monthly, quarterly, and annual basis, and in the U.S., it is the Bureau of Economic Analysis (BEA) that publishes an advanced release of this data.

When one is contemplating doing their own fundamental analysis, it is imperative to take into account the effect that a country’s GDP will have on its currency strength and the importance of measuring the data rate from previous periods. The GDP data is closely monitored as it defines the movements of an economy is a straightforward way.

Links to GDP information resources:

IMF

https://www.imf.org/external/pubs/ft/weo/2019/02/weodata/index.aspx

OECD

https://data.oecd.org/gdp/gross-domestic-product-gdp.htm

USA

https://www.bea.gov/data/gdp/gross-domestic-product

Europe

https://ec.europa.eu/eurostat/statistics-explained/index.php/Main_Page

UK

https://www.ons.gov.uk/economy/grossdomesticproductgdp

Canada

https://www150.statcan.gc.ca/n1/daily-quotidien/190531/dq190531a-eng.htm

Japan

https://fred.stlouisfed.org/release/tables?rid=269&eid=155790#snid=155791

China

http://www.stats.gov.cn/english/statisticaldata/Quarterlydata/

Australia

https://www.abs.gov.au/ausstats/[email protected]/mf/5206.0

New Zealan­­­­d

https://www.stats.govt.nz/indicators/gross-domestic-product-gdp