Introduction
The GDP and Inflation rate are two of the most closely watched macroeconomic statistics by economists, business analysts, investors, traders, government officials, and the general population. The inflation rate has an impact on everyone, and no one is exempt from it. Understanding its effect on the currency, economy, living conditions, and how to use it for our analysis is paramount.
What is Inflation Rate, MoM?
Inflation: The increase in the prices of commodities over time is called inflation. It is the rise in the cost of living over time where the purchasing power of the currency depreciates. Inflation erodes the value of the currency, meaning a unit of currency can procure lesser goods and services than before. Inflation occurs when more currency is issued than the wealth of the country.
Inflation Rate: The percentage increase in price for a basket of goods and services for a particular period is called the inflation rate. It is used to measure the general increase in the cost of goods and services. It is contrasted by deflation, which refers to the appreciation of the currency and leads to decreased prices of commodities. When more currency chases, fewer assets inflation occurs.
Inflation Rate MoM: The general measure of the inflation rate is YoY, i.e., Year-over-Year. It serves as a means to measure how currency has faired over the year against inflation. The rate tells how fastly prices increased. The inflation rates are often low and incremental over time and hence make more sense for a YoY comparison for general use. However, for traders and investors, MoM is more useful for close monitoring to trade currencies.
How can the Inflation Rate MoM numbers be used for analysis?
As inflation continues, the standard of living deteriorates. Inflation is an essential economic indicator as it concerns the standard of living. Hence, it requires much attention to understand and analyze. Inflation can occur due to the following reasons: cost-push inflation, demand-pull inflation, and in-built inflation.
Demand-pull inflation: When too few goods are chased by too much money, we get demand-pull inflation. It is the most common form of inflation. The demand for commodities is so high that people are willing to pay higher prices.
Cost-push inflation: It occurs when there is a limit or constraint on the supply side of the demand-supply equation. A limited supply of a particular commodity makes it valuable, pushing its price higher. It can also occur when the cost of manufacturing or procuring raw materials increase that forces businesses to sell at higher prices.
Built-in inflation: It occurs out of people’s adaptive expectations of future inflation. As prices surge, workers demand higher pay due to which manufacturing costs increase and form a feedback loop. It forms a wage-price spiral as one feeds of another to reach a new higher equilibrium.
Inflation mainly affects middle-class and minimum wage workers as they immediately experience the effects of inflation. Generally, the monthly inflation rates would be less than 1% or 0.00 to 0.20% in general. Such increments can be useful for currency traders to short or long currency pairs by comparing relative inflation rates.
Central authorities are committed to ensuring a low and steady inflation rate throughout. The policies are also drafted to counter inflation or deflation. The central authorities would likely intervene with a loose-monetary policy to inject money into the system and induce inflation when the economy is undergoing a slowdown or deflation. A tight monetary policy (withdrawing money from the economy) would be used to induce deflation to counter hyperinflation.
Impact on Currency
The monthly inflation rates are essential economic indicators for both equity and currency traders. It is an inversely proportional high-impact coincident indicator. An increase in the inflation rate deteriorates currency value and vice-versa. As it has a direct impact on the currency, the volatility induced as a result of significant changes in the inflation rate is also high.
Economic Reports
There are multiple indices to measure the inflation rate. The CPI, Producer Price Index (PPI), Personal Consumption Expenditures (PCE), GDP Deflators are all popular statistics used for measuring inflation in a variety of ways.
The Bureau of Labor Statistics (BLS) of the United States releases the CPI and PPI reports on its official website every month. The GDP Deflator is published by the Bureau of Economic Analysis (BEA) every quarter. The PCE is also published by BEA every month.
Sources of Inflation Rate MoM
BLS publishes the Consumer Price Index (CPI) and Producer Price Index (PPI) on its official website. The data is available in seasonally adjusted and non-adjusted versions, as inflation is also affected by business cycles. A comprehensive and visual representation of these statistics is available on the St. Louis FRED website. The BEA releases its quarterly GDP deflator statistics and monthly Personal Consumption Expenditure (PCE) on its official website for the public. Consolidated statistics of monthly inflation reports of most countries are available on Trading Economics.
How the Monthly Inflation Rate Data Release Affects The Price Charts
For this analysis, we will use the monthly consumer price index (CPI) to measure the rate of inflation. The Bureau of Labor Statistics releases the MoM CPI data in the US. It measures the change in the price of goods and services from the perspective of the consumer. The most recent data was released on August 12, 2020, at 8.30 AM ET and can be accessed at Forex factory here. An in-depth review of the latest CPI data release can be accessed at the BLS website.
The image below shows the most recent changes in the MoM CPI in the US. In July 2020, the US CPI changed by 0.6%, the same increase as that of June.
Now, let’s see how this release made an impact on the Forex price charts.
EUR/USD: Before Monthly CPI Release on August 12, 2020,
Just Before 8.30 AM ET
From the above 15-minute chart of the EUR/USD, the pair can be seen to be on a steady uptrend before the CPI data release. The 20-period MA in steeply rising with candles forming above it.
EUR/USD: After Monthly CPI Release on August 12, 2020,
8.30 AM ET
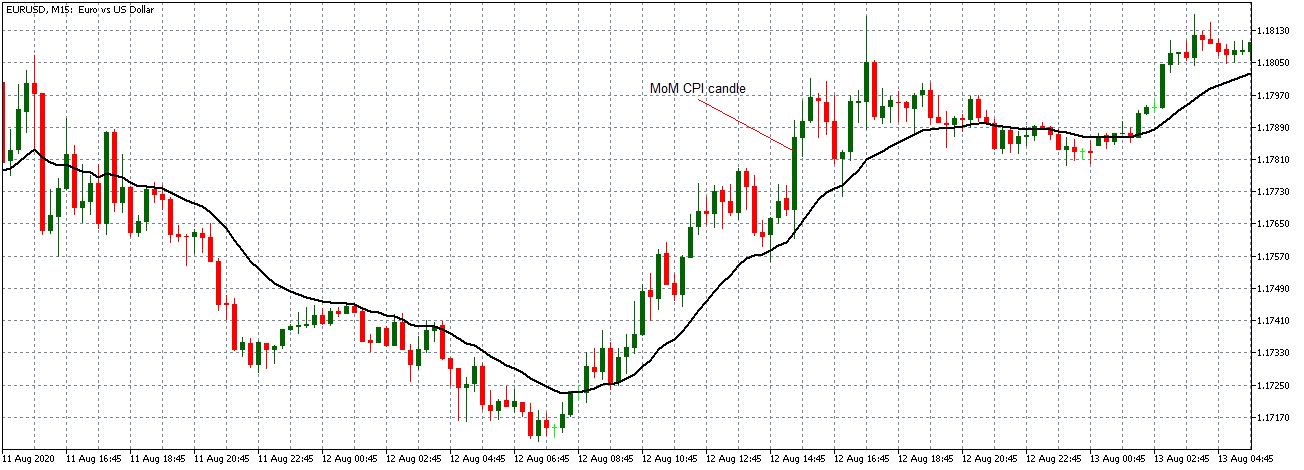
After the data release, the pair formed a long 15-minute bullish candle indicating that the news release negatively impacted the USD. The pair subsequently continued trading in the previously observed uptrend.
Now let’s see how this news release impacted other major currency pairs.
AUD/USD: Before Monthly CPI Release on August 12, 2020,
Just Before 8.30 AM ET
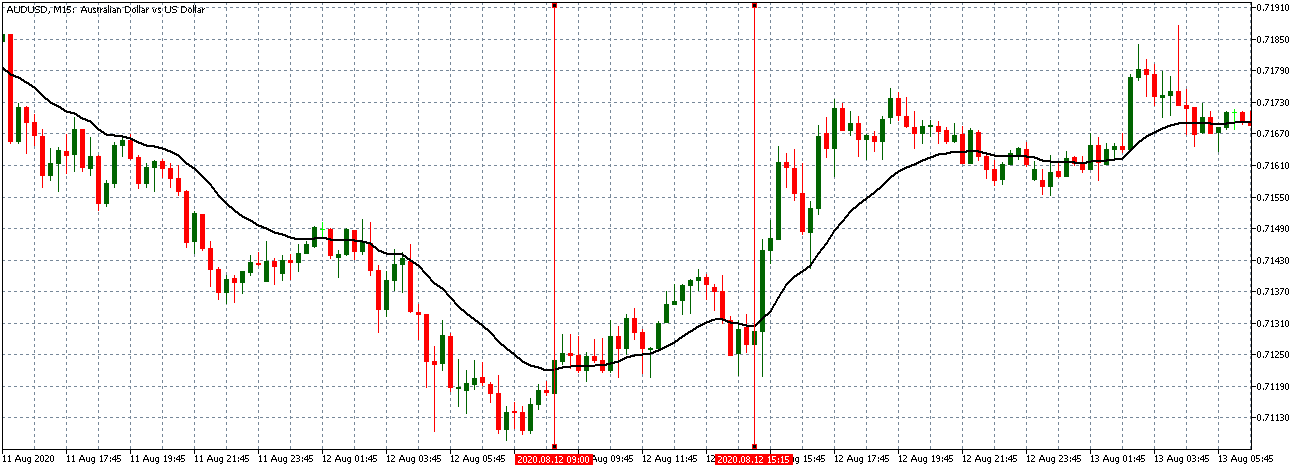
The AUD/USD pair traded in a subdued uptrend before the data release. The 15-minute candles are forming just around an almost flattening 20-period MA.
AUD/USD: After Monthly CPI Release on August 12, 2020,
8.30 AM ET
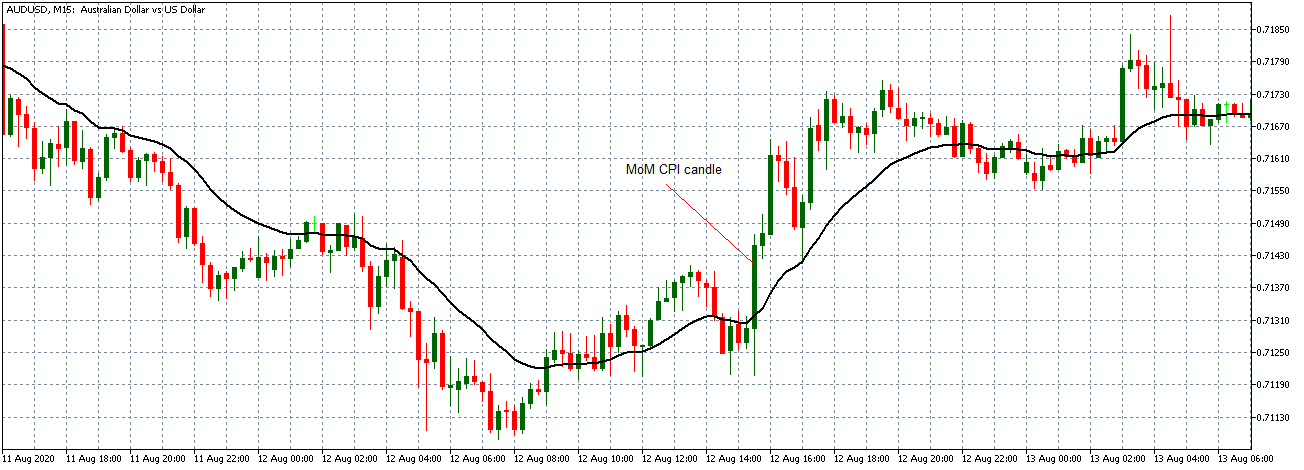
Like the EUR/USD pair, the AUD/USD formed a long bullish 15-minute candle after the news release. Afterwards, the 20-period MA steeply rises as the pair adopted a steady uptrend.
NZD/USD: Before Monthly CPI Release on August 12, 2020,
Just Before 8.30 AM ET
NZD/USD: After Monthly CPI Release on August 12, 2020,
8.30 AM ET
Before the data release, the NZD/USD pair traded within a neutral pattern with the 15-minute candles crisscrossing an almost flattening 20-period MA. As observed with the other pairs, the NZD/USD formed a long 15-minute bullish candle after the news release. It subsequently traded in a steady uptrend with the 20-period MA steeply rising.
Bottom Line
In theory, an increasing rate of CPI should be a strong USD, but as observed in the above analyses, a high CPI resulted in a weakening USD. The CPI is often considered a leading indicator for interest rate; hence, a rising CPI is accompanied by a rising interest rate. However, since the US Fed had already indicated that it has no intention of increasing the interest rate, a high CPI implies a depreciating USD. It is, therefore, imperative that forex traders have the Fed’s decision in mind while trading with CPI data.

