Categories
Cryptocurrencies

3 Assets that Will Keep Your Investment Inflation Resistant

Inarguably, the value of the dollar today is not the same as it was a decade or two ago. You use more currency to buy less, and that is what inflation is all about.

Inflation can be defined as the measure of the average price level, in an economy, of a unit of goods and services. It is the increase in the price over a particular period, where you cannot use the same amount of currency to purchase a specific item. 

No doubt, the pandemic and the rushed measures to control it were devastating to the world economy. Governments worldwide scrambled to shut down their economies and started printing money to control the spread while also trying to keep the local market functional.

The main issue with printing excess money is that it eventually decimates the host government’s currency and pushes the economy into an inflationary spiral. 

Nonetheless, inflation is a natural event, and only the most disciplined investor benefits from it or reduces its effect on their investments. 

How to Safeguard Against Inflation

In response to the COVID-19-inspired economic fallout, the Fed was forced to pull out all the stops in a bid to control it. These measures have pushed the Federal Reserve balance sheet to over the $7 trillion mark from $4 trillion, and further contractions are expected.

But what should you do as an investor? 

Ideally, there are two factors to look out for when searching for an inflation-resistant asset; real yield and store of value.

An asset with a large store of value such as gold does not lose its purchasing power over a particular period. If the asset can also create income, the better, as it fulfills the two requirements.

There are a couple of other benchmarks that measure potential hedges against inflation, and they include how the asset holds its value over time. Other essential factors include how people perceive the assets as a store of value across borders and how quickly it can be monetized.

Lastly, the ideal inflation-resistant asset should be easily movable across geographical borders in case of unforeseen hurdles.

The perspective of bitcoin as a viable store of value that can be monetized quickly is gaining traction, at least in recent months. Bitcoin is also beyond the control of any government and is, therefore, borderless.

Understanding the Top Three Assets That Will Keep Your Investment Inflation-free

While changes in the inflation level depend on various factors, such as the rapid increases in raw materials prices and rising wages, the coronavirus pandemic is the most significant.

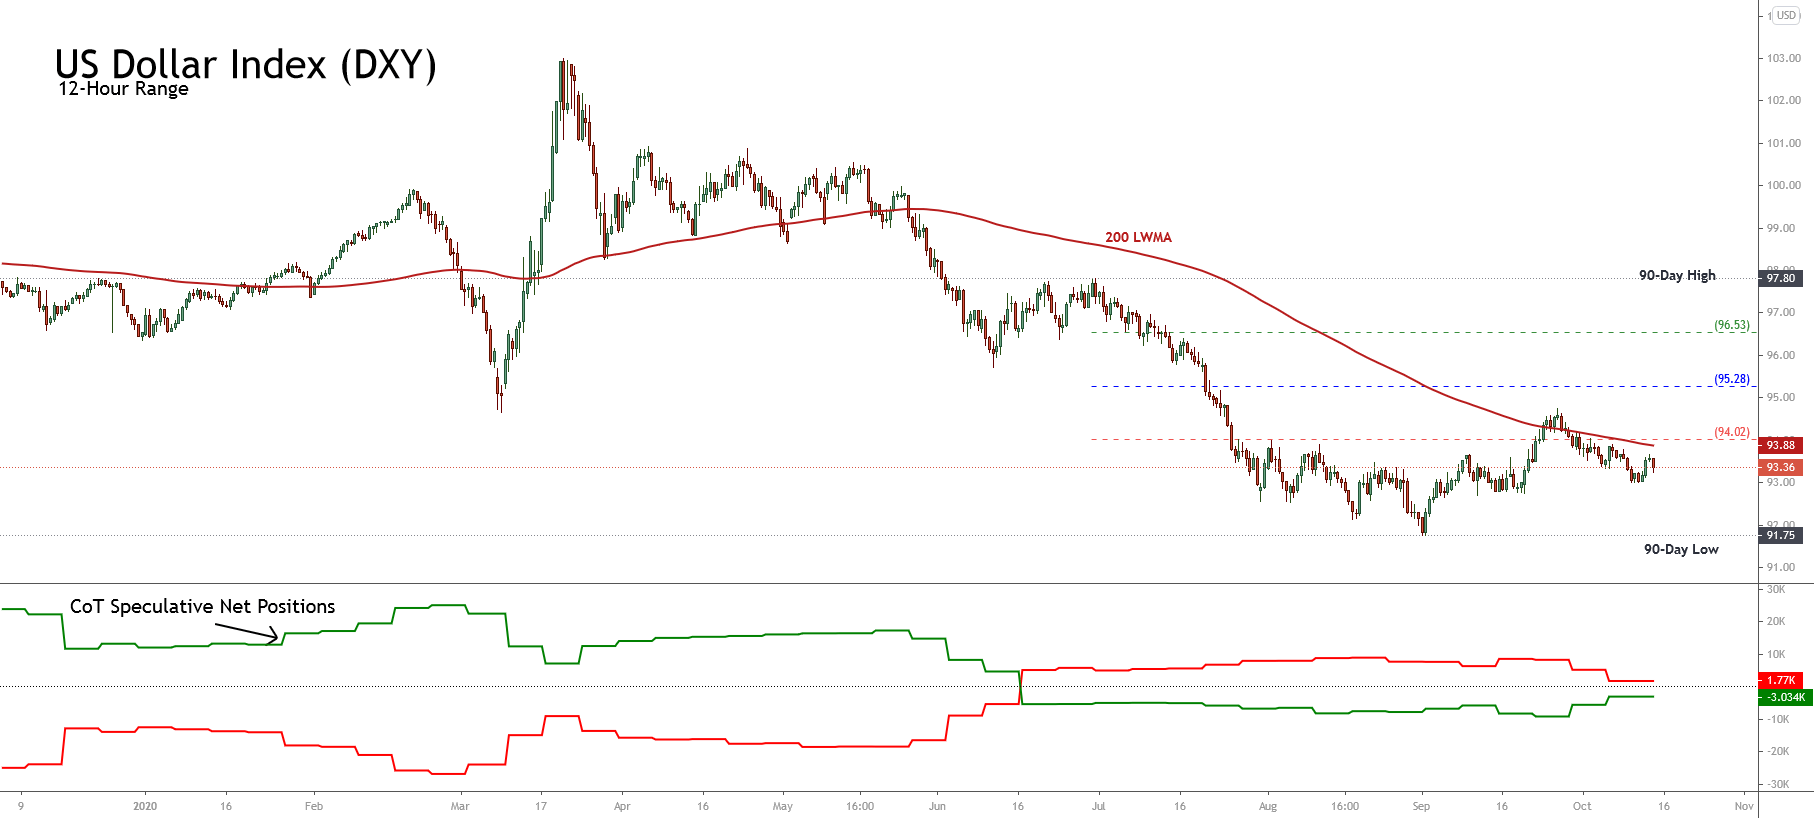
In the last century, the US dollar buying power has been on a free fall, mostly because of the monetary, fiscal policy adopted. The Federal Reserve’s primary response has been to print money and purchase securities on the open market to plug an economic crisis like it is happening now. Although it adds more liquidity to the market, this policy diminishes the value of the dollar, which sometimes aggravates an already dire situation. 

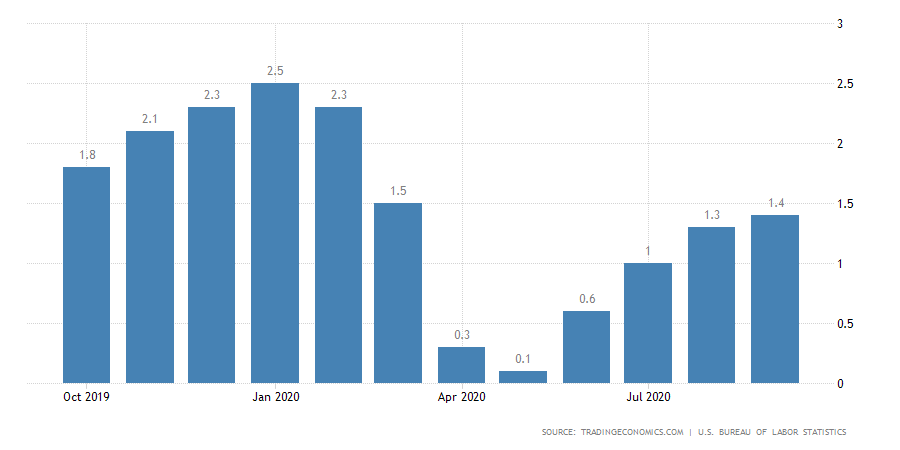
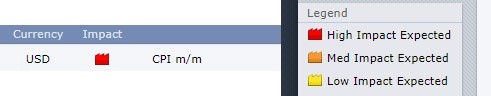
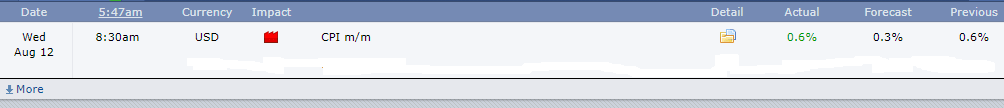
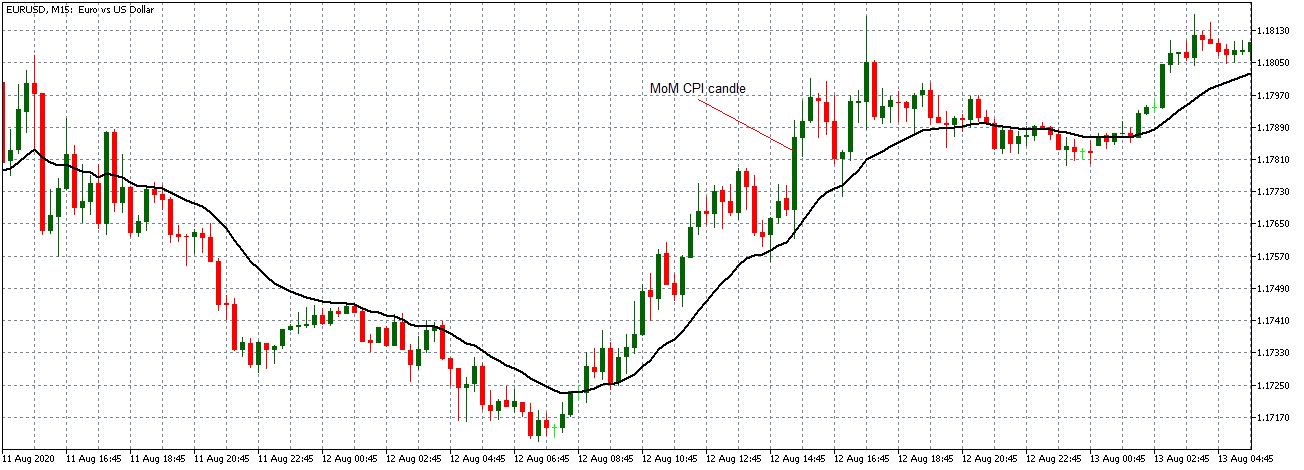
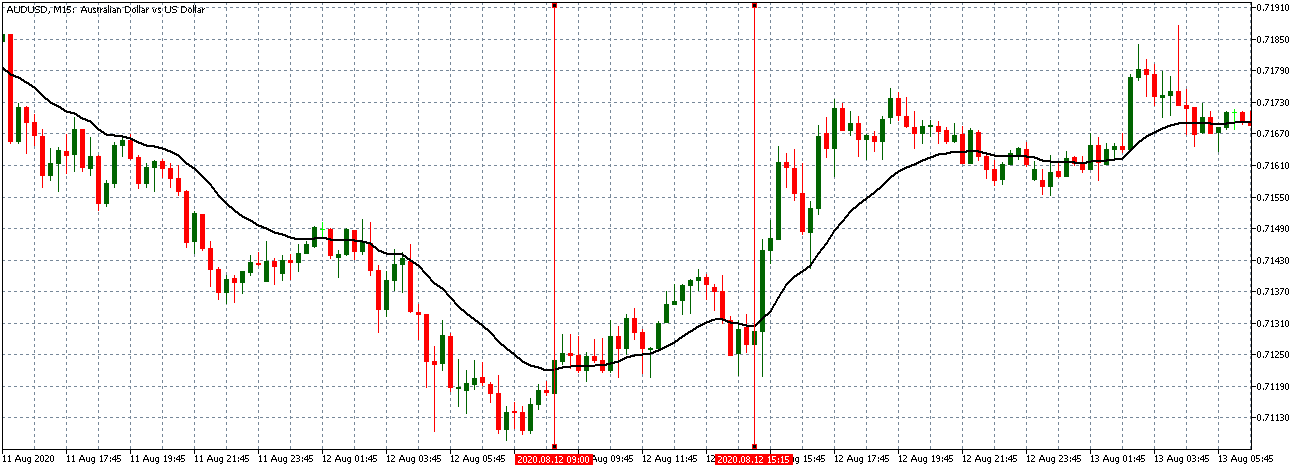
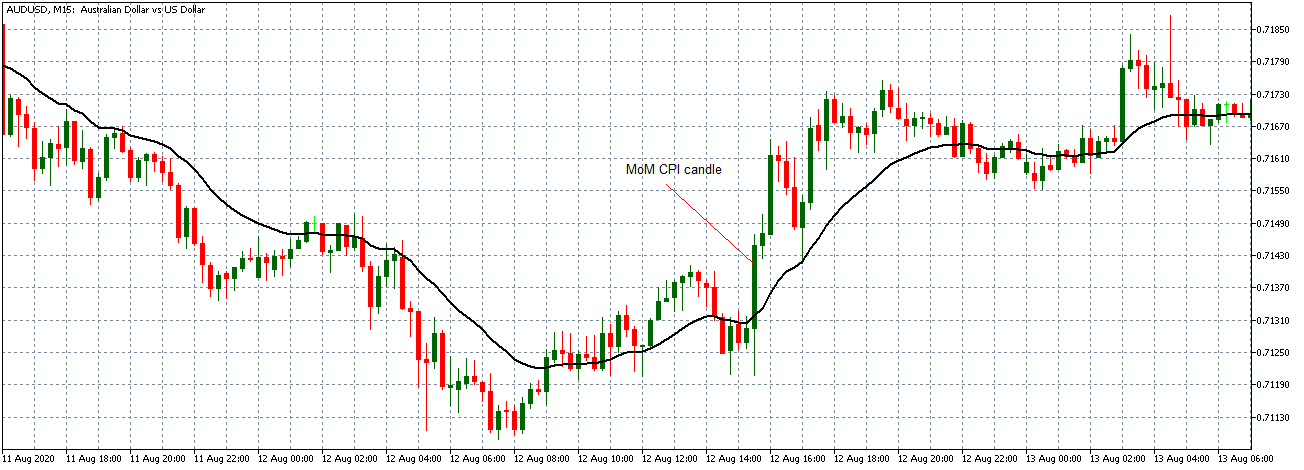
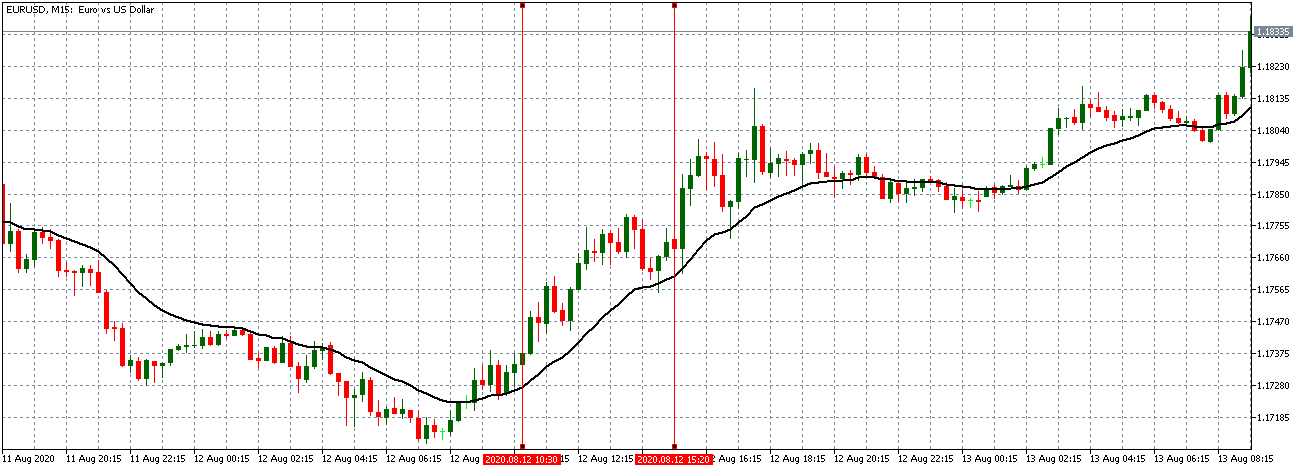
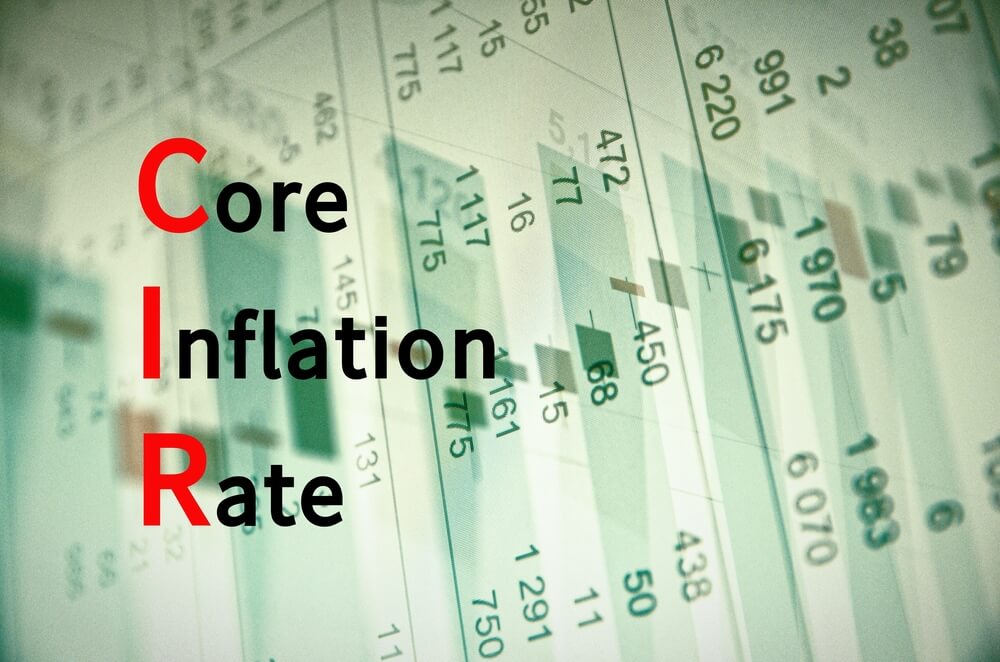
Consumer Price Index (CPI) is the primary method of tracking US Dollar inflation. As far back as 1948, the inflation rate has been at an average of around 2%. This translates to a loss in value of up to 2% every year. That means the money in your savings account is losing its value.

Although inflation is a significant characteristic of market economies, it is possible to plan for it by focusing your investment in asset classes that outperform the market during such challenging times.

Gold 

Traditionally, gold has been the perfect inflation hedge based on its stability. Not long ago, gold went above the $2,000 an ounce ceiling to record a 27% raise last year, 2020, which is quite enormous. 

In fact, many people have previously viewed gold as a possible alternative currency, especially in countries whose money is losing value fast. This precious metal is tangible and real and tends to hold its value in the long term, like no other asset.

Typically, it is common practice for gold or other strong currency to replace a weakened local currency to keep the economy sane. Central banks around the world hoard gold as they start to print money. They spend more of the bad money, which loses value and hold on to the good money, which is gold.

Unfortunately, gold is not always the perfect hedge in tough economic times. When inflation is in an upward trajectory, central banks move in to enforce a monetary policy that includes increasing interest rates. Assets such as gold, with no yields or any other accumulating rewards, are not always the best investment vehicle.

Other better assets will protect your wealth from inflation and still give you good yields. However, diversification is vital for a strong portfolio.

Bitcoin

Last year, bitcoin was up by 66%, and the rise continued into the new year to post a high of $40,519.45, an all-time high. With its exceptional value, bitcoin is hedging against inflation and chaos.


The borderless and decentralized cryptocurrency is beyond any government control, and they cannot print more of it like they do with the standard currency. The maximum bitcoin supply is 21 million, which serves to limit the supply and prevent eventual dilution.

Bitcoin supply remains constant, regardless of what the local governments do.

Interestingly, the current government shutdowns are playing in the hands of digital assets such as cryptocurrency, thereby increasing its value as an inflation hedge asset. But how is that so?

Clearly, the current shutdowns have directed the focus to digital currencies. This may be one of the reasons that propelled bitcoin to an all-time high. It is one of the few assets posting excellent results, which is good for crypto investors. 

Stocks

Thanks to coronavirus, the S&P 500 index surged 55% from the lows observed in March last year despite all the groom. Similar to bitcoin and gold, the lockdowns and the resulting money printing has caused a rally to the stocks. But how can this happen? 

According to economists, the stocks’ value is not appreciating, but rather the dollar is depreciating against the stocks. The surge in equities is a significant indication of diminishing trust in the local currencies, which forces the wise investor to add more stocks to their portfolio to safeguard against losses.

Apparently, investors have lined up to take up stocks at the expense of fiat currencies.

Final Word

Ostensibly, most investors do not give a hoot about inflation and its effect on day-to-day trading and investment. Well, indeed, what you can’t see can’t hurt you, but inflation is the exception. It will hit where it hurts the most; your financial well-being.

The common practice is to hoard local currency in the form of savings to safeguard against tough times. Putting away something for the rainy day is alright, but the strategy has a significant flaw. You lose a bit of the savings to inflation. Saving in a bank is not a viable option, especially when the global central banks do everything to devalue the local currency.

The looming economic crisis, driven by the continued printing of money, calls for wise investment decisions. Ideally, invest in inflation hedge assets such as gold, bitcoin, and stocks to weather the current storm. Don’t be on the losing side by putting so much faith in the dollar and other global currency.

Categories
Forex Market

The Inflation That Will Never Really Come

The sole objective of the entire Keynesian economy is to generate inflation. That is what the Keynesian shamans call economic growth, inflation. People often don’t understand what inflation means or why it exists and that makes them fall for the generally false belief that inflation makes debts evaporate.

This is a crucial point where your incorrect analysis leads to a completely erroneous vision and predictions. I will try to clarify this fundamental error because although it is a rather abstruse and technical matter, it is essential to understand it because on this depends everything that is happening and everything that is going to happen.

The fundamental error comes from blind faith in the power of shamans: the shaman, in the fanciful world of Keynesians, can cause rain whenever he wishes and, therefore, whether it is raining or not, or whether it will rain tomorrow depends only on a certain correlation of political forces between a certain group of pro-rain shamans and another group of anti-rain shamans. If it doesn’t rain, it is because for now, the anti-rain shamans are resisting the pressures they are subjected to by those who want it to rain.

The fact that the yen’s monetary economy has been crushed for 20 years by powerful deflationary forces, incapable of generating any inflation, should, according to the Keynesians, in the face of the group of pro-inflationary shamans, supporters of pressing the red button labeled “INFLATION” There would be certain very powerful groups that have been opposing the push of that button. The problem with this explanation between mythology and gibberish is that these “powerful groups opposed to an inflationary monetary policy in Japan” do not exist.

The explanation is another: if there is no inflation it is because the laws of the economy do not allow it to exist. This button, which allows the Central Bank to trigger inflation “when it is convenient” (when it is convenient for the State), works until it ceases to function and it is precisely this “which stops the inflation button” that marks, as a symptom, the death of a Keynesian economy.

The Keynesian growth model that we have experienced for the past 40 years is an economic farce that simulates creating wealth when what it actually does is consuming (destroying) capital (“capital” in the economic sense). This suicidal escape, analogous to the scene of “more wood, that is war,” in which Marx scrapped the train to feed its wood to the boiler of the locomotive, ends when there is no longer capital that can be consumed. This is what you have to understand, to understand what is happening.

The fact that consumers, businesses, and states appear severely over-indebted is not important, it is only a symptom. The fact that nominal interest rates are capped at their decline with the “zero limits” preventing the big clown from generating negative real rates, is not important, it is just a symptom. The fact that the financial system is deliriously leveraged and severely broken is also only a symptom. The fact that rich countries roll out insane trade deficits with poor countries and rich economies depend on loans from poor countries, that national pension systems are bankrupt and unable to pay pensions, are also symptoms.

All these are just symptoms that the capital that had been progressively consumed has already disappeared. It must be understood that the golden age of wine and roses was not a time of genuine economic prosperity, based on the ability of society to create economic wealth, but was a mirage in which we seemed to be rich because, in an insane orgy of consumption, We were destroying the capital that previous generations took 200 years to accumulate.

It must be understood that large monetary bubbles do not appear by chance, as an accident, or as a social pathology consisting of an epidemic of speculative greed. Monetary bubbles are just an exaggerated version of what a Keynesian economy always does, and in the midst of panic, is to consume capital while generating inflation, money, and unpayable debt. A process based on consuming capital is inherently unsustainable and the more advanced the Keynesian pathology, the less real capital remains in the world and the more gigantic the states have become and their appetite to consume capital (The sole purpose of the Keynesian toy is to satisfy the insatiable appetite of the State and to guarantee its unlimited growth). 

The succession of large-scale monetary bubbles, which condemn large sections of the population to be crushed by debt, always marks the agonizing end of the Keynesian experiments. They are a last flight forward and are characterized by the glamour and splendor of consumer orgies in which the last real savings available are destroyed. (See the “Happy 20s” that preceded the Great Depression)

Bubbles, and in a particular house or land bubbles, are just a terminal episode of a much broader disease called Keynesianism. When, for example, the leverage of Japanese banks soared, it was perfectly foreseeable that they would suffer a housing bubble and when the housing bubble materialized, it was perfectly foreseeable that their economy would collapse amid desperate and futile attempts to “beat the deflation.” The cliché “inflation ends up wiping out debts” is only true in the early stages of Keynesian disease, when “inflation” can take the form of a “wage-price spiral.”

Debtors, whether States, consumers or corporations, have a fixed-rate debt, which means that both the value of that debt and the value of the debt service are fixed in nominal terms. Also, the savings of savers is fixed nominally. A price-wage spiral is a change in the scale of the nominal value of the currency. As the value of the currency shrinks, debts and savings shrink to the same extent. Debtors see their debts evaporate because savers see their savings evaporate. It is a transfer of income from savers to debtors and is part of the general scheme of making the economy present some joy by consuming existing capital. (The real savings are transferred by the State to the debtors who consume it. Then the debts are erased and a new lot of savings can be transferred for consumption)

In the current situation, where wages are falling, and variable mortgage rates and prices are rising, it is obvious that “inflation” will not evaporate any debt. The one who made 1,000, paid a mortgage of 600 and bought a shopping basket for 400. If the mortgage rises to 700, the shopping basket to 450, and the salary is lowered to 900, this wage earner will not have the slightest feeling that “inflation” is helping him pay off his debts.

That these debtors have loans at variable and not fixed rates, that the installments of these mortgages are 60% of wages even when the rates are at 1.25% and that these loans have been granted by banks with leverage of x60, that they obtain a gross margin of 0.4% of those loans that they finance with the saving of some investors in fixed income willing to lend their saving for the 1.25% minus a differential of 0.35%, is not a set of misfortunes that have coincided accidentally. They are all features of the same phenomenon and express the terminal phase of a Keynesian economy based on capital consumption. The various “Band-Aids” that try to alleviate some of these superficial symptoms will not cure the disease because the cause is deeper: it is an explosive growing state that literally devours its subjects.


Categories
Cryptocurrencies

Indicators DeFi Investors need To Know: Number 4 Is A must Have.

Decentralized finance (Defi) is one of the relatively new blockchain applications, and it can be confusing for newcomer investors. Be that as it may, the pace at which the space is growing leaves no time to ‘wait and see.’ DeFi is evolving crazy fast, and new metrics are being invented to help investors weigh their options. Given the novelty of the subject, there are no widely-accepted standards yet. Still, there are some common indicators that we can use to judge whether one DeFi protocol is better than the next.  

This article looks at some of the top metrics that you can use to compare DeFi protocols.

#1. Total Value Locked (TVL) 

This is perhaps the most-common indicator when it comes to evaluating DeFi protocols. TVL refers to the total of funds locked in a given protocol. An easier way to understand it is to think of it as the dollar value of all tokens held in a smart contract for a given DeFi project. 

As an investor, you can know the general interest in a particular DeFi by just looking at its TVL. It is equally useful when evaluating the market size of different projects. In crypto, TVL would be the equivalent of market capitalization. 

TVL is simple yet confusing. If a user deposits 10 BTC then borrows BTC 5 and thereafter deposits back the 5 BTC, the market would report 100 BTC. But, there have been deposits amounting to 140 BTC. That’s part of the confusion that’s associated with this metric. 

TVL was created by DeFi Pulse, the world’s leading DeFi resource. Although liquidity providers usually fund DeFi projects in crypto, TVL is measured in dollars. As pointed above, there has been confusion abounds regarding the accuracy of TVL. However, as initially mentioned, DeFi and all its metrics are still evolving. Until such a time when there will be general agreement on these indicators, TVL remains a useful metric for evaluating the investment potential of a DeFi project.

#2. Token Supply

Token supply tells investors how many tokens are ‘floating’ in an exchange. When there’s a high number of tokens floating in an exchange, token holders are likely letting go of their tokens, which creates an increase in the supply. This could be happening for the same reasons it happens in other money markets. For example, investors could be fearing that the market is getting riskier. 

A high volume of token supply could result from a whale selling off their shares in some instances. The same phenomenon could also be observed when investors use their holdings as collateral for a margin or futures trade. As such, while the token supply on exchanges can tip you off of an impending voluminous sale, it might not be as straightforward. Crypto is typically traded on centralized exchanges, although this trend is changing in favor of decentralized exchanges. The advantage of centralized exchanges is that they are usually able to maintain stronger liquidity. 

#3. Changes in Token Balances

Tracking token supply on exchanges is a savvy move. And as a trader, you can complement this by finding out how balances are changing. Volume tracking is a bit static and does not accurately picture a market’s current financial trend. Evaluating the changes in token balances will likely give you a better picture of what is happening.

Typically, a large change in token balances tells you that the market is currently volatile. For example, if large holders are accruing tokens, you might notice large withdrawals from exchanges. As is the case with the other metrics discussed above, treat this only as a guide.

#4. Unique Address Count

Unique address count is the number of addresses that are holding a given token. A high number of addresses likely means that there is a high number of users on that market. By contrast, if you only see a relatively small number of addresses, it could be that the DeFi protocol has yet to gain widespread adoption. 

Since the number of unique addresses is a static metric, it would be more meaningful to track the new addresses’ rate. This will give you a better picture of how fast users are joining the DeFi protocol. And just like how it works with bull runs in the money markets, the best time to join is when the adoption rate is high. This is the time when you would typically expect the fastest growth in your investment.

Beware, though: one user could create multiple addresses and distribute their tokens to all of them. Therefore, this indicator should also be used merely as a guide, and better yet, be used in combination with other indicators.

#5. Inflation

Inflation is the rate at which new tokens are being pumped into the ecosystem – just like with economic inflation. Usually, limited supply alludes to the rarity of tokens and hence a higher value. If new tokens are being minted easily and fast, existing ones will be devalued at the same rate. 

However, it’s advisable to approach this indicator with some caution. In economics, rising inflation encourages people to spend and thus promotes economic growth. The same phenomenon can be observed in DeFi, where an increasing supply of tokens can boost investor sentiment and actually result in bullish activity. In the same way, limited supply could only be temporary. Thus, it would be best if you did not conflate token scarcity with value. 

#6.Price-to-Sales Ratio

The price-to-sales ratio (P/S ratio) is used to assess whether an asset is undervalued or overvalued. In traditional finance, this ratio is obtained by dividing a company’s revenue by its stock price. In DeFi, it’s calculated by dividing the protocol’s market capitalization by its revenue. Generally, a relatively high value means that the DeFi project could be overvalued. 

#7. Non-Speculative Usage

Non-speculative usage refers to the usefulness of a token beyond mere hype. When you’re evaluating a token’s value, it is important to check whether there is a solid project behind the token. It might be difficult to track whether token purchases are based on speculation or people are actually buying them for specific uses. 

Final Thoughts

DeFi is a fast-rising financial tech that promises investors new and exciting opportunities. As a DeFi investor, it helps to be able to analyze and compare different protocols. The above indicators can steer investors in the right direction when it comes to evaluating different DeFi options. Always analyze each DeFi protocol by its merits or lack of them, and most importantly, do your own research.

Categories
Forex Market Analysis

US Dollar Index Consolidates Expecting Further Declines

Overview

The U.S. Dollar Index (DXY) develops a mid-term sideways formation inside a long-term bearish trend that looks incomplete. During this year, the Greenback sheds -4.31% (YTD). Although the positive inflation data expanded the price in Tuesday’s trading session, it was not enough to boost the price toward fresh highs.

Market Sentiment Overview

The U.S. Dollar Index (DXY) retreats 0.23% in Wednesday’s trading session by erasing the advance that the Greenback made on Tuesday, driven by inflation data, which exceeded surveyed analysts’ expectations reaching 1.4% (YoY).

Although the data released by the U.S. Bureau of Labor Statistics this Tuesday exceeded the expectations of market participants and Federal Reserve policymakers boosting the price to climb 0.53%, the reading observed would not have a greater impact on the rate decision of the next FOMC broad meeting. Still, it would be more focused on the evolution of the labor market.

The following chart illustrates the U.S. Dollar Index in its 12-hour timeframe. The figure exposes the 90-days high and low range, reflecting that the market participants’ sentiment remains on the extreme bearish side. The price action remains below the 200-period weighted moving average, confirming the bearish sentiment.

On the other hand, the last Commitment of Traders Report unveils institutional traders’ bearish bias, confirming the bearish sentiment exhibited by the U.S. Dollar Index.

Therefore, according to the Federal Reserve policymakers’ expectations, the labor market’s evolution could be a factor contributing to the U.S. Dollar Index volatility increase. On the other hand, as long as the price remains below 94.02 pts and below the 200-period average, the Greenback bias will remain on the extreme bearish side.

Technical Analysis Outlook

The U.S. Dollar Index, in its 4-hour chart, illustrates a sideways movement from a long-term bearish sequence, which seems to be incomplete. The mid-term sideways structure is limited by September 01st low of 91.75 pts, with a top of the sideways range at the level reached on September 25th, located at 94.74 pts.

The above figure shows that the mid-term trading range moves between 91.75 pts and 94.82 pts. This market context suggests that the currencies included in the U.S. Dollar Index basket might continue developing sideways movements in the coming trading sessions.

On the other hand, the Elliott Wave perspective overview reveals that the price developed a three-wave bullish movement from the September 01st low of 91.75 pts, which ended on 94.74 pts.

Currently, the DXY index develops a pause formation in a bearish sequence that could evolve in three waves. This consolidation structure identified as wave ((b)) in black is still in progress.

Accordingly, the U.S. Dollar Index should complete the consolidation movement identified by the short-term sideways channel before continuing with its mid-term bearish trend.

Categories
Forex Fundamental Analysis

Understanding The ‘Inflation Rate MoM’ Macro Economic Indicator

Introduction

The GDP and Inflation rate are two of the most closely watched macroeconomic statistics by economists, business analysts, investors, traders, government officials, and the general population. The inflation rate has an impact on everyone, and no one is exempt from it. Understanding its effect on the currency, economy, living conditions, and how to use it for our analysis is paramount.

What is Inflation Rate, MoM?

Inflation: The increase in the prices of commodities over time is called inflation. It is the rise in the cost of living over time where the purchasing power of the currency depreciates. Inflation erodes the value of the currency, meaning a unit of currency can procure lesser goods and services than before.  Inflation occurs when more currency is issued than the wealth of the country.

Inflation Rate: The percentage increase in price for a basket of goods and services for a particular period is called the inflation rate. It is used to measure the general increase in the cost of goods and services. It is contrasted by deflation, which refers to the appreciation of the currency and leads to decreased prices of commodities. When more currency chases, fewer assets inflation occurs.

Inflation Rate MoM: The general measure of the inflation rate is YoY, i.e., Year-over-Year. It serves as a means to measure how currency has faired over the year against inflation. The rate tells how fastly prices increased. The inflation rates are often low and incremental over time and hence make more sense for a YoY comparison for general use. However, for traders and investors, MoM is more useful for close monitoring to trade currencies.

How can the Inflation Rate MoM numbers be used for analysis?

As inflation continues, the standard of living deteriorates. Inflation is an essential economic indicator as it concerns the standard of living. Hence, it requires much attention to understand and analyze. Inflation can occur due to the following reasons: cost-push inflation, demand-pull inflation, and in-built inflation.

Demand-pull inflation: When too few goods are chased by too much money, we get demand-pull inflation. It is the most common form of inflation. The demand for commodities is so high that people are willing to pay higher prices.

Cost-push inflation: It occurs when there is a limit or constraint on the supply side of the demand-supply equation. A limited supply of a particular commodity makes it valuable, pushing its price higher. It can also occur when the cost of manufacturing or procuring raw materials increase that forces businesses to sell at higher prices.

Built-in inflation: It occurs out of people’s adaptive expectations of future inflation. As prices surge, workers demand higher pay due to which manufacturing costs increase and form a feedback loop. It forms a wage-price spiral as one feeds of another to reach a new higher equilibrium.

Inflation mainly affects middle-class and minimum wage workers as they immediately experience the effects of inflation. Generally, the monthly inflation rates would be less than 1% or 0.00 to 0.20% in general. Such increments can be useful for currency traders to short or long currency pairs by comparing relative inflation rates.

Central authorities are committed to ensuring a low and steady inflation rate throughout. The policies are also drafted to counter inflation or deflation. The central authorities would likely intervene with a loose-monetary policy to inject money into the system and induce inflation when the economy is undergoing a slowdown or deflation. A tight monetary policy (withdrawing money from the economy) would be used to induce deflation to counter hyperinflation.

Impact on Currency

The monthly inflation rates are essential economic indicators for both equity and currency traders. It is an inversely proportional high-impact coincident indicator. An increase in the inflation rate deteriorates currency value and vice-versa. As it has a direct impact on the currency, the volatility induced as a result of significant changes in the inflation rate is also high.

Economic Reports

There are multiple indices to measure the inflation rate. The CPI, Producer Price Index (PPI), Personal Consumption Expenditures (PCE), GDP Deflators are all popular statistics used for measuring inflation in a variety of ways.

The Bureau of Labor Statistics (BLS) of the United States releases the CPI and PPI reports on its official website every month. The GDP Deflator is published by the Bureau of Economic Analysis (BEA) every quarter. The PCE is also published by BEA every month.

Sources of Inflation Rate MoM

BLS publishes the Consumer Price Index (CPI) and Producer Price Index (PPI) on its official website. The data is available in seasonally adjusted and non-adjusted versions, as inflation is also affected by business cycles. A comprehensive and visual representation of these statistics is available on the St. Louis FRED website. The BEA releases its quarterly GDP deflator statistics and monthly Personal Consumption Expenditure (PCE) on its official website for the public. Consolidated statistics of monthly inflation reports of most countries are available on Trading Economics.

How the Monthly Inflation Rate Data Release Affects The Price Charts

For this analysis, we will use the monthly consumer price index (CPI) to measure the rate of inflation. The Bureau of Labor Statistics releases the MoM CPI data in the US. It measures the change in the price of goods and services from the perspective of the consumer. The most recent data was released on August 12, 2020, at 8.30 AM ET and can be accessed at Forex factory here. An in-depth review of the latest CPI data release can be accessed at the BLS website.

The image below shows the most recent changes in the MoM CPI in the US. In July 2020, the US CPI changed by 0.6%, the same increase as that of June.

Now, let’s see how this release made an impact on the Forex price charts.

EUR/USD: Before Monthly CPI Release on August 12, 2020, 
Just Before 8.30 AM ET

From the above 15-minute chart of the EUR/USD, the pair can be seen to be on a steady uptrend before the CPI data release. The 20-period MA in steeply rising with candles forming above it.

EUR/USD: After Monthly CPI Release on August 12, 2020, 
8.30 AM ET

After the data release, the pair formed a long 15-minute bullish candle indicating that the news release negatively impacted the USD. The pair subsequently continued trading in the previously observed uptrend.

Now let’s see how this news release impacted other major currency pairs.

AUD/USD: Before Monthly CPI Release on August 12, 2020, 
Just Before 8.30 AM ET

The AUD/USD pair traded in a subdued uptrend before the data release. The 15-minute candles are forming just around an almost flattening 20-period MA.

AUD/USD: After Monthly CPI Release on August 12, 2020, 
8.30 AM ET

Like the EUR/USD pair, the AUD/USD formed a long bullish 15-minute candle after the news release. Afterwards, the 20-period MA steeply rises as the pair adopted a steady uptrend.

NZD/USD: Before Monthly CPI Release on August 12, 2020, 
Just Before 8.30 AM ET

NZD/USD: After Monthly CPI Release on August 12, 2020, 
8.30 AM ET

Before the data release, the NZD/USD pair traded within a neutral pattern with the 15-minute candles crisscrossing an almost flattening 20-period MA. As observed with the other pairs, the NZD/USD formed a long 15-minute bullish candle after the news release. It subsequently traded in a steady uptrend with the 20-period MA steeply rising.

Bottom Line

In theory, an increasing rate of CPI should be a strong USD, but as observed in the above analyses, a high CPI resulted in a weakening USD. The CPI is often considered a leading indicator for interest rate; hence, a rising CPI is accompanied by a rising interest rate. However, since the US Fed had already indicated that it has no intention of increasing the interest rate, a high CPI implies a depreciating USD. It is, therefore, imperative that forex traders have the Fed’s decision in mind while trading with CPI data.

Categories
Forex Fundamental Analysis

Everything About Food Inflation & The Impact Of Its Release On The Forex Market

Introduction

Capitalist economies achieve economic growth using inflation as the primary fuel. Low and steady inflation rates are essential for achieving target GDP each year. Not all commodities inflate steadily and proportionally. Disproportional inflation amongst different sectors leads to over and underpricing of commodities. Food and Energy are the most basic of necessities in today’s modern society. Understanding how food inflation affects the population and the overall economy will help us better understand the inflation trends and their consequences.

What is Food Inflation?

Inflation is the typical increase in prices of commodities and a decrease in the purchasing power of money over time. Inflation is required to motivate people to work better to be able to afford it. If prices were stagnant, the necessity to grow or earn more would cease, thus halting the growth of a nation on the macro level. When that happens, people will remain in their current financial state and would not progress. Hence, inflation is the “necessary evil” or the required fuel for capitalist countries to achieve economic growth.

Food Inflation refers to the general increase in prices of food commodities. As prices inflate, our current income’s purchasing power erodes. Food and Energy are the necessities for us in this modern society. Although to some extent, Energy can be cut back on to get on with life, we cannot cut back on food.

Food is the fundamental right to every human being. Accessibility and affordability to food and water is a must for every individual regardless of their country. Food inflation monitors the affordability aspect of food within the nation; the consequences associated with it are more intricate than we might anticipate.

How can the Food Inflation numbers be used for analysis?

As people can procure fewer goods for a unit of currency over time, people can either cut back on expenses or earn more to compensate for inflation. Food expenses are mandatory expenditure part of income. High food inflation will take up a more substantial chunk out of the disposable income of individuals leaving less room for discretionary spending.

As the affordability of food decreases due to high food inflation, consumer spending is negatively affected. Consumer Spending is the primary component of GDP accounting for more than two-thirds of the nation’s GDP. In the same case, more people who are working on minimum wages find it more difficult to afford food and would be below the poverty line even when their wages are not.

Political implications would also be severe. The backlash from the public over Government’s inadequacy to control inflation would be severe and, at times, have led to strikes and bans in many countries over the years. The Government at such times faces severe criticism both from the public and the opposition parties and would likely lose the next elections.

Food inflation could also occur due to adverse weather conditions destroying crops, or mismanagement of supply and demand by the authorities, or even politically manipulating supply and demand for profit by local dealers. There have been incidents where supplies of grains were withheld to boost up the prices for better profits artificially.

In developing countries, there are incidents where Government-issued rations are also sold illegally for profit by some corrupt groups. Lack of proper support to farmers in terms of resources like electricity, water, seeds, loans could also impair them to produce a good yield. All such factors add to food inflation, whose burden falls upon the ordinary people.

It is necessary to understand that all other commodities excluding Food and Energy generally have at least some alternatives (or different brands) to choose from in case price inflates. For instance, people looking to buy clothes from a brand may switch to another brand to avoid paying the new inflated price. Food inflation effect cannot be avoided as quickly as was the previous case.

Government officials closely monitor the inflation levels and are politically committed to keeping inflation in check through fiscal and monetary levers at their dispense. Food and Energy prices are given special attention, and almost all the time, the response is quick and practical from the Government during times of disruption in the food supply.

During the COVID-19 pandemic, many countries’ governments released relief packages to make sure there is no food shortage. Despite the fact many people slipped through the cracks of these protection measures, nonetheless, Governments did everything they could to avoid starvation.

 Impact on Currency

Food inflation is part of overall consumer inflation. Consumer inflation is the primary macroeconomic indicator for currency traders to assess relative inflation amongst currency pairs. Hence, food inflation is overlooked by currency traders for the broader inflation measures like the Consumer Price Index (CPI) or Personal Consumption Expenditure (PCE).

Nonetheless, food inflation is beneficial for the government officials to keep it in check all the time and also for the economic analysts to report the same. Overall, food inflation is a low-impact coincident indicator in macroeconomic analysis for currency trading that is overlooked for broader inflation measuring statistics, as mentioned before.

Economic Reports

The Bureau of Labor Statistics publishes monthly inflation statistics as part of its Consumer Price Index report for the United States. This report has the food inflation statistics as the first criteria.

The St. Louis FRED also maintains the inflation statistics on its website and has many other tools to add to our analysis.

Sources of Food Inflation

Consumer Price Index from the US Bureau of Labor Statistics is available on its official website along with monthly updates.

We can find the same indexes along with many others with a comprehensive summary and statistics on the St. Louis FRED website.

We can find the global food inflation statistics of most countries on Trading Economics.

How Food Inflation Data Release Affects The Price Charts

In the US, the food inflation data is released simultaneously with the overall consumer price index (CPI) data. The data is released monthly about 16 days after the month ends. The most recent release was on August 12, 2020, at 8.30 AM ET and can be accessed at Investing.com here. A more in-depth review of the monthly report can be accessed at the US Bureau of Labor Statistics website.

It is worth noting that since the food inflation numbers are released together with the over CPI, it will be challenging to determine the effect it has on price action.

The screengrab below is of the monthly CPI from Investing.com. On the right, is a legend that indicates the level of impact the Fundamental Indicator has on the USD.

As can be seen, the CPI data is expected to have a medium impact on the USD upon its release.

The screengrab below shows the most recent changes in the monthly CPI data in the US. In July 2020, the monthly CPI increased by 0.6% better than analysts’ expectations of a 0.3% change. This positive change is therefore expected to make the USD stronger compared to other currencies.

Now, let’s see how this release made an impact on the Forex price charts.

EUR/USD: Before Monthly CPI Release on August 12, 2020, 
Just Before 8.30 AM ET


As can be seen from the above 15-minute chart, the EUR/USD pair was on a steady uptrend before the inflation news release. Bullish candles are forming above a steeply rising 20-period Moving Average, indicating the dollar was weakening before the release. Immediately before the news release, the uptrend can be seen to be weakening.

EUR/USD: After Monthly CPI Release on August 12, 
2020, 8.30 AM ET

After the news release, the pair formed a 15-minute bullish candle. Contrary to the expectations, the USD became weaker against the EUR since the pair continued to trade in the previously observed uptrend.

Now let’s see how this news release impacted other major currency pairs.

AUD/USD: Before Monthly CPI Release on August 12, 2020, Just Before 8.30 AM ET

The AUD/USD pair shows a similar trading pattern as the EUR/USD before the inflation news release. The pair is on an uptrend, which heads for a neutral trend immediately before the news release.

AUD/USD: After Monthly CPI Release on August 12, 2020, 
8.30 AM ET

As observed with the EUR/USD pair, the AUD/USD formed a bullish 15-minute candle after the news release. Afterward, the pair traded in a renewed uptrend with the 20-period Moving Average steeply rising.

NZD/USD: Before Monthly CPI Release on August 12, 2020, 
Just Before 8.30 AM ET

NZD/USD: After Monthly CPI Release on August 12, 2020, 
8.30 AM ET

Unlike the EUR/USD and the AUD/USD pairs, the NZD/USD traded within a subdued neutral trend with an observable downtrend immediately before the news release. However, after the news release, the pair formed a 15-minute bullish candle and traded in a steady uptrend, as seen with the other pairs.

Bottom Line

In theory, a positive CPI data should be followed by an appreciating USD. From the above analyses, however, the positive news release resulted in the weakening of the USD. This phenomenon can be choked to the effects of the coronavirus expectations, which have made fundamental indicators less reliable.

Categories
Forex Fundamental Analysis

Understanding ‘Core Inflation’ & It’s Impact On The Forex Price Charts

Introduction

Core inflation is the change in the price of the goods and services that do take food and energy into account. It is referred to as ‘core’ because it represents the most accurate illustration of the underlying inflation trends. The reason for the exclusion of food and energy is due to its high volatility. They change so often that they may depict an inaccurate reading of the inflation rate. And the commodity market is the sole cause behind the volatility, as it extensively traded all day.

Why Exactly Food and Energy are Excluded

As already mentioned, Food and Energy are exempted from the calculation of core inflation because the volatility in these markets is too high. This reduces the accuracy of the core inflation rates. Food and energy are considered as the most necessary staples; that is, their demand does not change even if there is a price hike. For instance, let’s say the gas prices rise due to the rise in oil prices. But this rise will hardly affect you as you’ll still need to fill up your tank in order to drive your vehicle. Similarly, you will not become hesitant to go to the grocery store because the prices have risen.

Oil and gas are commodities that are traded on the exchange market where people can buy and sell them. The commodity traded bid on the oil prices when they suspect a fall in supply or a rise in demand. Also, the thick that war will bring down the supply of oil. With this assumption and analysis, they buy at the present price and anticipate a higher price in the future. And this is enough to pump up the oil prices in the market. And if things don’t go as per the plan, the prices fall when they sell. Hence, this creates high volatility in the market.

The food prices are dependent on the prices of gas. The food prices tend to rise along with the gas prices because transportation of the food is dependent on trucking. When the oil prices rise, the effect can be seen in the gas price a week later. And if the gas prices maintain its uptrend, the effect of it can be observed on the food prices a few weeks later.

Measuring Core Inflation

The core inflation is measured by both the Consumer Price Index (CPI) and the core Personal Consumption Expenditure Index (PCE). The PCE is the depiction of the prices of goods and services purchased by consumers in the United States. Also, since inflation determines the trend in trend in the rising prices, the PCE is a vital metric in assessing inflation. However, both PCE and CPI are considered to be very similar as both help in determining the inflation in the economy.

CPI and PCE – Which is the Preferred Measure?

It is observed that PCE tends to provide inflation rates that are less affected by the short-term price changes, which is why the Federal Reserve prefers the PCE index over the CPI. The Bureau of Economic Analysis (BEA), a division of the Department of Commerce, measures the rates by using the existing gross domestic product (GDP) data, which helps in determining the overall trend in the prices. The GDP gives the measure of the total production of goods and services. In addition, BEA takes in the monthly Retail Survey data and compares it with the consumer prices generated by the CPI. In doing so, the data irregularities are removed, which helps in providing long-term trends.

Why is Core Inflation Important?

It is important to asses core inflation because it determines the relationship between the price of the goods and services and the level of the consumer income. If there is an increase in the price of the goods and services and no proportional increase in consumer income, consumer buying power will decrease. So, we can conclude that inflation causes the value of money to depreciate compared to the prices of goods and services.

However, if the consumer income increases, but the price of the goods and services remains unchanged, consumers will theoretically have money buying power. Moreover, there will be an increase in the investment portfolio, which leads to asset inflation. And this can generate additional money for consumers to spend.

Core Inflation and its Impact on the Economy and Currency

Core inflation has both a subtle and destructive effect on economic growth. It is said to be subtle because an increase of one or two percent takes quite a while. However, this can have a positive effect at this rate as well. People purchase goods and services beforehand, knowing that price will rise in the near future. Hence, this increase in demand stimulates economic growth. And since currency depends directly on the economy, the price of the currency rises as well.

Inflation can have a negative effect on the economy, as well. That’s because people will have to spend how much ever high price on food and gas, as they are the essentials. This brings down other consumer sectors in the market because people tend to spend less here. Their businesses are less profitable now. This imbalance in the market lowers the economic output.

Reliable sources of data for Core Inflation

The core inflation rate is released by the countries’ statistics board. For most countries, it is released on a monthly basis. And the reports are in terms of percentages. Below is a list of sources of core inflation data for different countries.

EURUSDAUDGBP  For other world countries, you may access those reports here.

How does Core Inflation Affect the Price Charts?

Until now, we understood the definition of Core inflation and its impact on the economy and the currency. Here we shall see the immediate effect of the currency pair when the reports are released. For our example, we will be taking the U.S. dollar for our reference. The core inflation rate in the U.S. is released by the U.S. Bureau of labor statistics. The frequency of the announcement of data is monthly.

Below is the core inflation data released by the U.S. Bureau of labor statistics for the month of February. But, the data for it is announced in the first week of March. We can see that the core inflation has turned to be 2.4 percent, which is 0.1 percent higher than the previous month and the forecasted value. Now, let’s see how this value has affected the U.S. Dollar.

EUR/USD | Before the Announcement – (March 11, 2020 | Before 12:30 GMT)

Below is the chart of the EUR/USD on the 15min timeframe just before the release of the news.

EUR/USD | After the Announcement – (March 11, 2020 | After 12:30 GMT)

Below is the same chart of EUR/USD on the 15min timeframe after the release of the news. The news candle has been represented in the chart as well. It is evident from the chart that the news did not have any effect on the currency pair. Though the reports showed an increase in the core inflation, there was hardly any drastic pip movement in the pair. Also, the volatility was below the average, and the volume was low. With this, we can come to the conclusion that the core inflation rate did not impact the EUR/USD.

GBP/USD | Before the Announcement – (March 11, 2020 | Before 12:30 GMT)

GBP/USD | After the Announcement – (March 11, 2020 | After 12:30 GMT)

Consider the below chart of GBP/USD on the 15min timeframe. We can see that the news candle was a bearish candle. That is, the news was positive for the U.S. Dollar. However, if we were to check on the volatility of the market, the volatility when the news came out was at the average value. Seeing the volume bar corresponding to the candle, it wasn’t high as such. Hence, the core inflation did not impact the GBP/USD.

Traders who wish to trade this pair can freely go ahead with their analysis as the news has a very light impact on the USD.

USD/CAD | Before the Announcement – (March 11, 2020 | Before 12:30 GMT)

USD/CAD | After the Announcement – (March 11, 2020 | After 12:30 GMT)

Below is the USD/CAD candlestick chart on the 15min timeframe after the release of the news. The news showed an increase in the core inflation rate by 0.1 percent. In the chart, we can see that the report turned out to be positive for the USD. In fact, the news candle actually broke the supply level and went above it. Compared to EUR/USD and GBP/USD, the core inflation had a decent impact on USD/CAD. However, the volatility was at the average mark, and the volume didn’t really spike up.

Conclusion

Core inflation is an economic indicator that measures the inflation of an economy without considering food and energy. This is because of the high volatility in the food and energy market. The core inflation rates are usually taken from the CPI or the PCE. This is an important indicator as it determines the relationship between the price of goods and services and consumer income.

It also gives an idea of the current economy of a nation. However, when it comes to its effect on the currency, there is not much impact on it. So, conservative traders can trade the markets without fearing the release of the news, as there is no drastic rise in the volatility of the markets.

Categories
Forex Course

44. Analyzing The Forex Market – Fundamental Analysis

Introduction

We’ve now come to one of the most exciting topics in this course, which is analyzing the Forex market. Now that we know the history and the working of the Forex market, we’re all set to predict the future of the market. Several types of analyses are used by traders across the world to analyze the  Forex market. However, these analyses can broadly be classified into three types.

In this lesson, and the lessons coming forward, we shall be discussing all these three types of analyses.

Types of Forex market analysis

The three types of forex market analysis are:

  1. Fundamental analysis
  2. Technical analysis
  3. Sentimental analysis

Now, you must be wondering which one of them is best for analyzing the markets. Well, if you look at the most successful professional traders in the industry, they analyze the market by considering all the types. In this lesson, let’s understand the most essential Fundamental Analysis.

Fundamental Analysis

Fundamental analysis, as the name pretty much suggests, is the way of analyzing the market by studying the economic, social, and political forces in the country. These factors are considered because they affect the supply and demand of an asset.

The whole idea of trading using fundamental analysis is by considering the factors that affect the supply and demand of a currency. These factors are technically referred to as fundamental or economic indicators.

The concept behind this type of analysis is straightforward. If a country’s currency or economic outlook is good, then there is a high probability that the currency will show strength in the future and vice-versa.

What are the major economic indicators?

Below are some of the economic indicators which have the power to shift the economic situation of a country.

Interest rates

One of the most popular and important economic indicators are interest rates. There are several types of interest rates, but we will be focusing on the basic form of the interest rates set by the central banks. Central banks are the creators of money. This money is borrowed by private banks. And the percentage (interest) or the principle the private banks pay to central banks for borrowing the money is called a nominal or a base interest rate.

If the central banks wish to boost the economy, they decrease the interest rates. This then stimulates borrowing by both private banks and other individuals. And this, in turn, increases consumption, production, and the overall economy. Lowering the interest rates can be a good way to inflate the economy but can be a poor strategy too. Because in the long term, low-interest rates can over-inflate the economy with cash and create an unbalance in the money supply.

So, to avoid this, central banks increase interest rates. And this increase results in less money in the hands of private banks, businesses, and individuals to play around with.

Inflation

Inflation, as the name pretty much says, is fluctuation in the cost of goods over time. Inflation, too, is a vital indicator for economists and investors to forecast the future economy. Inflation will have a good effect on the economy if done uniformly. But, too much inflation can bring the balance of supply and demand on the tip in favor of the supply. And this eventually will bring down the value of the currency.

Apart from these two, there are many other macroeconomic indicators that traders consider to do their fundamental analysis. Some of them include GDP, PPI, CPI, Unemployment Rate, Government Debt, etc. Indicators like these help the investors & traders in analyzing the market and predicting its future.

This completes the lesson on fundamental analysis. In the next lesson, let us understand the insights about technical analysis. Don’t forget to take the quiz below before moving ahead!

[wp_quiz id=”56601″]
Categories
Crypto Guides

Which kind of Problems can be Solved by Cryptocurrencies?

Introduction

Cryptocurrencies have made an impact on the world’s financial system in an unprecedented way. The speed and agility of global transactions have changed with the advent of cryptos. At present, there are around 3053 cryptocurrencies trading across the world, with a market cap of more than $246 billion. Many global companies around the globe have started to accept cryptos as a mode of payment for the products and services they provide. Bitcoin atm’s and debit cards are making the widespread adoption of cryptocurrencies easy and worthwhile. In this article, let us understand the reason for this wide adoption of these cryptos by looking at some of the problems they solve.

🏳️ Centralization: Cryptocurrencies are built on blockchain platforms enabling them to adopt all the features of the blockchain technology. The fiat currency we use today is minted by the central banks of the respective countries. The presence of a central entity to control something is called centralization. Banks play a significant role in the financial status of any country. It is well known that the financial crisis of 2008 is due to the banking crisis. That was the time when Bitcoin came into the picture, paving the way for the decentralized currency. Cryptocurrencies are decentralized with no third-party control. They run on blockchain technology as per the network setup initially. The network is maintained and run by different entities mining the native currency. Thus by no one controlling the money, they remain unique and stable. This is the prominent problem that cryptocurrencies solve over fiat currency.

🏳️ Intermediary costs: The transaction costs to send money between different countries is too high. The respective entities charge a certain percentage of the transaction amount, and it depends on the amount we send and the service we utilize. Also, it takes more time to settle transactions across different countries. There is no limit for cryptocurrency transfer across the world. It is instantaneous with a minimal amount as a transaction fee when compared with the standard bank wire transfers.

🏳️ Privacy: The transactions you make in cryptos are semi-anonymous; some cryptos even ensure complete anonymity. Each of the users will have their crypto addresses, which are used to make transactions. These addresses ensure privacy while transacting cryptos. Having said that, the level of privacy varies from one crypto to others.

🏳️ Security: Blockchain assures the utmost protection when it comes to cryptocurrency transactions. The transactions in the blockchain cannot be reversed; once committed, they are committed for a lifetime. The cryptographic techniques used to secure the transactions are almost impossible to hack.

🏳️ Inflation: Any cryptocurrency has a limit of coins that it can ever have or in some coins, the number of coins that can be mined per year will be capped. In the case of fiat currency, the government can issue bonds and manipulate interest rates to increase the circulating money, thus decreasing its value leading to inflation. Since the number of coins that ever will be available is capped in the case of crypto, inflation can be effectively handled.

These are only a few problems that cryptocurrencies can solve, but with the widespread usage, there would be solutions for problems that we don’t even see now. We hope you find this article informative. Cheers!

Categories
Forex Market Analysis

USA VS China Trade, Inflation and Quarterly Results


Macroeconomic Outlook

Three references for the markets this week

1)      Trade relation between China and USA

  1. Last Friday it was agreed what it could be the beginning of talks that will take time
  2. Rather a constructive agreement than a bad one

2)      Inflation

  1. American inflation is the key variable this week
  2. It is expected to increase to 2.5% from previous 2.4%
  3. Currently is above the 2% target and this creates certain anxiety and can have some effect on bonds
  4. Might consider the option of a lower than expected inflation (<2.4%)
  5. Payrolls data, which was published on Friday, was 2.6% instead of 2.7% moving away from the 3% barrier
  6. The option of a lower inflation rate provides a less stressful outlook

3)      Quarterly Results

  1. Really good so far in the USA
  2. Partly because of the tax reform
  3. EPS had increased to an average of 24,8% when at the beginning it was expected to be around 17%
  4. Good so far too in Europe
  5. More European companies will publish results this week

Hence, bearing in mind a decent agreement between USA and China, the possibility of lower inflation and good corporate results, the markets should bounce and rise a little this week.

Furthermore, if the inflation turns out to be lower, it could be good for bonds and could contribute to a weaker US Dollar wich has increased significantly recently.


Technical Analysis

US Dollar Index

Daily Chart

It is possible to appreciate how the US Dollar Index, after tumbling for a couple of weeks, broke all the resistances and increased significantly. The most important resistances generated from its monthly bearish trend have been broken in one strong movement upward. Including, also, its 200-day EMA which is retesting right now. The only significant resistance that is facing now is at the 93.5 which will be the next target leaving some space for a longer run.

EURUSD

Daily Chart

After testing for the third time the bearish trend line on the top it dropped,  strongly breaking its two supports below it. Not only it fell after testing its resistance and breaking the upcoming supports but also, on Wednesday it broke below the third support which is currently retesting. This can be either a fake breakout or another shorting opportunity.


GBPUSD

Daily Chart

After breaking the support, which has been holding price during its bullish trend line, it is eyeing the next solid resistance which is at a level of 1.34 more or less. After breaking the 200-day EMA, it is taking a rest. It may either retest the recent support broken which is hard as the bullish trend was really steep or test the next resistance which is closer and extending the bearish move.


USDJPY

Daily Chart

The dollar broke both resistances after doing a fake breakout and bouncing back from the monthly support. It has created a small bullish trend in the short term where it can be holding on until it reaches its next target which is the monthly bearish trend, currently situated at a level of 111.5. Either that or starts going sideways for the next days until it breaks one of the monthly trends.

Crude Oil

Daily Chart

Recent geopolitical events and tensions in Syria have created volatility in the markets, and consequently, the price of oil has been on the rise. After holding to the bullish trend line and breaking above $65 it did a retest of the recent resistances it just broke above. Without more resistances ahead, it has just reached the expected target of $70 per barrel. There are not any significant resistance above which leaves the door open for a longer bullish run.

DAX

Daily Chart

It bounced back from the monthly bearish trend which was the strongest one and consequently in the recent run it has just broken both two bearish weekly resistances. Last Friday it closed above the last resistance which leaves the door open for a continuation, possibly at less slow pace, of the recent bullish trend formed from testing the resistances and breaking the supports.

©Forex.Academy

Categories
Forex Educational Library

Japan’s Economic Outlook

Japan’s economic outlook

Category: Fundamental analysis, Intermediate, Currencies, economic cycles, Monetary Policy, Economy, Macroeconomics, Central Banks.

Key Words: Central Banks, Monetary Policy, Bank of Japan, Projections.

At each meeting of the bank’s board, a review is made of the state of the Japanese economy, the projections for the current year and the next two years, and the risks to which the economy is exposed both internally and externally.

In the April 2017 report, the board concluded that the economy would continue its positive trend growing above the potential stipulated by the bank, due to better internal financial conditions, some government stimulus and greater global economic growth. The bank was explicit that the expected growth in 2017 and 2018 would be higher than in 2019 due to a cyclical slowdown in fixed investment in business and an increase in the consumption tax that had already been programmed.

As global growth had generally improved, Japanese exports had shown an upward trend, contributing to economic growth. Private consumption had also been resilient due to a better outlook in the labour market with better employment rates and higher wages.

As already mentioned, the bank expected that by 2019 the local economy would slow down a little due to a slowdown in domestic demand reflecting the closing of the cycle of expansion in business investment in addition to the increase in consumption tax since that year.

Regarding inflation, the annual change in the CPI (Consumer Price Index) excluding fresh food continued to show better figures than in 2016 with a clear upward trend thanks to a better performance of the economy and an increase in expectations medium and long term. But even the price growth is not as strong as the bank would like so they followed the price index with some caution.

The annual CPI for April excluding food and energy was close to 0%, so the bank was still expectant that the price index was far from the target rate of 2%.

Regarding monetary policy, the bank indicated that it would continue to apply Quantitative and Qualitative Monetary Easing with the Yield Curve control, with the objective of using it until inflation hit 2% so that the short-term interest rate would remain in negative territory.

Inflation could reach 2% in the medium and long-term, but not in the short term due to the weak behaviour of the main price indices. It was estimated that in the medium and long term it could reach  2% due to better economic growth rates added to energy prices that have been rising in recent years. In addition, the policy of monetary easing continued to drive the supply of credit and liquidity to the market so that inflation continued to rise to the bank’s target figure.

Also, the unemployment rate continued to decrease showing figures between 2.5 and 3%, so the labour market was narrowing which could generate an increase in the nominal wages of people, which in turn could lead people to consume more and this would boost inflation. The following two graphs show the main projections of the members of the committee and the expected behaviour of the CPI until 2019.

Graph 77. Forecasts of the majority of Policy Board Members. Retrieved 27th February 2018 from https://www.boj.or.jp/en/mopo/outlook/gor1704b.pdf


 Graph 78. CPI (ALL ITEMS LESS FRESH FOOD. Retrieved 27th February 2018 from https://www.boj.or.jp/en/mopo/outlook/gor1704b.pdf


In the July report, the committee stated that the path of economic growth was still positive due to the already exposed factors of a better global panorama and incentives created by the government to stimulate the local economy.

Regarding inflation, there were negative signals that showed a weak CPI (excluding food and energy prices), being in figures between 0 and 0.5%. The bank indicated that it could be due to the caution that the companies had at the time of fixing the prices and the wages of their workers. This behaviour of the companies caused expectations to decrease somewhat on inflation in the medium and long-term. The bank stressed that for inflation to reach 2% companies had to be more determined when setting prices and wages.

What was driving inflation in recent months were energy prices due to higher global demand for fuels and the agreements reached by OPEC to sustain oil prices, which is why the bank was concerned that the other components of the prices were not contributing to the rise of the recent CPI.

Due to the weakness of inflation, the bank decided that it would continue with its policy of monetary easing until inflation was close to levels close to 2%, so that short and medium-term interest rates would remain in negative territory. In addition, the financial market continued to offer credit facilities to the market.

Despite the weak performance, in the bank’s projections, it was estimated that in the medium and long-term the inflation rate would be at 2%, but the projections had fallen slightly on this variable for the next two years.

In the October 2017 report, the bank’s committee continued to observe a positive performance of the economy due to higher exports thanks to the better performance of the world economy throughout 2017.

In terms of domestic demand, fixed investment in business had followed a slight upward trend with better profits from companies and better expectations of entrepreneurs on the Japanese economy.

Private consumption continued to grow moderately, thanks to the better performance of the labour market. There were good rates of job creation and wages rose slightly. Public investment had also had positive behaviour during the last quarter, but not spending by households that had shown flat figures throughout the year.

Looking at the financial conditions, the outlook did not change with respect to the two previously issued reports, since the short and medium-term rates remained in negative territory. Financial institutions were still willing to lend to the market, and corporate bonds were still well received by the market, so the bank continued to observe the accommodative financial conditions.

Although inflation continued to rise slightly as in mid-2017, this behaviour was mainly explained by the rise in fuel prices and energy in general. The weak behaviour of the CPI excluding food and energy was due to the little increase in prices of companies as well as wages and a mobile phone market increasingly competitive in prices.

If you compare the projections that the bank had in October with the projections at the beginning of 2017, the CPI showed a weaker than expected behaviour, but it was expected that in 2018 and 2019 inflation would have more positive figures as shown in the following graph.

Graph 79, CPI (ALL ITEMS LESS FRESH FOOD, Retrieved 27th February 2018 from https://www.boj.or.jp/en/mopo/outlook/gor1710b.pdf


The reasons for a better performance of the CPI for the following years should be given thanks to better conditions in the labour market, better performance of the economy in general and better market expectations. The graph shows that inflation bottomed out at the end of 2016, showing deflationary signs.

The risks faced by the Japanese economy according to the bank were:

  • New regulations implemented in the United States and economic performance will directly affect global growth
  • Geopolitical risks
  • The Brexit negotiations
  • The problem of the European debt

These factors could affect the decline of the Japanese economy due to its direct involvement in world trade. The following graph shows the bank’s projections at the October meeting.

Graph 80. Forecasts of the majority of Policy Board members. Retrieved 27th February 2018 from https://www.boj.or.jp/en/mopo/outlook/gor1710b.pdf


If these projections are compared with those made at the beginning of the year and July, expectations for 2017 and 2018 improved and remained the same for 2019. That shows the good performance of the economy and a slight recovery of inflation, but as the bank reaffirmed that recovery was not robust since it was mainly based on energy prices. The other components of the CPI did not yet show positive figures, so the bank expected 2019 to be close to 2%.

As long as the inflation rate was not close to 2%, the monetary easing policy would continue. That would include negative interest rates and acquisitions, and corporate bonds to provide liquidity to the market and thus achieve better growth rates. This would encourage companies to be more aggressive in its increases in prices and wages of workers, which was not as strong as would be expected from a narrow labour market, although they did rise during 2017.

The following graph shows the CPI excluding food and energy which shows that the figure during 2017 was well below 0.5% which is negative and gives the reason why the bank committee was concerned because the basic items of the index showed a very weak behaviour.


Graph 81. Chart 38, CPI. Retrieved 27th February 2018 from https://www.boj.or.jp/en/mopo/outlook/gor1710b.pdf

©Forex.Economy