
Introduction
When it comes to households’ consumption, the retail sales data is usually considered the best leading indicator. Most people rarely have wholesale trade sales in mind. However, the importance of wholesale trade sales data should not be underestimated. Whenever retailers face an increase in demand by consumers, their next stop is to the wholesalers. Furthermore, when retailers anticipate increased demand, they stock up directly from wholesalers. Thus, wholesale trade sales data can be used as a leading indicator of retail sales and the overall demand in the economy.
Understanding Wholesale Trade Sales
A wholesaler is a business whose core operations strictly involve selling to institutions, governments, or other businesses. A wholesaler rarely deals with the end consumer. Wholesalers usually conduct their businesses from warehouses and do not market their services to households. Their place in the supply chain is to provide retailers and vendors with goods.
As an economic indicator, the wholesale trade sales measures the monetary value of the inventories and sales made by registered wholesalers over a particular period.
How are the Wholesale Trade Sales Measured?
In the US, the Census Bureau conducts a sample survey to determine the national wholesale trade sales and publishes its findings in the ‘Monthly Wholesale Trade: Sales And Inventories’ report. This report contains end-of-month inventories, monthly sales, and inventories-to-sales ratios. These aspects of the reports are segmented by the type f business that the wholesale operates. Some of the wholesalers covered by the report include; jobbers or wholesale merchants, exporters and importers, and distributors of industrial goods. The report excludes agents who market products for mining firms, refineries, and manufacturers.
The samples contained in the monthly report are selected through the strata design, which is defined by the type of business sampled and the annual sales for the businesses. In this report, wholesalers of all sizes are included. It is updated quarterly to capture the changes in the sector.
Since the sampling method is used to create the final monthly report, the estimates on the inventories and sales are arrived at by the summation of the collected, weighted data. These estimates are then seasonally adjusted and benchmarked to the annual surveys. Note that the report is susceptible to sampling and non-sampling errors.
Using Wholesale Trade Sales for Analysis
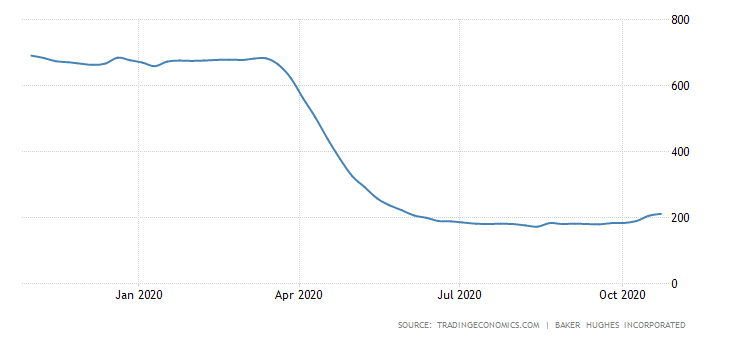
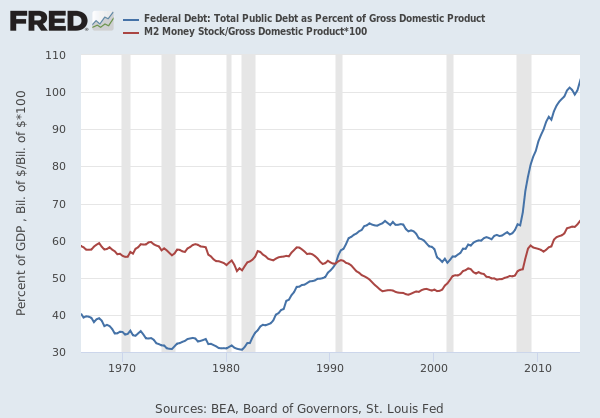
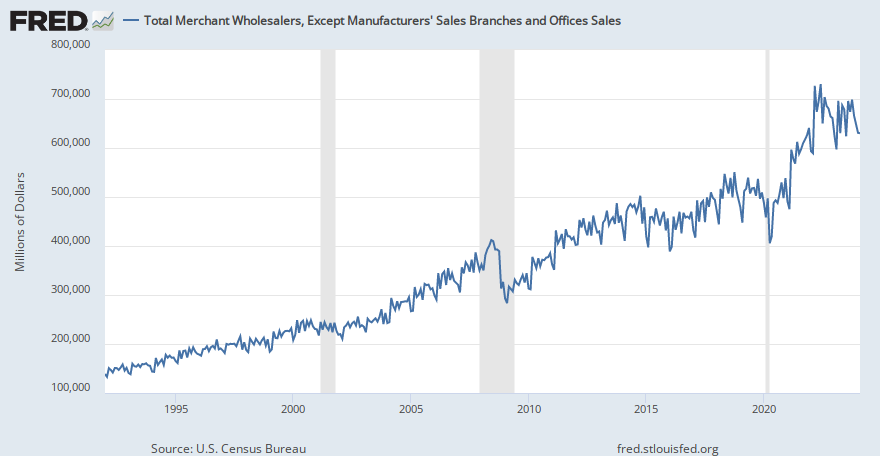
The wholesale trade sales data can be used as a leading indicator of retail sales and consumer spending, estimated to drive up to 70% of the GDP.
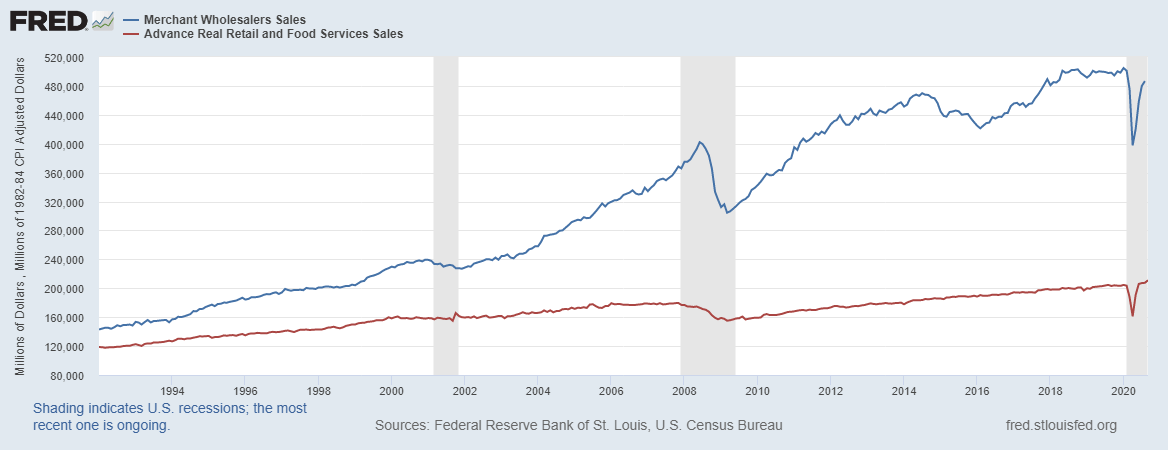
Source: St. Louis FRED
The wholesale sector is an integral intermediary in the distribution of goods to the final consumer. Therefore, an increase in sales can be seen as an increase in demand by households. As an economic indicator, this increase could signal that the welfare of households is improving and they have more disposable income hence the increase in demand. The increased disposable income could result from increased employment levels in the economy or higher wages received by households. In either scenario, more money is circulating in the economy. It shows that the economy is expanding.
On the other hand, if the wholesale sales are continually decreasing, it could be considered a sign of depressed demand in the economy. The decrease in demand might be resulting from the lower circulation of money in the economy. An increase in unemployment levels or a decrease in household wages can be attributed to the depressed demand. In this instance, it shows that the economy is contracting.
Suppliers and manufacturers can also use wholesale sales data to determine their level of output to match the demand, hence avoid distorting the equilibrium prices. When wholesale trade sales are increasing, the manufacturers and producers will increase their output to match the level of demand in the economy. When the sales are increasing more than the inventories, producers, and manufacturers will have to scale up their production. Increasing production entails hiring more labor hence a decrease in the unemployment levels. This instance shows that the overall economy is expanding.
Conversely, when inventories are increasing more than the wholesale sales, it indicates that demand is falling. The producers and manufacturers will be forced to scale down their operations to avoid having excess supply than demand, which will distort the market prices. As a result, jobs will be lost in the economy making households worse off. Furthermore, corporate profits will b expected to take a hit.
Impact on Currency
Economic growth and the rate of inflation are the two ways wholesale trade sales data can impact the forex market.
An increase in wholesale sales shows that there is an increase in aggregate demand. In this case, the economy is poised to perform well in the coming months, with discretionary sectors flourishing. The increased demand drives the economic growth towards expansion, which might be accompanied by increased demand-driven inflation. Therefore, in the forex market, a sustained increase in wholesale trade sales can be seen as a potential trigger of contractionary monetary and fiscal policies. These policies are implemented to ensure that economic growth is within sustainable levels and the rate of inflation stays below the target rate. As a result, the currency appreciates relative to others.
Conversely, a continuous decline of the wholesale trade sales will lead to the depreciation of the currency. In the forex market, falling wholesale trade sales show a decline in the aggregate demand, which might result in deflation and, eventually, a stagnating economy. To prevent this from happening, governments and central banks might adopt expansionary fiscal and monetary policies. Although these policies are meant to stimulate the economy, they result in the depreciation of the currency.
Sources of Wholesale Trade Sales Data
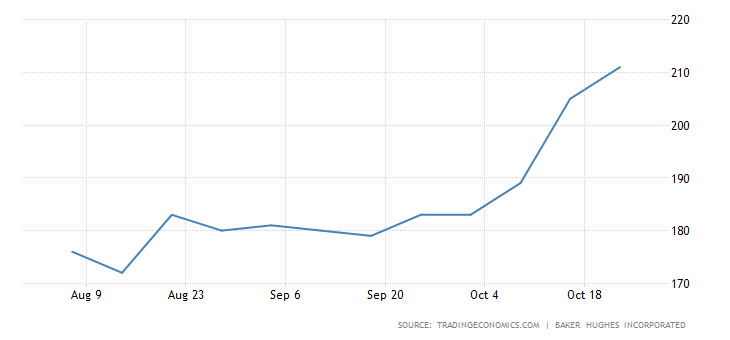
The US Census Bureau publishes the monthly ‘Wholesale Trade: Sales And Inventories’ report. St. Louis FRED publishes a comprehensive historical coverage of wholesale trade sales in the US.
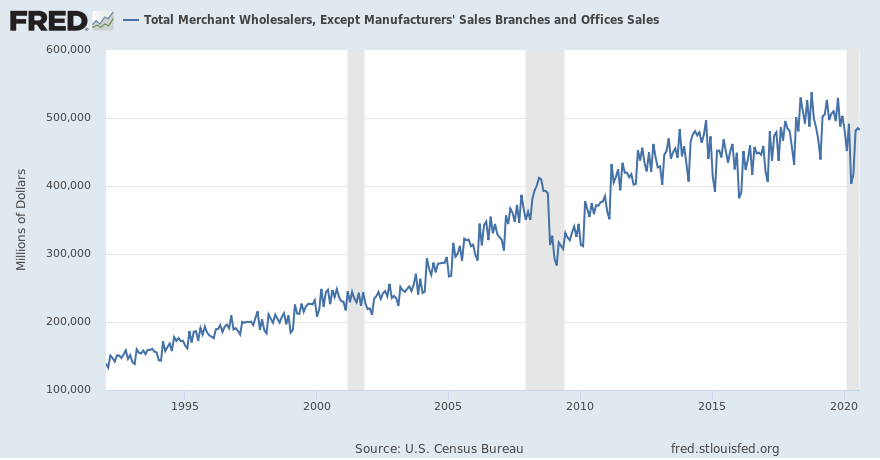
Source: St. Louis FRED
How Wholesale Trade Sales Data Release Affects The Forex Price Charts?
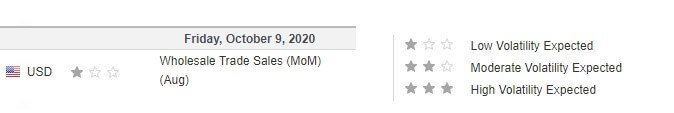
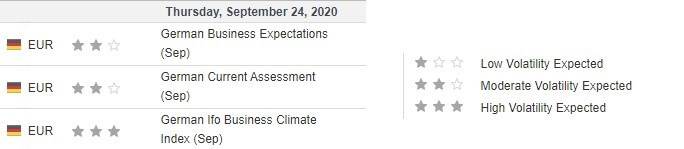
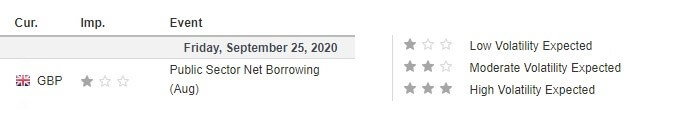
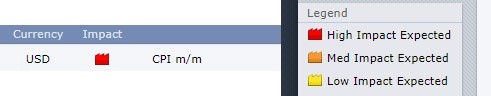
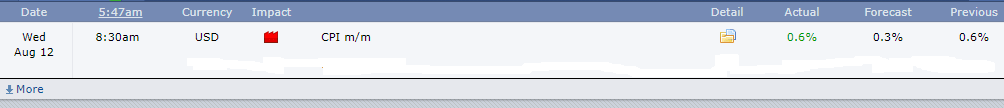
The US Census Bureau published the latest monthly ‘Wholesale Trade: Sales And Inventories’ report on October 9, 2020, at 10.00 AM EST. This released can be accessed at Investing.com. As shown by the screengrab below, low volatility is expected upon releasing the wholesale trade sales data.
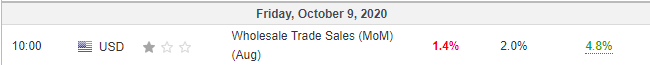
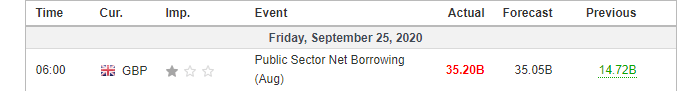
In August 2020, wholesale trade sales grew by 1.4%. This growth was lower than the 4.8% growth recorded in July 2020 and lower than analysts’ expectation of a 2.0% growth.
Theoretically, this lower-than-expected growth should be negative for the USD.
Let’s see how this release impacted the EUR/USD forex charts.
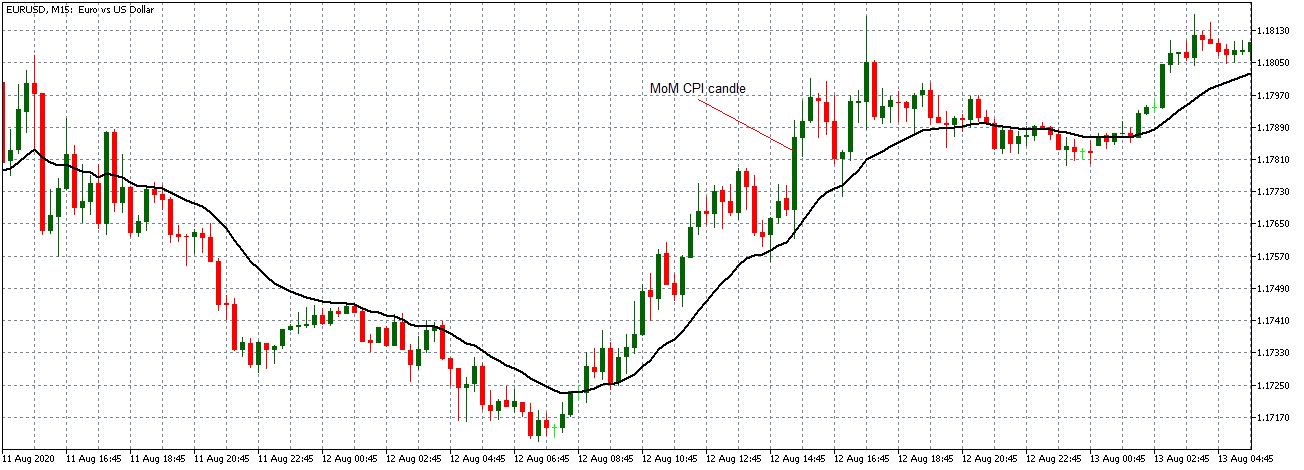
EUR/USD: Before the Wholesale Trade Sales Data Release on October 9, 2020,
Just Before 10.00 AM ET
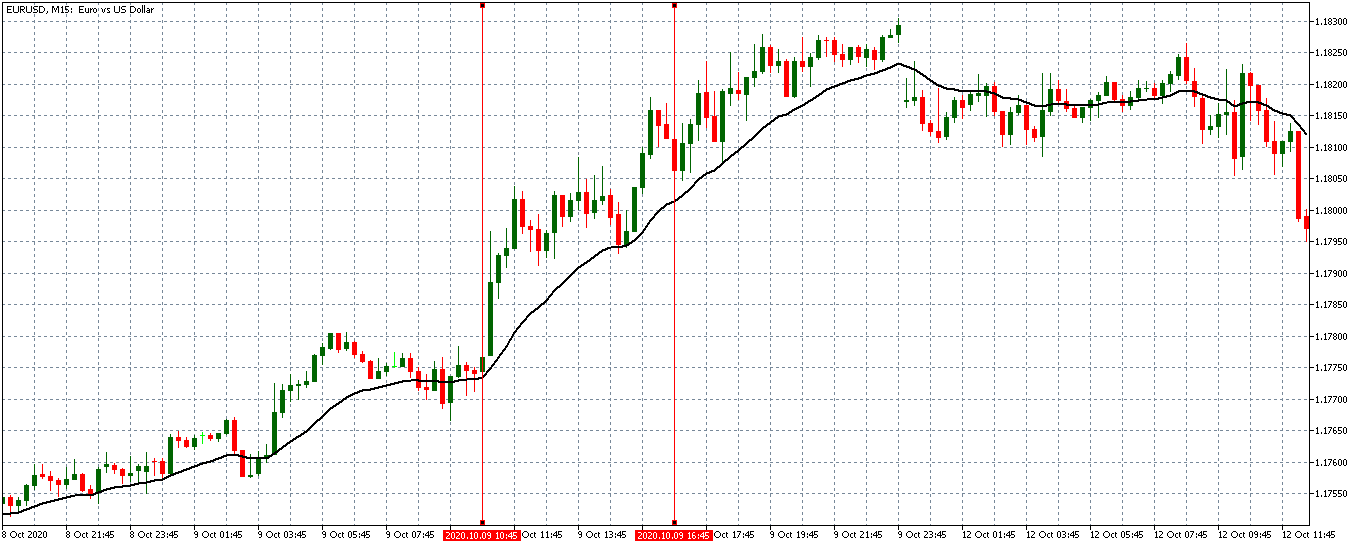
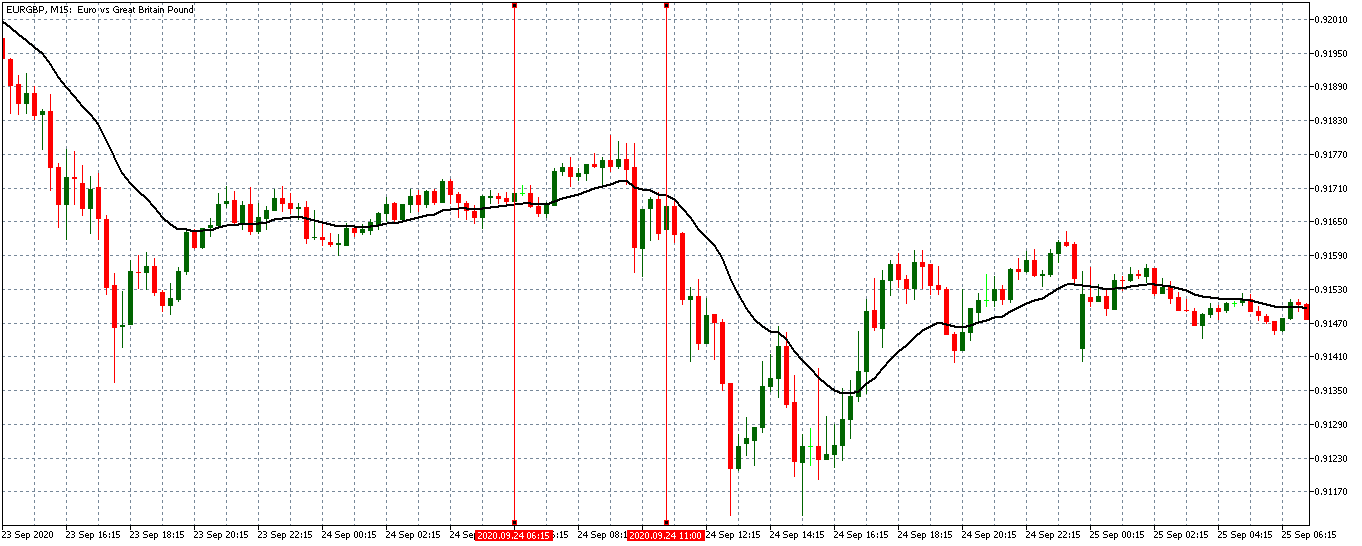
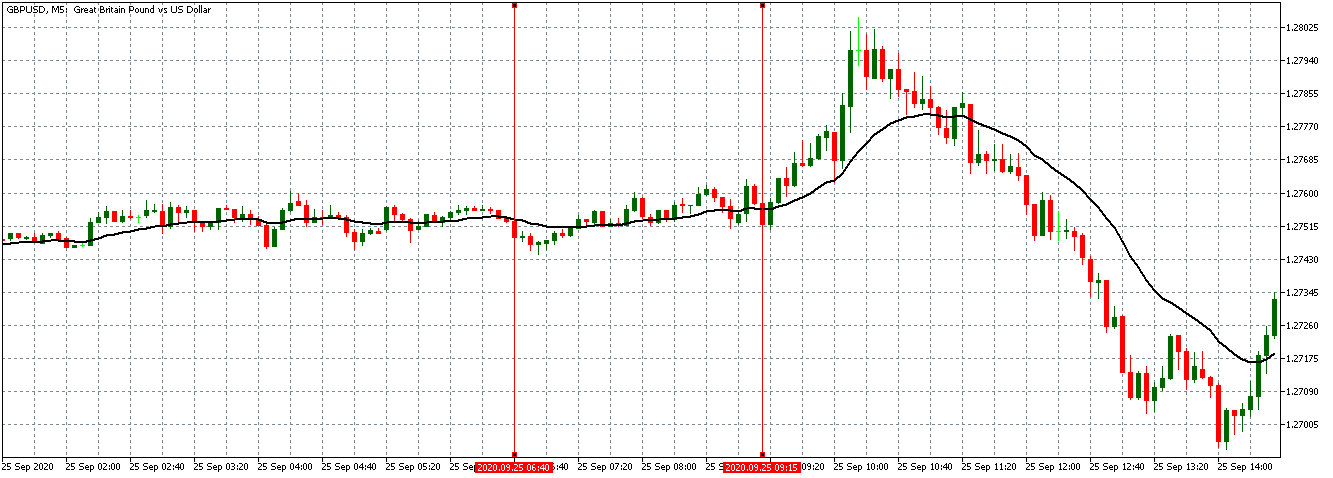
The pair can be seen to be trading in a steady uptrend before the news release. The 20-period MA is steeply rising with candles forming above it.
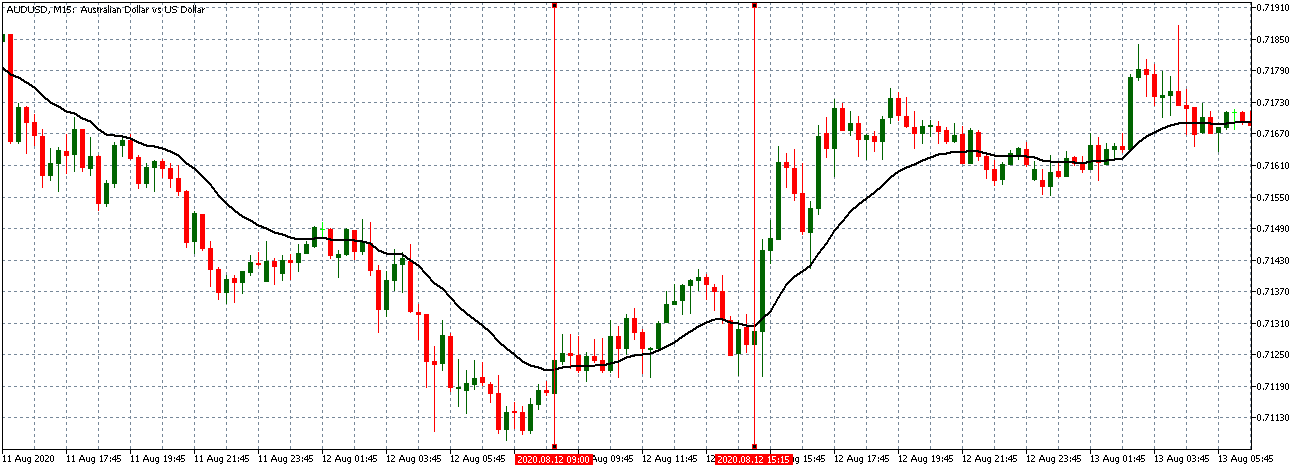
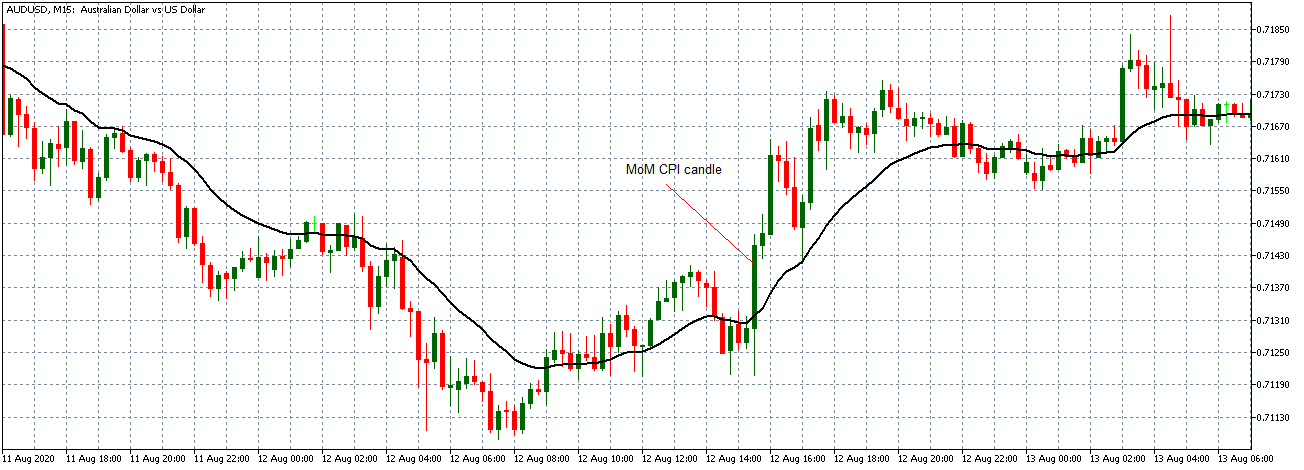
EUR/USD: After the Wholesale Trade Sales Data Release on October 9, 2020,
at 10.00 AM ET
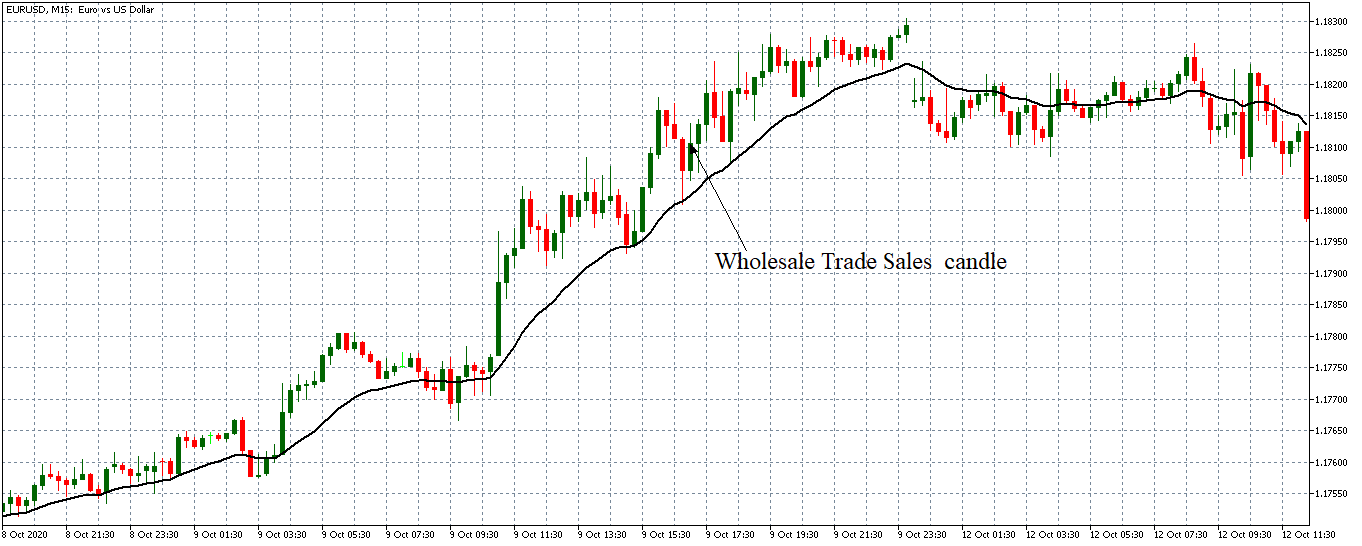
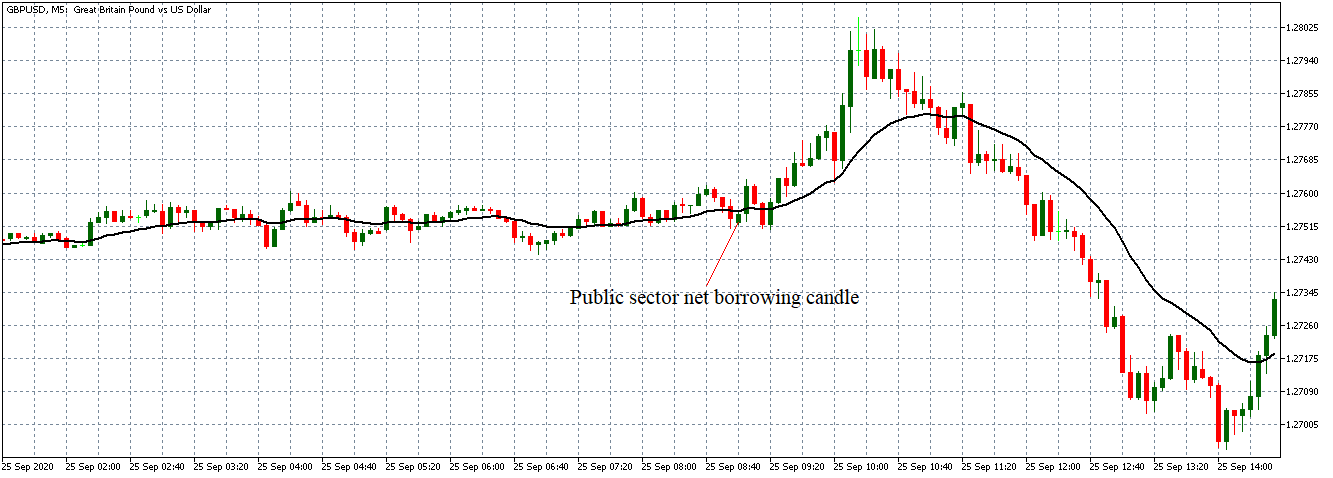
After the news release, the EUR/USD pair formed a 15-minute bullish candle, as expected. This candle showed that the USD weakened against the EUR immediately, the worse than expected wholesale trade sales data was released. Subsequently, the pair continued trading in a renewed uptrend.
Bottom Line
Although the wholesale trade sales data is regarded as a low-impact economic indicator, it is significant in the current economy. The data can be used to show the rate of economic recovery after the coronavirus induced recession.


