Categories
Forex Course

155. Getting Started With Forex Fundamental Analysis

Introduction

Fundamental analysis and technical analysis are an essential part of Forex trading. A Forex trader cannot be a profitable trader unless he knows this analysis. Fundamental analysis provides a logical reason for the upcoming movement of a currency pair based on economic releases. Traders evaluate these releases to determine the exact movement of a currency pair.

What is Fundamental Analysis?

According to finance and accounting, Fundamental analysis is the process of analyzing the business’s financial statement, including the competitor and market analysis. Moreover, it considers the core feature of a country’s macroeconomic factor, including the interest rate, inflation, GDP, manufacturing index, export, import, etc.

However, in forex trading, the fundamental analysis focuses on macro-economic factors mostly. The currency pair in a forex market represents the economy of two separate countries. In fundamental analysis, traders usually focus on major economic events and releases and their impact on a currency pair. Moreover, most professional traders consider both technical and fundamental analysis to get the best output from the market.

Elements of Fundamental Analysis

The fundamental analysis has two major elements- the fundamental releases and the fundamental events.

The Fundamental Releases

Fundamental releases are economic news of releases of a country that is published at regular intervals. Among the fundamental releases, the primary 4 economic releases are most important as it creates an immediate impact on a currency pair. Let’s have a look at four major economic releases:

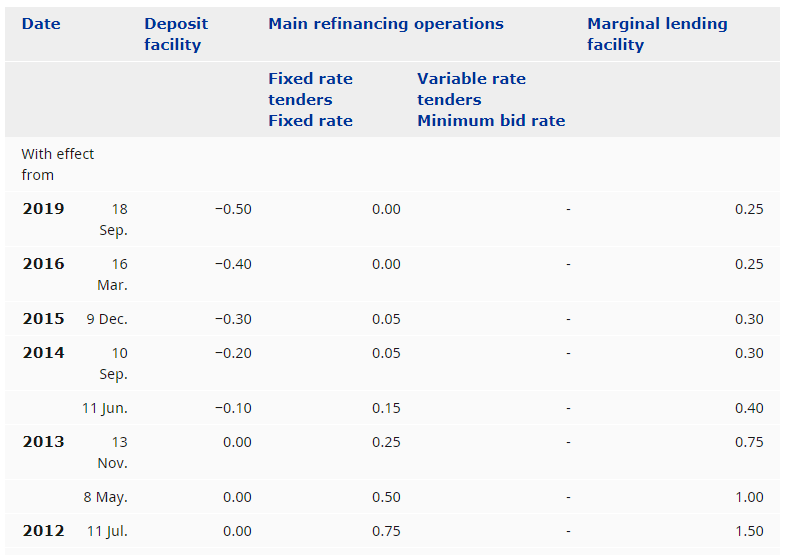
  • Interest rate: The interest rate is how much we have to pay to the central bank if we take any loan. Central banks raise the interest rate if the economic condition is excellent. On the other hand, the central bank reduces interest rates if the economic condition is terrible.

Image Source: https://www.ecb.europa.eu/

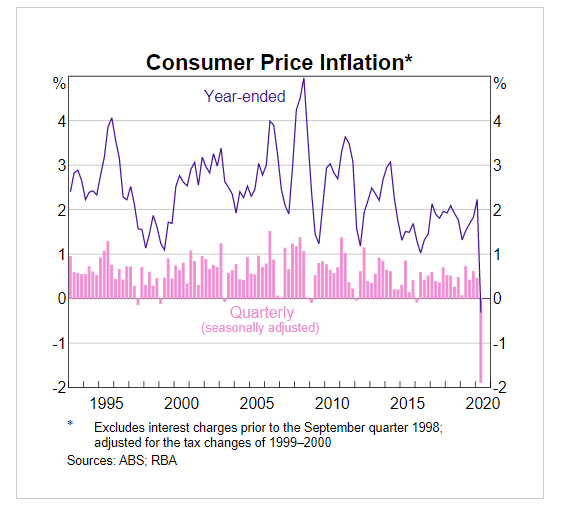
  • Inflation Rate: Inflation is the buying power of the money. The increase in inflation indicates a rise in the consumer product’s price that reduces the buying power of money. Any increase in the inflation rate is terrible for the economy.

Image Source: RBA

  • Gross Domestic Product: Gross Domestic Product or GDP refers to the country’s products and services’ total value. Any increase in GDP is positive for a particular currency.
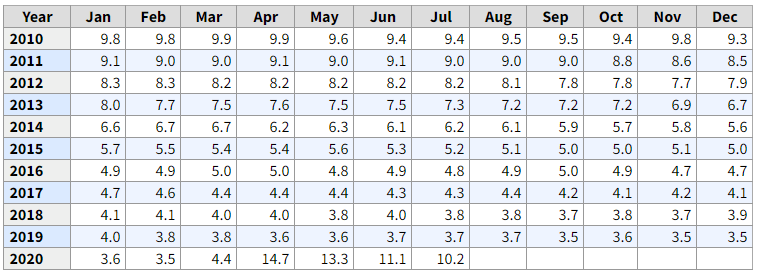
  • Employment: The number of employed and unemployed persons for a country works as a crucial fundamental indicator. Any decrease in employment is bad for the economy, and any increase in employment is reasonable.

Image source: https://www.bankofcanada.ca/

Fundamental Events

Besides fundamental releases, some essential fundamental events put a significant impact on a currency pair as mentioned below:

  • Central Bank Meeting: Central of a country meets once a quarter and discusses its economic condition. Any dovish tone negatively impacts the currency, while a hawkish tone creates a positive impact.
  • Geopolitical Events: There is some condition when one country meets another country to discuss the trade deal or conflict. Any positive news from a country’s geopolitical event may create a bullish momentum of the country’s currency.

In fundamental analysis, traders usually evaluate these releases and events to measure the strength and weaknesses of a currency pair.

Conclusion 

Traders usually gather recent economic releases and compare the result with the previous result. Any better than expected result indicates a buying opportunity on a particular currency. On the other hand, traders often evaluate fundamental releases to measure the volatility of a currency pair.

[wp_quiz id=”86400″]
Categories
Forex Course

152. Knowing The Fundamental Factors That Affect The Currency Values

Introduction

Many fundamental factors affect currency value. Therefore, whether we trade based on technical analysis fundamental analysis, we should know these factors to understand the currency markets.

Important Fundamental Factors That Affect Currency Values

Fundamental factors are economic releases and events that have a direct impact on currency value. If we want to trade based on fundamental analysis, we should focus on these releases and make a decision based on the result. Let’s have a look at the important fundamental factors that affect currency values

Interest Rate

Interest rate is the amount that a central bank charges if anyone takes loans from the bank. Central banks change the interest rate to control the country’s money supply; therefore, it directly affects the currency value.

Inflation Rate

Inflation is the buying power of money. Lower inflation means higher buying power, and higher inflation, the lower buying power.

Consumer Price Index (CPI)

CPI or CPI inflation is the price of consumer needs. Any increase in CPI is bad for the currency, while a decrease in CPI is good for the currency.

Producer Price Index (PPI)

PPI is the price of products or elements of businesses. An increase in PPI means businesses need additional money to buy raw materials that may increase the finish product rate.

Retail Sales

Retail sales indicate the number of products and services bought by consumers. An increase in retail sales indicates higher consumer activity in the market that is good for the currency value.

Foreign Exchange reserve

Foreign exchange reserve is the amount of money that is reserved in the central bank. An increase in foreign reserves is positive for a country’s economy and currency value.

Non-Farm Payroll (NFP)

On the first Friday of every month, US Labor Statistics releases the number of unemployed persons in the USA. As the US dollar is the most used currency globally, any change in NFP affects the overall forex market.

Central Bank Meets

In every quarter, central banks of every country provide an outlook of the domestic and international economy. In this meeting, any hawkish tone creates a positive impact on the currency value, while any dovish tone creates a negative impact on the currency value. We should keep an eye on how central banks are reacting to the central banks meeting to get an outlook of the currency value.

Conclusion

Besides the above-mentioned fundamental factors, there is a political movement, trade natural disaster, etc. also impacts the currency market. Moreover, in an uncertain market condition, no trading strategy works well, whether based on technical or fundamental analysis. Let’s dig deeper into each of these fundamental factors and more interesting aspects in the upcoming lessons. Cheers.

[wp_quiz id=”86366″]
Categories
Forex Fundamental Analysis

Understanding The ‘Inflation Rate MoM’ Macro Economic Indicator

Introduction

The GDP and Inflation rate are two of the most closely watched macroeconomic statistics by economists, business analysts, investors, traders, government officials, and the general population. The inflation rate has an impact on everyone, and no one is exempt from it. Understanding its effect on the currency, economy, living conditions, and how to use it for our analysis is paramount.

What is Inflation Rate, MoM?

Inflation: The increase in the prices of commodities over time is called inflation. It is the rise in the cost of living over time where the purchasing power of the currency depreciates. Inflation erodes the value of the currency, meaning a unit of currency can procure lesser goods and services than before.  Inflation occurs when more currency is issued than the wealth of the country.

Inflation Rate: The percentage increase in price for a basket of goods and services for a particular period is called the inflation rate. It is used to measure the general increase in the cost of goods and services. It is contrasted by deflation, which refers to the appreciation of the currency and leads to decreased prices of commodities. When more currency chases, fewer assets inflation occurs.

Inflation Rate MoM: The general measure of the inflation rate is YoY, i.e., Year-over-Year. It serves as a means to measure how currency has faired over the year against inflation. The rate tells how fastly prices increased. The inflation rates are often low and incremental over time and hence make more sense for a YoY comparison for general use. However, for traders and investors, MoM is more useful for close monitoring to trade currencies.

How can the Inflation Rate MoM numbers be used for analysis?

As inflation continues, the standard of living deteriorates. Inflation is an essential economic indicator as it concerns the standard of living. Hence, it requires much attention to understand and analyze. Inflation can occur due to the following reasons: cost-push inflation, demand-pull inflation, and in-built inflation.

Demand-pull inflation: When too few goods are chased by too much money, we get demand-pull inflation. It is the most common form of inflation. The demand for commodities is so high that people are willing to pay higher prices.

Cost-push inflation: It occurs when there is a limit or constraint on the supply side of the demand-supply equation. A limited supply of a particular commodity makes it valuable, pushing its price higher. It can also occur when the cost of manufacturing or procuring raw materials increase that forces businesses to sell at higher prices.

Built-in inflation: It occurs out of people’s adaptive expectations of future inflation. As prices surge, workers demand higher pay due to which manufacturing costs increase and form a feedback loop. It forms a wage-price spiral as one feeds of another to reach a new higher equilibrium.

Inflation mainly affects middle-class and minimum wage workers as they immediately experience the effects of inflation. Generally, the monthly inflation rates would be less than 1% or 0.00 to 0.20% in general. Such increments can be useful for currency traders to short or long currency pairs by comparing relative inflation rates.

Central authorities are committed to ensuring a low and steady inflation rate throughout. The policies are also drafted to counter inflation or deflation. The central authorities would likely intervene with a loose-monetary policy to inject money into the system and induce inflation when the economy is undergoing a slowdown or deflation. A tight monetary policy (withdrawing money from the economy) would be used to induce deflation to counter hyperinflation.

Impact on Currency

The monthly inflation rates are essential economic indicators for both equity and currency traders. It is an inversely proportional high-impact coincident indicator. An increase in the inflation rate deteriorates currency value and vice-versa. As it has a direct impact on the currency, the volatility induced as a result of significant changes in the inflation rate is also high.

Economic Reports

There are multiple indices to measure the inflation rate. The CPI, Producer Price Index (PPI), Personal Consumption Expenditures (PCE), GDP Deflators are all popular statistics used for measuring inflation in a variety of ways.

The Bureau of Labor Statistics (BLS) of the United States releases the CPI and PPI reports on its official website every month. The GDP Deflator is published by the Bureau of Economic Analysis (BEA) every quarter. The PCE is also published by BEA every month.

Sources of Inflation Rate MoM

BLS publishes the Consumer Price Index (CPI) and Producer Price Index (PPI) on its official website. The data is available in seasonally adjusted and non-adjusted versions, as inflation is also affected by business cycles. A comprehensive and visual representation of these statistics is available on the St. Louis FRED website. The BEA releases its quarterly GDP deflator statistics and monthly Personal Consumption Expenditure (PCE) on its official website for the public. Consolidated statistics of monthly inflation reports of most countries are available on Trading Economics.

How the Monthly Inflation Rate Data Release Affects The Price Charts

For this analysis, we will use the monthly consumer price index (CPI) to measure the rate of inflation. The Bureau of Labor Statistics releases the MoM CPI data in the US. It measures the change in the price of goods and services from the perspective of the consumer. The most recent data was released on August 12, 2020, at 8.30 AM ET and can be accessed at Forex factory here. An in-depth review of the latest CPI data release can be accessed at the BLS website.

The image below shows the most recent changes in the MoM CPI in the US. In July 2020, the US CPI changed by 0.6%, the same increase as that of June.

Now, let’s see how this release made an impact on the Forex price charts.

EUR/USD: Before Monthly CPI Release on August 12, 2020, 
Just Before 8.30 AM ET

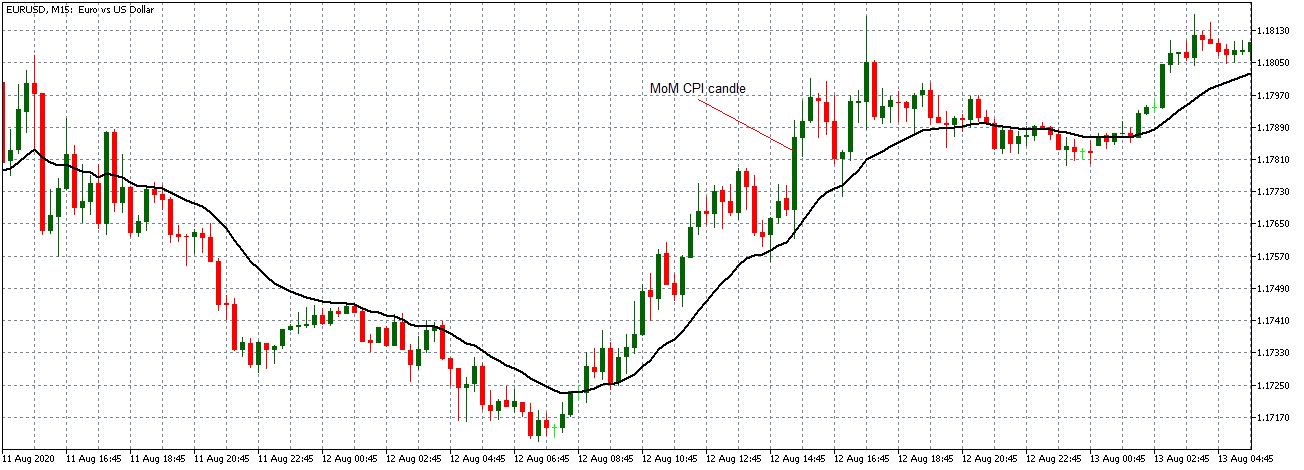
From the above 15-minute chart of the EUR/USD, the pair can be seen to be on a steady uptrend before the CPI data release. The 20-period MA in steeply rising with candles forming above it.

EUR/USD: After Monthly CPI Release on August 12, 2020, 
8.30 AM ET

After the data release, the pair formed a long 15-minute bullish candle indicating that the news release negatively impacted the USD. The pair subsequently continued trading in the previously observed uptrend.

Now let’s see how this news release impacted other major currency pairs.

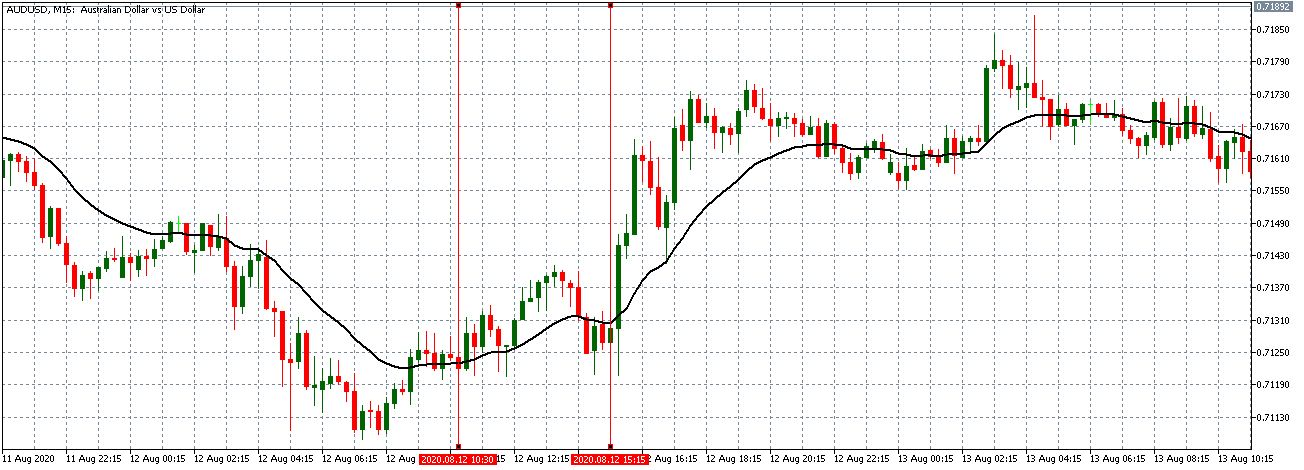
AUD/USD: Before Monthly CPI Release on August 12, 2020, 
Just Before 8.30 AM ET

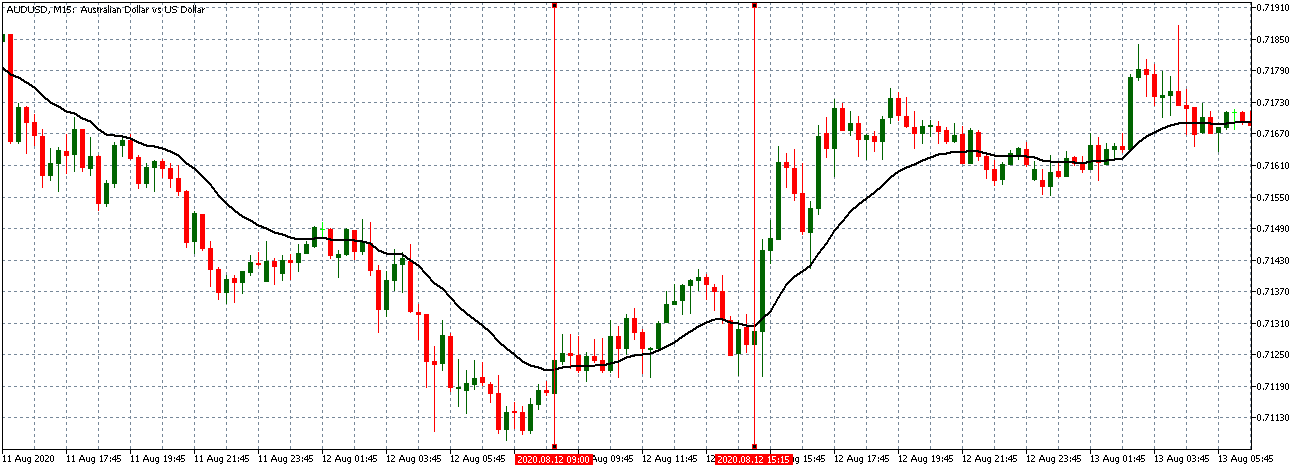
The AUD/USD pair traded in a subdued uptrend before the data release. The 15-minute candles are forming just around an almost flattening 20-period MA.

AUD/USD: After Monthly CPI Release on August 12, 2020, 
8.30 AM ET

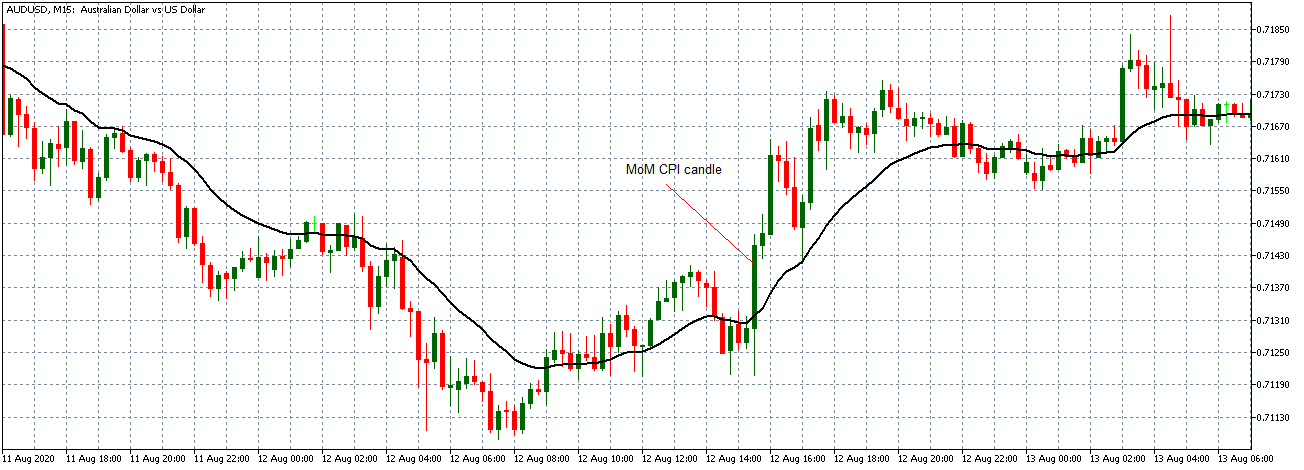
Like the EUR/USD pair, the AUD/USD formed a long bullish 15-minute candle after the news release. Afterwards, the 20-period MA steeply rises as the pair adopted a steady uptrend.

NZD/USD: Before Monthly CPI Release on August 12, 2020, 
Just Before 8.30 AM ET

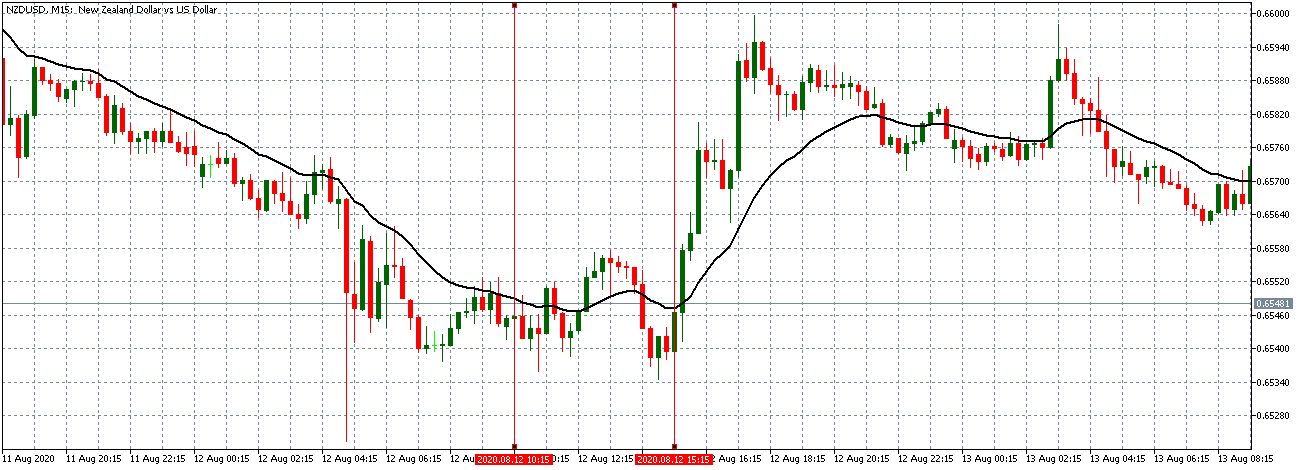
NZD/USD: After Monthly CPI Release on August 12, 2020, 
8.30 AM ET

Before the data release, the NZD/USD pair traded within a neutral pattern with the 15-minute candles crisscrossing an almost flattening 20-period MA. As observed with the other pairs, the NZD/USD formed a long 15-minute bullish candle after the news release. It subsequently traded in a steady uptrend with the 20-period MA steeply rising.

Bottom Line

In theory, an increasing rate of CPI should be a strong USD, but as observed in the above analyses, a high CPI resulted in a weakening USD. The CPI is often considered a leading indicator for interest rate; hence, a rising CPI is accompanied by a rising interest rate. However, since the US Fed had already indicated that it has no intention of increasing the interest rate, a high CPI implies a depreciating USD. It is, therefore, imperative that forex traders have the Fed’s decision in mind while trading with CPI data.

Categories
Forex Fundamental Analysis

Everything About Food Inflation & The Impact Of Its Release On The Forex Market

Introduction

Capitalist economies achieve economic growth using inflation as the primary fuel. Low and steady inflation rates are essential for achieving target GDP each year. Not all commodities inflate steadily and proportionally. Disproportional inflation amongst different sectors leads to over and underpricing of commodities. Food and Energy are the most basic of necessities in today’s modern society. Understanding how food inflation affects the population and the overall economy will help us better understand the inflation trends and their consequences.

What is Food Inflation?

Inflation is the typical increase in prices of commodities and a decrease in the purchasing power of money over time. Inflation is required to motivate people to work better to be able to afford it. If prices were stagnant, the necessity to grow or earn more would cease, thus halting the growth of a nation on the macro level. When that happens, people will remain in their current financial state and would not progress. Hence, inflation is the “necessary evil” or the required fuel for capitalist countries to achieve economic growth.

Food Inflation refers to the general increase in prices of food commodities. As prices inflate, our current income’s purchasing power erodes. Food and Energy are the necessities for us in this modern society. Although to some extent, Energy can be cut back on to get on with life, we cannot cut back on food.

Food is the fundamental right to every human being. Accessibility and affordability to food and water is a must for every individual regardless of their country. Food inflation monitors the affordability aspect of food within the nation; the consequences associated with it are more intricate than we might anticipate.

How can the Food Inflation numbers be used for analysis?

As people can procure fewer goods for a unit of currency over time, people can either cut back on expenses or earn more to compensate for inflation. Food expenses are mandatory expenditure part of income. High food inflation will take up a more substantial chunk out of the disposable income of individuals leaving less room for discretionary spending.

As the affordability of food decreases due to high food inflation, consumer spending is negatively affected. Consumer Spending is the primary component of GDP accounting for more than two-thirds of the nation’s GDP. In the same case, more people who are working on minimum wages find it more difficult to afford food and would be below the poverty line even when their wages are not.

Political implications would also be severe. The backlash from the public over Government’s inadequacy to control inflation would be severe and, at times, have led to strikes and bans in many countries over the years. The Government at such times faces severe criticism both from the public and the opposition parties and would likely lose the next elections.

Food inflation could also occur due to adverse weather conditions destroying crops, or mismanagement of supply and demand by the authorities, or even politically manipulating supply and demand for profit by local dealers. There have been incidents where supplies of grains were withheld to boost up the prices for better profits artificially.

In developing countries, there are incidents where Government-issued rations are also sold illegally for profit by some corrupt groups. Lack of proper support to farmers in terms of resources like electricity, water, seeds, loans could also impair them to produce a good yield. All such factors add to food inflation, whose burden falls upon the ordinary people.

It is necessary to understand that all other commodities excluding Food and Energy generally have at least some alternatives (or different brands) to choose from in case price inflates. For instance, people looking to buy clothes from a brand may switch to another brand to avoid paying the new inflated price. Food inflation effect cannot be avoided as quickly as was the previous case.

Government officials closely monitor the inflation levels and are politically committed to keeping inflation in check through fiscal and monetary levers at their dispense. Food and Energy prices are given special attention, and almost all the time, the response is quick and practical from the Government during times of disruption in the food supply.

During the COVID-19 pandemic, many countries’ governments released relief packages to make sure there is no food shortage. Despite the fact many people slipped through the cracks of these protection measures, nonetheless, Governments did everything they could to avoid starvation.

 Impact on Currency

Food inflation is part of overall consumer inflation. Consumer inflation is the primary macroeconomic indicator for currency traders to assess relative inflation amongst currency pairs. Hence, food inflation is overlooked by currency traders for the broader inflation measures like the Consumer Price Index (CPI) or Personal Consumption Expenditure (PCE).

Nonetheless, food inflation is beneficial for the government officials to keep it in check all the time and also for the economic analysts to report the same. Overall, food inflation is a low-impact coincident indicator in macroeconomic analysis for currency trading that is overlooked for broader inflation measuring statistics, as mentioned before.

Economic Reports

The Bureau of Labor Statistics publishes monthly inflation statistics as part of its Consumer Price Index report for the United States. This report has the food inflation statistics as the first criteria.

The St. Louis FRED also maintains the inflation statistics on its website and has many other tools to add to our analysis.

Sources of Food Inflation

Consumer Price Index from the US Bureau of Labor Statistics is available on its official website along with monthly updates.

We can find the same indexes along with many others with a comprehensive summary and statistics on the St. Louis FRED website.

We can find the global food inflation statistics of most countries on Trading Economics.

How Food Inflation Data Release Affects The Price Charts

In the US, the food inflation data is released simultaneously with the overall consumer price index (CPI) data. The data is released monthly about 16 days after the month ends. The most recent release was on August 12, 2020, at 8.30 AM ET and can be accessed at Investing.com here. A more in-depth review of the monthly report can be accessed at the US Bureau of Labor Statistics website.

It is worth noting that since the food inflation numbers are released together with the over CPI, it will be challenging to determine the effect it has on price action.

The screengrab below is of the monthly CPI from Investing.com. On the right, is a legend that indicates the level of impact the Fundamental Indicator has on the USD.

As can be seen, the CPI data is expected to have a medium impact on the USD upon its release.

The screengrab below shows the most recent changes in the monthly CPI data in the US. In July 2020, the monthly CPI increased by 0.6% better than analysts’ expectations of a 0.3% change. This positive change is therefore expected to make the USD stronger compared to other currencies.

Now, let’s see how this release made an impact on the Forex price charts.

EUR/USD: Before Monthly CPI Release on August 12, 2020, 
Just Before 8.30 AM ET


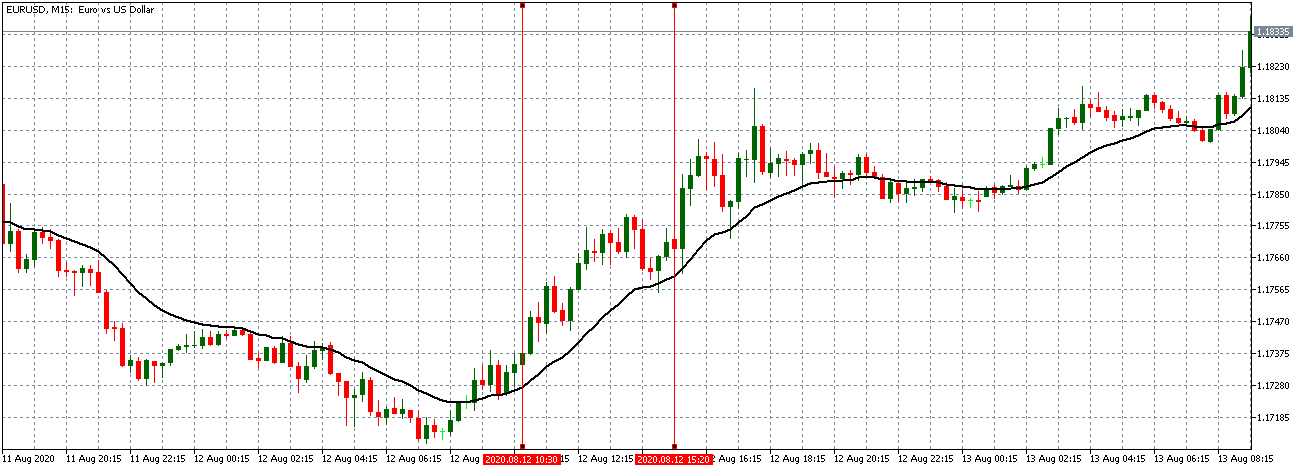
As can be seen from the above 15-minute chart, the EUR/USD pair was on a steady uptrend before the inflation news release. Bullish candles are forming above a steeply rising 20-period Moving Average, indicating the dollar was weakening before the release. Immediately before the news release, the uptrend can be seen to be weakening.

EUR/USD: After Monthly CPI Release on August 12, 
2020, 8.30 AM ET

After the news release, the pair formed a 15-minute bullish candle. Contrary to the expectations, the USD became weaker against the EUR since the pair continued to trade in the previously observed uptrend.

Now let’s see how this news release impacted other major currency pairs.

AUD/USD: Before Monthly CPI Release on August 12, 2020, Just Before 8.30 AM ET

The AUD/USD pair shows a similar trading pattern as the EUR/USD before the inflation news release. The pair is on an uptrend, which heads for a neutral trend immediately before the news release.

AUD/USD: After Monthly CPI Release on August 12, 2020, 
8.30 AM ET

As observed with the EUR/USD pair, the AUD/USD formed a bullish 15-minute candle after the news release. Afterward, the pair traded in a renewed uptrend with the 20-period Moving Average steeply rising.

NZD/USD: Before Monthly CPI Release on August 12, 2020, 
Just Before 8.30 AM ET

NZD/USD: After Monthly CPI Release on August 12, 2020, 
8.30 AM ET

Unlike the EUR/USD and the AUD/USD pairs, the NZD/USD traded within a subdued neutral trend with an observable downtrend immediately before the news release. However, after the news release, the pair formed a 15-minute bullish candle and traded in a steady uptrend, as seen with the other pairs.

Bottom Line

In theory, a positive CPI data should be followed by an appreciating USD. From the above analyses, however, the positive news release resulted in the weakening of the USD. This phenomenon can be choked to the effects of the coronavirus expectations, which have made fundamental indicators less reliable.

Categories
Forex Fundamental Analysis

Understanding ‘Core Inflation’ & It’s Impact On The Forex Price Charts

Introduction

Core inflation is the change in the price of the goods and services that do take food and energy into account. It is referred to as ‘core’ because it represents the most accurate illustration of the underlying inflation trends. The reason for the exclusion of food and energy is due to its high volatility. They change so often that they may depict an inaccurate reading of the inflation rate. And the commodity market is the sole cause behind the volatility, as it extensively traded all day.

Why Exactly Food and Energy are Excluded

As already mentioned, Food and Energy are exempted from the calculation of core inflation because the volatility in these markets is too high. This reduces the accuracy of the core inflation rates. Food and energy are considered as the most necessary staples; that is, their demand does not change even if there is a price hike. For instance, let’s say the gas prices rise due to the rise in oil prices. But this rise will hardly affect you as you’ll still need to fill up your tank in order to drive your vehicle. Similarly, you will not become hesitant to go to the grocery store because the prices have risen.

Oil and gas are commodities that are traded on the exchange market where people can buy and sell them. The commodity traded bid on the oil prices when they suspect a fall in supply or a rise in demand. Also, the thick that war will bring down the supply of oil. With this assumption and analysis, they buy at the present price and anticipate a higher price in the future. And this is enough to pump up the oil prices in the market. And if things don’t go as per the plan, the prices fall when they sell. Hence, this creates high volatility in the market.

The food prices are dependent on the prices of gas. The food prices tend to rise along with the gas prices because transportation of the food is dependent on trucking. When the oil prices rise, the effect can be seen in the gas price a week later. And if the gas prices maintain its uptrend, the effect of it can be observed on the food prices a few weeks later.

Measuring Core Inflation

The core inflation is measured by both the Consumer Price Index (CPI) and the core Personal Consumption Expenditure Index (PCE). The PCE is the depiction of the prices of goods and services purchased by consumers in the United States. Also, since inflation determines the trend in trend in the rising prices, the PCE is a vital metric in assessing inflation. However, both PCE and CPI are considered to be very similar as both help in determining the inflation in the economy.

CPI and PCE – Which is the Preferred Measure?

It is observed that PCE tends to provide inflation rates that are less affected by the short-term price changes, which is why the Federal Reserve prefers the PCE index over the CPI. The Bureau of Economic Analysis (BEA), a division of the Department of Commerce, measures the rates by using the existing gross domestic product (GDP) data, which helps in determining the overall trend in the prices. The GDP gives the measure of the total production of goods and services. In addition, BEA takes in the monthly Retail Survey data and compares it with the consumer prices generated by the CPI. In doing so, the data irregularities are removed, which helps in providing long-term trends.

Why is Core Inflation Important?

It is important to asses core inflation because it determines the relationship between the price of the goods and services and the level of the consumer income. If there is an increase in the price of the goods and services and no proportional increase in consumer income, consumer buying power will decrease. So, we can conclude that inflation causes the value of money to depreciate compared to the prices of goods and services.

However, if the consumer income increases, but the price of the goods and services remains unchanged, consumers will theoretically have money buying power. Moreover, there will be an increase in the investment portfolio, which leads to asset inflation. And this can generate additional money for consumers to spend.

Core Inflation and its Impact on the Economy and Currency

Core inflation has both a subtle and destructive effect on economic growth. It is said to be subtle because an increase of one or two percent takes quite a while. However, this can have a positive effect at this rate as well. People purchase goods and services beforehand, knowing that price will rise in the near future. Hence, this increase in demand stimulates economic growth. And since currency depends directly on the economy, the price of the currency rises as well.

Inflation can have a negative effect on the economy, as well. That’s because people will have to spend how much ever high price on food and gas, as they are the essentials. This brings down other consumer sectors in the market because people tend to spend less here. Their businesses are less profitable now. This imbalance in the market lowers the economic output.

Reliable sources of data for Core Inflation

The core inflation rate is released by the countries’ statistics board. For most countries, it is released on a monthly basis. And the reports are in terms of percentages. Below is a list of sources of core inflation data for different countries.

EURUSDAUDGBP  For other world countries, you may access those reports here.

How does Core Inflation Affect the Price Charts?

Until now, we understood the definition of Core inflation and its impact on the economy and the currency. Here we shall see the immediate effect of the currency pair when the reports are released. For our example, we will be taking the U.S. dollar for our reference. The core inflation rate in the U.S. is released by the U.S. Bureau of labor statistics. The frequency of the announcement of data is monthly.

Below is the core inflation data released by the U.S. Bureau of labor statistics for the month of February. But, the data for it is announced in the first week of March. We can see that the core inflation has turned to be 2.4 percent, which is 0.1 percent higher than the previous month and the forecasted value. Now, let’s see how this value has affected the U.S. Dollar.

EUR/USD | Before the Announcement – (March 11, 2020 | Before 12:30 GMT)

Below is the chart of the EUR/USD on the 15min timeframe just before the release of the news.

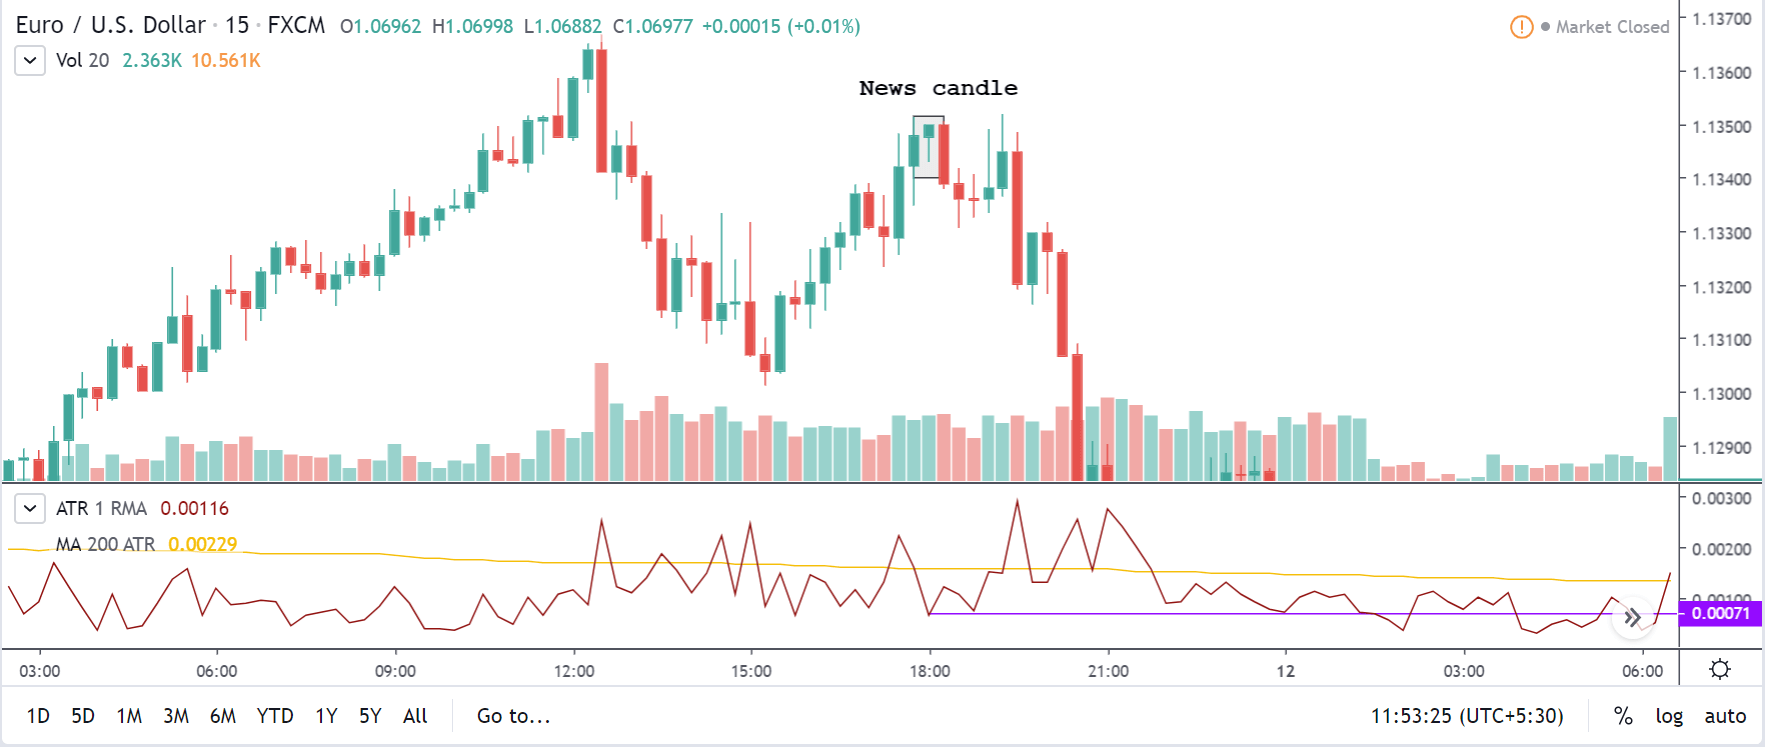
EUR/USD | After the Announcement – (March 11, 2020 | After 12:30 GMT)

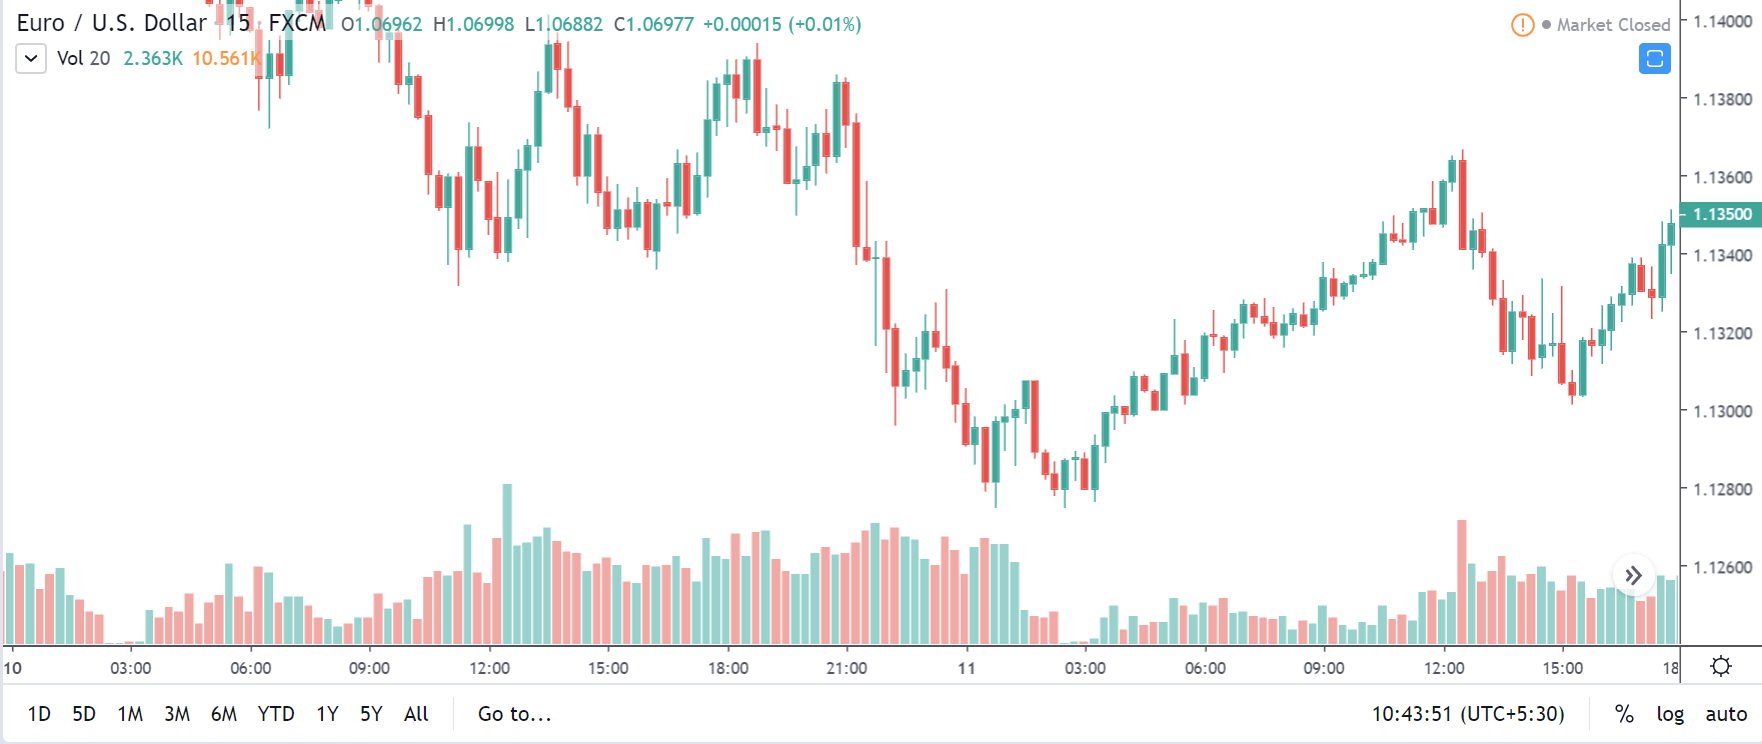
Below is the same chart of EUR/USD on the 15min timeframe after the release of the news. The news candle has been represented in the chart as well. It is evident from the chart that the news did not have any effect on the currency pair. Though the reports showed an increase in the core inflation, there was hardly any drastic pip movement in the pair. Also, the volatility was below the average, and the volume was low. With this, we can come to the conclusion that the core inflation rate did not impact the EUR/USD.

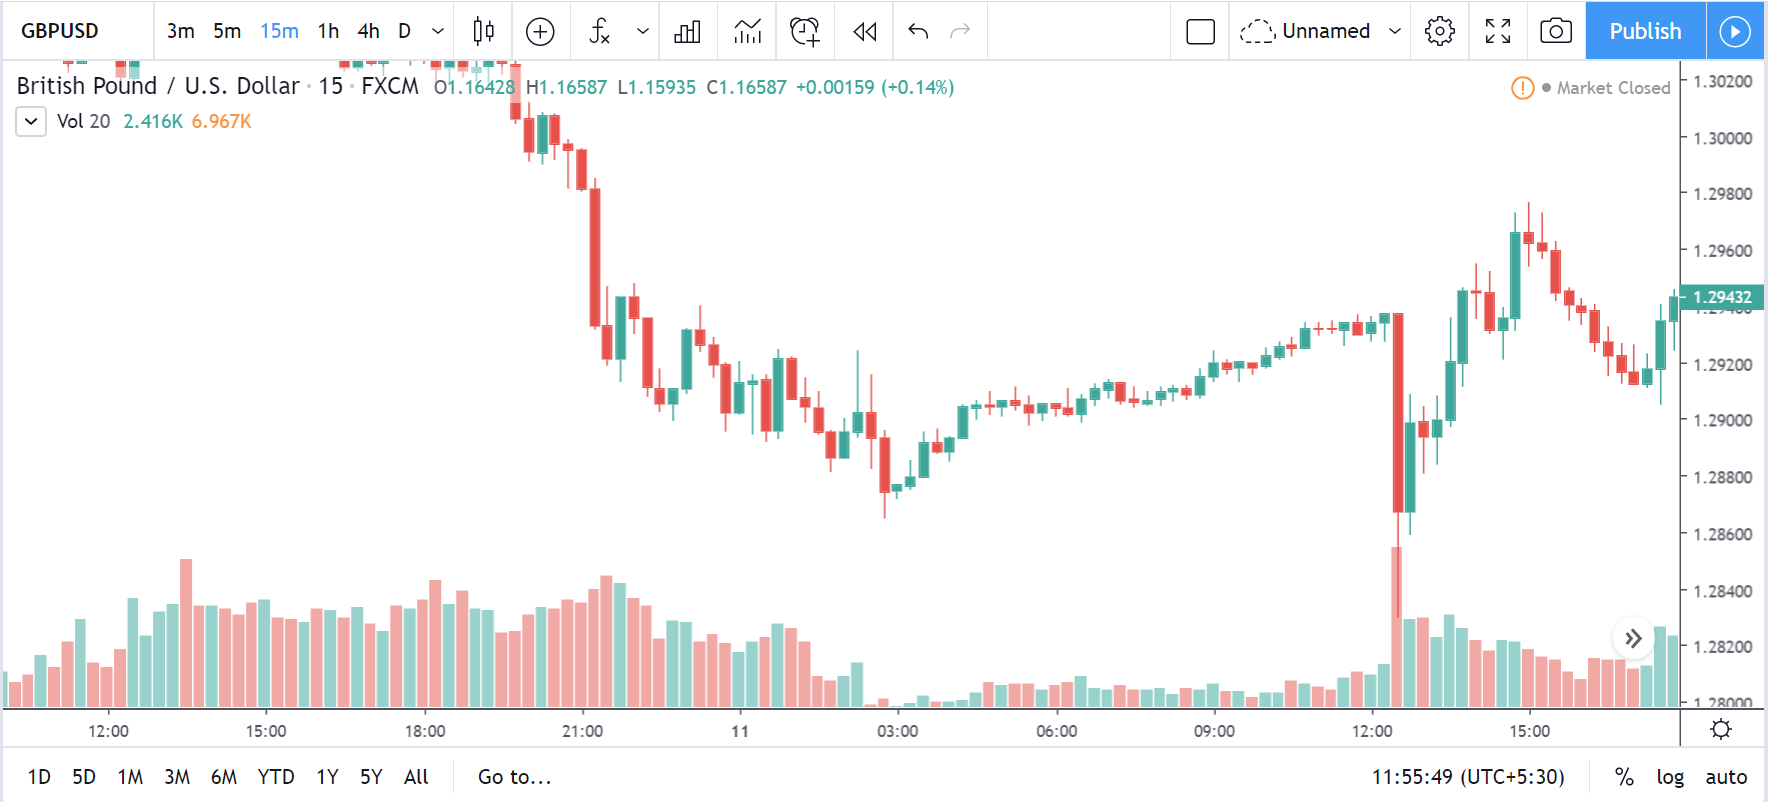
GBP/USD | Before the Announcement – (March 11, 2020 | Before 12:30 GMT)

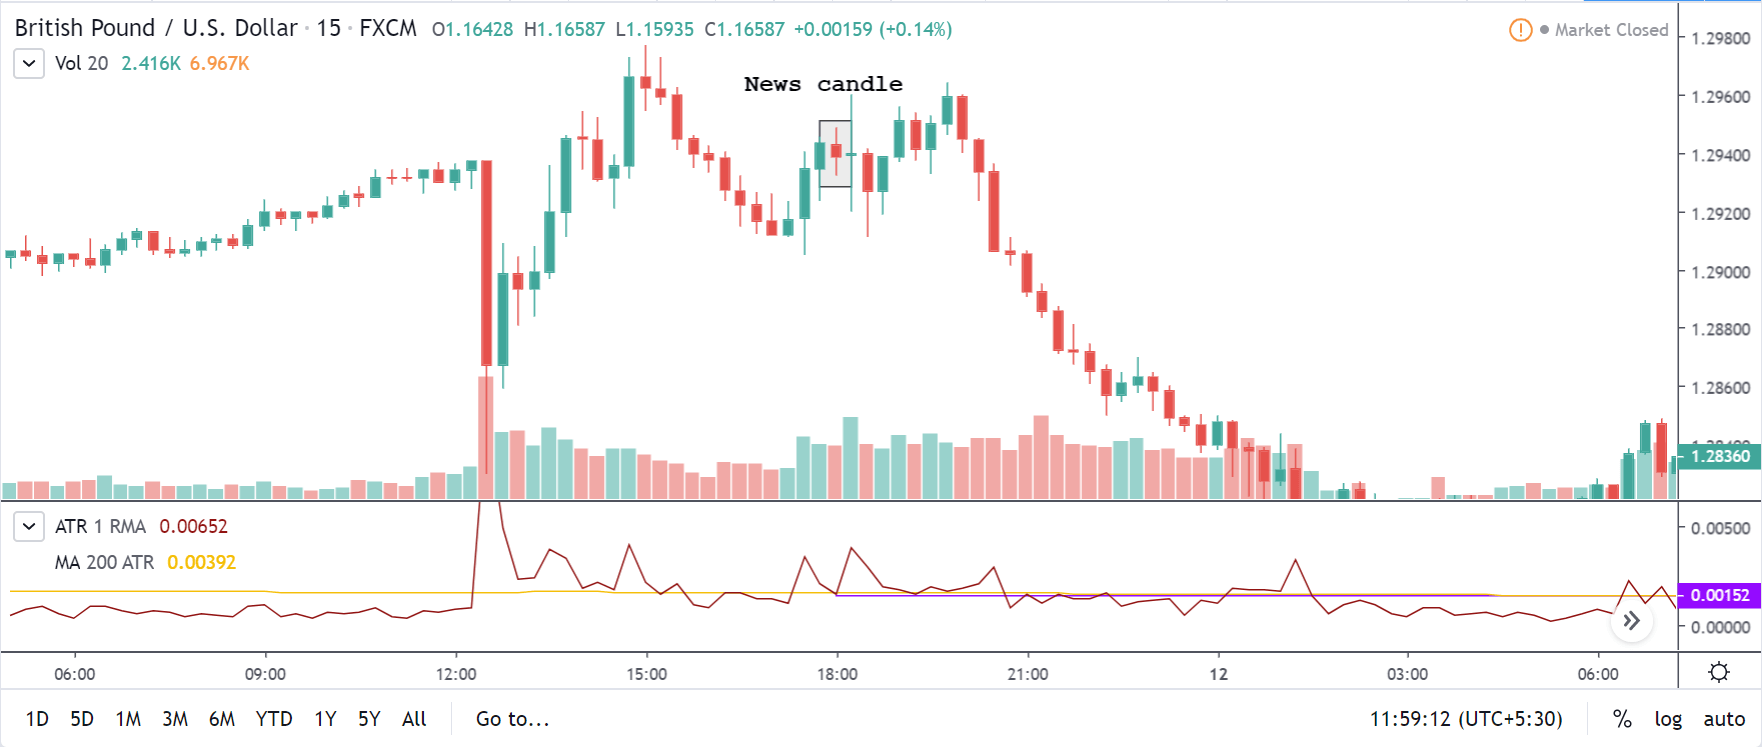
GBP/USD | After the Announcement – (March 11, 2020 | After 12:30 GMT)

Consider the below chart of GBP/USD on the 15min timeframe. We can see that the news candle was a bearish candle. That is, the news was positive for the U.S. Dollar. However, if we were to check on the volatility of the market, the volatility when the news came out was at the average value. Seeing the volume bar corresponding to the candle, it wasn’t high as such. Hence, the core inflation did not impact the GBP/USD.

Traders who wish to trade this pair can freely go ahead with their analysis as the news has a very light impact on the USD.

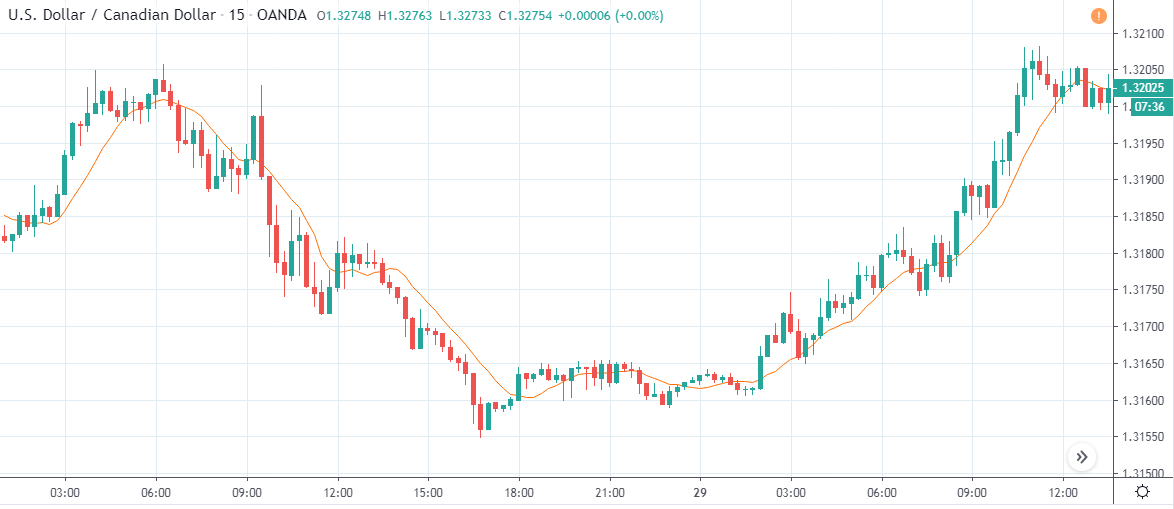
USD/CAD | Before the Announcement – (March 11, 2020 | Before 12:30 GMT)

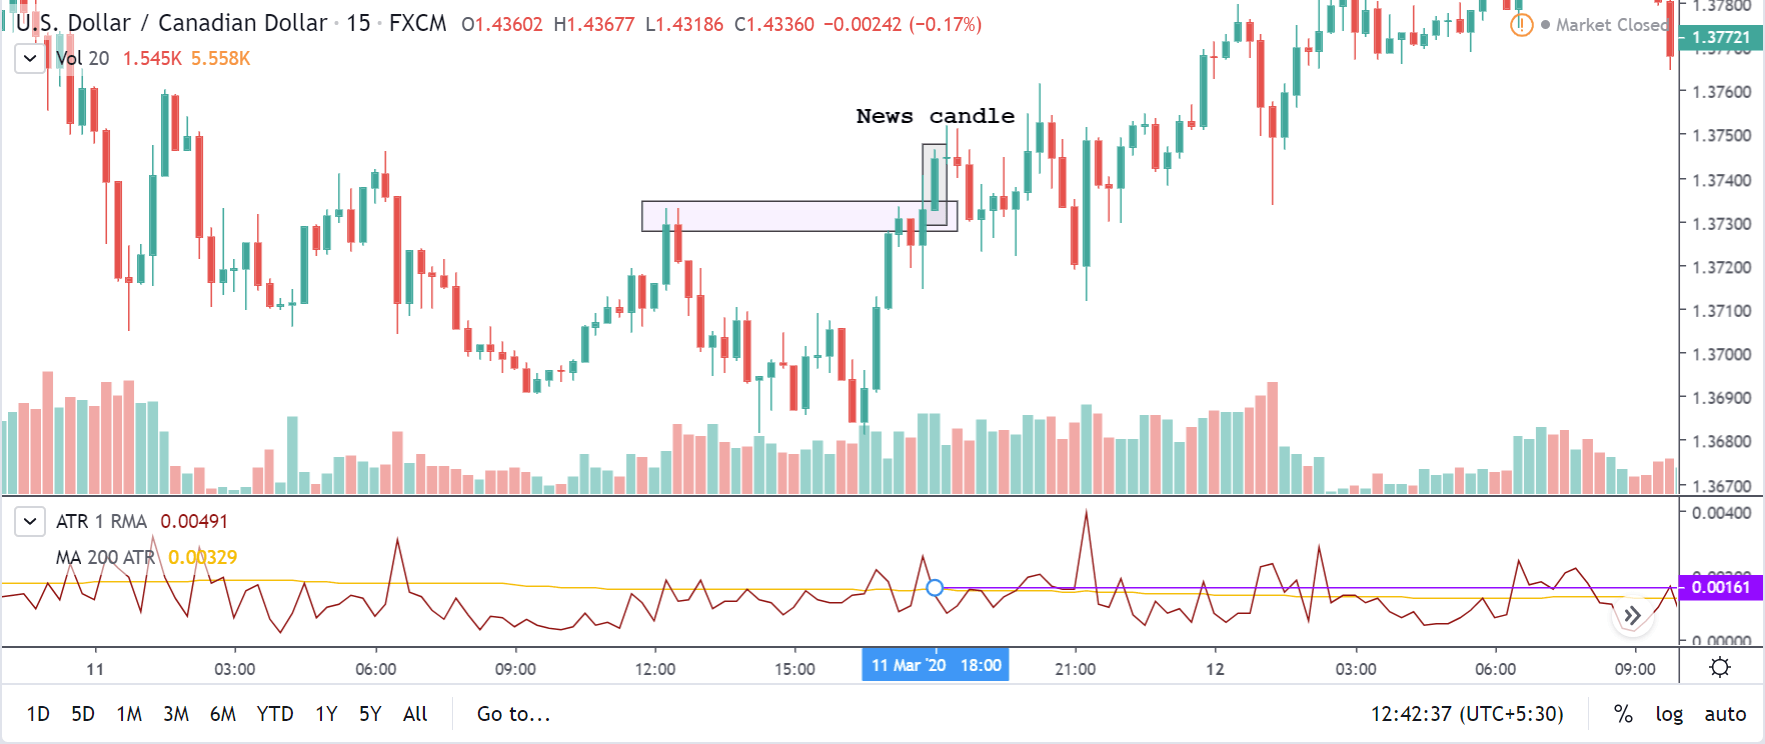
USD/CAD | After the Announcement – (March 11, 2020 | After 12:30 GMT)

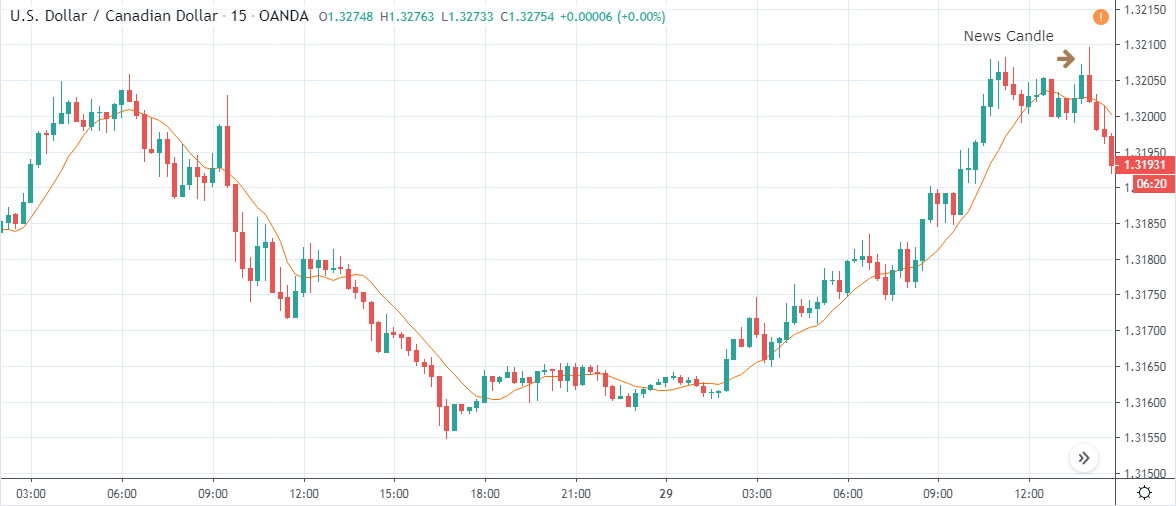
Below is the USD/CAD candlestick chart on the 15min timeframe after the release of the news. The news showed an increase in the core inflation rate by 0.1 percent. In the chart, we can see that the report turned out to be positive for the USD. In fact, the news candle actually broke the supply level and went above it. Compared to EUR/USD and GBP/USD, the core inflation had a decent impact on USD/CAD. However, the volatility was at the average mark, and the volume didn’t really spike up.

Conclusion

Core inflation is an economic indicator that measures the inflation of an economy without considering food and energy. This is because of the high volatility in the food and energy market. The core inflation rates are usually taken from the CPI or the PCE. This is an important indicator as it determines the relationship between the price of goods and services and consumer income.

It also gives an idea of the current economy of a nation. However, when it comes to its effect on the currency, there is not much impact on it. So, conservative traders can trade the markets without fearing the release of the news, as there is no drastic rise in the volatility of the markets.

Categories
Forex Fundamental Analysis

What Is ‘Inflation Rate’ & Why Is It One Of The Most Important Fundamental Indicators?

Introduction

Based on the current inflation rate and future monetary policies, we can effectively gauge the current economic situation of a country. Using the Inflation rate data, we can also get an insight into the current currency’s value and in which direction the economy is heading towards. Hence we must look at this key indicator in its depth to solidify our fundamental analysis.

What is Inflation?

In Economics, Inflation is the increase in the prices of goods & services, and the resultant fall in the purchasing power of a currency. What this means, in general, is that when a country experiences Inflation, the prices of the most commonly used goods & services by the citizens of a country increase. Because of this, the average person has to spend more money to buy the same amount of goods which cost less in the previous period.

For instance, if John went to a grocery store to purchase his monthly groceries, and it cost him 100$ in 2018. Next year, i.e., in 2019, John goes to the same store to buy the same set of goods, and it had cost him 105$. Now John either has to remove some items or pay more to make the same purchase. Here John has experienced Inflation of 5%.

What is Inflation Rate?

The percentage increase in the price of goods & services over a period (usually monthly or yearly) is called the Inflation Rate. In our previous example of John, we see we have an inflation rate of 5%.

Inflation Rate is compounding in nature, i.e., it is always calculated with reference to the most recent statistic and not any particular base year or a base inflation rate. For example, if John were to buy the same goods in 2020, if it costs him 110$, then John has experienced 4.54% of Inflation and not 10% inflation.

Why is Inflation Rate important?

Inflation, in general, when kept in check, is good for an economy as it fuels growth. The increase in the prices of common goods and services means people have to compete and work better to earn more to meet their needs. But as in any case, excess or high Inflation can be crippling for an economy.

Because the citizens of the country get poorer when the purchasing power of the currency falls due to a high increase in prices, inflation Rates can be used to gauge the current financial health of an economy and what the citizens of a country are currently experiencing.

How does Inflation Occur?

A general view in the economic sector is that steady Inflation occurs when the money supply in the country outpaces economic growth. It means more currency is being circulated into the economy than its equivalent activity (revenue-generating practices). Inflation occurs mainly due to the rise in prices. But in brief, Inflation can occur due to the following situations:

Demand-Supply Gap: When the demand for a particular good is higher than the supply or production of the same, then there is a natural surge in the price of that good.

Increased Money Supply: When more money is in circulation in the economy, it means an individual has more disposable cash. This increases consumer spending due to a positive future sentiment resulting in increased demand, which ultimately increases the price of goods.

Cost-Push Effect: When the cost of inputs to the process of manufacturing good increases, it coherently increases the overall cost of the finished good. This results in a higher selling price of goods, which ultimately results in Inflation.

Built-In: Built-in inflation happens when there is a sort of feedback loop in the prices of goods and incomes of people. As people demand higher wages to meet the needs, it results in higher prices of goods and services to fund their demand and vice-versa. This adaptive price and wage adjustment automatically feed off each other and result in an increase in prices.

How is Inflation measured?

Based on different sectors, the costs of different sets of goods & services are used to calculate different inflation indexes. However, there are some most commonly used inflation indices in the market, like the Consumer Price Index (CPI) and Producer Price Index (PPI) in the United States.

Consumer Price Index (CPI): The Bureau of Labor Statistics (BLS) surveys the prices of 80,000 consumer items to create the Index and publishes it on a monthly basis. It is a measure of an aggregate price level of most commonly purchased goods and services like food, shelter, clothing, and transportation fares. Service fees like water and sewer service, sales taxes by the urban population, which represent 87% of the US population, are weighted into the percentage, based on their importance in terms of need.

Changes in CPI are used to ascertain the retail-price changes associated with the Cost of Living, and hence it is used widely to assess Inflation in the USA. In this Index, there are many subcategories wherein certain goods are either included or excluded to give a more accurate picture of Inflation in absolute or relative terms. For example, Core CPI strips away food, gas, and oil prices from the equation whose prices are volatile in nature.

Producer Price Index (PPI): It measures the average change in the selling prices received by domestic producers for their output over a period of time (usually monthly). Unlike CPI, which measures retail prices from the viewpoint of end customers who purchase the items, PPI measures the prices at which goods and services are sold to outlets from the manufacturer. PPI measures the first commercial transaction, and hence it does not include the various taxes and service costs that are associated and built into the CPI.

PPI vs. CPI

PPI measures the change in average prices that an initial-producer or manufacturer receives whilst CPI estimates the change in average prices that an end-consumer pays out. The prices received by the producers differ from the prices paid by the end-consumers, on the basis of a variety of factors like taxes, trade, transport cost, and distribution margin, etc.

Sources of Inflation Indexes

The US Bureau of Labor Statistics releases all the above-mentioned indexes here:

Consumer Price Index | Producer Price Index 

Inflation Rates of some of the major economies can be found below.

United Kingdom | Australia | United States | Switzerland | Euro Area | Canada | Japan 

How ”Inflation Rate” News Release Affects The Price Charts?

In this section of the article, we shall find out how the Inflation rate news announcement will impact the US Dollar and notice the change in volatility after the news is released. As discussed above, CPI is a well-known indicator of Inflation as it measures the change in the price of goods and services consumed by households. Therefore, the data which we should be paying attention to is the CPI values and analyze its numbers. We can see that the Inflation Rate does have a high impact on the currency of the respective country.

Below, we can see the month-on-month numbers of CPI, which is released by the US Bureau of Labor Statistics. The data shows that the CPI was increased by 0.1% compared to the previous month, which is exactly what the analysts forecasted.

Now, let’s see how this news release made an impact on the Forex price charts.

USD/JPY | Before The Announcement - (Feb 13th, 2020)
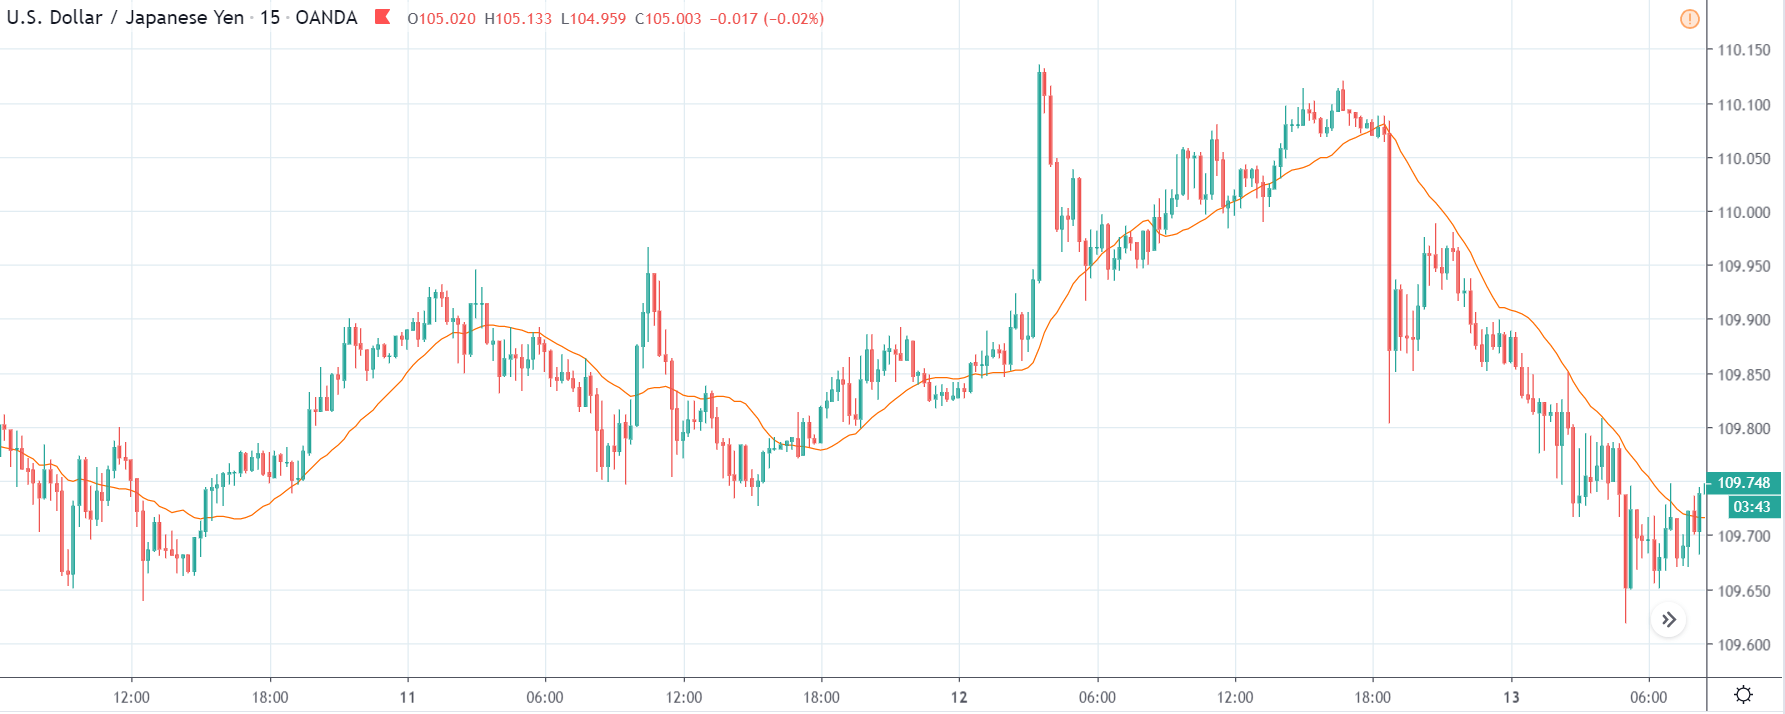
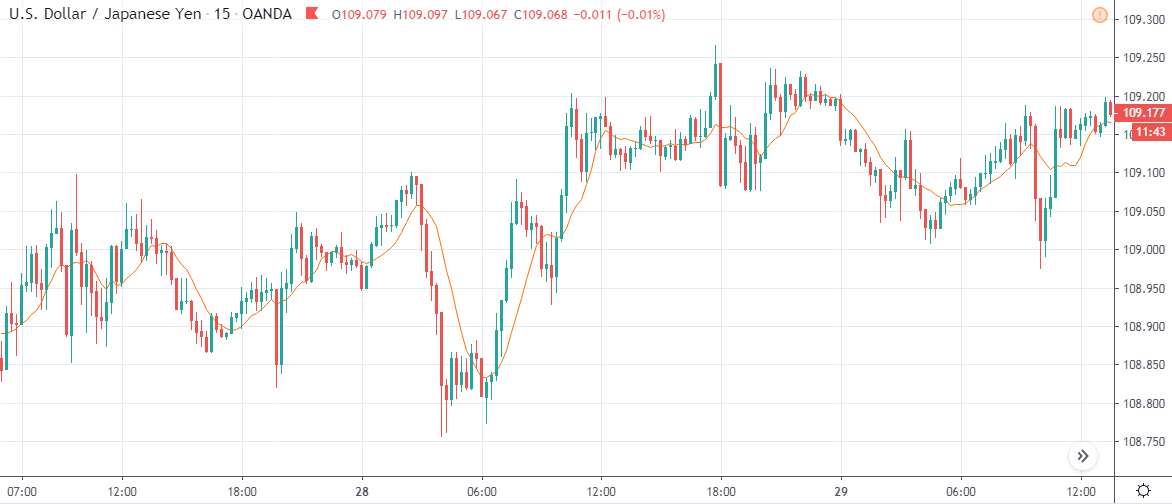
On the chart, we have plotted a 20 ”period” Moving Average to give us a clear direction of the market. From the above chart, it is clear that the US Dollar is in a strong downtrend, which is also evident from the fact that the price remains below the ”Moving Average” throughout. Just before the news announcement, we see a ranging action, which means the market is in a confused state.

Now we have two options with us, one, to ”long” in the market if there is a sudden large movement on the upside and, two, to take advantage of the volatility in either direction by trading in ”options.” We recommend to go with the first option only if you have a large risk appetite, else choose the second option by not having any directional bias. Let us see which of the above options will be suitable after the news announcement is made.

USD/JPY | After The Announcement - (Feb 13th, 2020)
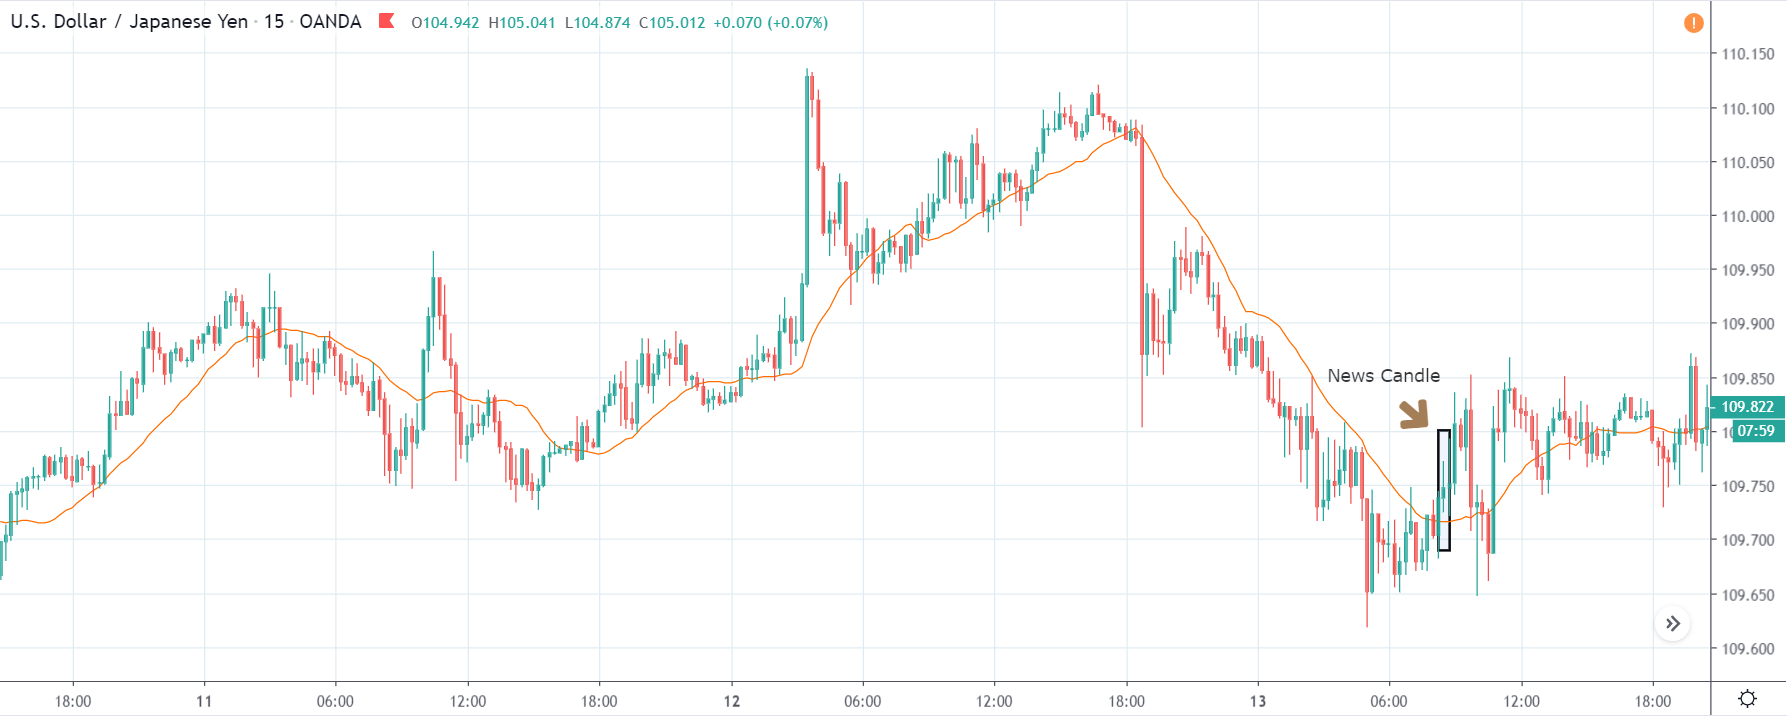
After the CPI numbers are announced, we see that the price does not go up by a lot, and it creates a spike on the top and falls below the moving average. It is very apparent that the news did not create the expected volatility in the above currency pair. From the trading point of view, in the two options discussed above, the first one is completely ruled out as the market did not show a strong bullish sign, and if we had gone with the second option, we would land in no-loss/no-profit situation.

The reason for extremely low volatility after the news announcement can be explained by the fact that the CPI numbers were merely increased by 0.1%. Since an increase in CPI is positive for the US Dollar, the market does not fall much and continues to hover around the same price.

AUD/USD | Before The Announcement - (Feb 13th, 2020)
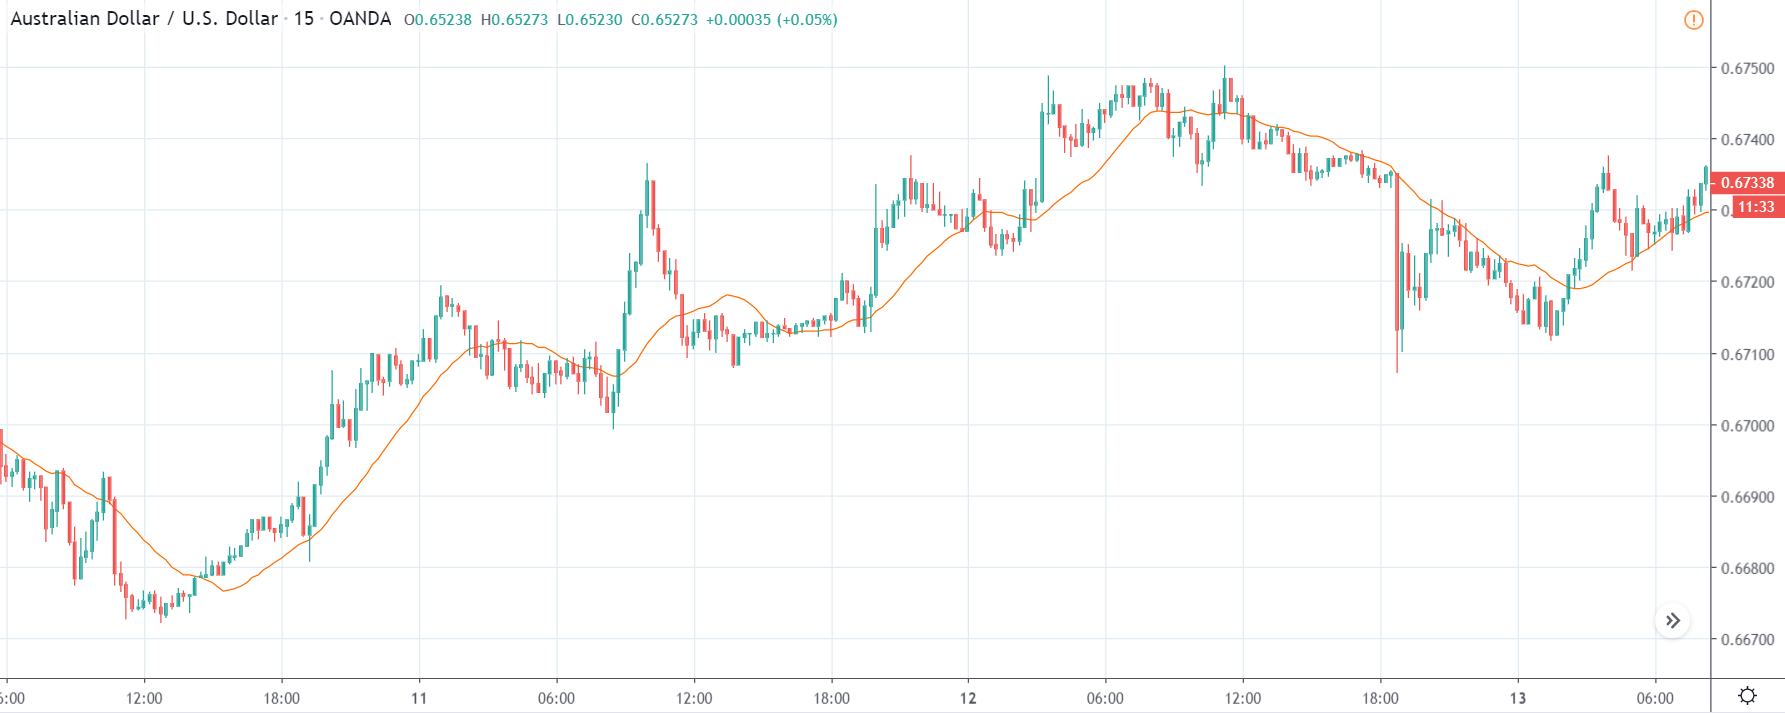
AUD/USD | After The Announcement - (Feb 13th, 2020)
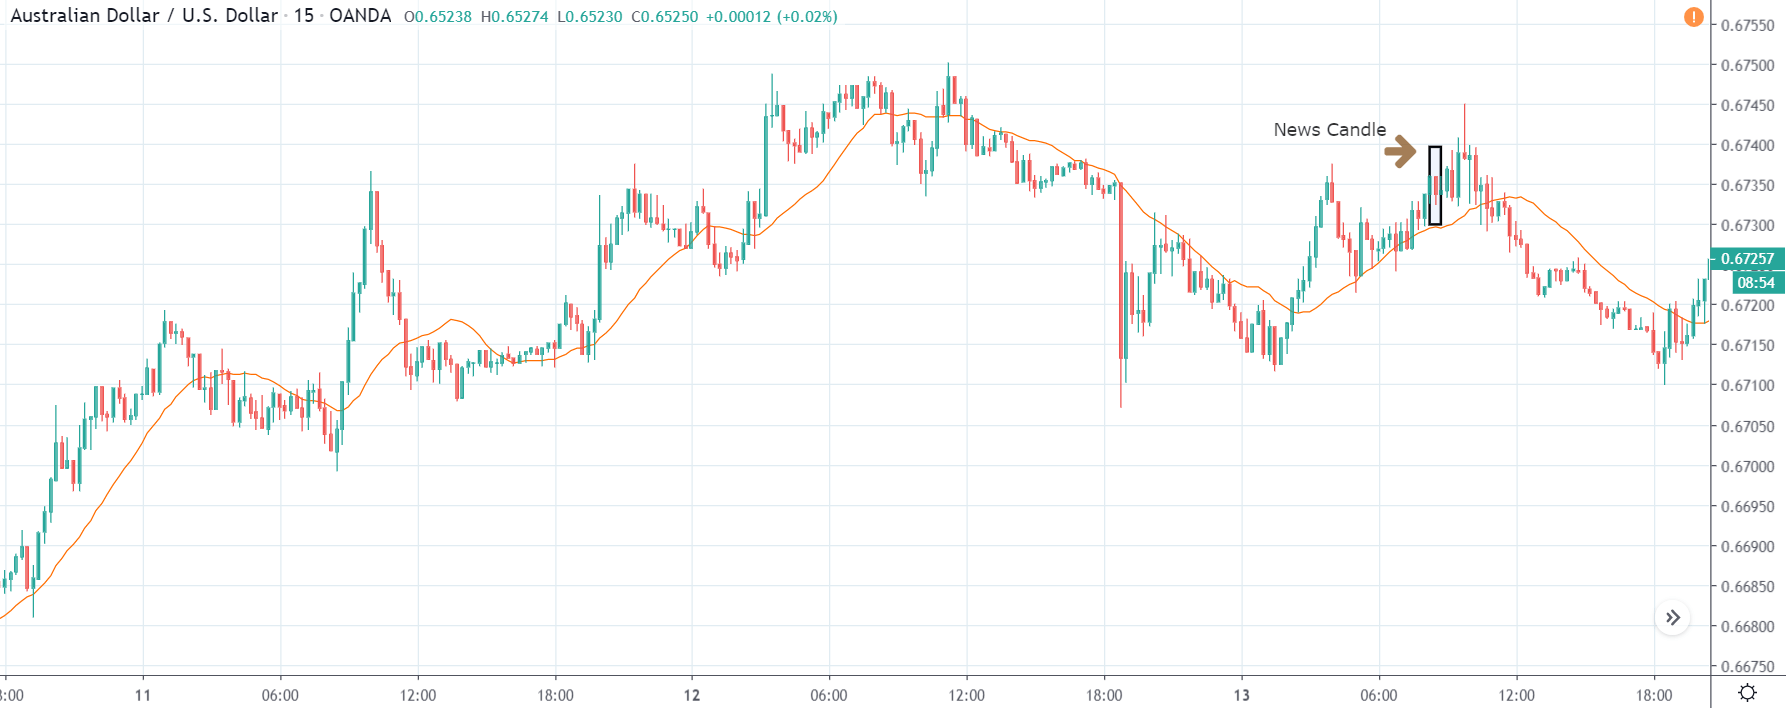
The above charts represent the currency pair of AUD/USD. Here since the US dollar is on the right side, we should see a red candle after the news release since the CPI data was good for the US dollar. By looking at the reaction of the market, we can say that the volatility did increase after the news announcement, which means AUD/USD proved to be better compared to USD/JPY.

A mere rise in the CPI number was good enough for the currency pair to turn into a downtrend from an uptrend. One can also see that the price goes below the moving average indicator. This means that the Australian Dollar is a very weak pair compared to the US dollar, the reason why the US dollar became so strong after the news release. Hence one can take a ”short” trade in the currency pair after the price breaks the MA line.

NZD/USD | Before The Announcement - (Feb 13th, 2020)
NZD/USD | After The Announcement - (Feb 13th, 2020)
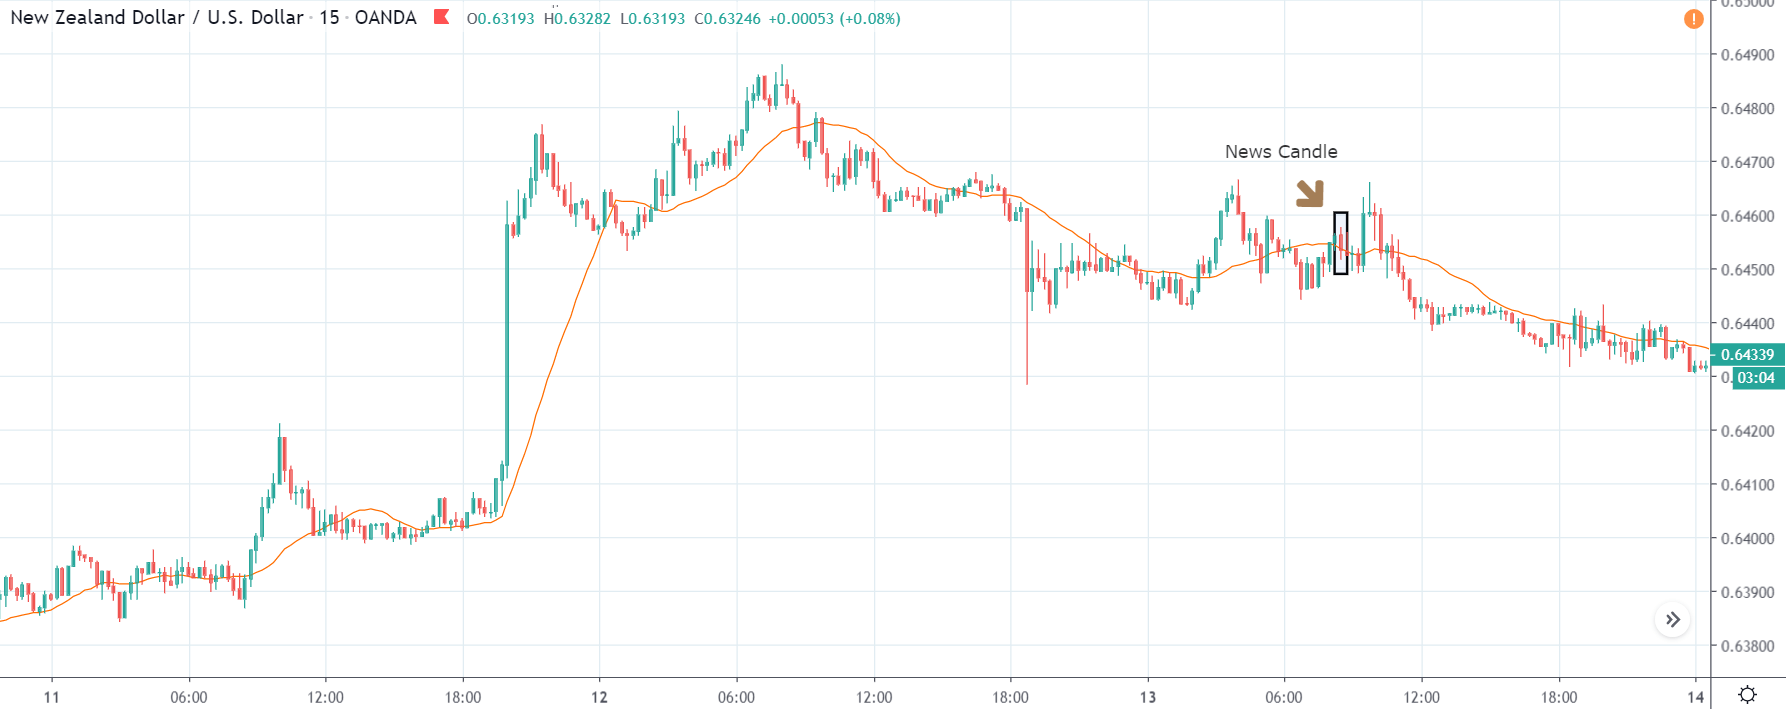
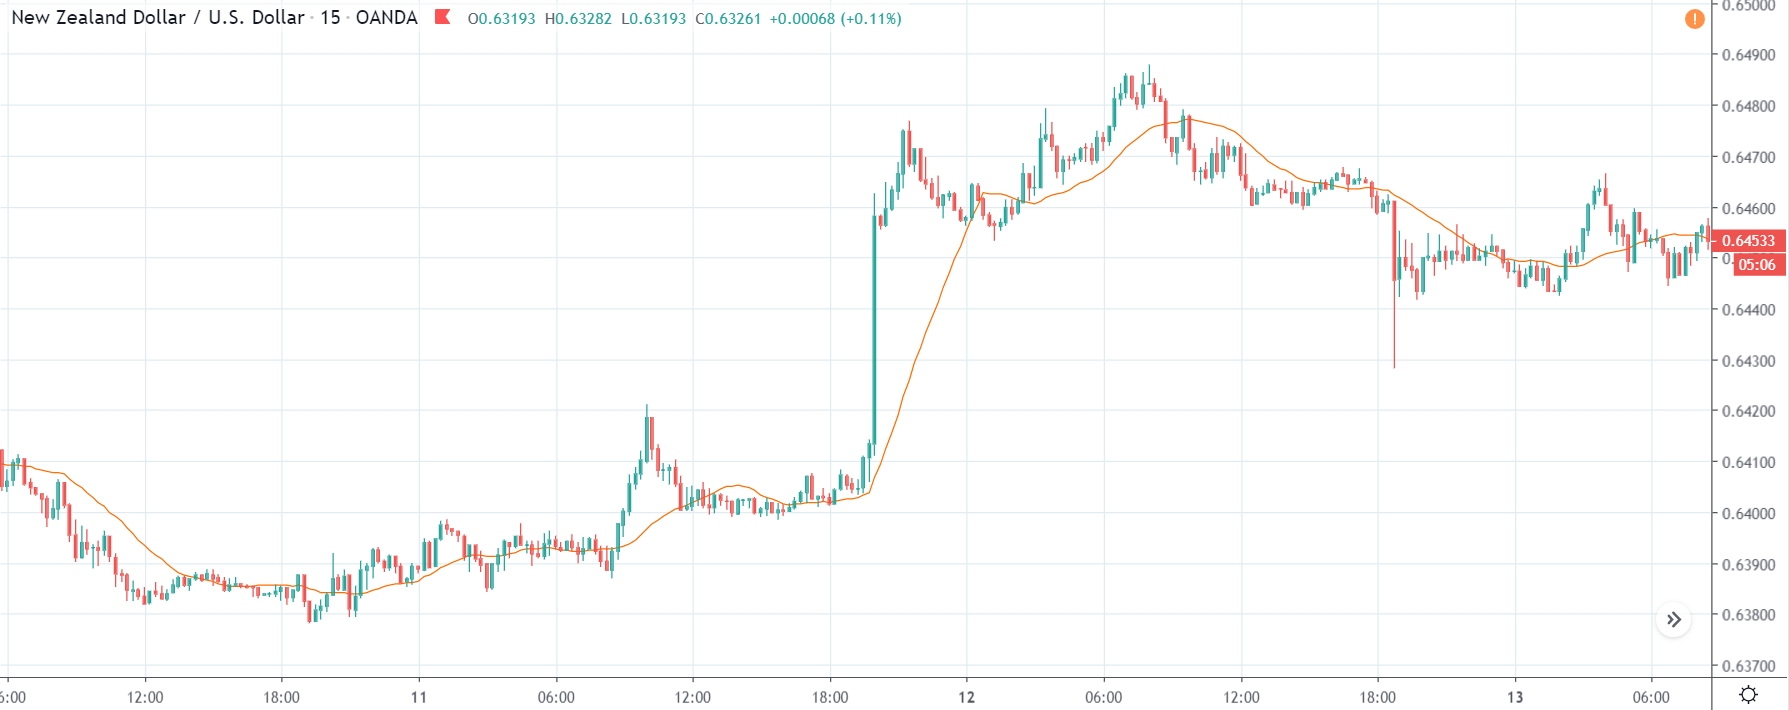
The above charts represent the currency pair of NZD/USD. It shows similar characteristics as that of the AUD/USD pair before and after the news announcement. The CPI data caused the US dollar to strengthen against the New Zealand dollar, where the volatility change can be seen when the market turns into a downtrend.

The CPI data did have a positive impact on the currency pair, but the pair did not collapse. This means the data may not be very positive against the New Zealand dollar, where the price just remains on the MA line after news release and does point to a clear downtrend. Hence, all traders who went ”short” in this pair should look to take profits early in such market conditions as the market can reverse anytime.

That’s about Inflation Rates and its impact on some of the major Forex currency pairs. If you have any queries, please let us know in the comments below. Cheers.

Categories
Forex Fundamental Analysis

Understanding ‘Interest Rate’ & It’s Impact On Various Currency Pairs

Introduction

Economic indicators measure how strong the economy of a country is. They `can measure specific sectors of the economy, such as housing or manufacturing sector, or they give measurements of the country as a whole, such as GDP or Unemployment. The following article will explain one such crucial economic indicator that drives the value of the currency – Interest Rate.

What is Interest Rate?

The interest rate is a fee we are supposed to pay for the money we borrow from the bank. It is generally expressed in terms of a percentage on the principal amount borrowed. The Bank’s primary source of income comes from the difference in the interest rate they charge to the borrowers and the lenders. They operate and profit from the difference between these rates.

When interest rates are high in a country, banks find it difficult to pass on such rates to consumers as it corresponds to fewer loans and more savings. This reduces spending in people, which will have an impact on the economy. Also, raising the interest rates curbs inflation and thus improves the economy.

Types of Interest Rates

The interest rate is frequently used by money managers while making investment decisions, and they look at different types of rates. The different kinds of Rates are Nominal, Real, and Effective interest rates. These are classified on the basis of critical economic factors that can help investors become smarter consumers and better investors. Let’s understand each of these types below.

Nominal Interest Rate

Nominal Interest Rate is the rate that is stated on a loan or bond. It signifies the actual price which the borrowers need to pay lenders in order to use their money. For example, if the nominal rate on loan is 10%, borrowers can expect to pay $10 of interest for every $100 they borrow from the lenders. This is referred to as the coupon rate because it used to be stamped on coupons that were redeemed by bondholders.

Real Interest Rate

It is named this way because, unlike the Nominal Interest Rate, it considers Inflation to give investors an appropriate measure of the consumer’s buying power. If an annually compounding bond gives an 8% Nominal yield and the inflation rate is 4%, the real rate of interest is only 4%. This can be put in the form of an equation as:

Real Interest Rate = Nominal Interest Rate – Inflation Rate

There are other pieces of information that the above formula provides in addition to the Real Rate. Borrowers and investors make use of this info to make informed financial decisions. They are:

  • When the Inflation Rates are negative, Real Rates exceed Nominal Rates, and the opposite is true when Inflation Rates are favorable.
  • There is one theory that suggests that Inflation Rate moves alongside the Nominal Interest Rate over time. Therefore, investors who have a long time horizon will be able to get investment returns on an Inflation-adjusted basis.
Effective Interest Rate

This type of Interest Rate takes the concept of compounding into account that the investors and borrowers need to be aware of. Let us understand how Effective Interest rate works with an example. If a bond pays 8% annually and compounds semi-annually, an investor who invests $1000 in this bond will receive $40 of interest payments for the first six months and $41.6 of interest for the next six months. In total, the investor gets $81.6 for the year. In this example, the Nominal Rate is 8%, and the Effective Interest Rate is 8.16%.

Economic reports & Frequency of the release 

Federal Open Market Committee (FOMC) members vote on where to set the Target Interest Rate. Later, they release the reports on the same with the actual rate and analysis. The policies of Central Banks also have an impact on the Interest Rates of a country. The Reserve Bank members hold meetings eight times a year and once every six weeks to evaluate the Interest Rates. These economic reports are published on a monthly and quarterly basis, and investors can compare the previous Interest Rates to Current Rates and analyze how they changed over time.

Impact on Currency

Investors are always interested in countries that have the highest Interest Rate, and they are more likely to invest in that economy. The demand for local currency is expected to increase, which leads to an increase in value.

High-Interest Rate means residents of that country get a higher rate of return on the deposit they made in banks and on capital investments. So obviously, investors will invest their capital in countries where they get a higher rate of return for holding their money.

Under normal economic circumstances, when investments increase in a country, the value of the currency appreciates and thus attracting the traders across the world.

Sources of information on Interest Rate

The Interest Rate data of some of the major economies can be found in the below references. The Rates of the respective countries are also available on the Reserve Bank website. However, the FOMC makes an annual report on the Interest rate that can be found here.

Authentic Sources To Find The Info On Interest Rates 

GBP – https://tradingeconomics.com/united-kingdom/interest-rate

AUD – https://tradingeconomics.com/australia/interest-rate

USD – https://tradingeconomics.com/united-states/interest-rate

CHF – https://tradingeconomics.com/switzerland/interest-rate

EUR – https://tradingeconomics.com/euro-area/interest-rate

CAD – https://tradingeconomics.com/canada/interest-rate

NZD – https://tradingeconomics.com/new-zealand/interest-rate

JPY – https://tradingeconomics.com/japan/interest-rate  

Interest Rate is one of the crucial factors that impact the currency of a country. It is especially crucial for traders who prefer taking trades on Fundamental analysis. But it is advised not to trade just based on this fundamental indicator alone. It is always better to combine the fundamental factors with proper technical analysis to get an edge over the market.

How ‘Interest Rate’ News Release Affects The Price Charts?

It is important to understand how the new releases of macroeconomic indicators like interest rates have an impact on the price charts. Below, we have provided some of the examples to demonstrate the impact of Interest Rates news release on various Forex markets. There is a reliable forum where all the government news release date is published, and it is known as Forex Factory.  Here, we can find all the present and historical information regarding most of the fundamental indicators like GDP, Interest Rates, Inflation Rate, etc.

Below we can see a snapshot taken from the Forex Factory website. FOMC (Federal Open Market Committee) is a branch of the Federal Reserve Board that releases the Interest Rate data according to the predetermined frequency. On the right, we can see a legend that indicates the level of impact the Fundamental Indicator has on the corresponding currency.

Below, we can see the latest figures for Interest Rate data released by FOMC. We can see that the rate hasn’t changed from the previous release (both Actual and Previous being 1.75%)


Now, let’s see how this news release made an impact on the Forex price charts.

USD/JPY | Before The Announcement - (Jan 29th, 2020 | Just Before 2:00 PM) 

From the above chart, it is clear that before the news releases, the market was in a consolidation state (observe the last few candles.) Most of the Fundamental traders and investors must be waiting for the latest Interest Rate numbers. We have also plotted an MA on the chart to identify the market direction, and we can see the MA also being flat before the news release.

USD/JPY | After The Announcement - (Jan 29th, 2020 | Just After 2:00 PM)

Right after the release, we can observe a Bullish candle, which shows the initial reaction to the Interest Rate. It seemed to be positive for the US dollar, but later the market collapsed. The Interest Rates remained unchanged and were maintained the same as before, which should be positive for the US dollar. Hence, we see that initial reaction.

But why did the market collapse after a few minutes? This is because the market was expecting a rise in the interest rates, but FOMC kept a neutral stance and did not raise the rates. This explains the reason why the market fell after the announcement. The MA, too, does not rise exponentially, which shows the weakness of the buyers.

Since the market moved quite violently, later, the news release could prove to be profitable for the option traders who did not have any directional bias. There will be many traders who would want to take advantage of the market volatility right after the news release. So, even before the news is out, they employ various options strategies and make a profit. This requires a high amount of experience and knowledge of options and is not recommended for beginners. Now, let’s quickly see how this new release has impacted some of the other major Forex currency pairs.

USD/CAD | Before The Announcement - (Jan 29th, 2020 | Just Before 2:00 PM)

USD/CAD | After The Announcement - (Jan 29th, 2020 | Just After 2:00 PM)

From the above charts, it is clear that the USD/CAD pair shows similar characteristics as that of our USD/JPY example. The last few candles before the news release portray a bit of consolidation prior to the news release, followed by a spike during the news announcement and then finally a collapse. One can take short trade in this pair and make a profit on the downside. Make sure to combine this with technical analysis for extra confirmation.

 AUD/USD | Before The Announcement - (Jan 29th, 2020 | Just Before 2:00 PM)

AUD/USD | After The Announcement - (Jan 29th, 2020 | Just After 2:00 PM)

Since the US dollar is on the right side in this pair, ideally, we should see a bullish momentum after the news release. We can see that right after the release, the market prints a spike on the downside and forms a ‘hanging man’ pattern, which could be a sign of trend reversal. It can be clearly observed that the news had a significant impact on this pair as it reversed the trend almost completely.

Bottom Line

All we wanted to say is that the major Fundamental Indicators do have a significant impact on the price charts. At times we can see that these news releases can increase the market volatility significantly and even change the direction of the underlying trend. When we combine these Fundamental Factors with the Technical Analysis, we will be able to predict the market accurately and take trades with at most accuracy. Cheers!

We hope you find this article informative. If you have any questions, let us know in the comments below. Cheers!