Categories
Forex Course

152. Knowing The Fundamental Factors That Affect The Currency Values

Introduction

Many fundamental factors affect currency value. Therefore, whether we trade based on technical analysis fundamental analysis, we should know these factors to understand the currency markets.

Important Fundamental Factors That Affect Currency Values

Fundamental factors are economic releases and events that have a direct impact on currency value. If we want to trade based on fundamental analysis, we should focus on these releases and make a decision based on the result. Let’s have a look at the important fundamental factors that affect currency values

Interest Rate

Interest rate is the amount that a central bank charges if anyone takes loans from the bank. Central banks change the interest rate to control the country’s money supply; therefore, it directly affects the currency value.

Inflation Rate

Inflation is the buying power of money. Lower inflation means higher buying power, and higher inflation, the lower buying power.

Consumer Price Index (CPI)

CPI or CPI inflation is the price of consumer needs. Any increase in CPI is bad for the currency, while a decrease in CPI is good for the currency.

Producer Price Index (PPI)

PPI is the price of products or elements of businesses. An increase in PPI means businesses need additional money to buy raw materials that may increase the finish product rate.

Retail Sales

Retail sales indicate the number of products and services bought by consumers. An increase in retail sales indicates higher consumer activity in the market that is good for the currency value.

Foreign Exchange reserve

Foreign exchange reserve is the amount of money that is reserved in the central bank. An increase in foreign reserves is positive for a country’s economy and currency value.

Non-Farm Payroll (NFP)

On the first Friday of every month, US Labor Statistics releases the number of unemployed persons in the USA. As the US dollar is the most used currency globally, any change in NFP affects the overall forex market.

Central Bank Meets

In every quarter, central banks of every country provide an outlook of the domestic and international economy. In this meeting, any hawkish tone creates a positive impact on the currency value, while any dovish tone creates a negative impact on the currency value. We should keep an eye on how central banks are reacting to the central banks meeting to get an outlook of the currency value.

Conclusion

Besides the above-mentioned fundamental factors, there is a political movement, trade natural disaster, etc. also impacts the currency market. Moreover, in an uncertain market condition, no trading strategy works well, whether based on technical or fundamental analysis. Let’s dig deeper into each of these fundamental factors and more interesting aspects in the upcoming lessons. Cheers.

[wp_quiz id=”86366″]
Categories
Forex Videos

Using CPI Data To Increase Your Win Ratio In Forex

Fundamental Analysis For Novices Consumer Price Index (CPI)

Consumer Price Index (CPI) measures the changes in the price of goods and services
purchased by consumers.
Each month the data is released into the financial market by the various economic and not for profit organizations. In Germany, for example, the information is provided by the Federal Statistical Office, Germany.
So what is the Consumer Price Index, which is also referred to as CPI?


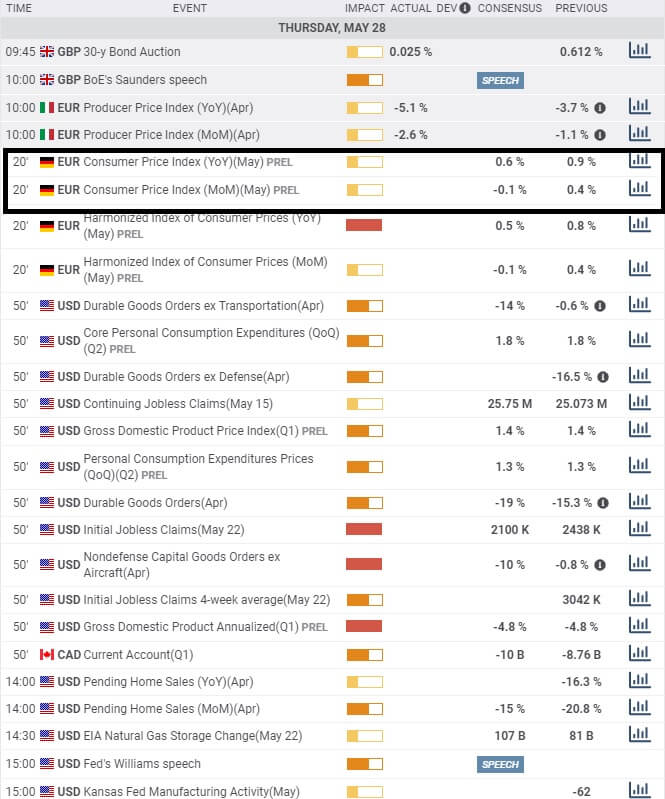
This is what you would expect to see on your calendar. The section highlighted is for the Germany CPI figure. The data is the average price measurement change for all goods and services which were bought by households in any given country, in this case, Germany, for consumption purposes.
CPI is considered to be very important because it is the main indicator to measure inflation and fluctuations in buying trends. The higher the unit measurement reading, the more it is considered positive (or Bullish) for the Euro, and if the unit measurement is a low reading, it is considered negative (or bearish).


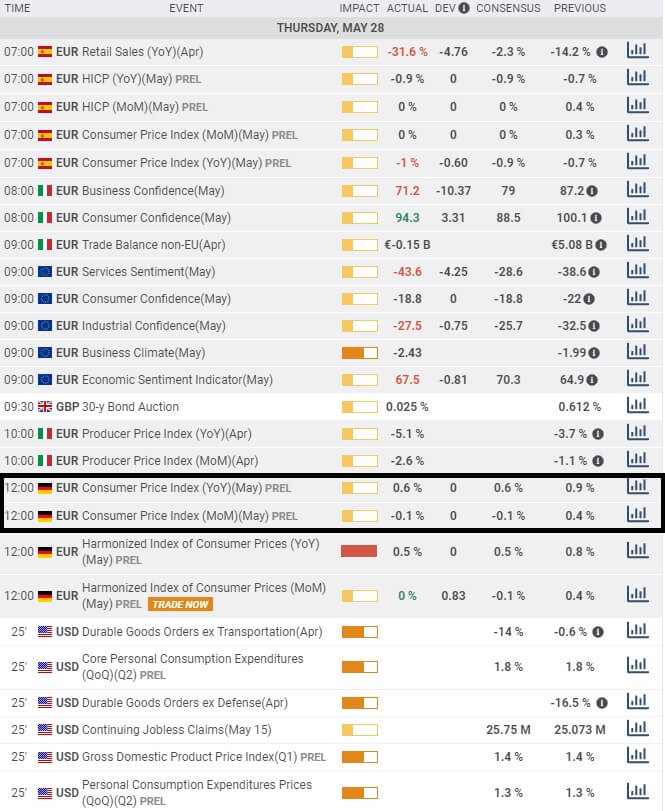
Here we can see that the data has been added after the embargo release.


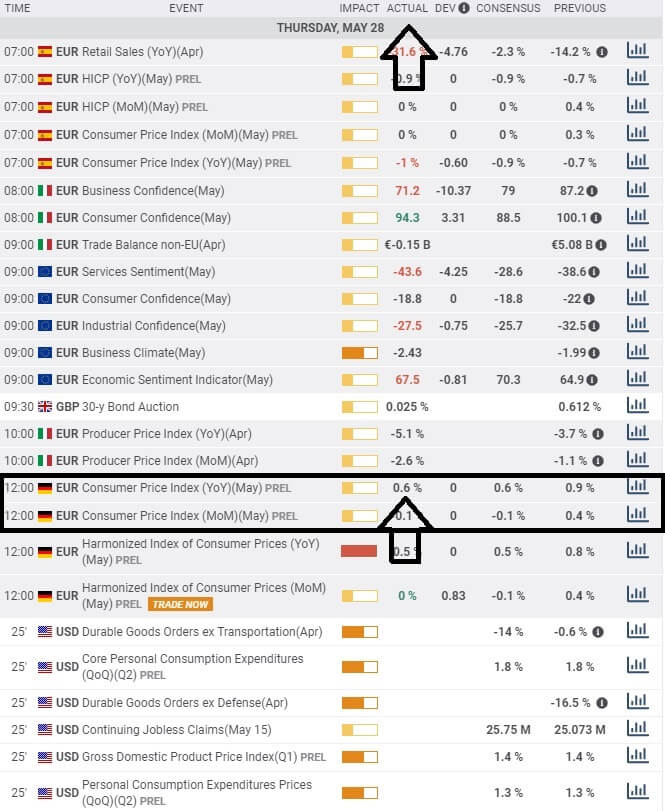
We simply follow the corresponding data to the event log at the top of the page, and we can see the actual released number, in this case, 0.6%, and do the same across the data field to see what the previous release was and also what the market expected. When the released data falls out of line with market expectations, you might find extra volatility kicking in to the Euro currency as traders adjust their trading books accordingly.


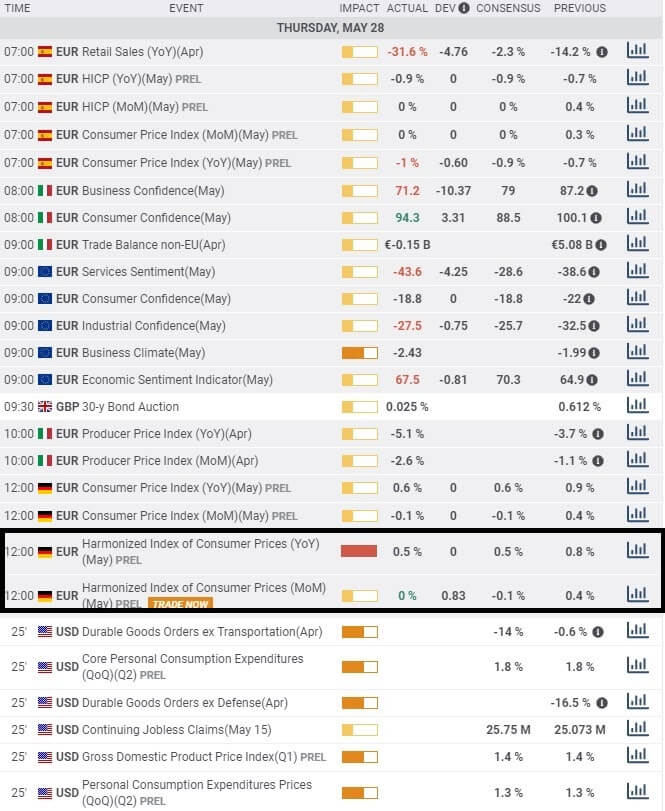
In the case of the Eurozone of which Germany is a member state, the information is also added to the Eurozone CPI in which is called the Harmonized Index for Consumer Price Index, or HICP.

This information is collated by the Statistics Office of the European Union and is released at the same time as one of the member states’ data but after all member states have reported.
The cumulative effect or the HIPC is then used by the governing council of the Eurozone area to define and assess overall price stability as a whole. When trading this data, look for inconsistencies in the consensus and the actual figure. An unexpected lower number would be seen as bad for the Euro while the opposite applies for a higher than expected number.

Categories
Forex Fundamental Analysis

Why ‘Core Consumer Price’ Is Considered A Crucial Macro Economic Indicator?

Introduction

The Core Consumer Prices are a sub-segment of the Consumer Prices, which is used by professionals and economists to get a more accurate picture of the inflation within the country. Understanding of Consumer Price movements can help traders predict inflation rates, industrial trends, identify demand, and supply gaps to invest in a particular section of goods and services. It is a widely used statistic and is one of the critical components in assessing economic expansion or contraction, thereby.

What is Core Consumer Price?

The ”Core “ Consumer Price is the generally called name for the “Consumer Price for All Urban Consumers: All Items Less Food and Energy.” This term comes up in the Consumer Price Index monthly published Reports where this is another variant of the CPI-U and is widely known as the “Core” CPI where CPI stands for Consumer Price Index.

What is the Consumer Price Index?

Consumer Price Index is a survey report which determines the average price of some of the most commonly purchased goods. These goods include toothpaste, grocery, fuel, etc. Instead of using a simple average, each good is assigned a specific weight based on the degree of their importance amongst the people. For instance, milk will have a higher weightage in the mean price calculation compared to the furniture.

Core Consumer Price Index is the same Consumer Price Index for all the commonly consumed goods and services except food and energy items. This distinction has arisen due to the highly volatile nature of food and energy prices.

Why are the food & energy prices volatile in the first place?

Let us talk about food first. In the short run, the supply of food cannot immediately accommodate the increase in demand for food. To meet the increased demand,  it has to result in the planting of more seeds and growing, which take somewhere about a few months to at least a year.

Due to this situation, we say the supply is inelastic to the demand, meaning it cannot stretch immediately to meet the demand. Hence, the demand-supply gap causes price volatility. For example, in India itself last year, the price of onions went up to 150 rupees per kg from its usual 30 rupees per kg. This volatility can also occur due to crop loss at the time of adverse weather conditions or due to some other issues like forest fires etc.

The same goes for energy items like crude oil. Industries or Countries that are heavily dependent on these sources have little choice but to pay higher prices when there is a shortage of supply. Switching from one source of energy to another or alternate forms of power is not a small task, nor is it a viable solution. The primary energy source areas have been historically subjected to political tensions, which have led to significant shocks in oil prices worldwide. Factors like weather conditions also hinder oil production, or unexpected incidents can lead to significant dips in the energy supply levels in the global market.

Below is a historical 70-year plot of Crude oil prices where shaded regions indicate periods of recession.

(Source: MACROTRENDS)

With such a massive rise and drops in prices, it is very easy to overlook the actual inflation or deflation within the economy. As the CPI takes into account the food and energy prices, there can be situations where the food and energy prices skyrocket while other items have observed deflationary trends in their prices to a scale that the volatility masks the deflationary trend or vice versa is also true.

To avoid this inaccuracy in CPI, the Core CPI comes into the picture, which is a more accurate inflationary measure than the CPI-U.

Economic Reports

The Bureau of Labor Statistics generally conducts a survey of 80,000 consumer item prices to create the Index and publishes it monthly.

BLS data collectors visit in person, or virtually through the internet, or call thousands of retail stores, service establishments, rental units, and doctors all over the United States. They do this to generate info on the prices of items and then measure price changes in the CPI.

How can the Core Consumer Prices be Used for Analysis?

The index data set goes as way back; for example, Core CPI goes as far back as 1957. With such a large data set, the reliability of the data set is high, and it usually depicts the macroeconomic picture of a country with reasonable confidence.

CPI changes are useful to ascertain the retail-price modifications associated with the Cost of Living. Hence it is widely used to determine inflation in the United States.

Many payment agreements are directly tied to CPI; it can affect the incomes of 80 million people. Social Security benefits, various pension payments are all indexed by CPI. Hence, CORE CPI is essential to understand current monetary conditions and can also be used to assess how the governments and policymakers will act to these changes.

Impact on Currency

In general, CPI is associated as a proportional indicator meaning higher CPI signals currency appreciation for traders and vice versa.

Below is a snapshot of CORE CPI plotted against GDP for the last 15 years, and we see this macroeconomic indicator’s importance in fundamental analysis:

Sources of Consumer Price Index

The U.S. Bureau of Labor Statistics releases all the indexes as mentioned here –

Consumer Price Index and Core CPI

CPIAUCSL: CPI for Urban Consumers: All Items in U.S. City Average: Broadly uses the statistic for a measure of overall inflation in prices. It includes Food and Energy prices, unlike CPIFESL. This info can be found here.

CPIFESL: Consumer Price Index for All Urban Consumers: All Items Less Food and Energy in U.S. City Average: It excludes volatile components like Food and Energy (Oil Prices) and gives more of a Core CPI change within the United States. This info can be found here & here.

Impact of the ‘Core Consumer Prices’ news release on the price charts

The Core CPI is not only an important indicator of inflation but that of the overall economy, thus it is sure to impact the value of the currency. In this section of the article, we will be discussing that impact and look to trade the news announcement. As we can see in the below image, core CPI is said to highly impact the currency when the numbers are being announced. The data released on a monthly and yearly basis, but today we will be analyzing the month-on-month core CPI data of the United States.

The below image shows the latest Core CPI data for the month of February, along with the forecasted and previous numbers. A higher than expected reading is considered to be bullish for the currency while a lower than expected reading is believed to be bearish. The latest figures show that the Core CPI numbers were unchanged from before, which was exactly predicted by economists. The CPI numbers are published by the U.S. Bureau of Labor Statistics, the official agency that carries out surveys and collections. Now let us analyze the impact it created on the U.S. dollar.

EUR/USD | Before The Announcement

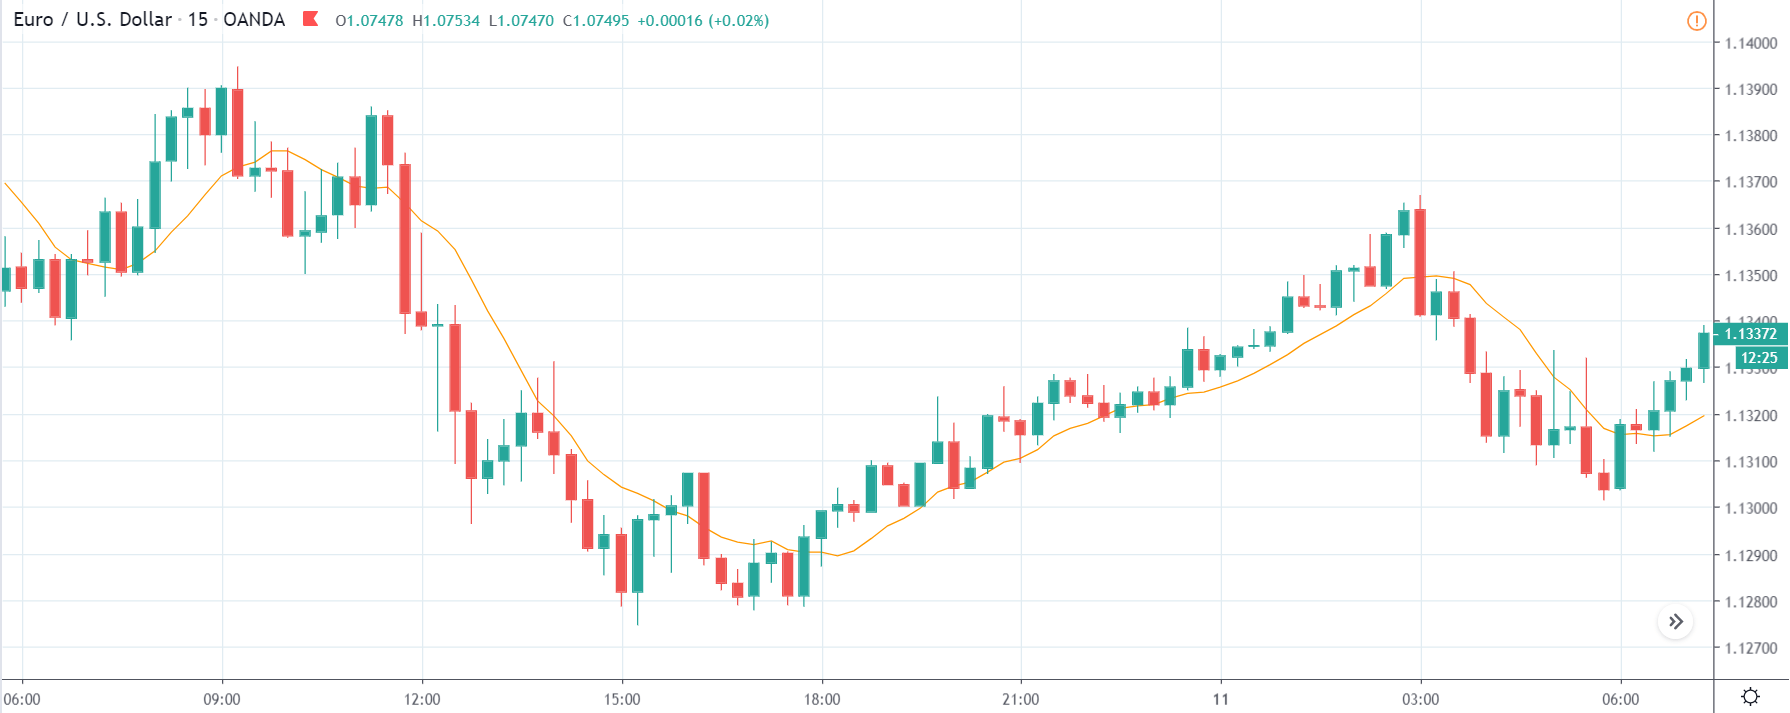
We start with the most liquid forex pair in the world, which is the EUR/USD pair. Looking at the from a technical perspective, before the news announcement, we see a market reversal retracement on the downside with a retracement to the nearest ‘higher high’. One can assume that the market has factored in the Core CPI data as it is expected to remain the same as before. Hence, one should not expect a great amount of volatility during the announcement. Technically, we can take a ‘short’ trade in the above pair, but without having a lot of assumptions, it is advised to keep a wide stop loss to protect ourselves from spikes.

EUR/USD | After The Announcement

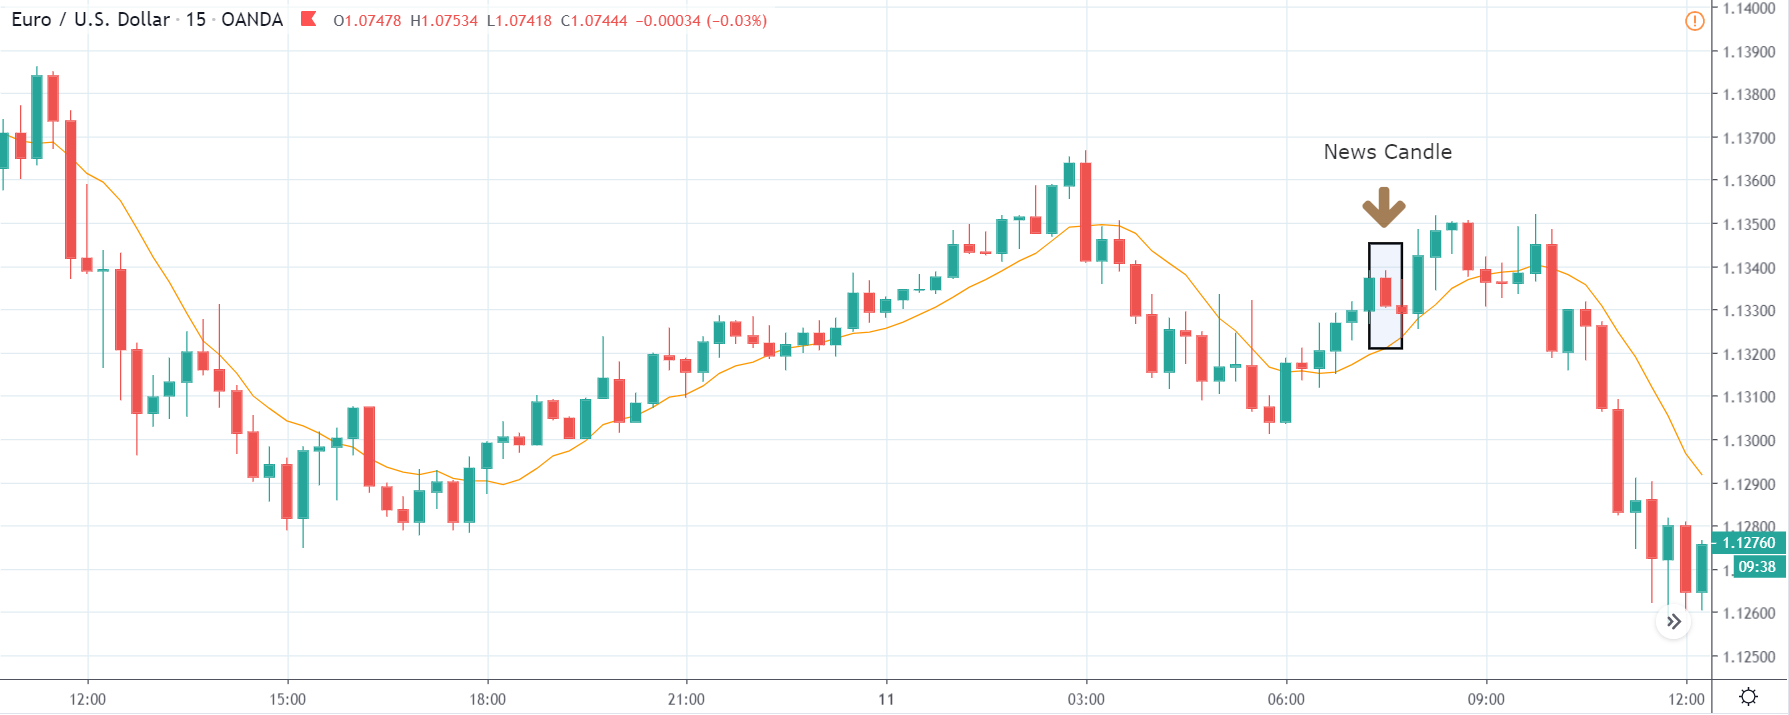
The Core CPI numbers are announced, and since it was on expected lines, the price falls a little, showing some bullishness for the U.S. dollar. As there was minimal volatility, we can confidently take a ‘short’ trade with a stop loss above the recent ‘higher high.’ The ‘take profit’ for this trade should be near the recent ‘low’ or ‘support’ area. We shouldn’t forget that earlier, it was said that it is a high impactful event, but due to subdued expectations, it did not induce high volatility.

USD/CAD | Before The Announcement

USD/CAD | After The Announcement

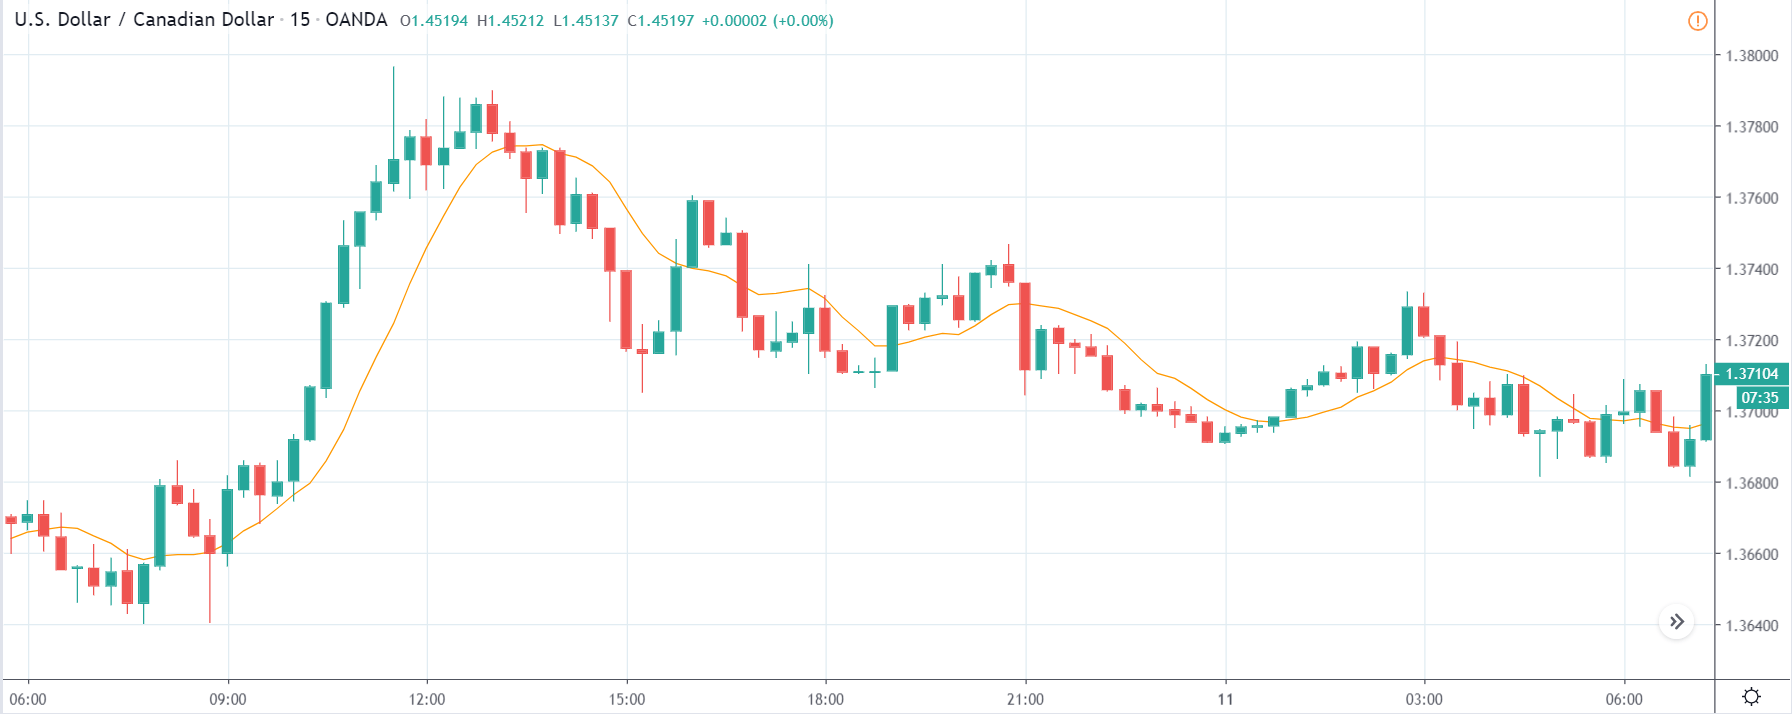
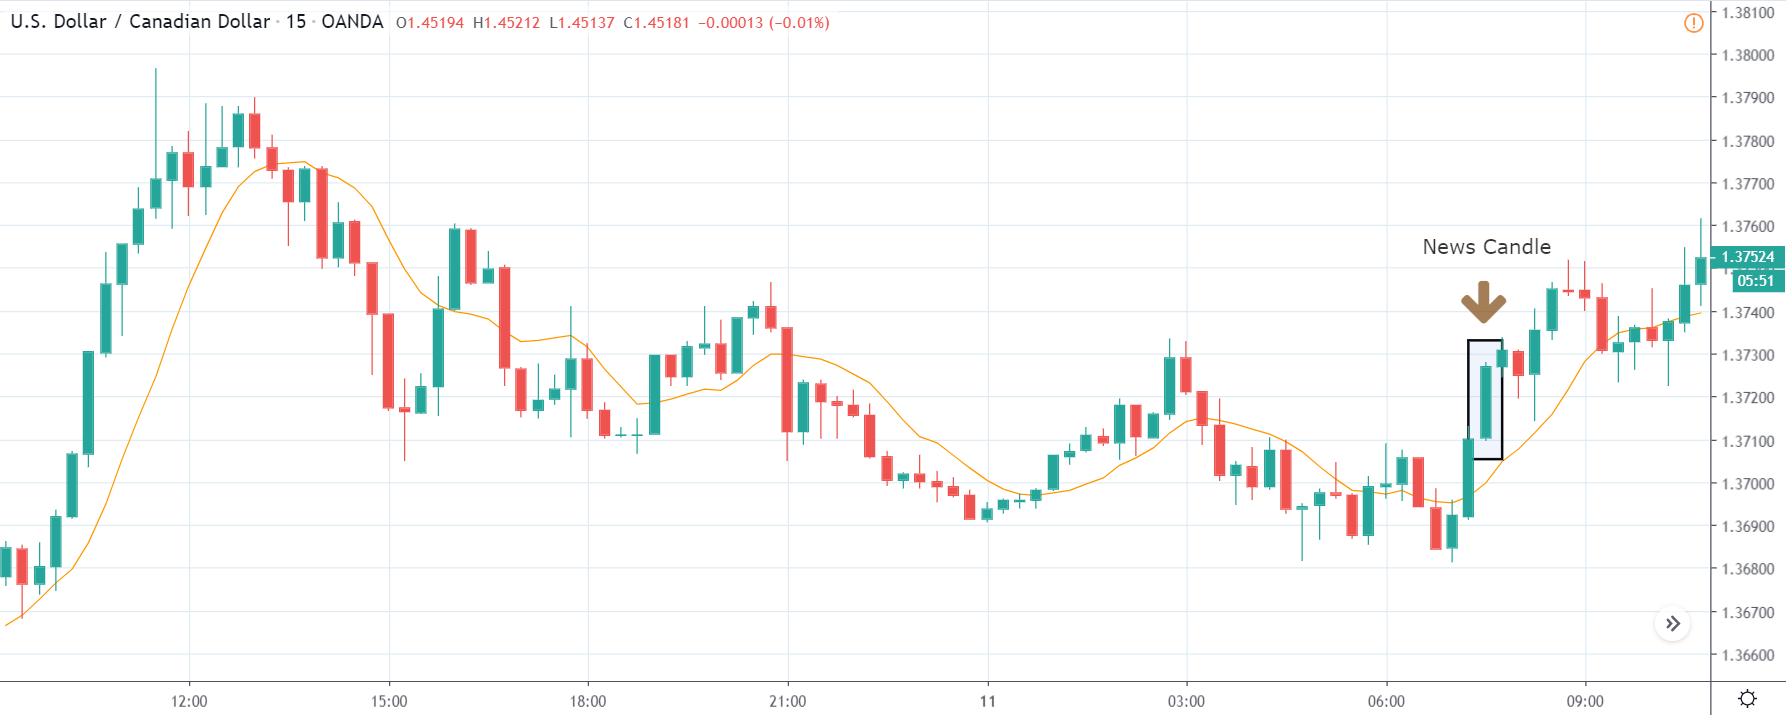
The above images represent the USD/CAD currency pair where it looks like, before the news announcement, the market is in a pullback mode, and this is the perfect scenario for going ‘long’ in the market. As the impact of Core CPI is high, it could turn the market either way; hence it is safer to wait for the news release and then a suitable position in the market.

After the news announcement is made, we see that the volatility expands on the upside, which takes the currency higher. This could essentially be the confirmation sign for trend continuation, and we can now enter for a ‘buy’ with a stop loss below the recent ‘low.’ Since there was no reduction in Core CPI numbers, it resulted in being positive for the U.S. dollar, and thus we see a bullish candle after the news release.

NZD/USD | Before The Announcement


NZD/USD | After The Announcement

Here, in NZD/USD currency pair, before the news announcement, we see an uptrend, and since the U.S. dollar is on the right-hand side, it shows the excessive weakness of the same. The behavior of this chart is different from that of the above-discussed pairs due to the strength in the New Zealand dollar.

Therefore, only a significant increase in the Core CPI can result in a reversal of the trend else we can witness volatility on both sides. Since the news announcement was mildly positive for the U.S. economy, the price drops but not enough. Hence, we can conclude that the news release did not cause much volatility in the pair, and the current trend is still intact.

That’s about ‘Core Consumer Prices’ and its impact on the Forex price charts after its news release. If you have any questions, please let us know in the comments below. Good luck!

Categories
Forex Fundamental Analysis

‘Producer Price Index’ & The Degree Of Its Impact On The Forex Charts

Introduction

Producer Price Index PPI, which sounds very similar to the Consumer Price Index CPI is also an equally important indicator. It is widely used as a leading indicator to predict the upcoming CPI and thereby draw economic conclusions accordingly ahead of time. Hence, understanding the Producer Price Index, its history, and the resultant effect it has on the market is significant for traders who trade on Fundamental Analysis.

What is the Producer Price Index?

As the name suggests, the calculation of this index is from the viewpoint of the Producer, i.e., a manufacturer or maker of goods and services. Producer Price Index, in the simplest sense, measures the average of the selling prices of the goods and services at the manufacturing end place. In other words, it is the average of the prices at which the manufacturer sells his products and services to the retailers, who then take it to the local markets and make it available to the general public.

Understanding the difference between what Producer Price Index and Consumer Price Index represent is the key here. Consumer Price Index CPI represents the cost at which goods and services are made available to the general public. Hence, CPI is the measure of average weighed in COST PRICE of finished goods while the Producer Price Index represents the weighted average of SELLING PRICE of the manufactured goods. CPI represents what the end consumer or customer pays, and PPI represents what the manufacturer receives for his commodities.

An item when manufactured and sold from the place where it got manufactured incurs certain costs before it reaches the end consumer. These costs include transportation fees, some specific goods & service taxes, storage costs, etc. Hence, Producer Price is a more rudimentary or cruder form of CPI, and there is an inherent correlation between both. For this reason, PPI is considered an advanced signaling tool to assess CPI and make informed economic decisions by various groups.

How is the Producer Price Index PPI calculated?

The Bureau of Labor Statistics (BLS) surveys almost all industries in the goods manufacturing section and a majority of service sectors. This organization continues to include more and more divisions as time progresses. Producer Price Index of BLS is calculated by first collecting data from all the listed industries by field economists. These people collect data through various means like an onsite visit, phone calls, or even emails, etc.

The producer Price Index uses an altered version of the Laspeyres index. For any given set of goods, it compares the base period revenue to the current period revenue.

Producer Price Index =  (∑QoPo(Pi/Po)) / (∑QoPo)  ×100
  • Qo: Commodity Quantity shipped in the base period
  • Po: Commodity Price in the base period
  • Pi: Commodity Price in the current period

The above equation tells clearly that based on size & importance, items are weighted. The base price corresponds to 100 for which the base year corresponds to 1982. The PPI is published as a percentage increase or decrease with regards to the previously released number, which may be monthly, quarterly, and annually.

Why is the Producer Price Index important?

CPI measures consumer inflation, and PPI measures business inflation. The significance of the Producer Price Index is many-fold. First are the range and history of the data. The index data set goes way back in time. For example, PPIFGS (Producer Price Index by Commodity for Finished Goods) goes as far back as 1947. With such huge data, the reliability of the data set is high, and it usually depicts the macroeconomic picture of country and industrial health with good confidence.

Also, The PPI program is the oldest continuous series of the Federal Government going back to 1902. Second is the frequency & direct ground-level nature of the statistic meaning this data is a real-time reflection of the current industrial health. Thirdly, PPI is very closely related to CPI in the sense that it is an index of the same goods at an earlier stage of the life cycle.

While CPI shows the stats for a product at the near-end of its transaction life cycle in terms of changing hands, PPI shows the stats at the first transaction life cycle, which is very helpful. In this Index, there are many subcategories, wherein certain goods and services get included or excluded from the basket to give a more accurate picture of the concerning market in absolute or relative terms. For example, PPILFE Producer Price Index Excluding Food & Energy (Core PPI) strips away food, gas, and oil prices from the equation whose prices are volatile and measures the absolute changes.

How can the Producer Price Index be Used for Analysis?

The range of PPI is such that there is something for everyone here. Narrowing down into the PPI, any industry can be analyzed. Broadly there are three most popular classifications:

Industry classification: Here, groupings of commodities are done based on the industry sector they represent. The PPI releases about 535 indexes with more than four thousand specific product lines and product category sub-indexes.

Commodity classification: Here, the grouping of items is done based on the similarity of goods and services in terms of their making.

Commodity-based Final Demand-Intermediate Demand (FD-ID): Here, Based on the consumer group, the commodities are classified and are one of the most used PPI stats.

Due to the diversity in the statistics, different sectors of economists can isolate and use the Producer Price Index for their purposes.

Producer Price Index is a widely used indicator for predicting Consumer Price Index. Manufacturers and Industrialists also use these PPI to adjust pricing on the goods and services they buy and sell to fellow manufacturers to avoid having fixed pricing or unfair price changes during the duration of their business contract, which usually tends to be very long periods.

Sources of Producer Price Index

The U.S. Bureau of Labor Statistics releases all the indexes as mentioned above here

You can also find out the same indexes along with many others with a comprehensive summary and statistics of various categories on the St. Louis Fed website.

Impact of PPI’s news release on the Forex market 

After understanding the definition and significance of the Producer Price Index (PPI) in an economy, we shall look at its importance on price charts. For analysis purposes, we have taken the PPI data of Japan, where the survey responses from large Japanese manufactures provide the data for the report. Even though the PPI is a key indicator of the manufacturing sector of the economy, currency traders do not consider it to be the most important indicator of the overall economy. The below image The Business Manufacturing Index (BSI), along with PPI, measures the business sentiment in manufacturing.

The PPI data is released by ‘Bank of Japan’ that measures the change in selling prices of goods purchased by Japanese Corporations. A higher than expected PPI is considered to be positive for the currency and vice versa. The PPI data is released on a monthly, quarterly, and yearly basis, but the highest importance is given to the year-on-year data. The below image shows the latest year-on-year PPI data of Japan that was released in the month of March. As we can see, there is so much variation in the data from ‘previous’ to ‘forecasted to the ‘actual.’ This means, there are many other factors that influence the manufacturing industry that it is difficult to measure for the economists.

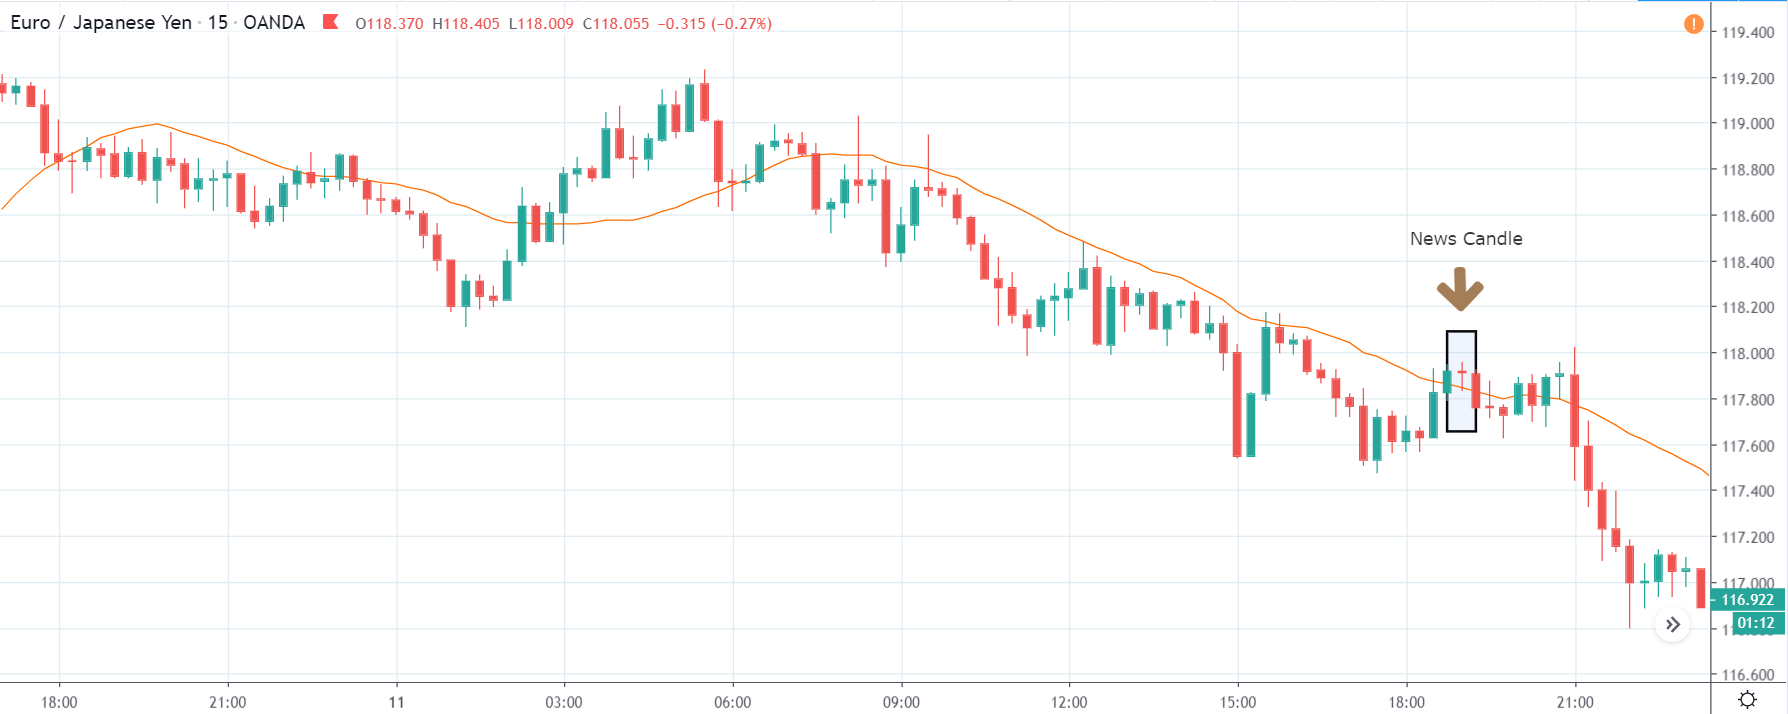
EUR/JPY | Before The Announcement

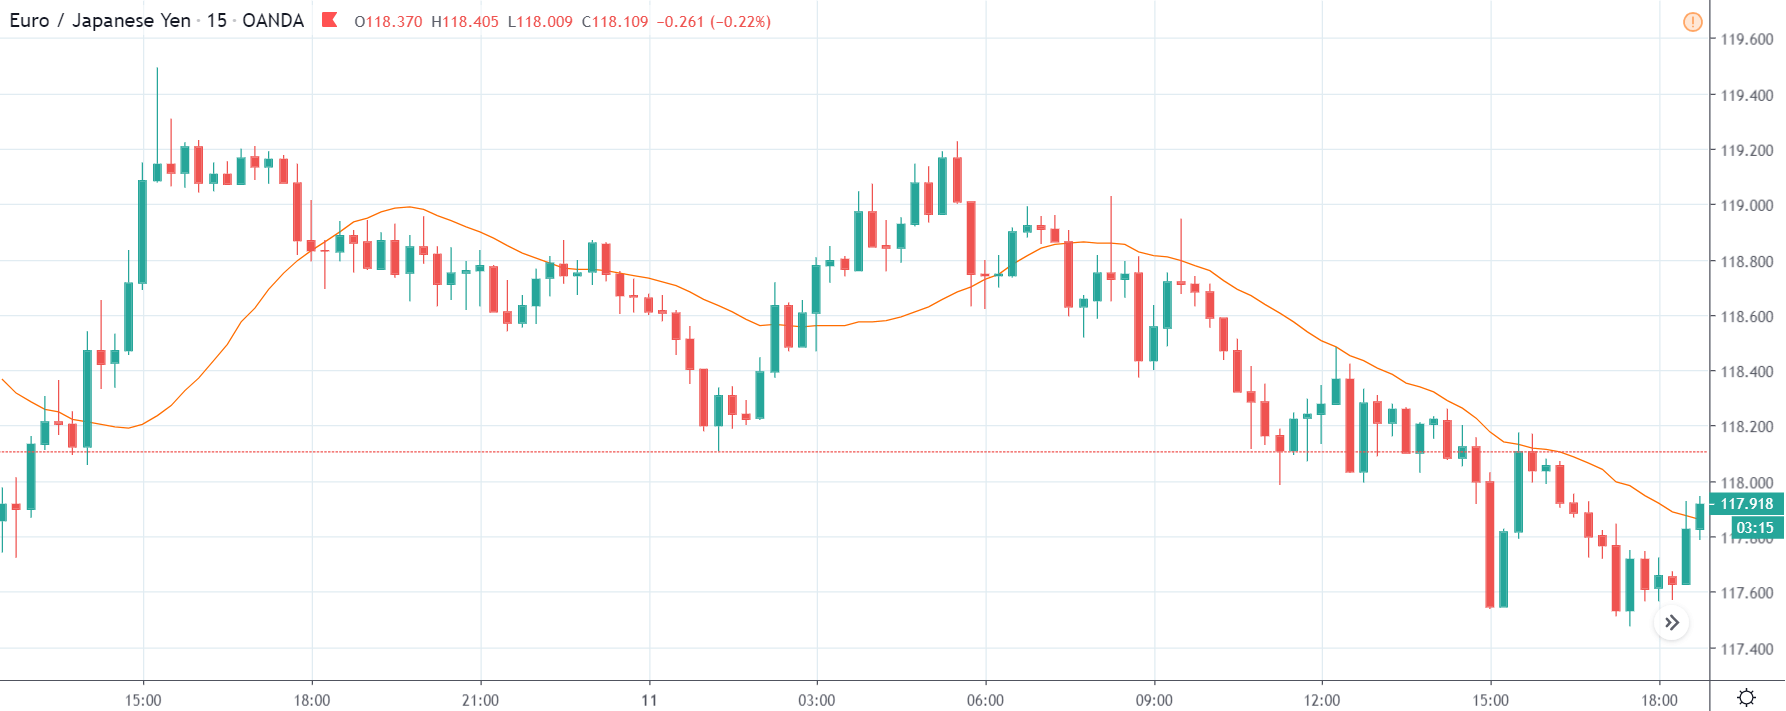
The above chart is that of EUR/JPY, and since the Japanese Yen is on the right-hand side, a down-trending market indicates the strength of the Japanese Yen. The reason behind this downtrend before the news release is because of the bullish expectation of the PPI data from market players. Traders have already forecasted the PPI to be around 1%, which 0.5% lower than the previous reading. Since it is lower, we should expect weakness in the Japanese Yen, but 1% seems to be a good PPI figure for the Japanese economy, hence the downtrend. We need to remember that a higher PPI data is not compulsory to take the currency higher, but rather sometimes the data alone plays importance.

EUR/JPY | After The Announcement

After the PPI numbers are announced, the price barely goes above the moving average line, and there is not much change in the volatility. As the PPI is not an impactful event, the volatility is as expected. A reduction in PPI is bad for the currency, but even though the PPI was reduced, the Japanese yen did not get weak. Therefore, we should just not be paying attention to the news but also use technical analysis to take trades. In this example, we can go long in the market only if we get ‘reversal’ signs, but we don’t see any such patterns. Thus, we should be looking for trend continuation patterns and join the downtrend.

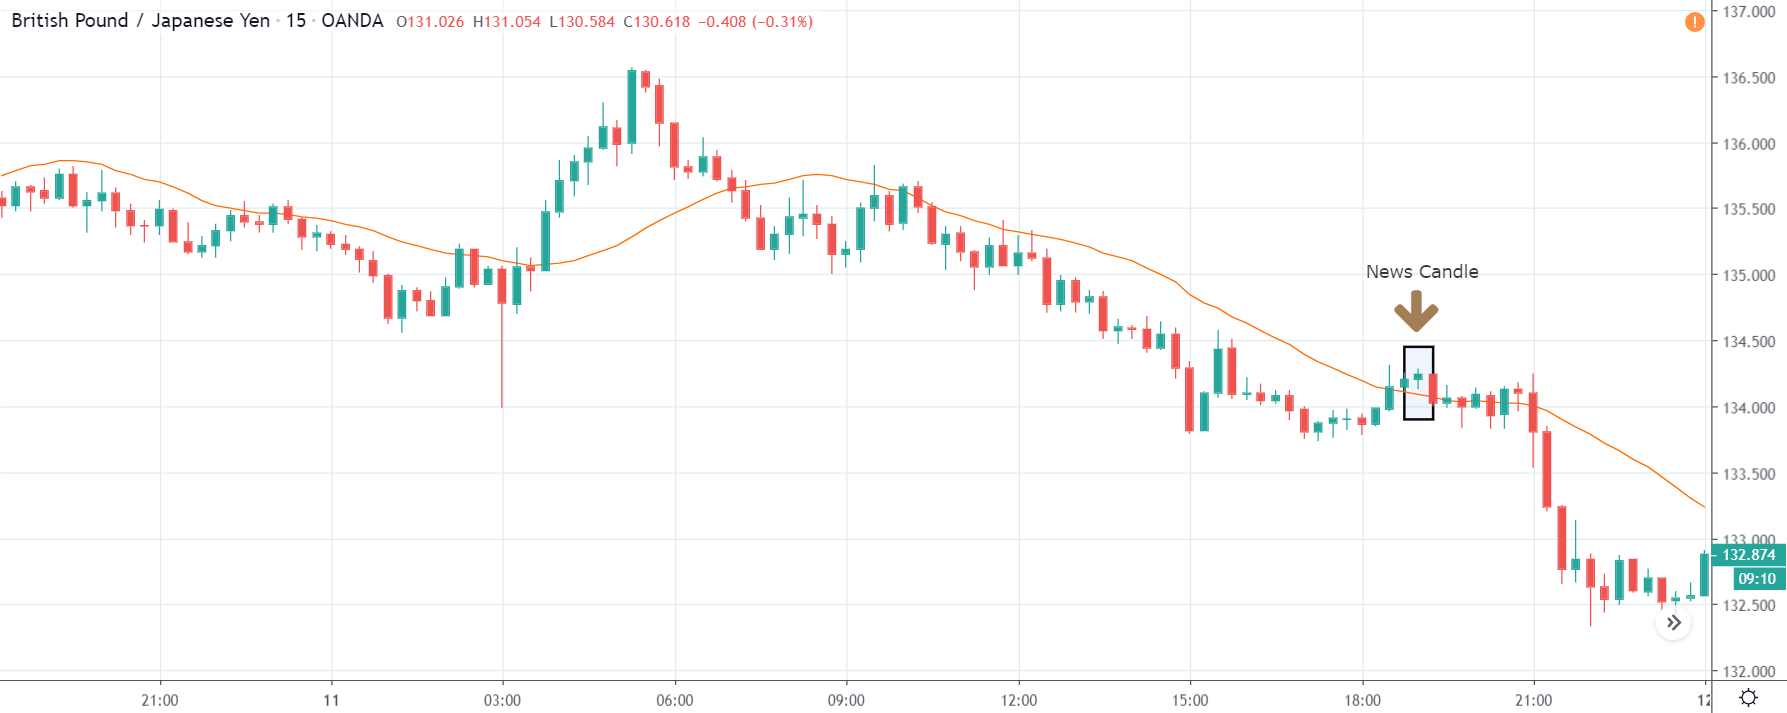
GBP/JPY | Before The Announcement


GBP/JPY | After The Announcement

The above image represents the GBP/JPY currency pair, which shows similar characteristics as that of EUR/JPY, where the downtrend is much stronger than the latter. Since the downtrend is prominent, only a much worse PPI than before can take the currency higher. Even if the PPI was very low, the uptrend would not last as it is not an important measurement of the economy. After the news announcement, there is hardly any effect on the currency pair, and the volatility is in the same range. The PPI data was almost the same as that was forecasted by traders, and we can say that it was as per the market expectations. This made the Japanese Yen to strengthen more and downtrend extended on the downside after a bit of consolidation. Once the market slips below the moving average, a ‘short’ trade can be taken with a stop loss above the ‘news candle.’

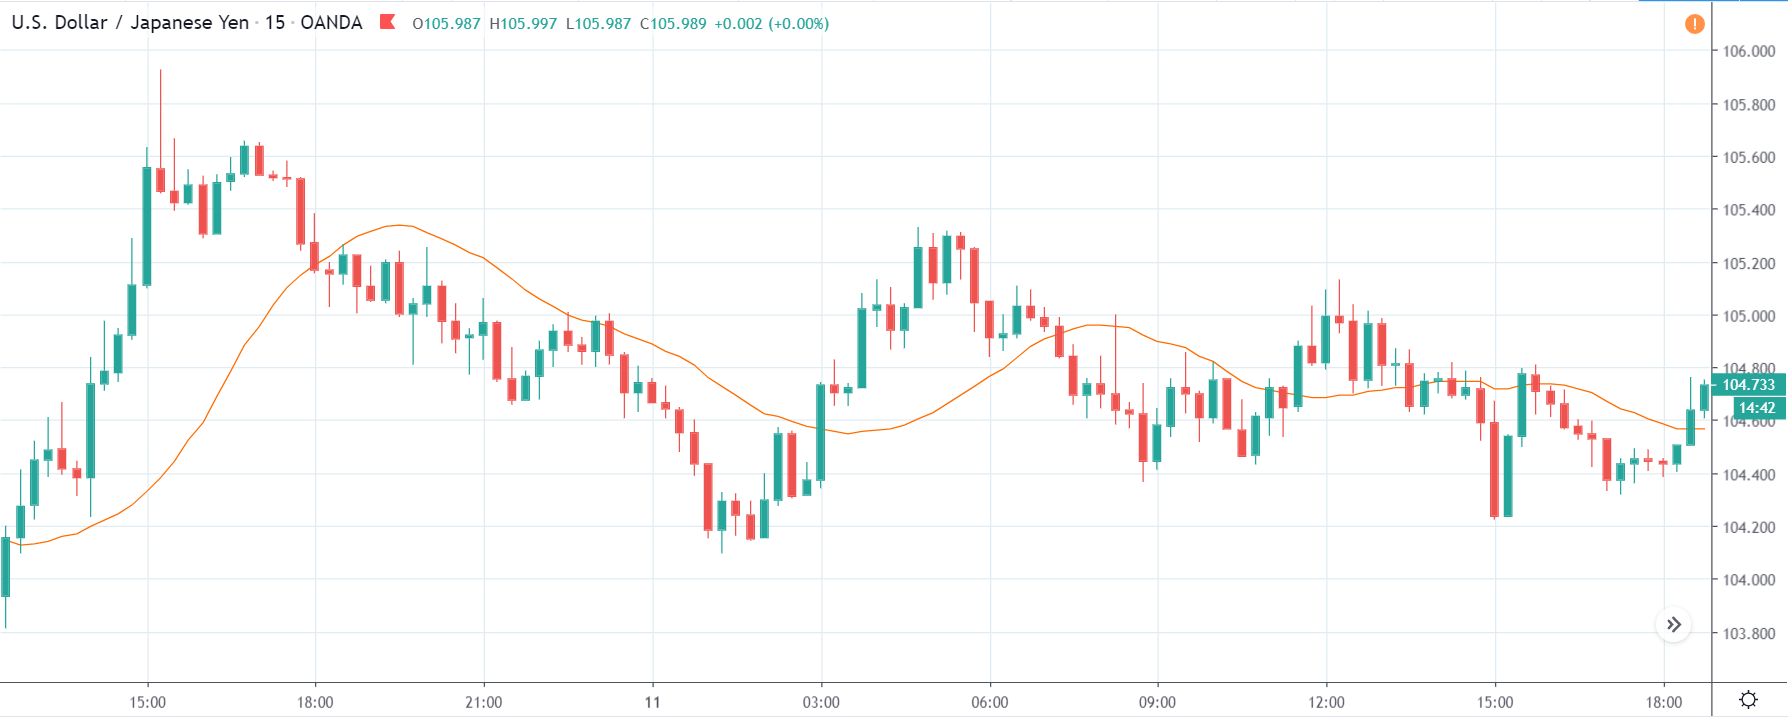
USD/JPY | Before The Announcement


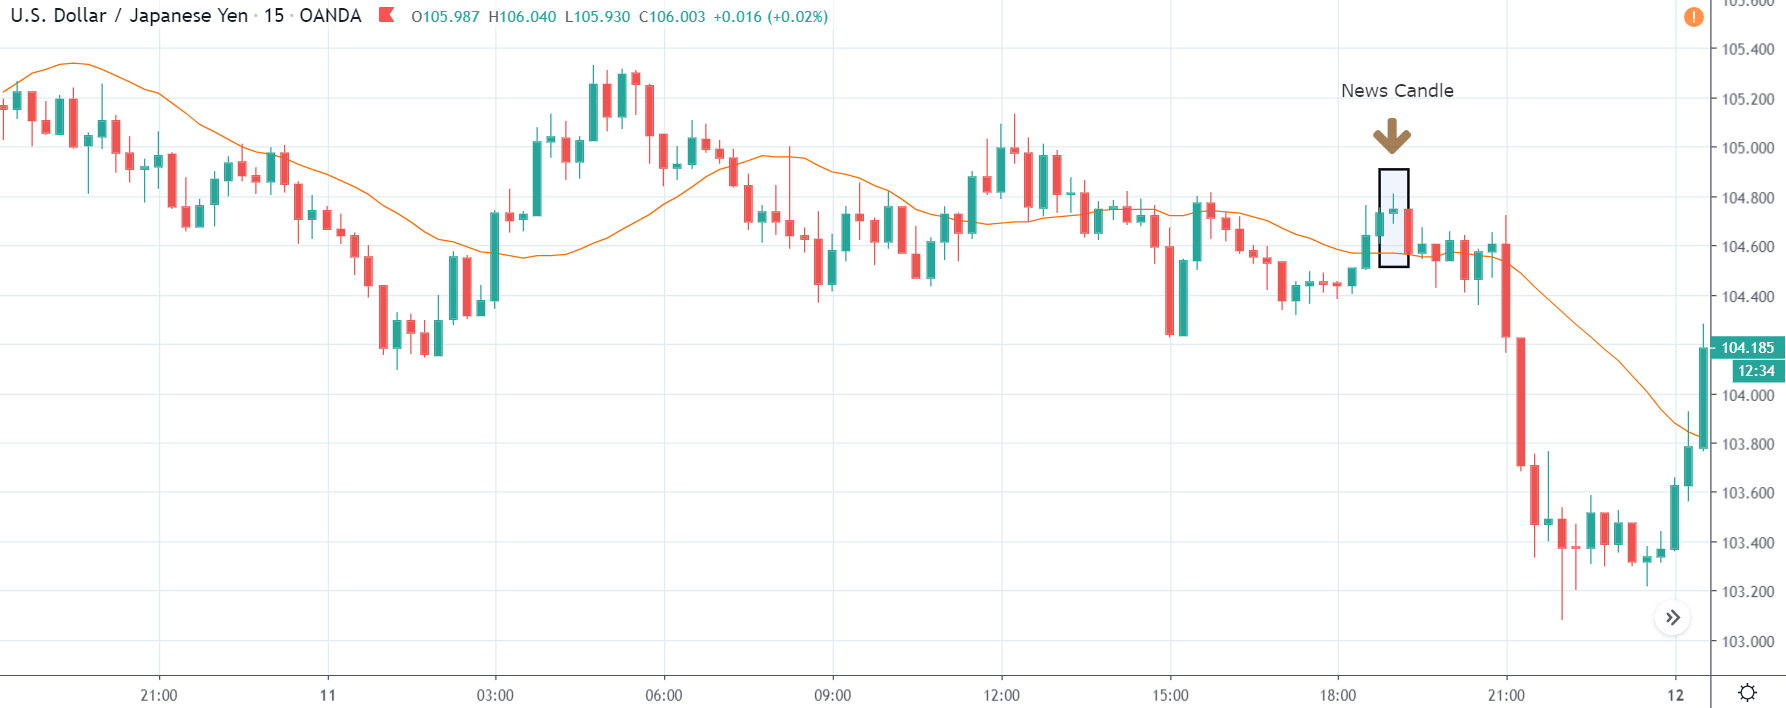
USD/JPY | After The Announcement

This is the USD/JPY currency pair, where the chart characteristics are a little different than the above two charts. Here we don’t really witness a downtrend but rather a ranging nature of the market. Since we are near the resistance area, any positive news release should be taken as an opportunity to ‘short’ in this pair. This is the way we should combine fundamentals with technical analysis. After the news is released, we don’t see any change in the volatility, and the ‘news candle’ leaves a wick on the top. The PPI data was again positive for the Japanese Yen, where the price crashed right after the ‘news candle.’

That’s about PPI and how the Forex price charts get affected during the news release of this fundamental indicator. Let us know if you have any questions in the comments below. Cheers!

Categories
Forex Fundamental Analysis

The Momentous ‘Consumer Price Index’ & How It Impacts The Forex Market

Introduction

Consumer Price Index, in short, known as CPI, is one of the most closely watched Fundamental Indicators. It is the most direct measure of the current inflation in the economy that a citizen can look at and find out. Hence, Understanding the Consumer Price Index, its history, and the resultant effect it has on the market is very important to build an understanding of the macroeconomics of a nation.

What is the Consumer Price Index?

As the name suggests, the calculation of this index is from the viewpoint of the end consumer, i.e., a regular citizen who buys his/her daily needs from a local grocery store or market. Consumer Price Index, in the simplest sense, is the average of the most commonly purchased household goods and services like toothpaste, milk, grocery, petrol, etc. But instead of a simple average here, each good and service is assigned a certain weightage based on their importance or usage degree amongst the population.

For example, milk, which is a daily need for many consumers, will have a higher weightage in the mean price calculation than that of furniture, which we do not purchase daily or frequently. Also, when we say most commonly purchased goods and services, it covers a wide range of goods and services (over 80,000 items) and does not include rarely purchased items like stocks, bonds, foreign investments, or real estate.

How is the Consumer Price Index CPI calculated?

The Bureau of Labor Statistics (BLS) surveys the prices of 80,000 consumer items to create the index and publishes it monthly. The Consumer Price Index has two subcategories; one is CPI-W, which stands for Consumer Price Index for Urban Wage Earners and Clerical Workers. CPI-W statistics are published first, and later the CPI-U (Consumer Price Index for Urban Consumers) values are released. CPI-U is a broader statistic in terms of population and goods & services coverage.

CPI-U is the more accurate and complete statistic relatively as it takes the urban population, which represents about 93% of the United States population into account. While the CPI-W covers only about 29% of the population. Hence, It is the measure of an aggregate weighed in the price level of most commonly bought goods and services. The list includes items like food, clothing, shelter, fuel, transportation fares, service fees (water and sewer service), etc.

Consumer Price Index, whenever released, is given out as a percentage change, and here the change is concerning the previous number, which can be monthly, quarterly, or yearly.

Note: Here, the base year cost amounts to 100, and this base year is in the year 1982 to 1984, where the average amounted to 100. But the data released monthly is shown as a percentage increase or decrease concerning the previous period (usually the previous month).

Why is the Consumer Price Index important?

The importance of the Consumer Price Index is many-fold. First are the range and history of the data. With such a huge data set, the reliability is pretty high, and it usually depicts the macroeconomic picture of a country. For example, the history of CPIAUCSL (Consumer Price Index for All Urban Consumers: All Items in U.S. City Average) goes all the way back to 1947. Second is the frequency & direct ground-level nature of the statistic meaning this data brings out. CPI is a real-time reflection of the current economic situation faced by the end customer or citizens.

Thirdly, the change in CPI is useful to ascertain the retail-price changes associated with the country’s cost of living. Hence it is used widely to assess inflation in the United States. In this Index, there are many subcategories, wherein certain goods and services get included or excluded from the basket to give a more accurate picture of inflation in absolute or relative terms. For example, Core CPI strips away food, gas, and oil prices from the equation as the prices of these items are relatively volatile.

How can the Consumer Price Index be Used for Analysis?

Due to the diversity in the statistics, different sectors of economists can isolate and use the Consumer Price Index for their purpose. For example, the United States Bureau Of Labor Statistics provides indexes based on various geographic areas also. Moreover, they even release average price data for select utility, automotive fuel, and food items, which gives this Index the status of a key indicator in gauging multiple economic indicators.

Consumer Price Index is a widely used indicator for inflation measure. For other economic indicators like hourly wages and currency worth within the nation (dollar’s purchasing capacity to procure goods and services), CPI can be considered as a regulator. On average, for a developed nation like the United States, 0.2-0.5% of Consumer Price Index increase is common, and any number beyond these figures usually indicates volatility in the growth of the economy in either direction.

Sources of Consumer Price Index

The U.S. Bureau of Labor Statistics releases all the indexes that are mentioned above. This data can be found here – Consumer Price Index

You can also find the same indexes along with many others with a comprehensive summary and statistics on the St. Louis Fed website as given below.

CPIAUCSL (CPI for All Urban Consumers: All items in U.S. City Average)

This is a broadly used statistic for measuring the overall inflation. It includes Food and Energy prices, unlike CPIFESL. The information related to this index can be found here.

CPIFESL (CPI for All Urban Consumers: All items minus the Food and Energy in U.S. City)

It excludes volatile components like Food and Energy (Oil Prices) and gives more of a Core CPI change within the United States. The information related to this index can be found here.

Impact due to news release

In this section of the article, we will analyze the impact of the Consumer Price Index (CPI) on a currency right when the announcement is being made and see where the market finally gets to. The image below shows that the CPI data has a huge impact (Red box indicates high impact) on the currency, which means it might cause a drastic change in the volatility after the news announcement. Ideally, if the actual CPI numbers are greater than the forecasted numbers, it is good for the currency and vice versa.

We have taken the recent CPI data of Australia, which is quarter-on-quarter. The quarterly data is more important and impactful than the monthly numbers. The below image gives the 4th quarter data of CPI that was measured in January, and the next quarter data will be released in April. We see below that the CPI data for the 4th quarter was 0.7%, which is 0.2% greater than the previous reading. It is also 0.1% greater than the forecasted number. But, let us see how the market reacted to the data.


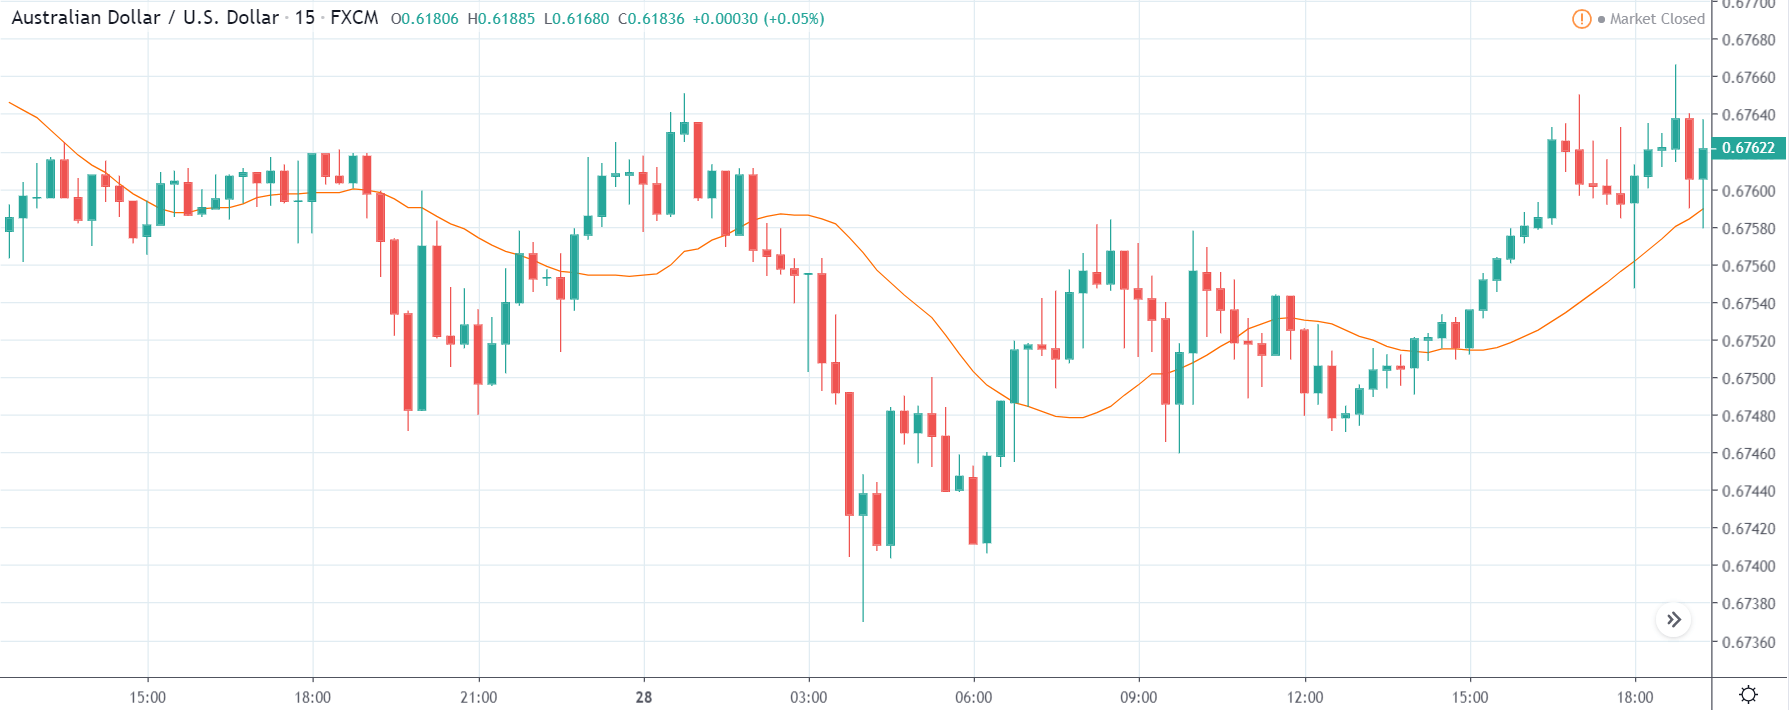
AUD/USD | Before The Announcement

The above image represents the chart of AUD/USD, where we see that the market is in an uptrend showing the strength of the Australian dollar. One of the reasons behind the uptrend is that traders and investors forecast the CPI data where they are expecting a 0.1% increase in the same. If the CPI numbers are increased more than expected by the ‘Australian Bureau of Statistics,’ it could be the best-case scenario for going ‘long’ in the market. However, if the numbers are below expectations, volatility could increase on the downside.        

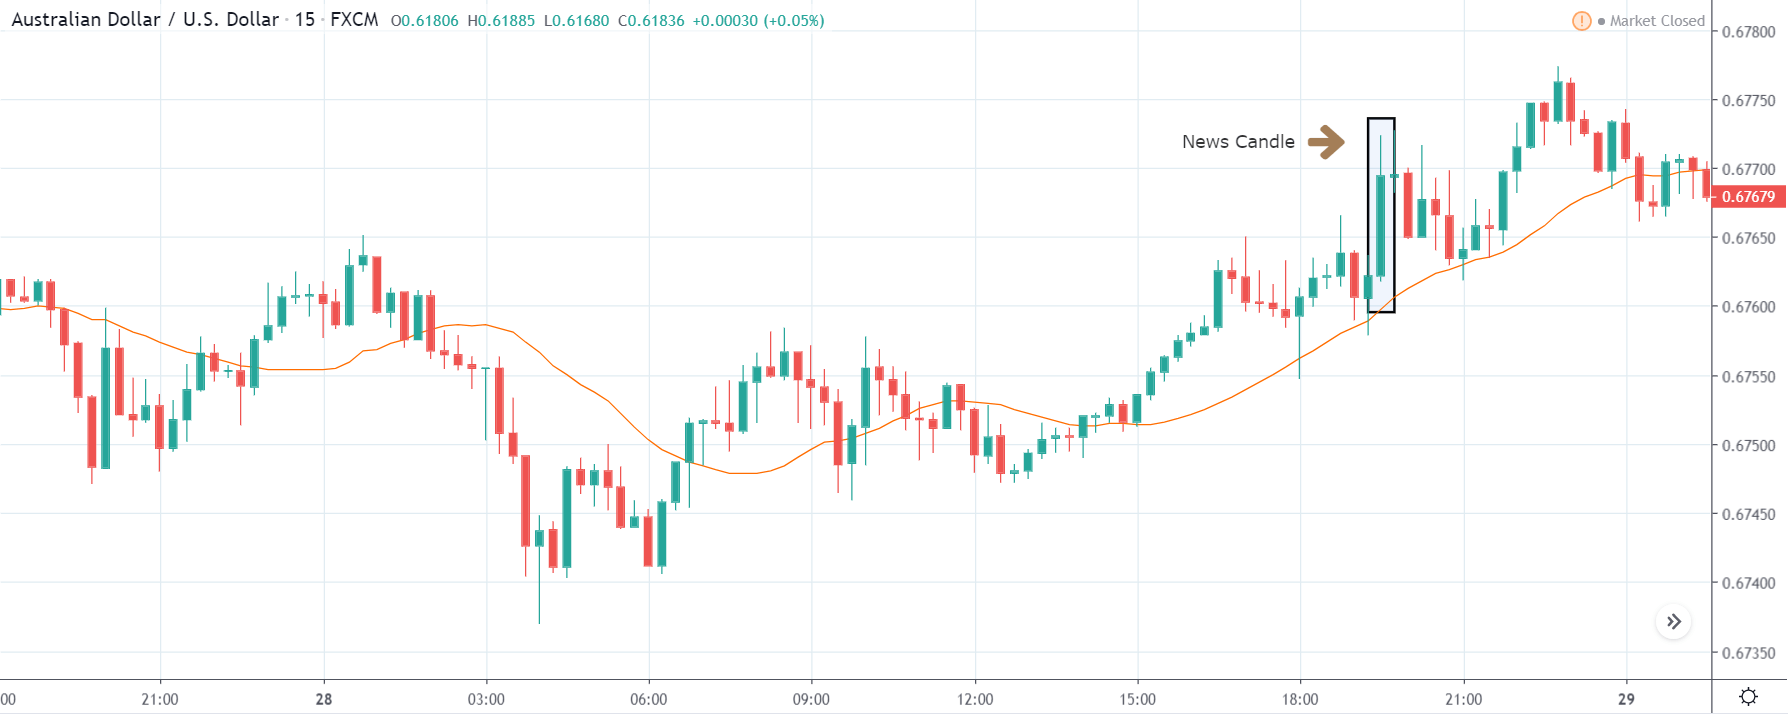
AUD/USD | After The Announcement

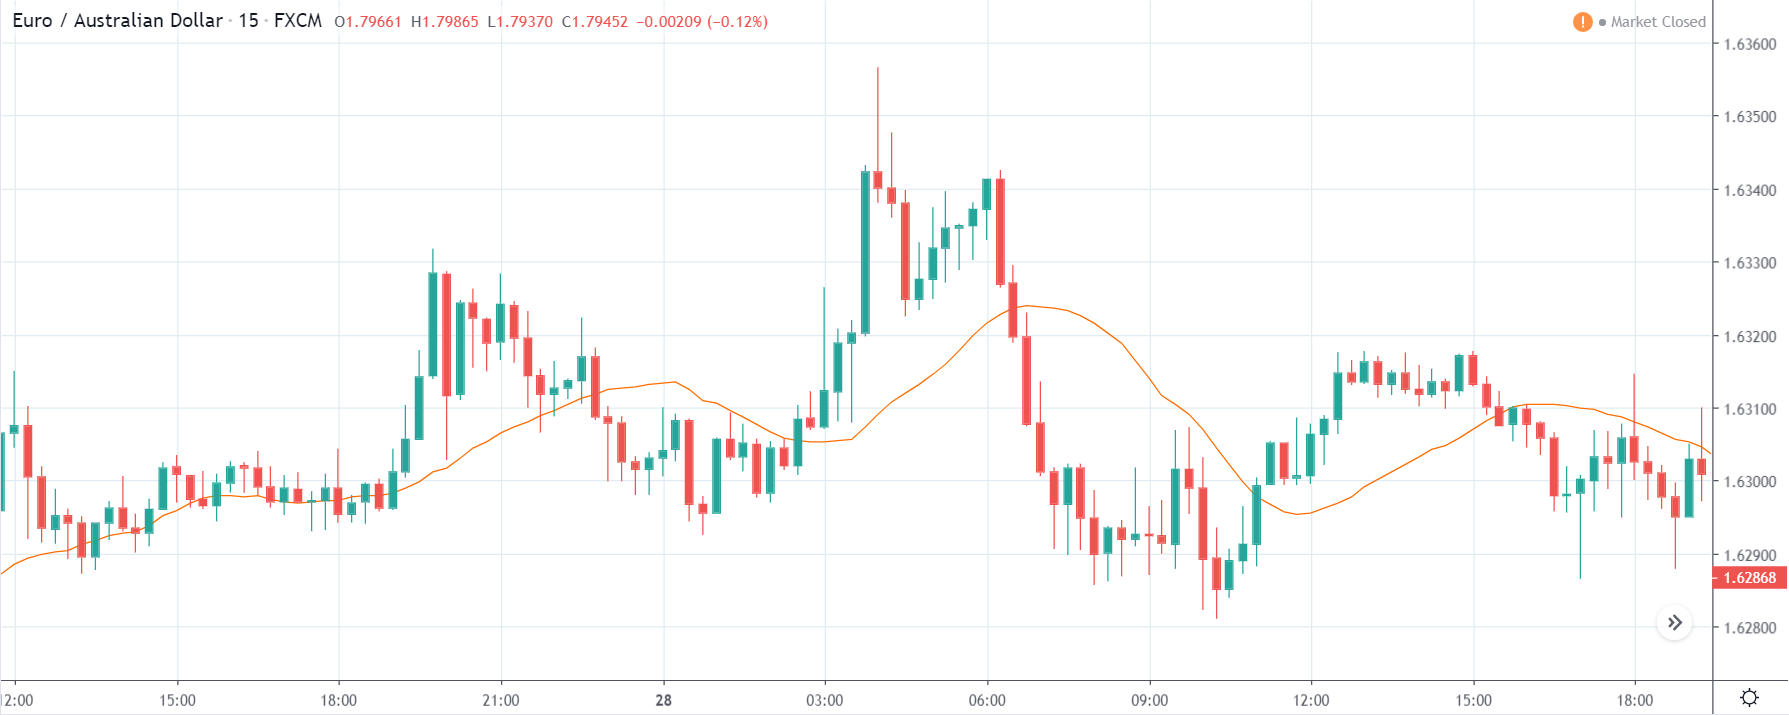
Here, we see a sudden surge in volatility on the upside that after the news announcement is made. The reason for this is that the CPI got increased by 0.2%, where the market was expecting a 0.1% rise. The large green candle shows how impactful the CPI data is on the currency. From a trading point of view, one should not be chasing the market but instead, wait for a pullback at the nearest support and resistance area and then take suitable positions. The CPI data was so positive for the Australian dollar that the price does not even come below the moving average. Take Profit‘ for the trade can be at the new ‘high’ with a stop-loss below the opening of the news candle.

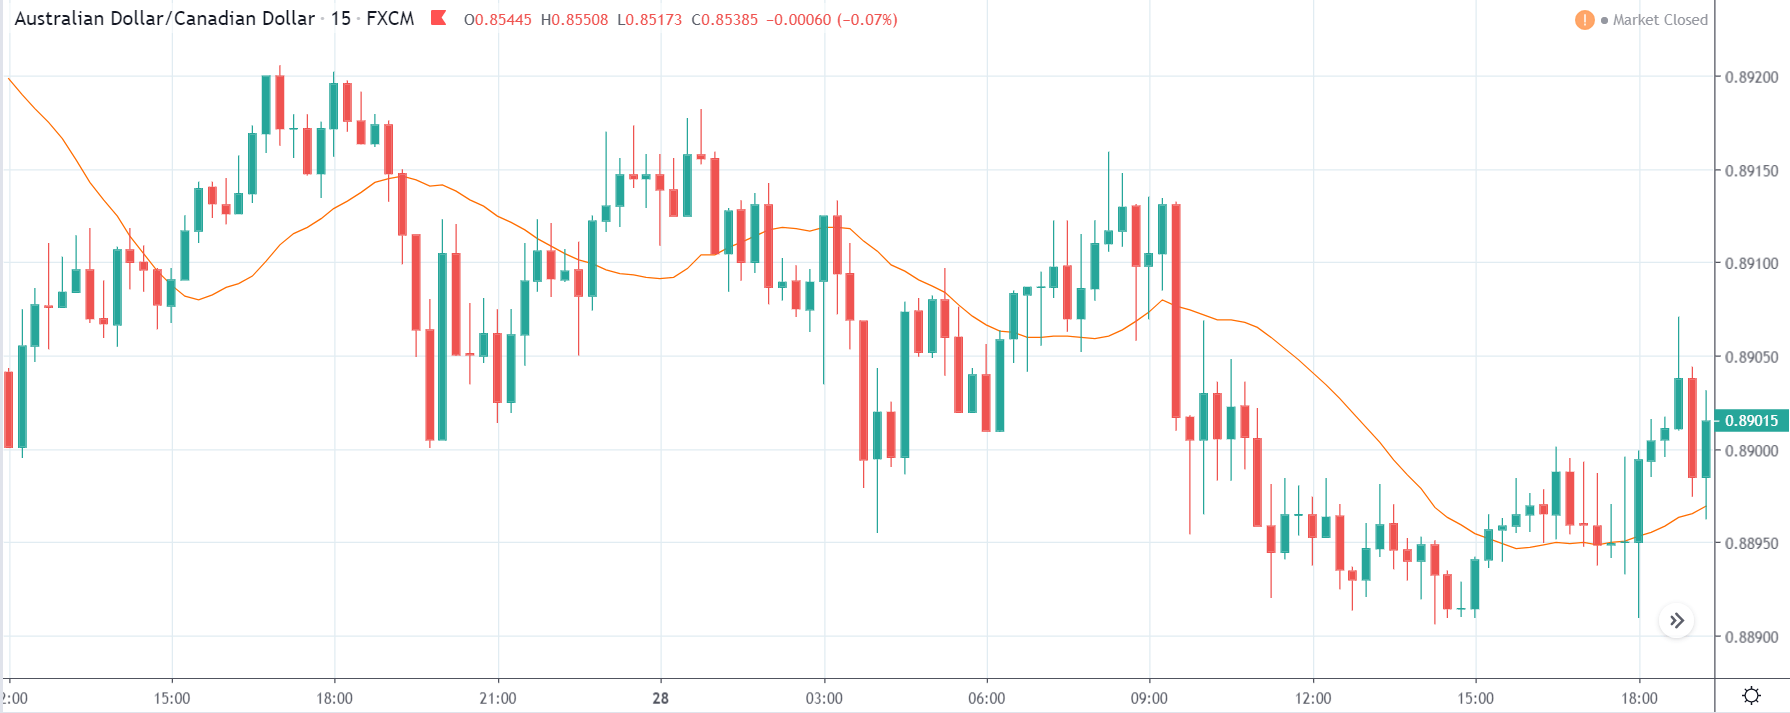
AUD/CAD | Before The Announcement

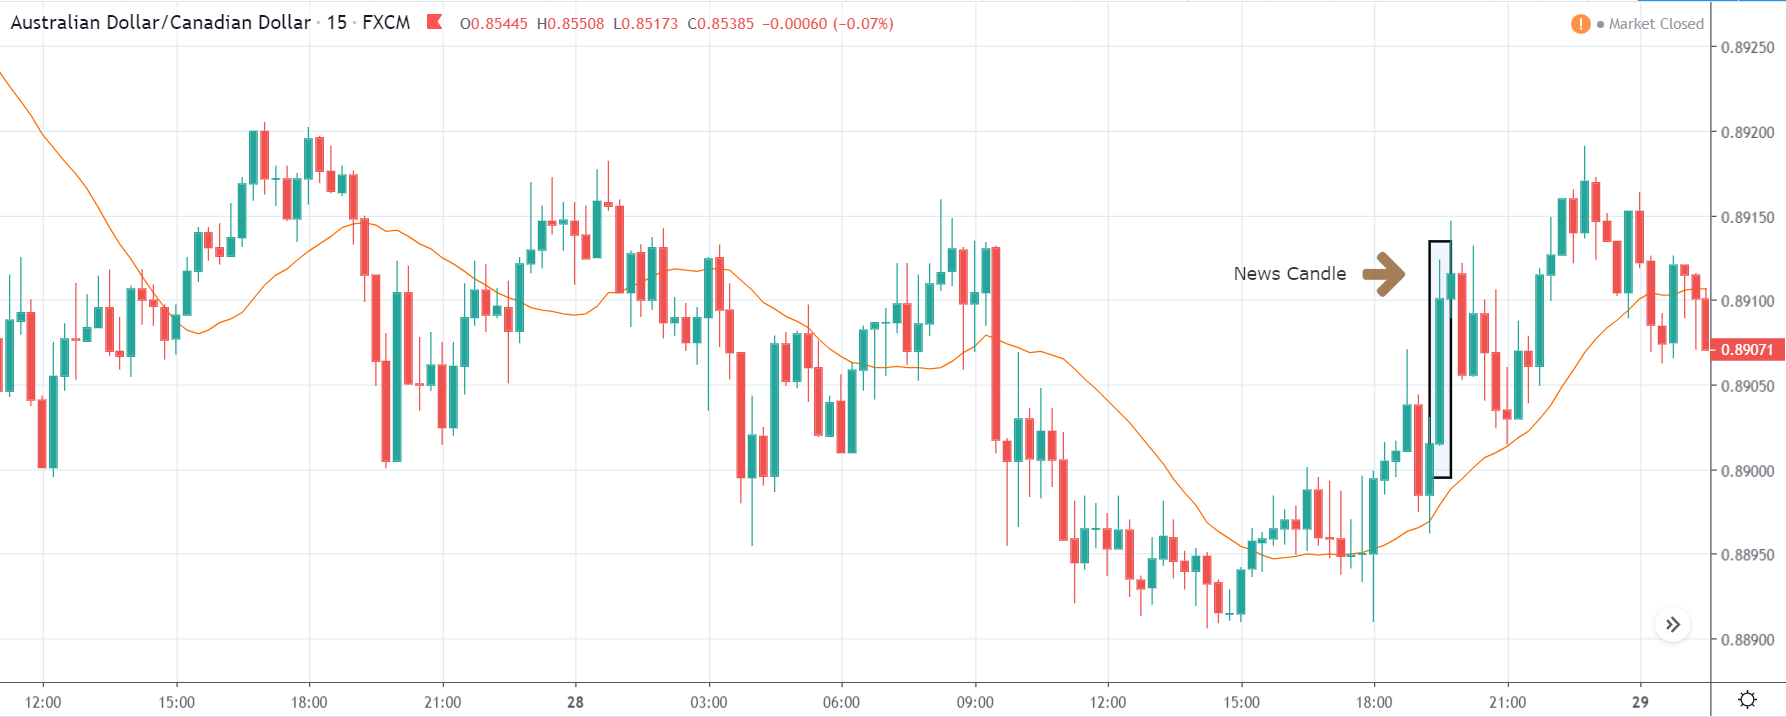
AUD/CAD | After The Announcement

The AUD/CAD currency pair appears to be in a ‘range’ just before the news announcement and is at the bottom of the range. An interesting way of positioning ourselves in the pair is by having small ‘buy’ positions before the news announcement. Because the forecasted CPI data is greater than the previous reading, and we are at a technically important level that is supporting our ‘buy’ positions. The news outcome makes the ‘support’ area work beautifully as the market shoots up to the resistance area. Here too, the data proved to be very positive for the Australian dollar as a higher CPI data drives the currency higher. We can hold on to our trades even if the price is at ‘resistance’ since the news data is very good for the currency, and it has the potential to break the ‘resistance’ and move further.

EUR/AUD | Before The Announcement

EUR/AUD | After The Announcement

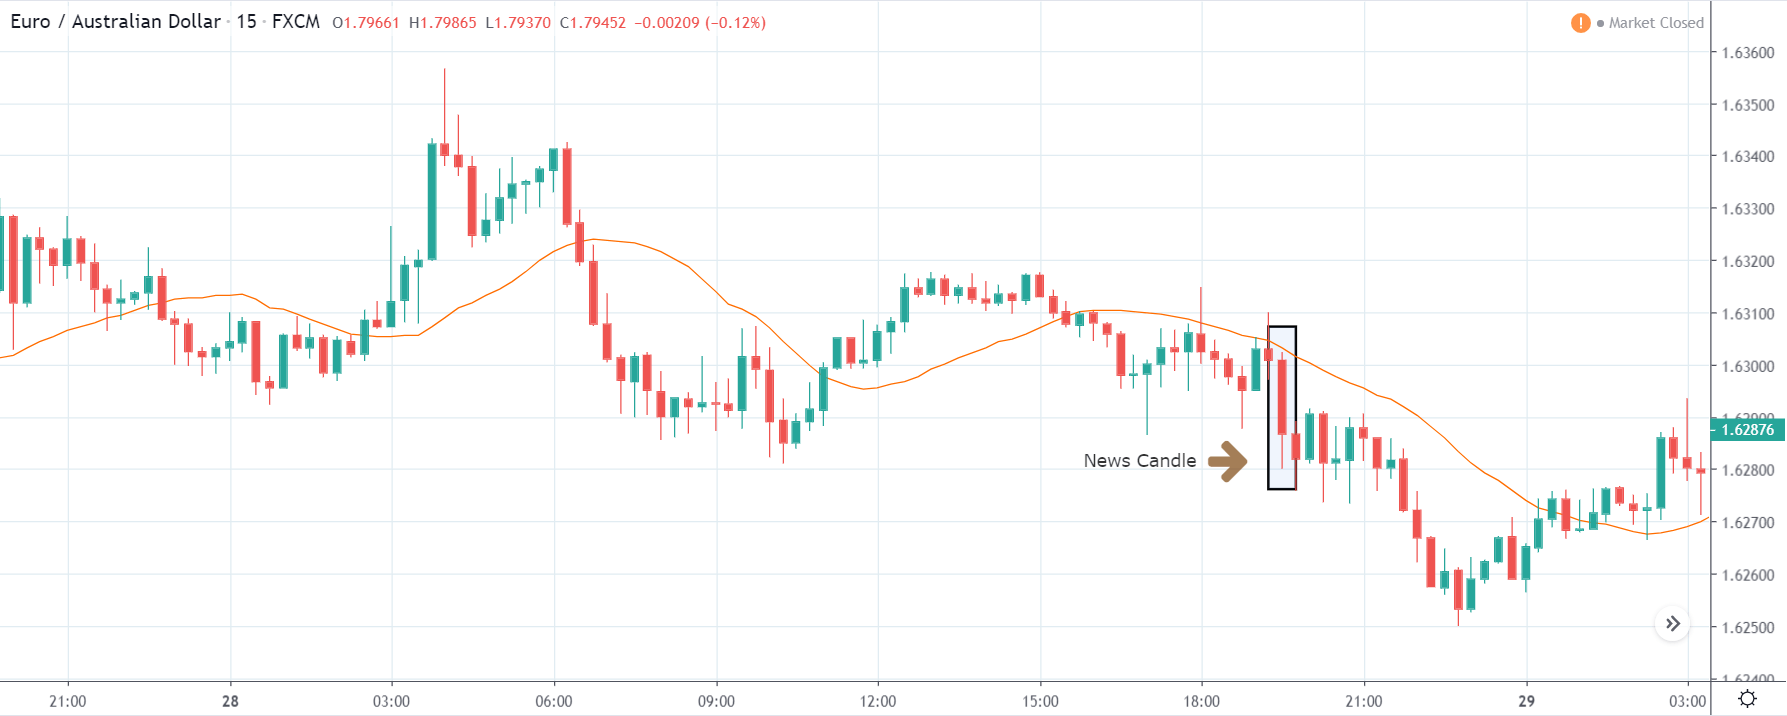
In this currency pair, the Australian dollar is on the right-hand side, which means a positive CPI data should take the currency lower. We can see that the Australian dollar already strong as the market is in a downtrend, and the market participants are optimistic about the CPI data of Australia. After the CPI announcement, the volatility increases on the downside, taking the price to a new ‘low.’ Again, when we witness better than expected data of any economic indicator, we should not be chasing the market but wait for a retracement to key levels. In this case, since we don’t see a retracement after the red ‘news candle,’ only aggressive traders can take ‘short’ positions with the confidence that the CPI numbers were exceedingly better than before and that it will take the currency lower.

That’s about CPI and its impact on the Forex market. We hope you find this information useful and if you have any questions, shoot them in the comments below. Cheers.

Categories
Forex Fundamental Analysis

What Is ‘Inflation Rate’ & Why Is It One Of The Most Important Fundamental Indicators?

Introduction

Based on the current inflation rate and future monetary policies, we can effectively gauge the current economic situation of a country. Using the Inflation rate data, we can also get an insight into the current currency’s value and in which direction the economy is heading towards. Hence we must look at this key indicator in its depth to solidify our fundamental analysis.

What is Inflation?

In Economics, Inflation is the increase in the prices of goods & services, and the resultant fall in the purchasing power of a currency. What this means, in general, is that when a country experiences Inflation, the prices of the most commonly used goods & services by the citizens of a country increase. Because of this, the average person has to spend more money to buy the same amount of goods which cost less in the previous period.

For instance, if John went to a grocery store to purchase his monthly groceries, and it cost him 100$ in 2018. Next year, i.e., in 2019, John goes to the same store to buy the same set of goods, and it had cost him 105$. Now John either has to remove some items or pay more to make the same purchase. Here John has experienced Inflation of 5%.

What is Inflation Rate?

The percentage increase in the price of goods & services over a period (usually monthly or yearly) is called the Inflation Rate. In our previous example of John, we see we have an inflation rate of 5%.

Inflation Rate is compounding in nature, i.e., it is always calculated with reference to the most recent statistic and not any particular base year or a base inflation rate. For example, if John were to buy the same goods in 2020, if it costs him 110$, then John has experienced 4.54% of Inflation and not 10% inflation.

Why is Inflation Rate important?

Inflation, in general, when kept in check, is good for an economy as it fuels growth. The increase in the prices of common goods and services means people have to compete and work better to earn more to meet their needs. But as in any case, excess or high Inflation can be crippling for an economy.

Because the citizens of the country get poorer when the purchasing power of the currency falls due to a high increase in prices, inflation Rates can be used to gauge the current financial health of an economy and what the citizens of a country are currently experiencing.

How does Inflation Occur?

A general view in the economic sector is that steady Inflation occurs when the money supply in the country outpaces economic growth. It means more currency is being circulated into the economy than its equivalent activity (revenue-generating practices). Inflation occurs mainly due to the rise in prices. But in brief, Inflation can occur due to the following situations:

Demand-Supply Gap: When the demand for a particular good is higher than the supply or production of the same, then there is a natural surge in the price of that good.

Increased Money Supply: When more money is in circulation in the economy, it means an individual has more disposable cash. This increases consumer spending due to a positive future sentiment resulting in increased demand, which ultimately increases the price of goods.

Cost-Push Effect: When the cost of inputs to the process of manufacturing good increases, it coherently increases the overall cost of the finished good. This results in a higher selling price of goods, which ultimately results in Inflation.

Built-In: Built-in inflation happens when there is a sort of feedback loop in the prices of goods and incomes of people. As people demand higher wages to meet the needs, it results in higher prices of goods and services to fund their demand and vice-versa. This adaptive price and wage adjustment automatically feed off each other and result in an increase in prices.

How is Inflation measured?

Based on different sectors, the costs of different sets of goods & services are used to calculate different inflation indexes. However, there are some most commonly used inflation indices in the market, like the Consumer Price Index (CPI) and Producer Price Index (PPI) in the United States.

Consumer Price Index (CPI): The Bureau of Labor Statistics (BLS) surveys the prices of 80,000 consumer items to create the Index and publishes it on a monthly basis. It is a measure of an aggregate price level of most commonly purchased goods and services like food, shelter, clothing, and transportation fares. Service fees like water and sewer service, sales taxes by the urban population, which represent 87% of the US population, are weighted into the percentage, based on their importance in terms of need.

Changes in CPI are used to ascertain the retail-price changes associated with the Cost of Living, and hence it is used widely to assess Inflation in the USA. In this Index, there are many subcategories wherein certain goods are either included or excluded to give a more accurate picture of Inflation in absolute or relative terms. For example, Core CPI strips away food, gas, and oil prices from the equation whose prices are volatile in nature.

Producer Price Index (PPI): It measures the average change in the selling prices received by domestic producers for their output over a period of time (usually monthly). Unlike CPI, which measures retail prices from the viewpoint of end customers who purchase the items, PPI measures the prices at which goods and services are sold to outlets from the manufacturer. PPI measures the first commercial transaction, and hence it does not include the various taxes and service costs that are associated and built into the CPI.

PPI vs. CPI

PPI measures the change in average prices that an initial-producer or manufacturer receives whilst CPI estimates the change in average prices that an end-consumer pays out. The prices received by the producers differ from the prices paid by the end-consumers, on the basis of a variety of factors like taxes, trade, transport cost, and distribution margin, etc.

Sources of Inflation Indexes

The US Bureau of Labor Statistics releases all the above-mentioned indexes here:

Consumer Price Index | Producer Price Index 

Inflation Rates of some of the major economies can be found below.

United Kingdom | Australia | United States | Switzerland | Euro Area | Canada | Japan 

How ”Inflation Rate” News Release Affects The Price Charts?

In this section of the article, we shall find out how the Inflation rate news announcement will impact the US Dollar and notice the change in volatility after the news is released. As discussed above, CPI is a well-known indicator of Inflation as it measures the change in the price of goods and services consumed by households. Therefore, the data which we should be paying attention to is the CPI values and analyze its numbers. We can see that the Inflation Rate does have a high impact on the currency of the respective country.

Below, we can see the month-on-month numbers of CPI, which is released by the US Bureau of Labor Statistics. The data shows that the CPI was increased by 0.1% compared to the previous month, which is exactly what the analysts forecasted.

Now, let’s see how this news release made an impact on the Forex price charts.

USD/JPY | Before The Announcement - (Feb 13th, 2020)
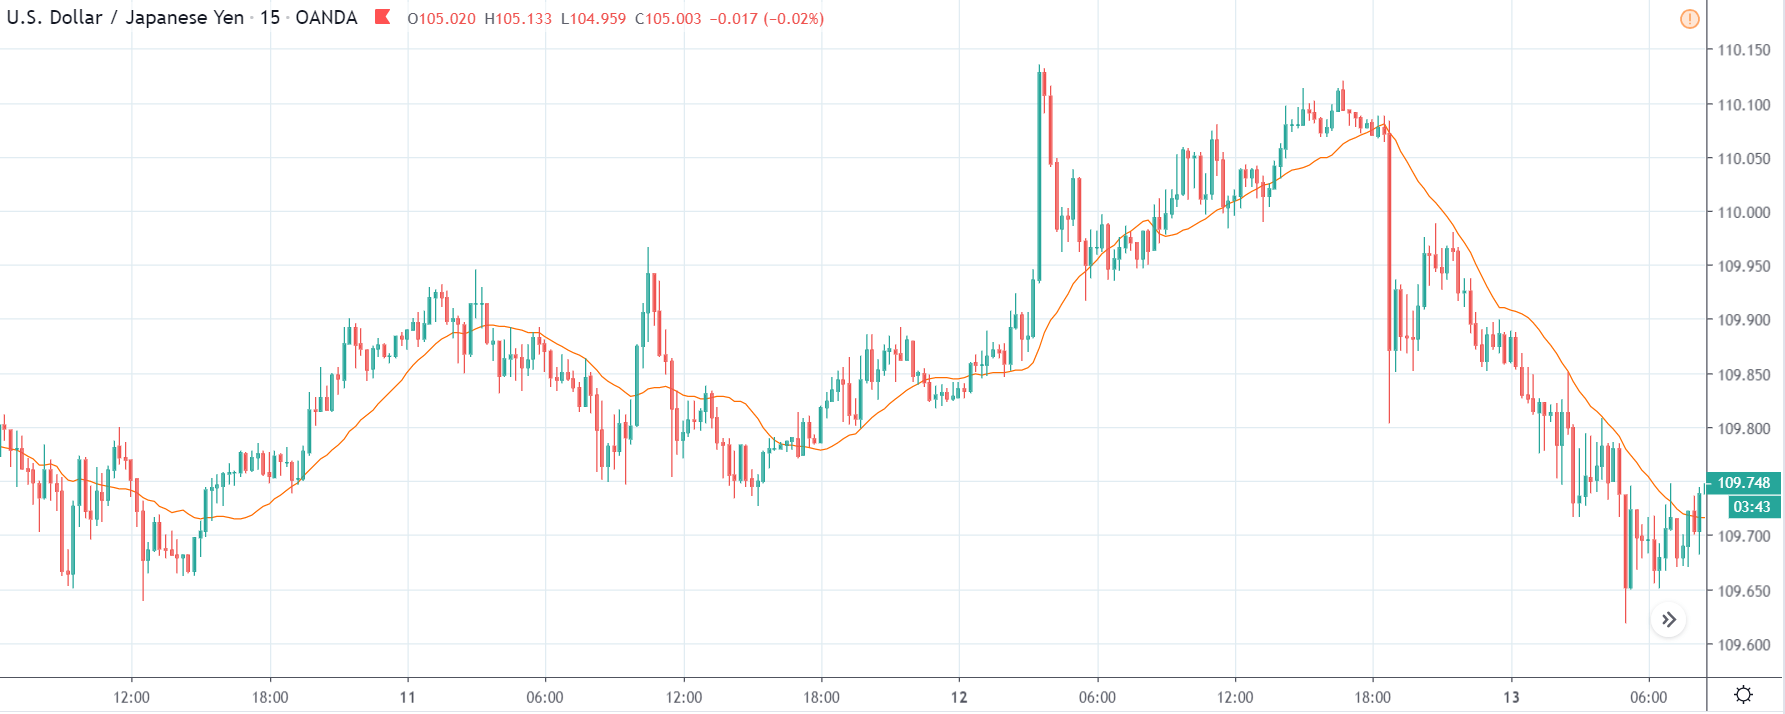
On the chart, we have plotted a 20 ”period” Moving Average to give us a clear direction of the market. From the above chart, it is clear that the US Dollar is in a strong downtrend, which is also evident from the fact that the price remains below the ”Moving Average” throughout. Just before the news announcement, we see a ranging action, which means the market is in a confused state.

Now we have two options with us, one, to ”long” in the market if there is a sudden large movement on the upside and, two, to take advantage of the volatility in either direction by trading in ”options.” We recommend to go with the first option only if you have a large risk appetite, else choose the second option by not having any directional bias. Let us see which of the above options will be suitable after the news announcement is made.

USD/JPY | After The Announcement - (Feb 13th, 2020)
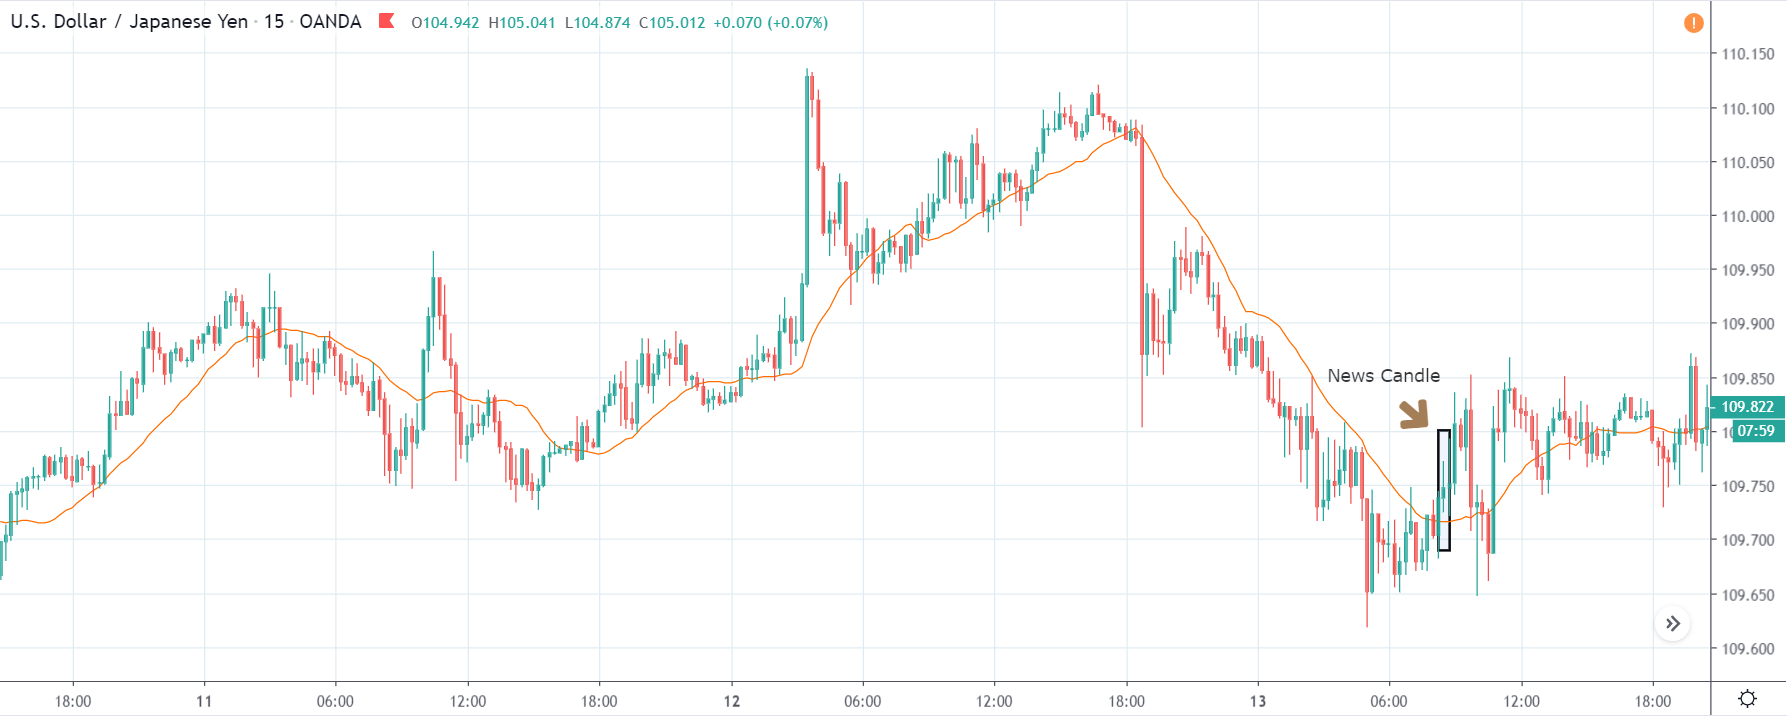
After the CPI numbers are announced, we see that the price does not go up by a lot, and it creates a spike on the top and falls below the moving average. It is very apparent that the news did not create the expected volatility in the above currency pair. From the trading point of view, in the two options discussed above, the first one is completely ruled out as the market did not show a strong bullish sign, and if we had gone with the second option, we would land in no-loss/no-profit situation.

The reason for extremely low volatility after the news announcement can be explained by the fact that the CPI numbers were merely increased by 0.1%. Since an increase in CPI is positive for the US Dollar, the market does not fall much and continues to hover around the same price.

AUD/USD | Before The Announcement - (Feb 13th, 2020)
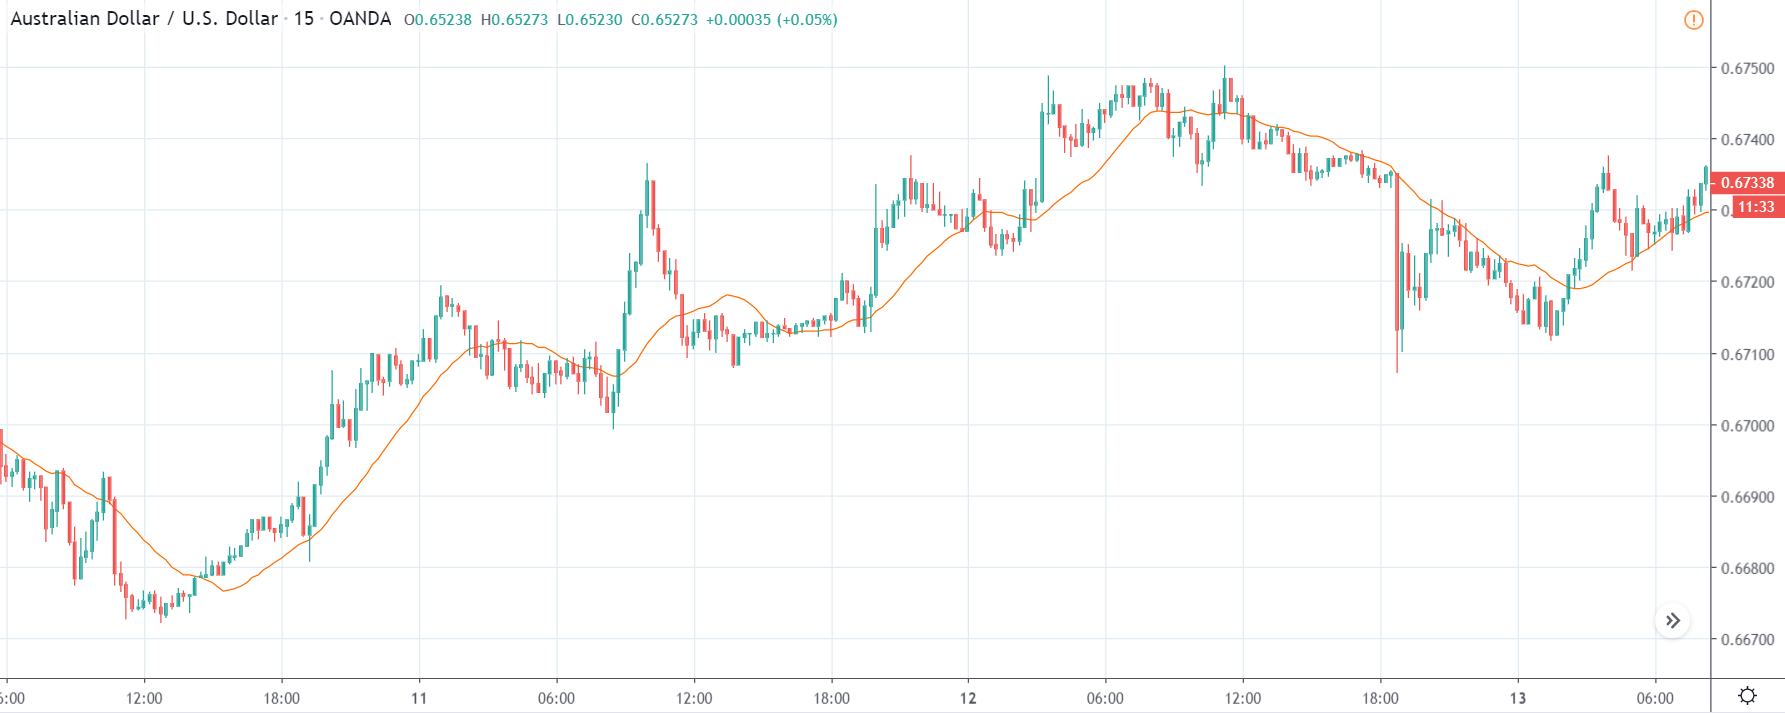
AUD/USD | After The Announcement - (Feb 13th, 2020)
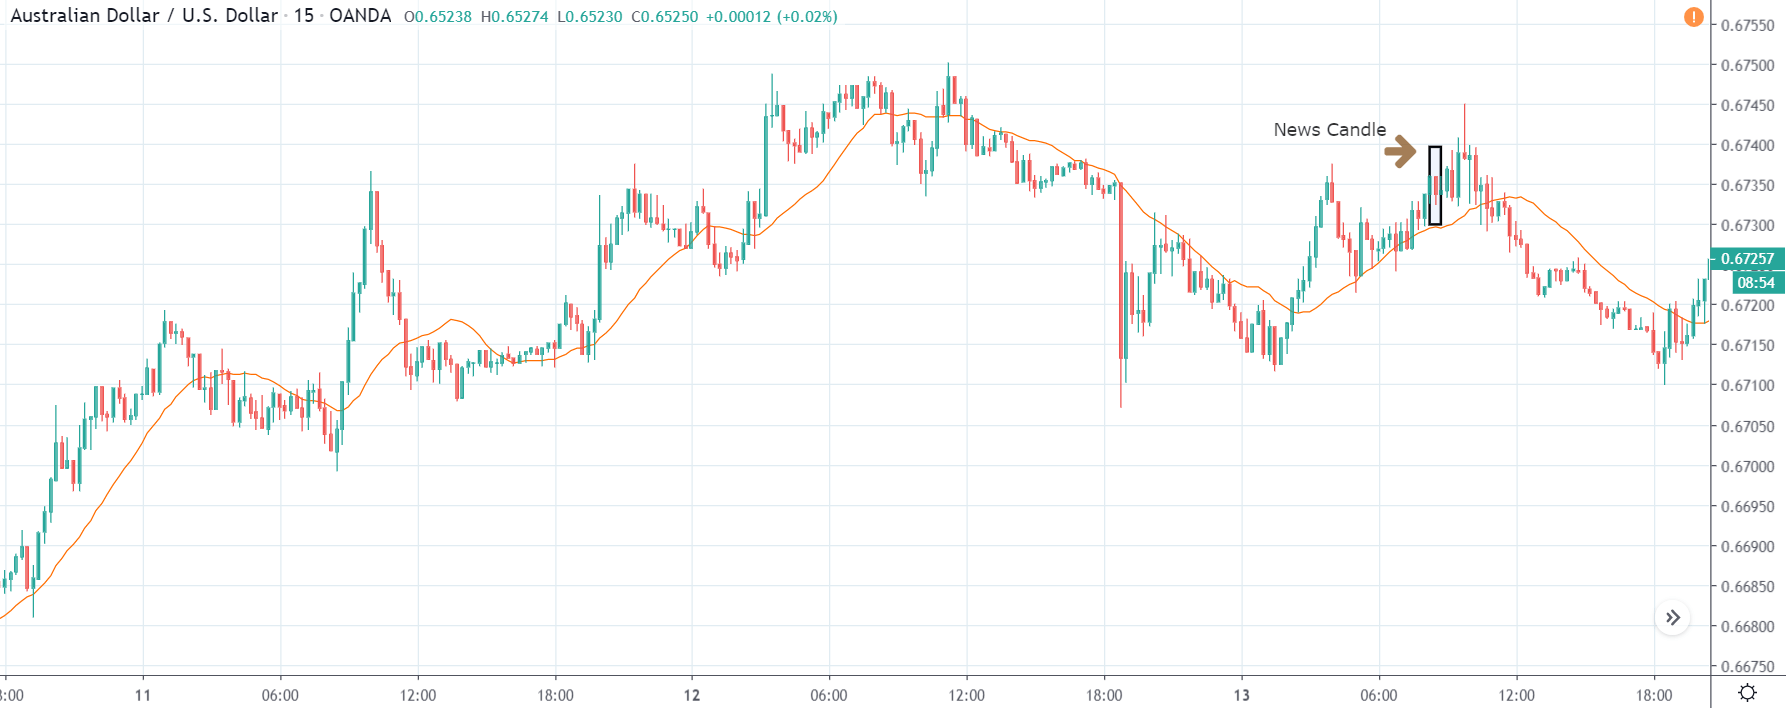
The above charts represent the currency pair of AUD/USD. Here since the US dollar is on the right side, we should see a red candle after the news release since the CPI data was good for the US dollar. By looking at the reaction of the market, we can say that the volatility did increase after the news announcement, which means AUD/USD proved to be better compared to USD/JPY.

A mere rise in the CPI number was good enough for the currency pair to turn into a downtrend from an uptrend. One can also see that the price goes below the moving average indicator. This means that the Australian Dollar is a very weak pair compared to the US dollar, the reason why the US dollar became so strong after the news release. Hence one can take a ”short” trade in the currency pair after the price breaks the MA line.

NZD/USD | Before The Announcement - (Feb 13th, 2020)
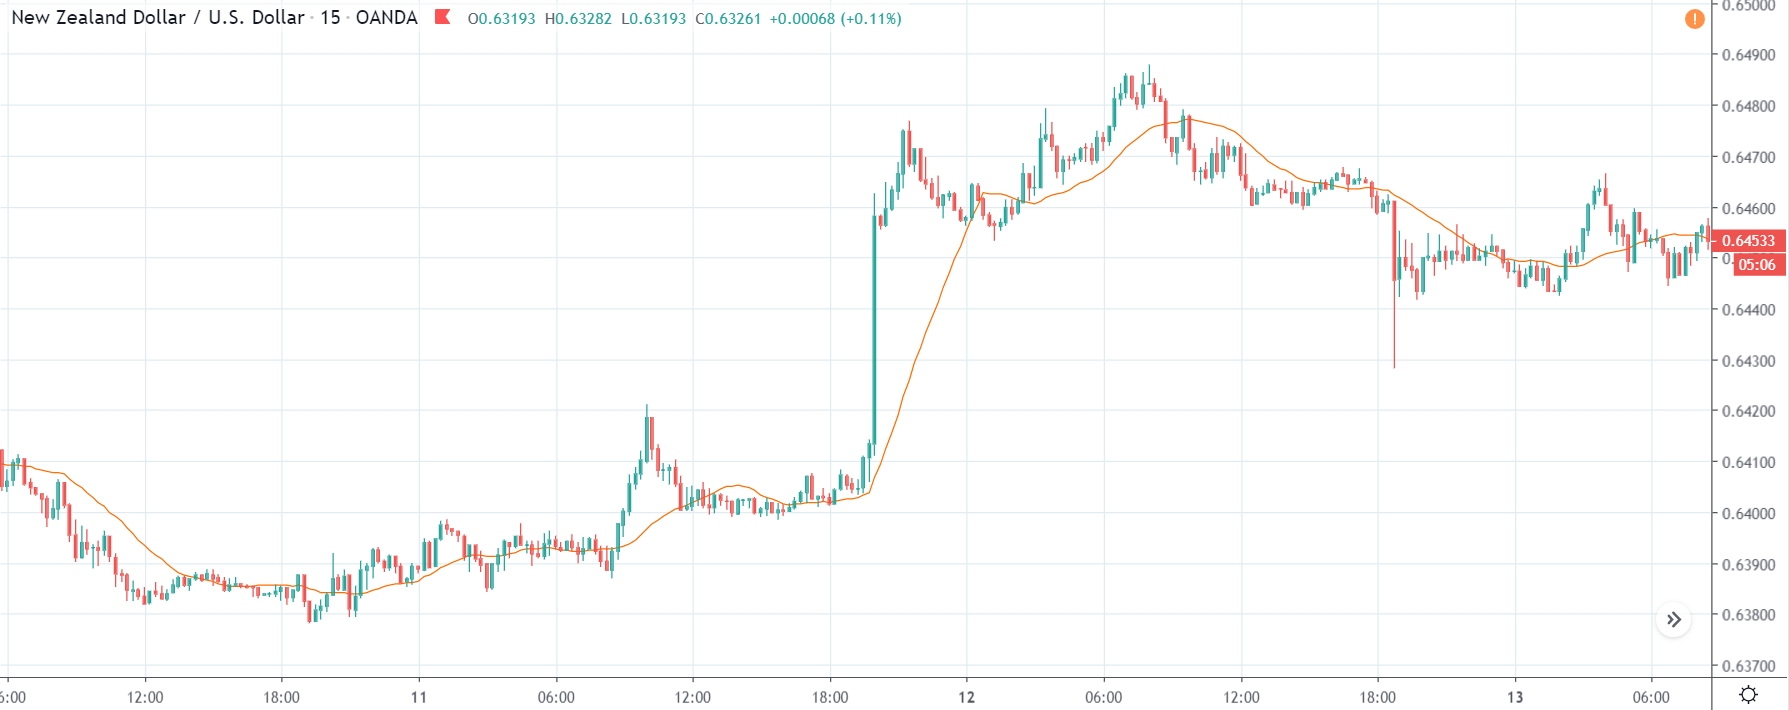
NZD/USD | After The Announcement - (Feb 13th, 2020)
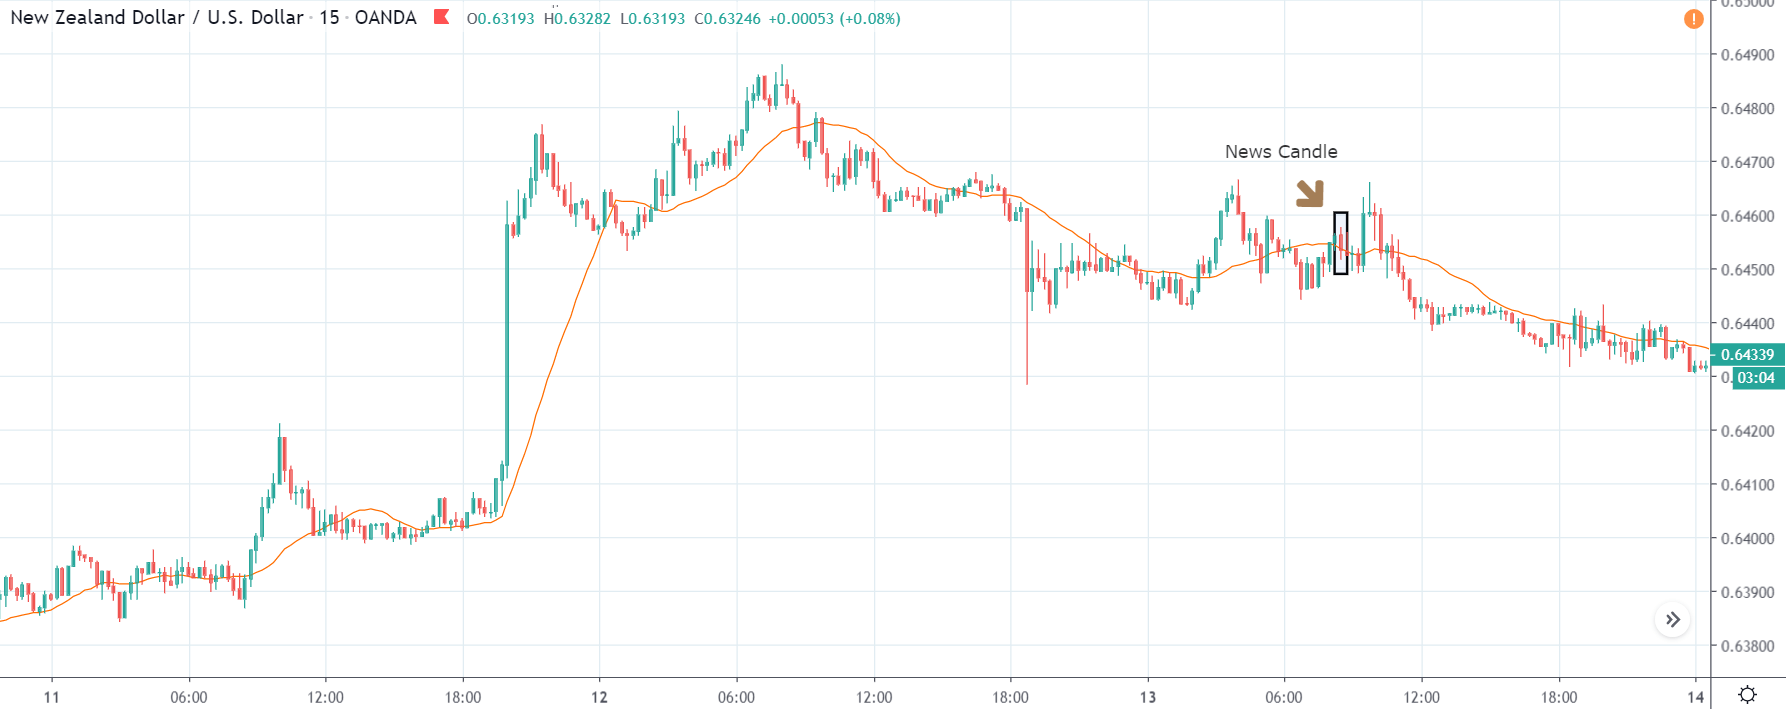
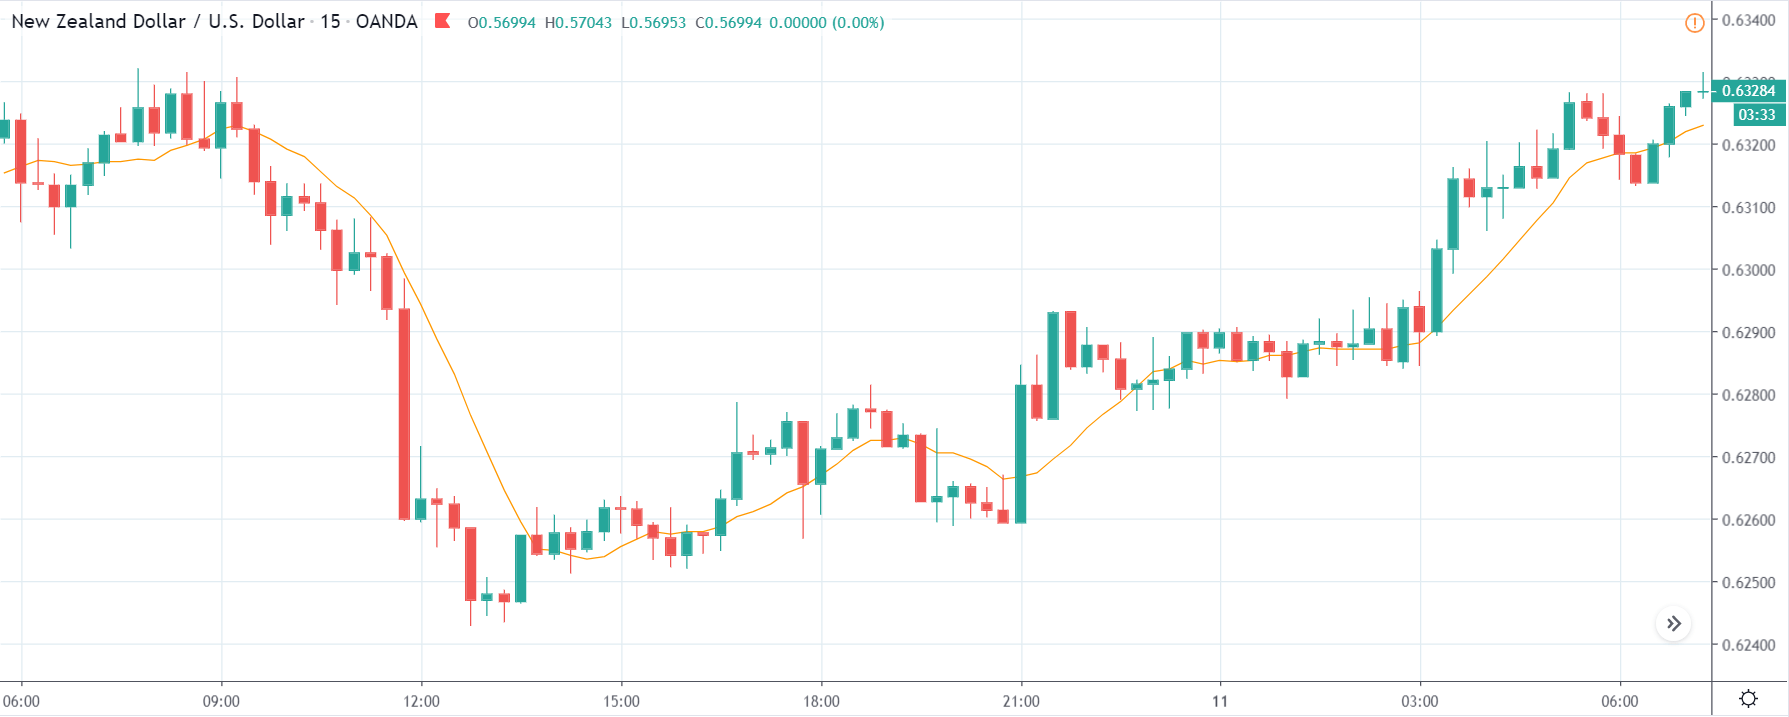
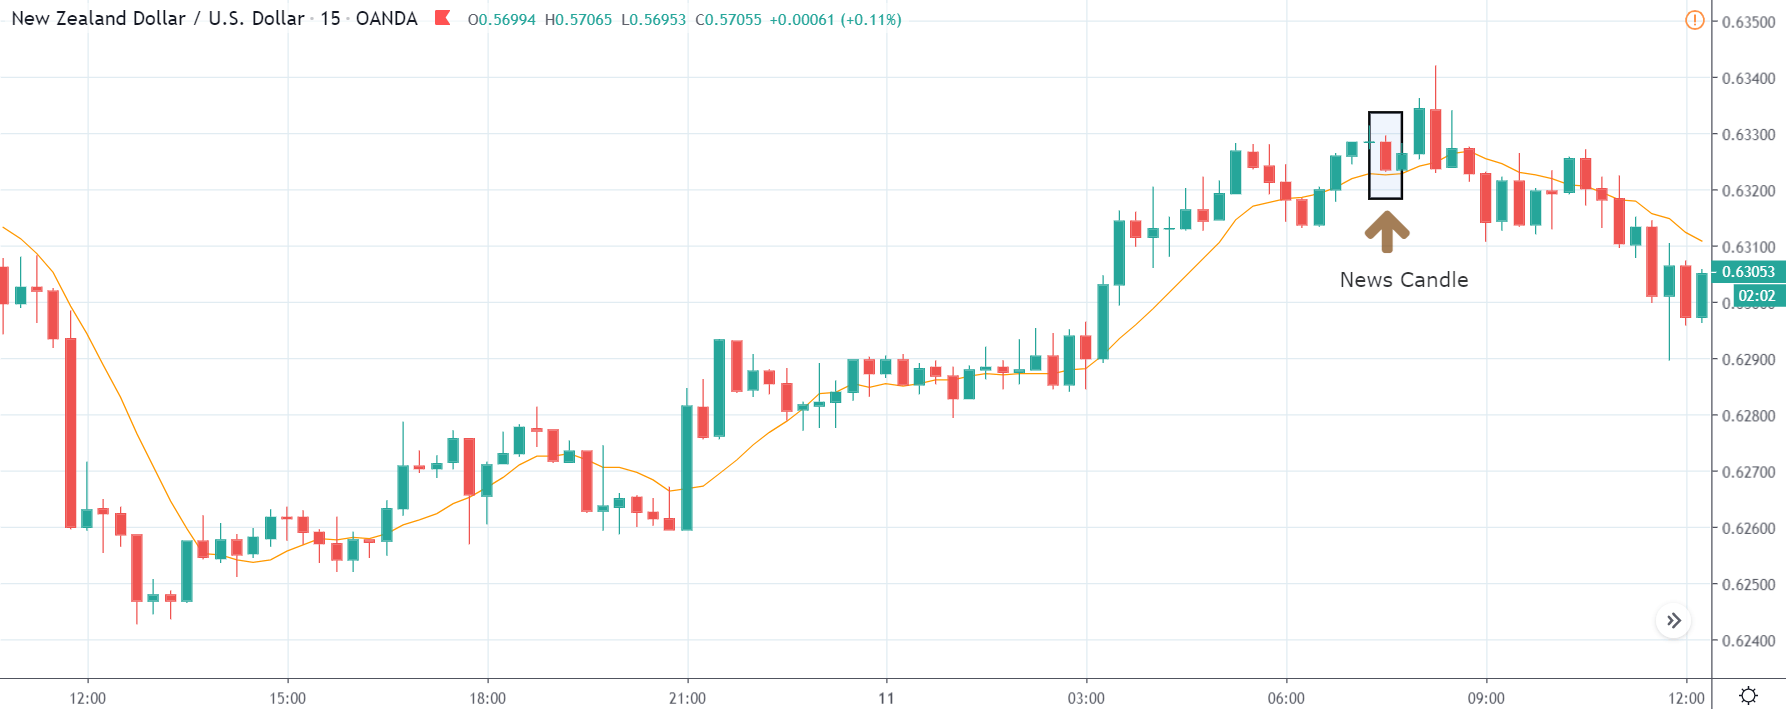
The above charts represent the currency pair of NZD/USD. It shows similar characteristics as that of the AUD/USD pair before and after the news announcement. The CPI data caused the US dollar to strengthen against the New Zealand dollar, where the volatility change can be seen when the market turns into a downtrend.

The CPI data did have a positive impact on the currency pair, but the pair did not collapse. This means the data may not be very positive against the New Zealand dollar, where the price just remains on the MA line after news release and does point to a clear downtrend. Hence, all traders who went ”short” in this pair should look to take profits early in such market conditions as the market can reverse anytime.

That’s about Inflation Rates and its impact on some of the major Forex currency pairs. If you have any queries, please let us know in the comments below. Cheers.

Categories
Forex Course

44. Analyzing The Forex Market – Fundamental Analysis

Introduction

We’ve now come to one of the most exciting topics in this course, which is analyzing the Forex market. Now that we know the history and the working of the Forex market, we’re all set to predict the future of the market. Several types of analyses are used by traders across the world to analyze the  Forex market. However, these analyses can broadly be classified into three types.

In this lesson, and the lessons coming forward, we shall be discussing all these three types of analyses.

Types of Forex market analysis

The three types of forex market analysis are:

  1. Fundamental analysis
  2. Technical analysis
  3. Sentimental analysis

Now, you must be wondering which one of them is best for analyzing the markets. Well, if you look at the most successful professional traders in the industry, they analyze the market by considering all the types. In this lesson, let’s understand the most essential Fundamental Analysis.

Fundamental Analysis

Fundamental analysis, as the name pretty much suggests, is the way of analyzing the market by studying the economic, social, and political forces in the country. These factors are considered because they affect the supply and demand of an asset.

The whole idea of trading using fundamental analysis is by considering the factors that affect the supply and demand of a currency. These factors are technically referred to as fundamental or economic indicators.
The concept behind this type of analysis is straightforward. If a country’s currency or economic outlook is good, then there is a high probability that the currency will show strength in the future and vice-versa.

What are the major economic indicators?

Below are some of the economic indicators which have the power to shift the economic situation of a country.

Interest rates

One of the most popular and important economic indicators are interest rates. There are several types of interest rates, but we will be focusing on the basic form of the interest rates set by the central banks. Central banks are the creators of money. This money is borrowed by private banks. And the percentage (interest) or the principle the private banks pay to central banks for borrowing the money is called a nominal or a base interest rate.

If the central banks wish to boost the economy, they decrease the interest rates. This then stimulates borrowing by both private banks and other individuals. And this, in turn, increases consumption, production, and the overall economy. Lowering the interest rates can be a good way to inflate the economy but can be a poor strategy too. Because in the long term, low-interest rates can over-inflate the economy with cash and create an unbalance in the money supply.

So, to avoid this, central banks increase interest rates. And this increase results in less money in the hands of private banks, businesses, and individuals to play around with.

Inflation

Inflation, as the name pretty much says, is fluctuation in the cost of goods over time. Inflation, too, is a vital indicator for economists and investors to forecast the future economy. Inflation will have a good effect on the economy if done uniformly. But, too much inflation can bring the balance of supply and demand on the tip in favor of the supply. And this eventually will bring down the value of the currency.

Apart from these two, there are many other macroeconomic indicators that traders consider to do their fundamental analysis. Some of them include GDP, PPI, CPI, Unemployment Rate, Government Debt, etc. Indicators like these help the investors & traders in analyzing the market and predicting its future.

This completes the lesson on fundamental analysis. In the next lesson, let us understand the insights about technical analysis. Don’t forget to take the quiz below before moving ahead!

[wp_quiz id=”56601″]
Categories
Forex Market Analysis

The Positive Data Reported in Canada could support a rate hike soon

Hot Topics:

  • The positive data reported in Canada could support a rate hike soon.
  •  The Greenback rally continues.
  • FTSE maintain the bull trend, DAX waits for ECB meeting?

Positive data reported in Canada could support a rate hike soon.

The consumer inflation (YoY) in March increased to the highest level in three years reaching 2.3%, climbing from the 2.2% reported in February. The Core Inflation (YoY) descended to 1.4% in March from the 1.5% in February. The higher oil prices have influenced inflation to rise. On the other hand, retail sales in February have increased to 0.4% from 0.1% reported in January. The Bank of Canada maintains a 2 percent inflation target; this scenario could signal an interest rate hike soon. In the last Monetary Policy meeting, the Bank of Canada decided to maintain the rate at 1.25%.

In the technical context, a correction for the Canadian Dollar group could show soon. In the EURCAD cross, we expect a bullish movement with a target placed in the 1.58 level before making new lows.

In the same way, GBPCAD is developing a bullish retracement process that could reach 1.805 – 1.81, the area from where it could make the bearish continuation of the main trend.

The Greenback rally continues.

For the fourth consecutive session, the US Dollar saw advances compared to its main competitors. The Euro has broken down its short-term consolidation structure but has been stopped by the lower trend-line of its long-term triangle pattern.

The Pound tested the 1.40 psychological level again, from where it is bouncing. We expect a retracement to a Fibonacci level before we decide to sell this pair.

The Swissy could visit the area between 0.9765 and 0.9836 before it makes a bearish cycle.

FTSE maintains the bull trend, DAX waits for ECB meeting?

The main European indices have closed with a mixed sentiment. The FTSE 100 closes the last trading session of the week climbing above the pivot level 7,326. We expect more upsides until the 7,450 – 7,520 area before it makes a bearish leg.

On the opposite side, DAX 30 could not climb up above the pivot level of 12,622. The German index could make a new bearish leg, likely to be around the 12,100 – 12,200 area before the ECB Monetary Policy Meeting and continue the bullish cycle.

© Forex.Academy

Categories
Forex Market Analysis

CPI in Great Britain

CPI in Great Britain

Consumer price index has risen 2.5% in annual terms. This was surprising because 2.7% was expected. Although the intention is to reach 2%, this rapid drop in the CPI could slow down the expected increases in the price of money scheduled for this year.

There is weakness in some sectors that demand a certain degree of confidence on the part of the consumer, such as the car sales that closed the first quarter with a deceleration of 5.2%. Other sectors such as employment, seem to give confidence because of the low unemployment rate so that we will have to see how the Brexit is resolved and the complex current scenario is clarified.

© Forex.Academy

Categories
Forex Market Analysis

What kind of trigger could boost the Dollar?

Hot Topics:

  • What kind of trigger could boost the Dollar?
  • Will the Eurozone continue to bring weaker economic data?
  • Could the UK CPI have reached their peak?
  • Fear of a new war or do we expect a new bearish leg?
  • A new higher high in oils is expected before it starts a corrective move.
  • Downward continuation limited before the BoC decision.

What kind of trigger could boost the Dollar?

The recent tensions originated by the strike made between the US, UK, and France on Syria and the reactions of Russia condemning the act could continue to increase the volatility in the markets. Another triggering factor could be the one originated by the US Retail Sales, which fell in February -0.1%. In March the analysts’ consensus is expecting an increase near to 0.4%. In technical terms, the greenback is still in a range and could be making a bottom formation. The control levels are 88.66 to 89.16. Invalidation level is below 88.1.


Will the Eurozone continue to bring weaker economic data?

This week the Germany and Eurozone ZEW economic sentiment reports were released. Particularly, the level of confidence fell to 13.4 in February from 29.3 reported in January. Probably it could be produced by a stational factor, like the weather conditions (winter time). In the panoramic chart, we are watching the current structure, as a corrective formation that could reach new lows in the 1.196 – 1.20 area. The invalidation level is above 1.2476.


Could the UK CPI have reached their peak?

In the last months, the British CPI apparently reached their peak, with a CPI of 3.1% (YoY) reported in the past year in November. Then in December and January, it achieved a 3.0%, but in February in line with other activity indicators, it has shown a decrease in the economic activity. It is probable that at these levels we are witnessing a stabilisation of the economic activity. In the same way, on the chart, we are watching a potential top pattern as a mother wave that could initiate a new bearish cycle with a target at the base of the sideways channel. The invalidation level is above 1.4345.


Fear of a new war or do we expect a new bearish leg?

The Japanese currency is moving in an ascending diagonal pattern in search for its long-term 108 level resistance. Despite the US attacks against Syria, the price continues moving according to our vision. We expect to find sellers once the price strikes the 108.2 – 108.4 area,  starting a new bearish leg.

The correlation between the Nikkei 225 and the USDJPY pair, bring us a clue about the moves that it could make. The first scenario is a breakout above 21,957 pts for a bullish continuation move, drawing the 22,764 – 23,050 area as a target. In the second scenario, if the price moves making a new bearish leg, we expect that move to reach the 20,660 zone, making a “mother wave”  and starting a new bullish cycle.


A new higher high in oils is expected before it starts a corrective move.

Last week the oils, Brent and WTI, reached their highest levels since 2014. For inverse correlation and as it was envisioned by us on January 12th, the Crude Oil VIX ETF reached the Potential Reversal Zone, where it might start a bullish cycle. In practical terms, once the WTI reaches the 67.8 – 68.7 area, it is likely that it begins a corrective move.


And concerning Brent Oil, we could see it at a new high, to 72.9 level,  before it starts a falling move.

Falls continuation is limited before the BoC decision.

Next Wednesday 18th the Bank of Canada (BoC) Monetary Policy Meeting will take place. The analysts’ consensus expects that the decision will maintain the interest rate at 1.25%. The price is making a downward cycle since March 19th, and our vision is that the Loonie might fall to the area between 1.245 – 1.254, where it could start an upward move, at least up to 1.274. The invalidation level for the ascending movement is 1.225.