Introduction
The Core Consumer Prices are a sub-segment of the Consumer Prices, which is used by professionals and economists to get a more accurate picture of the inflation within the country. Understanding of Consumer Price movements can help traders predict inflation rates, industrial trends, identify demand, and supply gaps to invest in a particular section of goods and services. It is a widely used statistic and is one of the critical components in assessing economic expansion or contraction, thereby.
What is Core Consumer Price?
The ”Core “ Consumer Price is the generally called name for the “Consumer Price for All Urban Consumers: All Items Less Food and Energy.” This term comes up in the Consumer Price Index monthly published Reports where this is another variant of the CPI-U and is widely known as the “Core” CPI where CPI stands for Consumer Price Index.
What is the Consumer Price Index?
Consumer Price Index is a survey report which determines the average price of some of the most commonly purchased goods. These goods include toothpaste, grocery, fuel, etc. Instead of using a simple average, each good is assigned a specific weight based on the degree of their importance amongst the people. For instance, milk will have a higher weightage in the mean price calculation compared to the furniture.
Core Consumer Price Index is the same Consumer Price Index for all the commonly consumed goods and services except food and energy items. This distinction has arisen due to the highly volatile nature of food and energy prices.
Why are the food & energy prices volatile in the first place?
Let us talk about food first. In the short run, the supply of food cannot immediately accommodate the increase in demand for food. To meet the increased demand, it has to result in the planting of more seeds and growing, which take somewhere about a few months to at least a year.
Due to this situation, we say the supply is inelastic to the demand, meaning it cannot stretch immediately to meet the demand. Hence, the demand-supply gap causes price volatility. For example, in India itself last year, the price of onions went up to 150 rupees per kg from its usual 30 rupees per kg. This volatility can also occur due to crop loss at the time of adverse weather conditions or due to some other issues like forest fires etc.
The same goes for energy items like crude oil. Industries or Countries that are heavily dependent on these sources have little choice but to pay higher prices when there is a shortage of supply. Switching from one source of energy to another or alternate forms of power is not a small task, nor is it a viable solution. The primary energy source areas have been historically subjected to political tensions, which have led to significant shocks in oil prices worldwide. Factors like weather conditions also hinder oil production, or unexpected incidents can lead to significant dips in the energy supply levels in the global market.
Below is a historical 70-year plot of Crude oil prices where shaded regions indicate periods of recession.
(Source: MACROTRENDS)
With such a massive rise and drops in prices, it is very easy to overlook the actual inflation or deflation within the economy. As the CPI takes into account the food and energy prices, there can be situations where the food and energy prices skyrocket while other items have observed deflationary trends in their prices to a scale that the volatility masks the deflationary trend or vice versa is also true.
To avoid this inaccuracy in CPI, the Core CPI comes into the picture, which is a more accurate inflationary measure than the CPI-U.
Economic Reports
The Bureau of Labor Statistics generally conducts a survey of 80,000 consumer item prices to create the Index and publishes it monthly.
BLS data collectors visit in person, or virtually through the internet, or call thousands of retail stores, service establishments, rental units, and doctors all over the United States. They do this to generate info on the prices of items and then measure price changes in the CPI.
How can the Core Consumer Prices be Used for Analysis?
The index data set goes as way back; for example, Core CPI goes as far back as 1957. With such a large data set, the reliability of the data set is high, and it usually depicts the macroeconomic picture of a country with reasonable confidence.
CPI changes are useful to ascertain the retail-price modifications associated with the Cost of Living. Hence it is widely used to determine inflation in the United States.
Many payment agreements are directly tied to CPI; it can affect the incomes of 80 million people. Social Security benefits, various pension payments are all indexed by CPI. Hence, CORE CPI is essential to understand current monetary conditions and can also be used to assess how the governments and policymakers will act to these changes.
Impact on Currency
In general, CPI is associated as a proportional indicator meaning higher CPI signals currency appreciation for traders and vice versa.
Below is a snapshot of CORE CPI plotted against GDP for the last 15 years, and we see this macroeconomic indicator’s importance in fundamental analysis:
Sources of Consumer Price Index
The U.S. Bureau of Labor Statistics releases all the indexes as mentioned here –
Consumer Price Index and Core CPI
CPIAUCSL: CPI for Urban Consumers: All Items in U.S. City Average: Broadly uses the statistic for a measure of overall inflation in prices. It includes Food and Energy prices, unlike CPIFESL. This info can be found here.
CPIFESL: Consumer Price Index for All Urban Consumers: All Items Less Food and Energy in U.S. City Average: It excludes volatile components like Food and Energy (Oil Prices) and gives more of a Core CPI change within the United States. This info can be found here & here.
Impact of the ‘Core Consumer Prices’ news release on the price charts
The Core CPI is not only an important indicator of inflation but that of the overall economy, thus it is sure to impact the value of the currency. In this section of the article, we will be discussing that impact and look to trade the news announcement. As we can see in the below image, core CPI is said to highly impact the currency when the numbers are being announced. The data released on a monthly and yearly basis, but today we will be analyzing the month-on-month core CPI data of the United States.
![]()
The below image shows the latest Core CPI data for the month of February, along with the forecasted and previous numbers. A higher than expected reading is considered to be bullish for the currency while a lower than expected reading is believed to be bearish. The latest figures show that the Core CPI numbers were unchanged from before, which was exactly predicted by economists. The CPI numbers are published by the U.S. Bureau of Labor Statistics, the official agency that carries out surveys and collections. Now let us analyze the impact it created on the U.S. dollar.
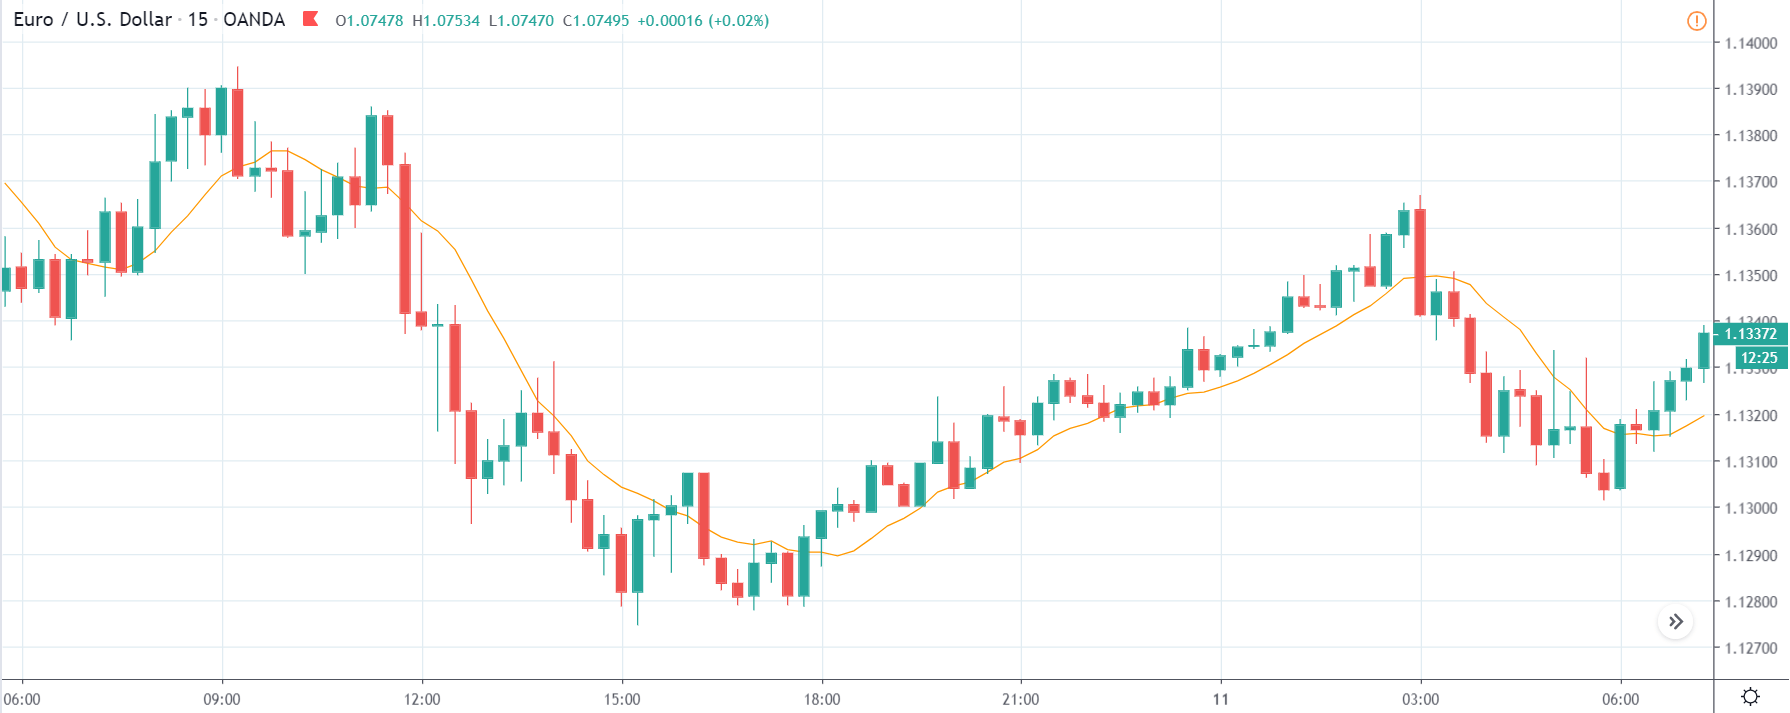
EUR/USD | Before The Announcement
We start with the most liquid forex pair in the world, which is the EUR/USD pair. Looking at the from a technical perspective, before the news announcement, we see a market reversal retracement on the downside with a retracement to the nearest ‘higher high’. One can assume that the market has factored in the Core CPI data as it is expected to remain the same as before. Hence, one should not expect a great amount of volatility during the announcement. Technically, we can take a ‘short’ trade in the above pair, but without having a lot of assumptions, it is advised to keep a wide stop loss to protect ourselves from spikes.
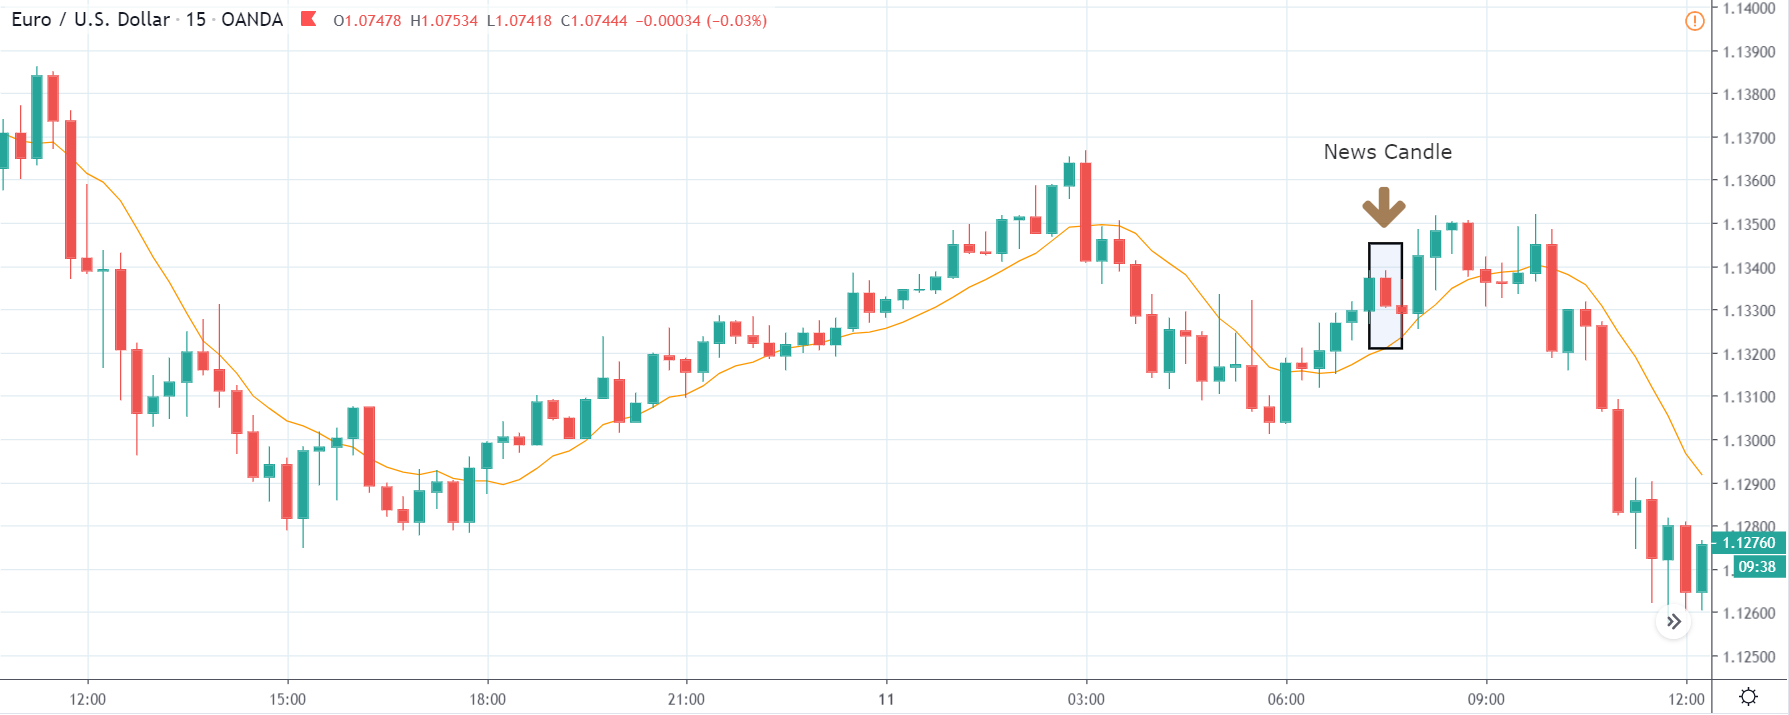
EUR/USD | After The Announcement
The Core CPI numbers are announced, and since it was on expected lines, the price falls a little, showing some bullishness for the U.S. dollar. As there was minimal volatility, we can confidently take a ‘short’ trade with a stop loss above the recent ‘higher high.’ The ‘take profit’ for this trade should be near the recent ‘low’ or ‘support’ area. We shouldn’t forget that earlier, it was said that it is a high impactful event, but due to subdued expectations, it did not induce high volatility.
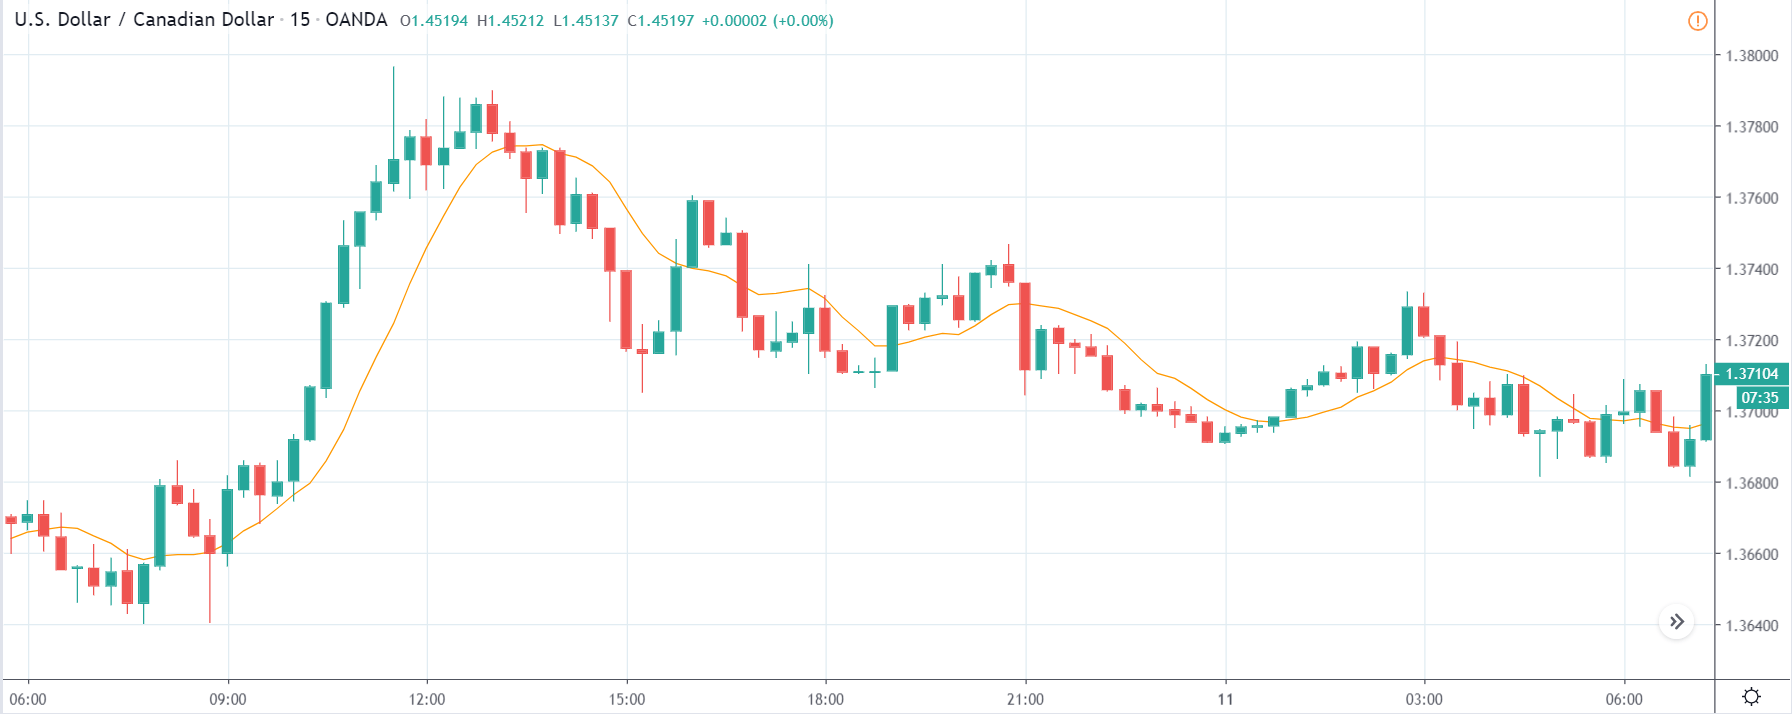
USD/CAD | Before The Announcement
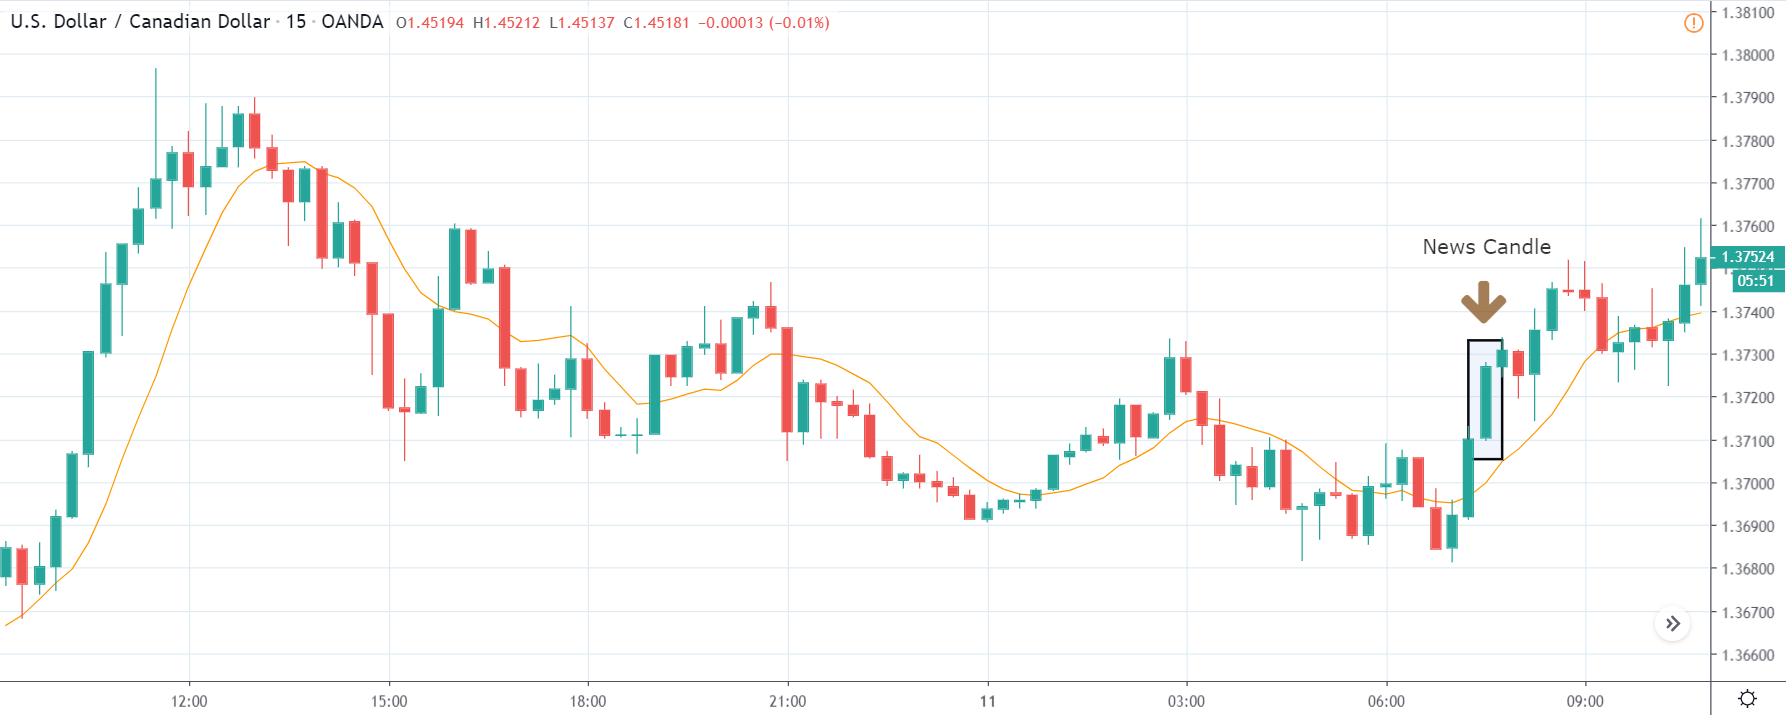
USD/CAD | After The Announcement
The above images represent the USD/CAD currency pair where it looks like, before the news announcement, the market is in a pullback mode, and this is the perfect scenario for going ‘long’ in the market. As the impact of Core CPI is high, it could turn the market either way; hence it is safer to wait for the news release and then a suitable position in the market.
After the news announcement is made, we see that the volatility expands on the upside, which takes the currency higher. This could essentially be the confirmation sign for trend continuation, and we can now enter for a ‘buy’ with a stop loss below the recent ‘low.’ Since there was no reduction in Core CPI numbers, it resulted in being positive for the U.S. dollar, and thus we see a bullish candle after the news release.
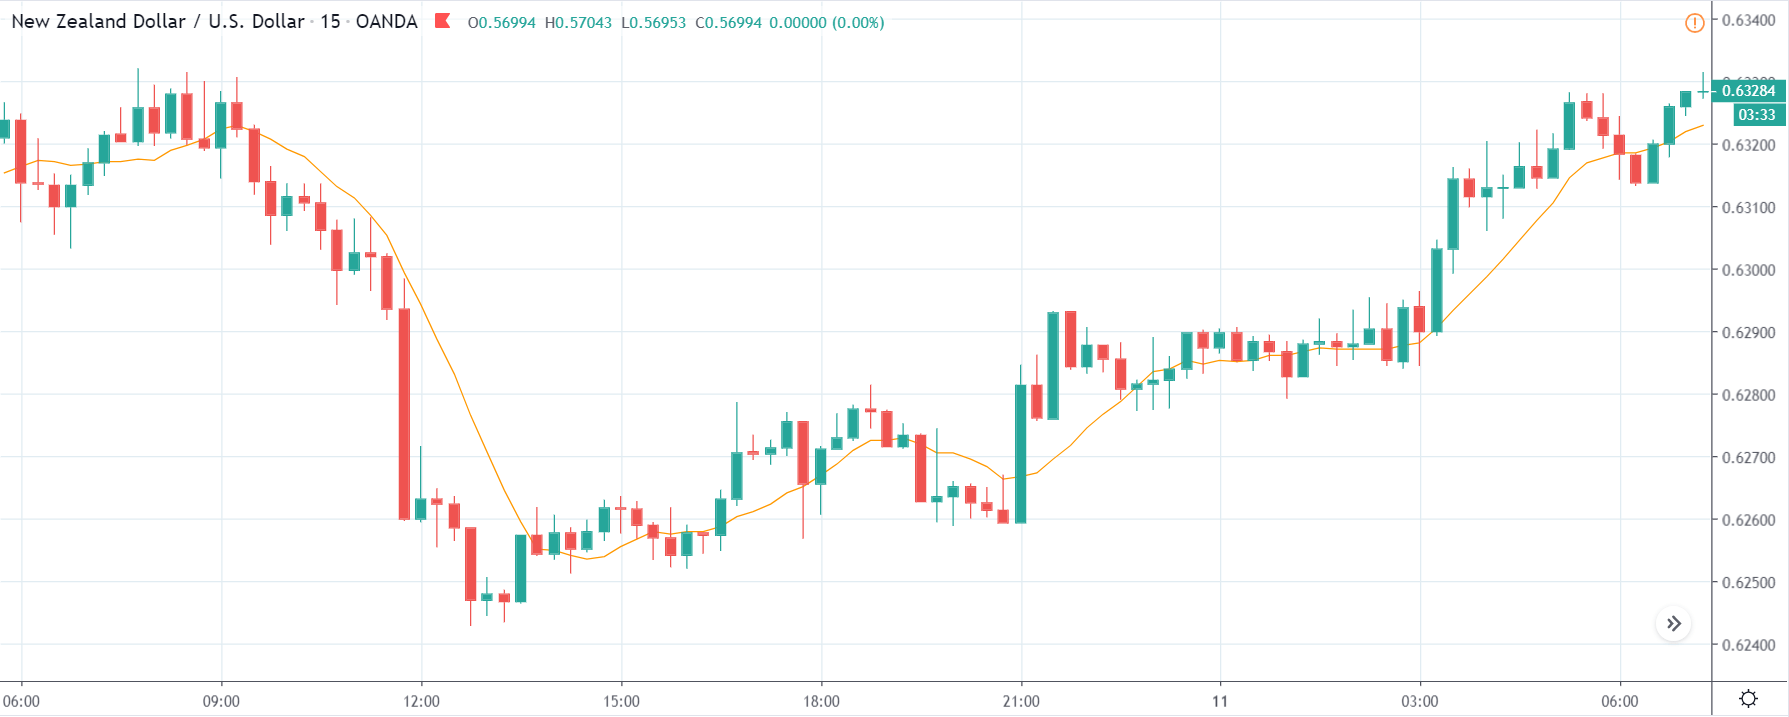
NZD/USD | Before The Announcement
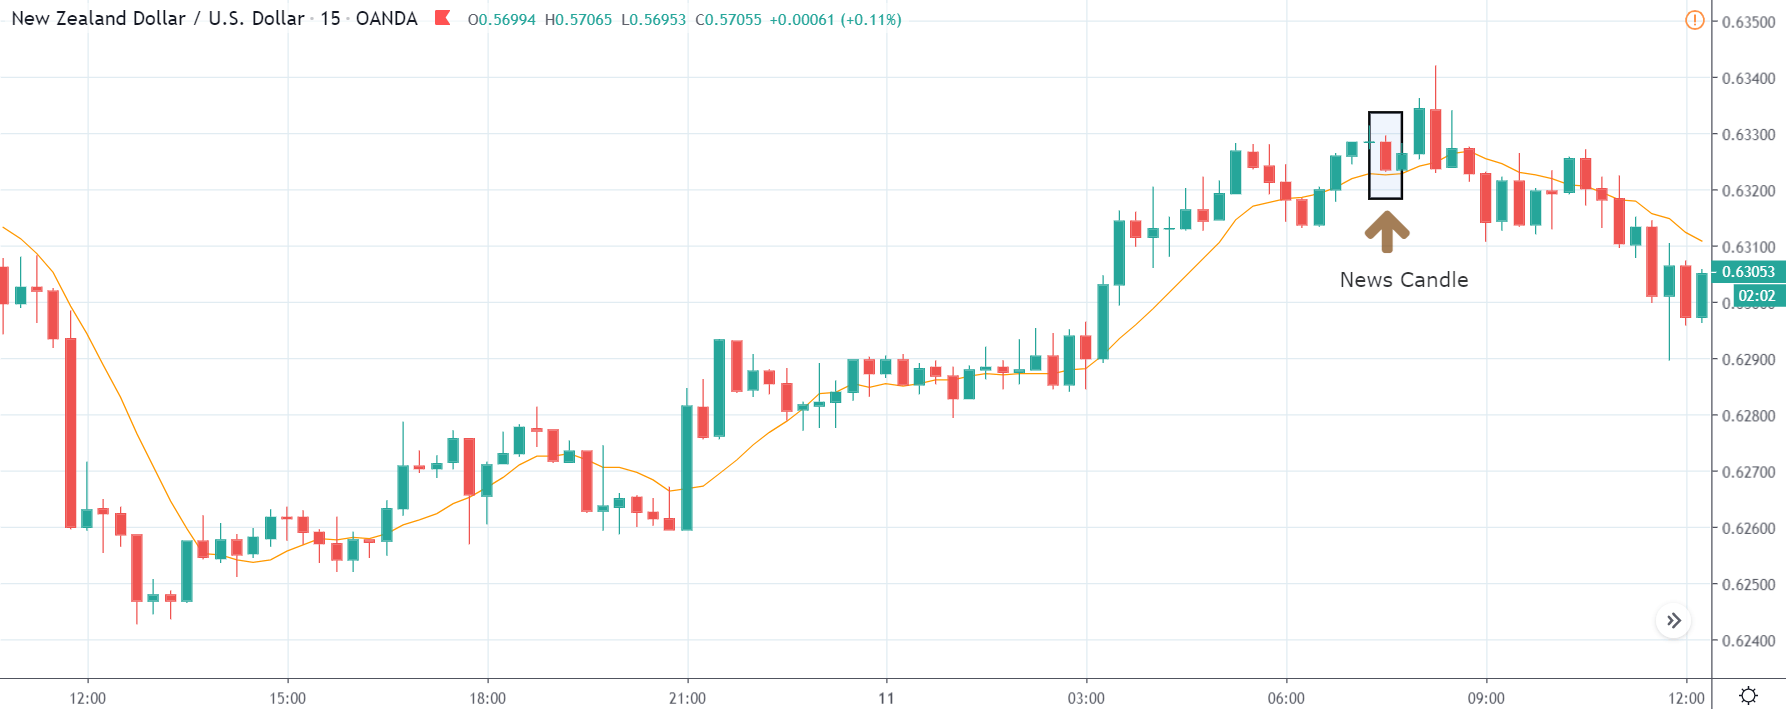
NZD/USD | After The Announcement
Here, in NZD/USD currency pair, before the news announcement, we see an uptrend, and since the U.S. dollar is on the right-hand side, it shows the excessive weakness of the same. The behavior of this chart is different from that of the above-discussed pairs due to the strength in the New Zealand dollar.
Therefore, only a significant increase in the Core CPI can result in a reversal of the trend else we can witness volatility on both sides. Since the news announcement was mildly positive for the U.S. economy, the price drops but not enough. Hence, we can conclude that the news release did not cause much volatility in the pair, and the current trend is still intact.
That’s about ‘Core Consumer Prices’ and its impact on the Forex price charts after its news release. If you have any questions, please let us know in the comments below. Good luck!


