Categories
Forex Fundamental Analysis

Everything About ‘Harmonized Consumer Prices’ Macro Economic Indicator

Introduction

Harmonized Index of Consumer Prices (HICP) is the go-to indicator for monitoring inflation statistics in the European Union (EU). Inflation reports are vital for the currency markets, as inflation directly erodes currency value. Hence, domestically and internationally, inflation statistics play equally critical roles in currency valuations. Understanding HICP is mandatory for building fundamental analysis related to the European Union countries.

What are Harmonized Consumer Prices?

Harmonized Index of Consumer Prices (HICP)

It is a list of the final price paid by European end-consumer for a basket of commonly used goods and services. Like the United States has the Consumer Price Index (CPI) as a means of regularly measuring inflation levels month over month, the European Union (EU) has HICP. The average change in the price of the selected goods and services gives us a clear idea about the inflation rates in the EU.

The HICP differs from United States CPI because it takes inflation data from each member nation of the European Central Bank (ECB). It is also a weighted index, meaning that goods are given a specific weightage based on demand, or how essential and frequently used by the consumers. The consumer goods basket is derived from data of both rural and urban areas of each member nation.

How can the Harmonized CP numbers be used for analysis?

The Harmonized Index of Consumer Prices (HICP) is measured and given by each of the European Union (EU) member states. European Union is a political and economic union of 27 states located primarily in Europe. It is given out to measure inflation and help the European Central Bank (ECB) to form monetary policies accordingly if required. Every member country’s HICP measures the shifts over time in the prices of the basket of selected goods and services purchased, used, or paid for by households of that nation.

The “commonly used goods and services” include coffee, meat, tobacco, fruits, household appliances, electricity, clothing, pharmaceuticals, cars, and other commonly used products. It is also worth mentioning that the index excludes owner-occupied housing costs.

The HICP is also used for the Monetary Union Index of Consumer Prices (MUICP), an aggregate measure of consumer inflation for all countries of the eurozone. The eurozone represents all countries of the European Union that have incorporated the Eurodollar as their national currency. The primary aim of HICP is to maintain price stability. It defines the stable inflation rate in the euro area as below two percent annually.

Amongst HICP and MUICP, the HICP is a broader measure of inflation, but for trading, traders would prefer MUICP as it tells about the inflation concerning the European Dollar (EUR). The MUICP is calculated by selecting HICP from the eurozone countries only. All the member nations use the same methodology to calculate their respective HICP, enabling them to compare with each other and easily calculate the MUICP directly.

The selected goods and services are updated annually to account for the changes in consumer spending patterns. Each country’s weightage represents its consumption expenditure share in the entire euro area.

Inflation is the fuel that drives the economy. It is a double-edged sword, too much inflation erodes currency value, and citizens become poorer, and too low causes deflation, which slows the economy making money “costly.” A low and steady inflation rate is the only solution to keep the economy growing for capitalist economies.

When inflation rates fall below the long-term averages, the central authorities may use fiscal (government actions, ex: tax cuts) or monetary levers (central bank actions, ex: lower interest rates) to counter deflation and induce inflation. When the inflation rate is above the long-term rate, it is called hyperinflation, and central authorities may intervene and tighten the belt to deflate the economy. They can raise interest rates, increase taxes to deflate the economy to normal levels.

Inflation statistics like the HICP are coincident indicators as they tell us about the current price inflation. They are affected by leading indicators and policymaker’s responses. The HICP is closely watched by economists, central authorities, consumers, and even traders. In the currency markets, relative inflation can help us predict which currency’s value is eroding relatively faster. Inflation also affects the GDP of the country, which is a primary macroeconomic indicator for currency trading.

Impact on Currency

Currency markets emphasize on leading indicators over coincident indicators to always stay a step ahead of market trends. Coincident indicators confirm the trends rather than predict. Due to this, the impact of the HICP indicator in the market is low. For currency traders, MUICP and currency-specific aggregates are more useful than aggregate metrics like HICP to check inflation. Hence, overall, HICP is a low impact coincident indicator that can be overlooked for more country-specific inflation statistics.

Economic Reports

HICP data is published by Eurostat every month. It is the statistical office of the European Union. A brief estimate for the euro is published at the end of the month, followed by the detailed version containing indices of all member states approximately two weeks later. On the Eurostat page, we can find monthly, annual data, a detailed listing of country weights, item weights, prices, etc.

Sources of Harmonized Consumer Prices

We can know more about HICP in detail from the European Central Bank’s official website and the official data on the Eurostat page. We can find the consolidated monthly reports of HICP on Trading Economics.

Harmonized Consumer Prices – Effect on Price Charts

The Harmonized Index of Consumer Prices (HICP) is a coincident indicator. In essence, this indicator does not predict the future price action of currency but is coincident with it. Typically, metrics such as MUICP and other price reports induce volatility in the market. But HICP alone does not increase the volatility of the market.

Impact

The data is exclusive to the European Union and is released by the Federal Statistical Office. The impact of HICP on the currency market is negligible.

Harmonized Consumer Prices Report June

Below is the report of HICP for the month of June released in July. As per the data, the HICP increased from 108.47 to 108.58.

EURUSD – Before the Announcement

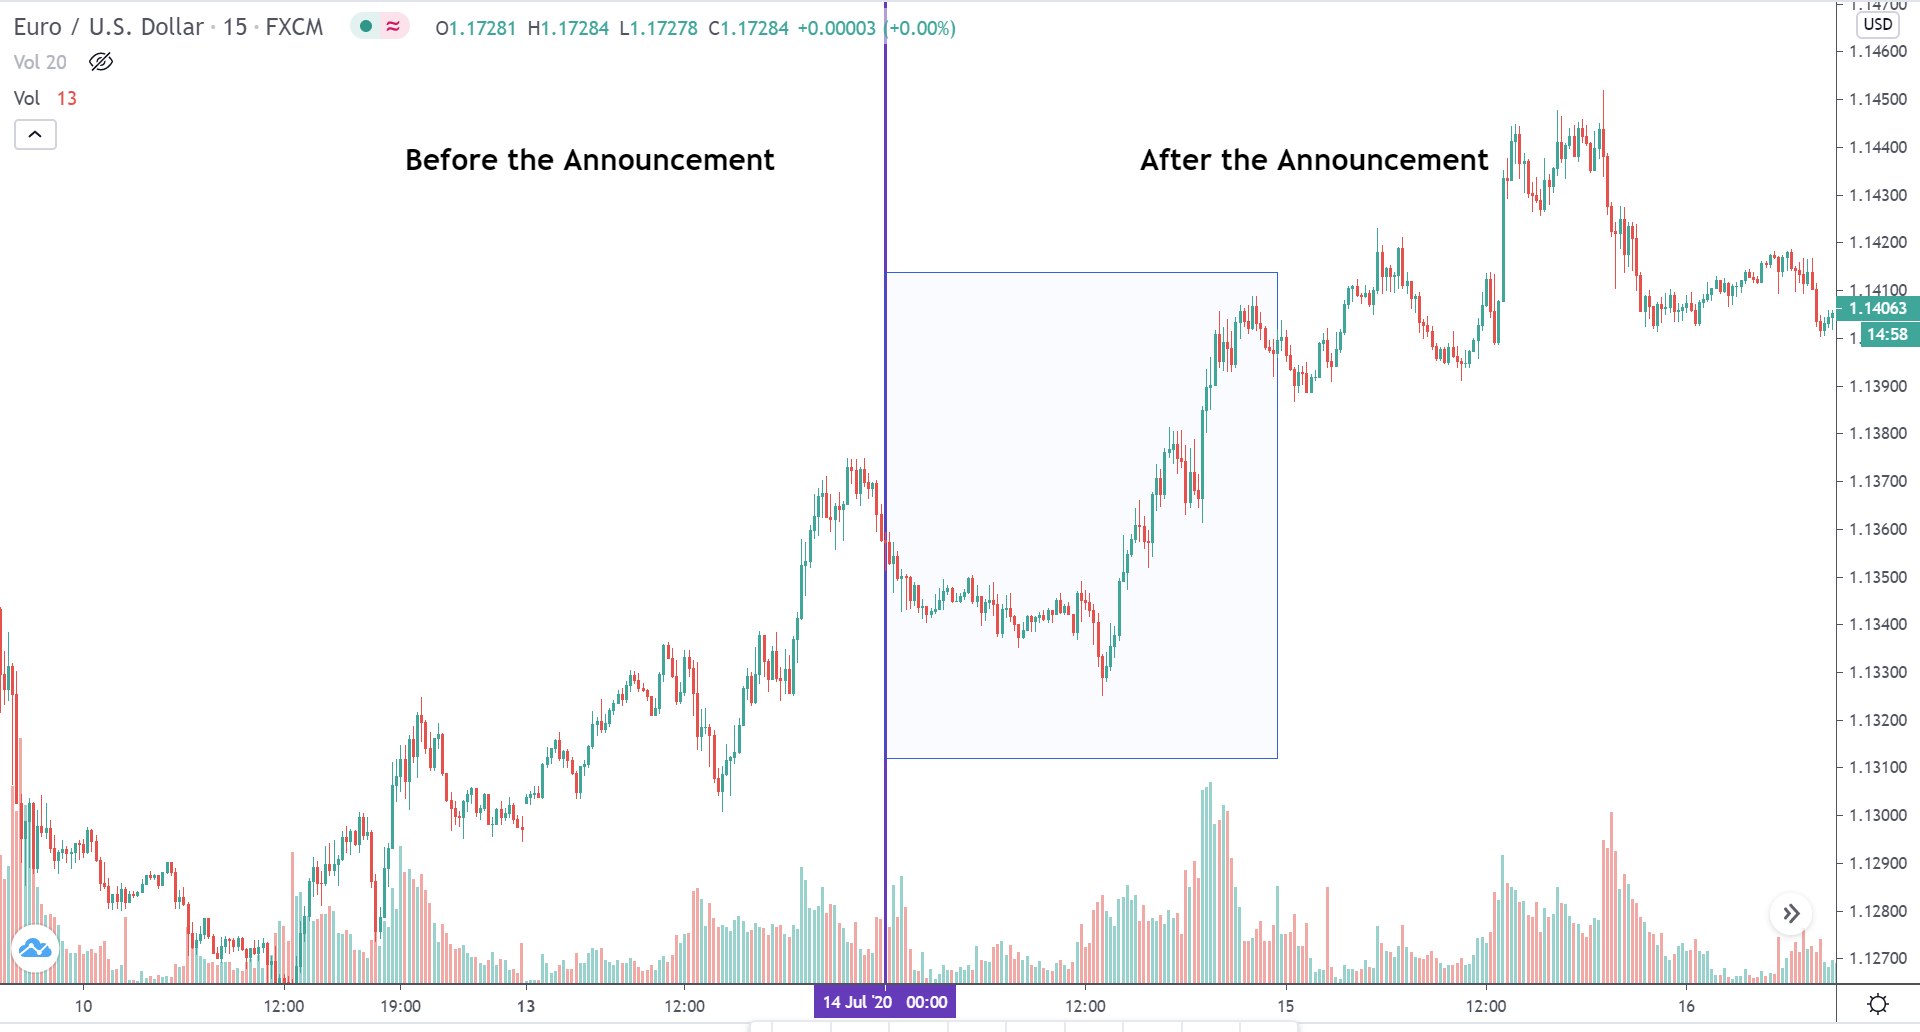
Before the announcement of the report, the market was in an uptrend making higher highs and higher lows.

EURUSD – After the Announcement

On the day of the announcement of the report, the prices retraced in the first half of the day and shot north aggressively and made a new higher high during the New York session. On the volumes side, there was feeble volatility in the Asian and European sessions, while it increased with the open of the US markets. That said, the increase in the volatility was not abnormal, which is typically seen during the release of major economic reports.

EURAUD – Before the Announcement

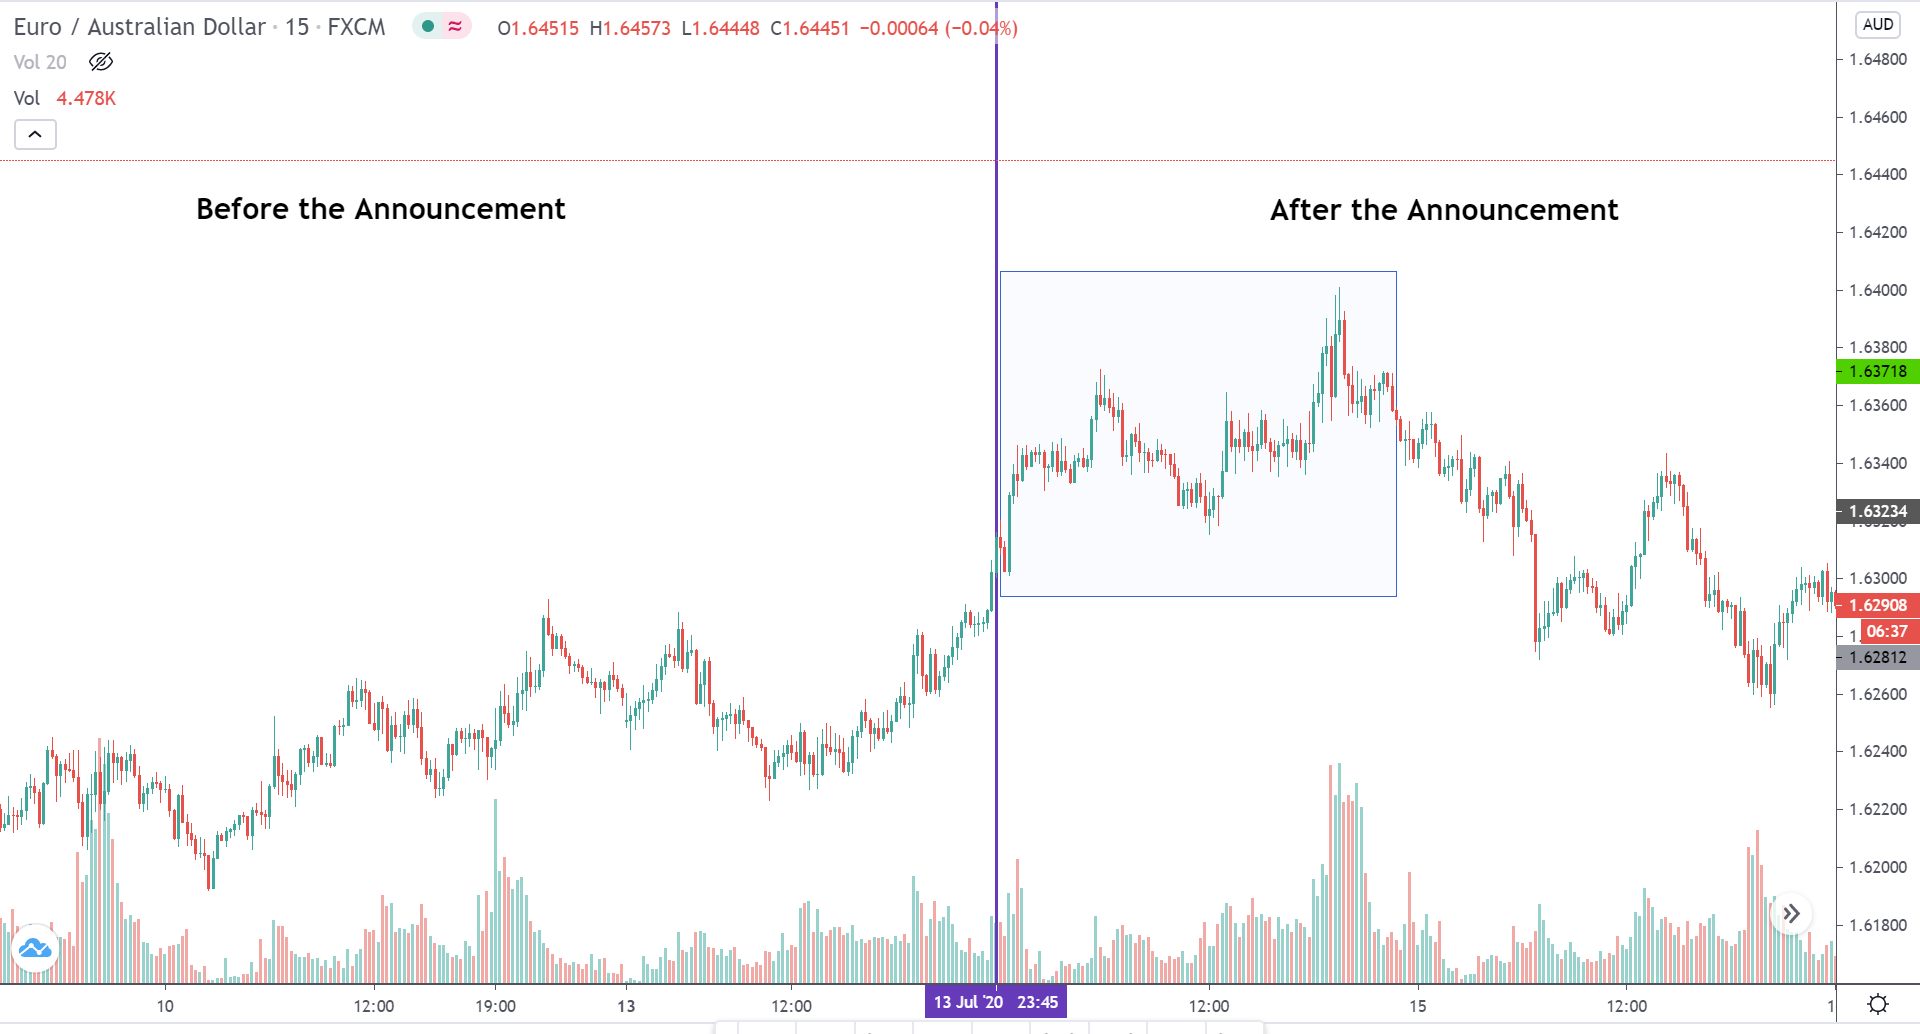
Before the report was released, the market was moving in an inclined channel showing EUR strength.

EURAUD – After the Announcement

After the report came out, the price break through the channeling market and began to trend. By the end of the day, the EURAUD price was up 0.65% from the previous day. This bullishness could perhaps be from the incident HICP report. However, the subsequent day, the market lost all its gains.

EURNZD – Before the Announcement

Prior to the announcement of the report, the market which was consolidating had begun to show mild bullishness.

EURNZD – After the Announcement

On the day the news was announced, the price continued to rise higher and higher for the entire day. In fact, EURNZD outperformed both EURUSD and EURAUD. There would be several factors that could’ve inflated the price, but a moderate effect could be through the positive HICP news. On the volatility side, there was no aggressive rise in volatility. However, the volume significantly increased during the North American session.

Thus, traders can analyze the technical factors of the market and open positions without any hesitation from the HICP report. That said, conservative traders may wait for the reports to be released, and then enter if the report is in favor of their speculated direction.

Categories
Forex Fundamental Analysis

The Momentous ‘Consumer Price Index’ & How It Impacts The Forex Market

Introduction

Consumer Price Index, in short, known as CPI, is one of the most closely watched Fundamental Indicators. It is the most direct measure of the current inflation in the economy that a citizen can look at and find out. Hence, Understanding the Consumer Price Index, its history, and the resultant effect it has on the market is very important to build an understanding of the macroeconomics of a nation.

What is the Consumer Price Index?

As the name suggests, the calculation of this index is from the viewpoint of the end consumer, i.e., a regular citizen who buys his/her daily needs from a local grocery store or market. Consumer Price Index, in the simplest sense, is the average of the most commonly purchased household goods and services like toothpaste, milk, grocery, petrol, etc. But instead of a simple average here, each good and service is assigned a certain weightage based on their importance or usage degree amongst the population.

For example, milk, which is a daily need for many consumers, will have a higher weightage in the mean price calculation than that of furniture, which we do not purchase daily or frequently. Also, when we say most commonly purchased goods and services, it covers a wide range of goods and services (over 80,000 items) and does not include rarely purchased items like stocks, bonds, foreign investments, or real estate.

How is the Consumer Price Index CPI calculated?

The Bureau of Labor Statistics (BLS) surveys the prices of 80,000 consumer items to create the index and publishes it monthly. The Consumer Price Index has two subcategories; one is CPI-W, which stands for Consumer Price Index for Urban Wage Earners and Clerical Workers. CPI-W statistics are published first, and later the CPI-U (Consumer Price Index for Urban Consumers) values are released. CPI-U is a broader statistic in terms of population and goods & services coverage.

CPI-U is the more accurate and complete statistic relatively as it takes the urban population, which represents about 93% of the United States population into account. While the CPI-W covers only about 29% of the population. Hence, It is the measure of an aggregate weighed in the price level of most commonly bought goods and services. The list includes items like food, clothing, shelter, fuel, transportation fares, service fees (water and sewer service), etc.

Consumer Price Index, whenever released, is given out as a percentage change, and here the change is concerning the previous number, which can be monthly, quarterly, or yearly.

Note: Here, the base year cost amounts to 100, and this base year is in the year 1982 to 1984, where the average amounted to 100. But the data released monthly is shown as a percentage increase or decrease concerning the previous period (usually the previous month).

Why is the Consumer Price Index important?

The importance of the Consumer Price Index is many-fold. First are the range and history of the data. With such a huge data set, the reliability is pretty high, and it usually depicts the macroeconomic picture of a country. For example, the history of CPIAUCSL (Consumer Price Index for All Urban Consumers: All Items in U.S. City Average) goes all the way back to 1947. Second is the frequency & direct ground-level nature of the statistic meaning this data brings out. CPI is a real-time reflection of the current economic situation faced by the end customer or citizens.

Thirdly, the change in CPI is useful to ascertain the retail-price changes associated with the country’s cost of living. Hence it is used widely to assess inflation in the United States. In this Index, there are many subcategories, wherein certain goods and services get included or excluded from the basket to give a more accurate picture of inflation in absolute or relative terms. For example, Core CPI strips away food, gas, and oil prices from the equation as the prices of these items are relatively volatile.

How can the Consumer Price Index be Used for Analysis?

Due to the diversity in the statistics, different sectors of economists can isolate and use the Consumer Price Index for their purpose. For example, the United States Bureau Of Labor Statistics provides indexes based on various geographic areas also. Moreover, they even release average price data for select utility, automotive fuel, and food items, which gives this Index the status of a key indicator in gauging multiple economic indicators.

Consumer Price Index is a widely used indicator for inflation measure. For other economic indicators like hourly wages and currency worth within the nation (dollar’s purchasing capacity to procure goods and services), CPI can be considered as a regulator. On average, for a developed nation like the United States, 0.2-0.5% of Consumer Price Index increase is common, and any number beyond these figures usually indicates volatility in the growth of the economy in either direction.

Sources of Consumer Price Index

The U.S. Bureau of Labor Statistics releases all the indexes that are mentioned above. This data can be found here – Consumer Price Index

You can also find the same indexes along with many others with a comprehensive summary and statistics on the St. Louis Fed website as given below.

CPIAUCSL (CPI for All Urban Consumers: All items in U.S. City Average)

This is a broadly used statistic for measuring the overall inflation. It includes Food and Energy prices, unlike CPIFESL. The information related to this index can be found here.

CPIFESL (CPI for All Urban Consumers: All items minus the Food and Energy in U.S. City)

It excludes volatile components like Food and Energy (Oil Prices) and gives more of a Core CPI change within the United States. The information related to this index can be found here.

Impact due to news release

In this section of the article, we will analyze the impact of the Consumer Price Index (CPI) on a currency right when the announcement is being made and see where the market finally gets to. The image below shows that the CPI data has a huge impact (Red box indicates high impact) on the currency, which means it might cause a drastic change in the volatility after the news announcement. Ideally, if the actual CPI numbers are greater than the forecasted numbers, it is good for the currency and vice versa.

We have taken the recent CPI data of Australia, which is quarter-on-quarter. The quarterly data is more important and impactful than the monthly numbers. The below image gives the 4th quarter data of CPI that was measured in January, and the next quarter data will be released in April. We see below that the CPI data for the 4th quarter was 0.7%, which is 0.2% greater than the previous reading. It is also 0.1% greater than the forecasted number. But, let us see how the market reacted to the data.


AUD/USD | Before The Announcement

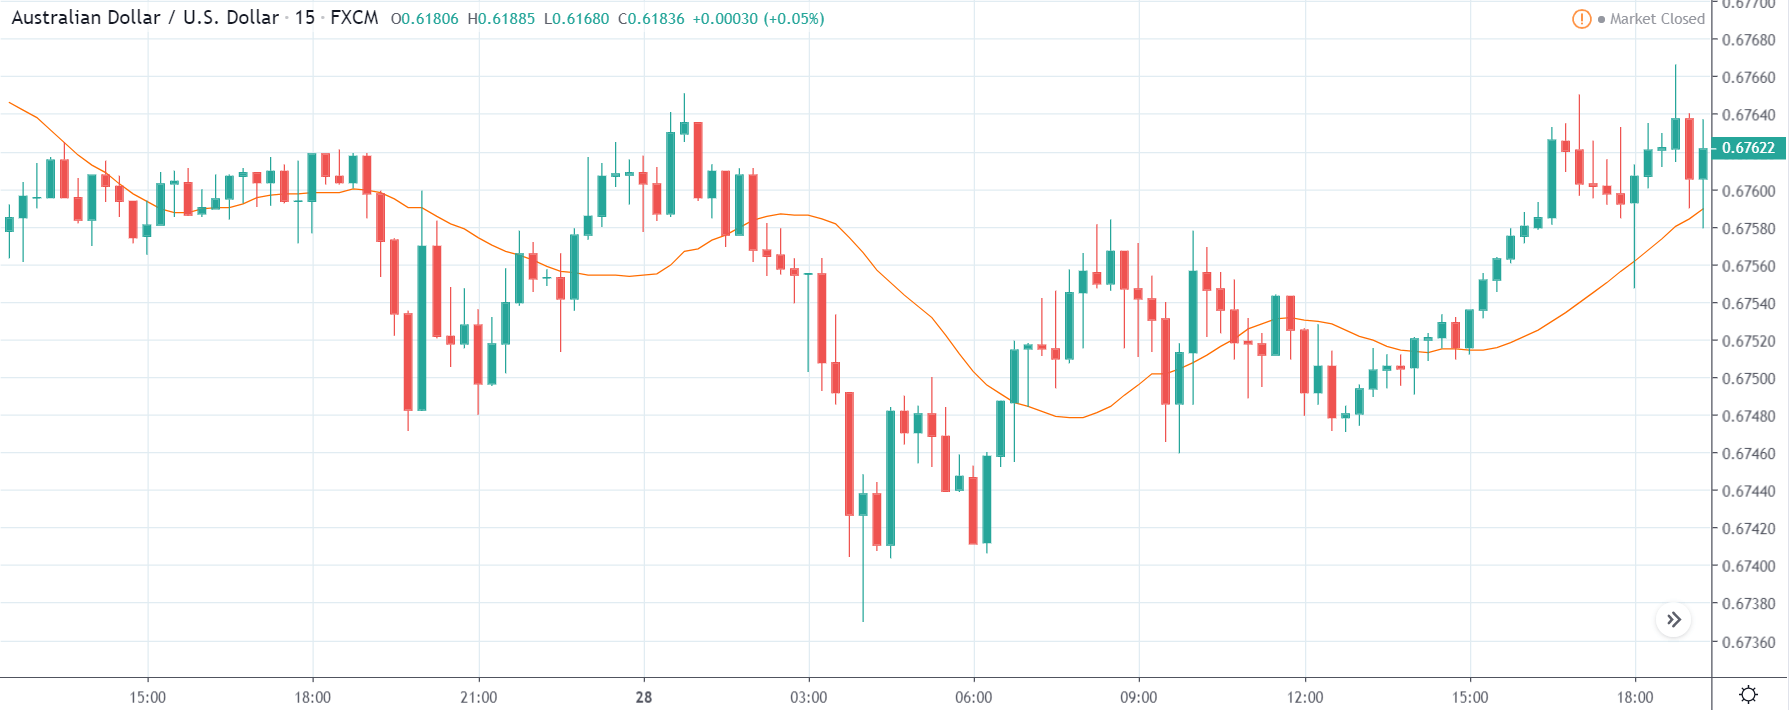
The above image represents the chart of AUD/USD, where we see that the market is in an uptrend showing the strength of the Australian dollar. One of the reasons behind the uptrend is that traders and investors forecast the CPI data where they are expecting a 0.1% increase in the same. If the CPI numbers are increased more than expected by the ‘Australian Bureau of Statistics,’ it could be the best-case scenario for going ‘long’ in the market. However, if the numbers are below expectations, volatility could increase on the downside.        

AUD/USD | After The Announcement

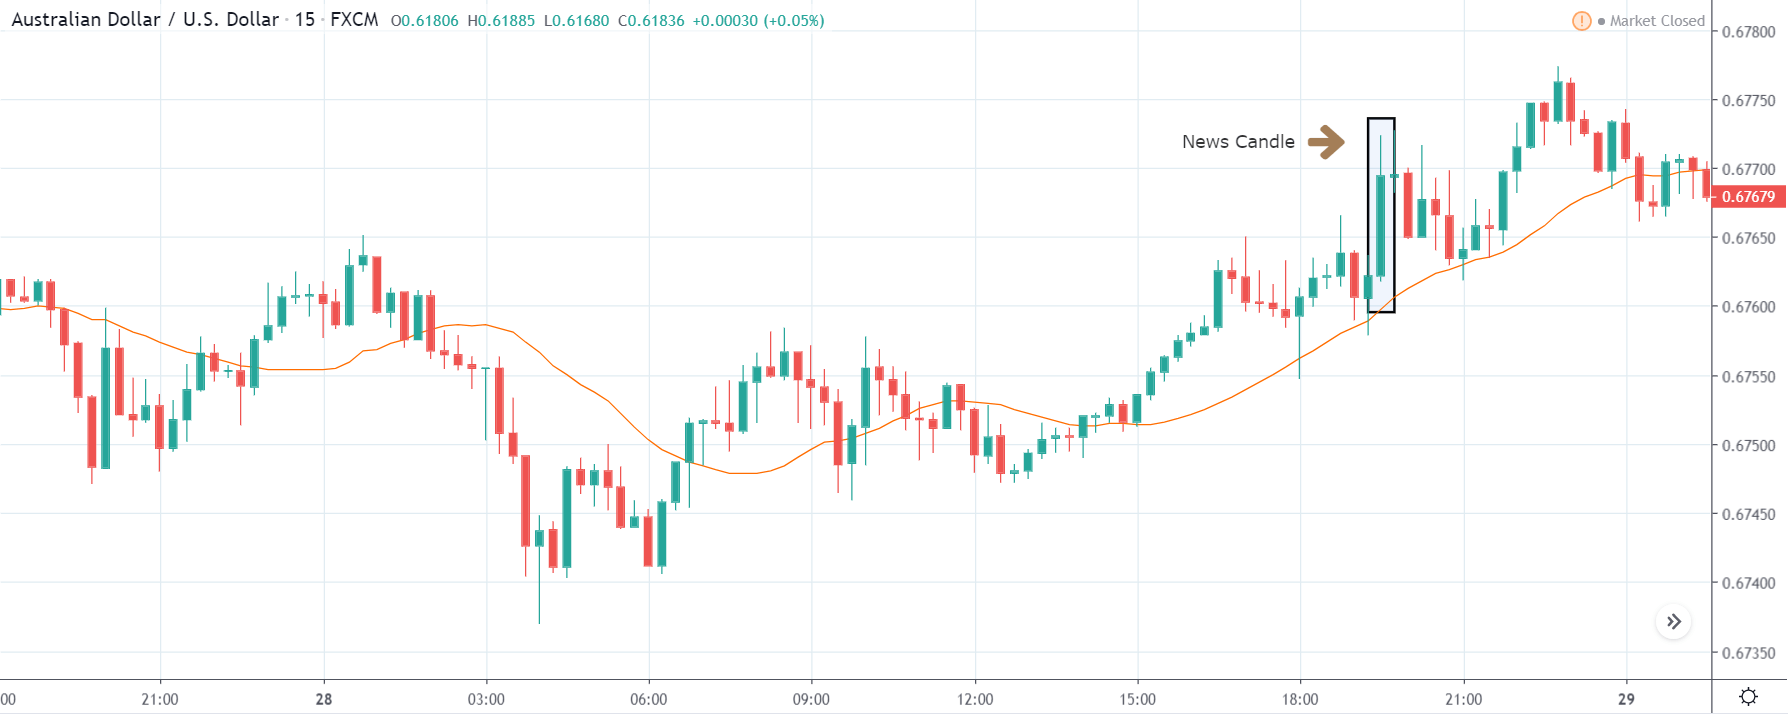
Here, we see a sudden surge in volatility on the upside that after the news announcement is made. The reason for this is that the CPI got increased by 0.2%, where the market was expecting a 0.1% rise. The large green candle shows how impactful the CPI data is on the currency. From a trading point of view, one should not be chasing the market but instead, wait for a pullback at the nearest support and resistance area and then take suitable positions. The CPI data was so positive for the Australian dollar that the price does not even come below the moving average. Take Profit‘ for the trade can be at the new ‘high’ with a stop-loss below the opening of the news candle.

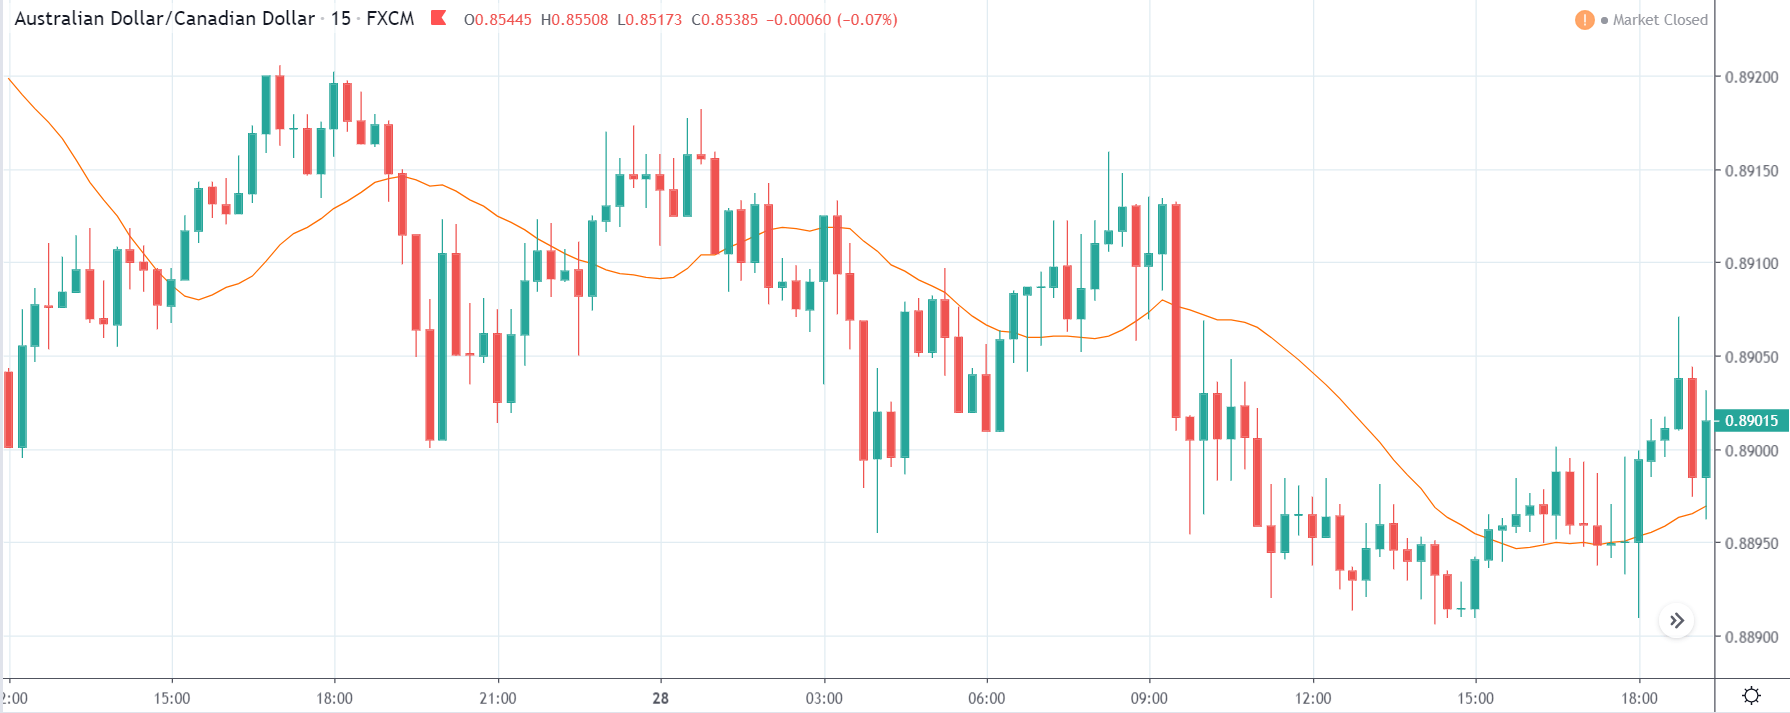
AUD/CAD | Before The Announcement

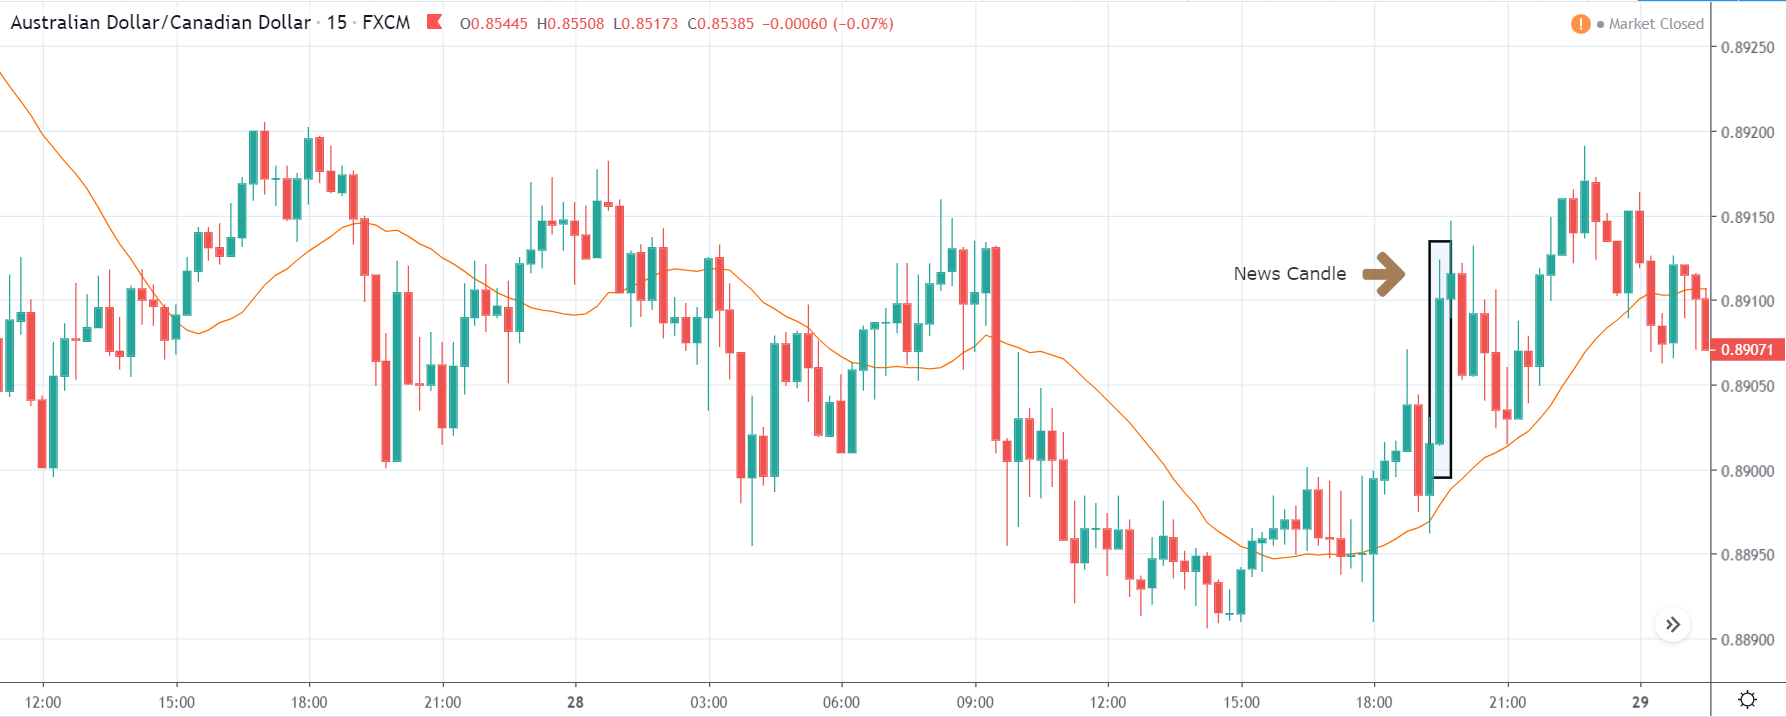
AUD/CAD | After The Announcement

The AUD/CAD currency pair appears to be in a ‘range’ just before the news announcement and is at the bottom of the range. An interesting way of positioning ourselves in the pair is by having small ‘buy’ positions before the news announcement. Because the forecasted CPI data is greater than the previous reading, and we are at a technically important level that is supporting our ‘buy’ positions. The news outcome makes the ‘support’ area work beautifully as the market shoots up to the resistance area. Here too, the data proved to be very positive for the Australian dollar as a higher CPI data drives the currency higher. We can hold on to our trades even if the price is at ‘resistance’ since the news data is very good for the currency, and it has the potential to break the ‘resistance’ and move further.

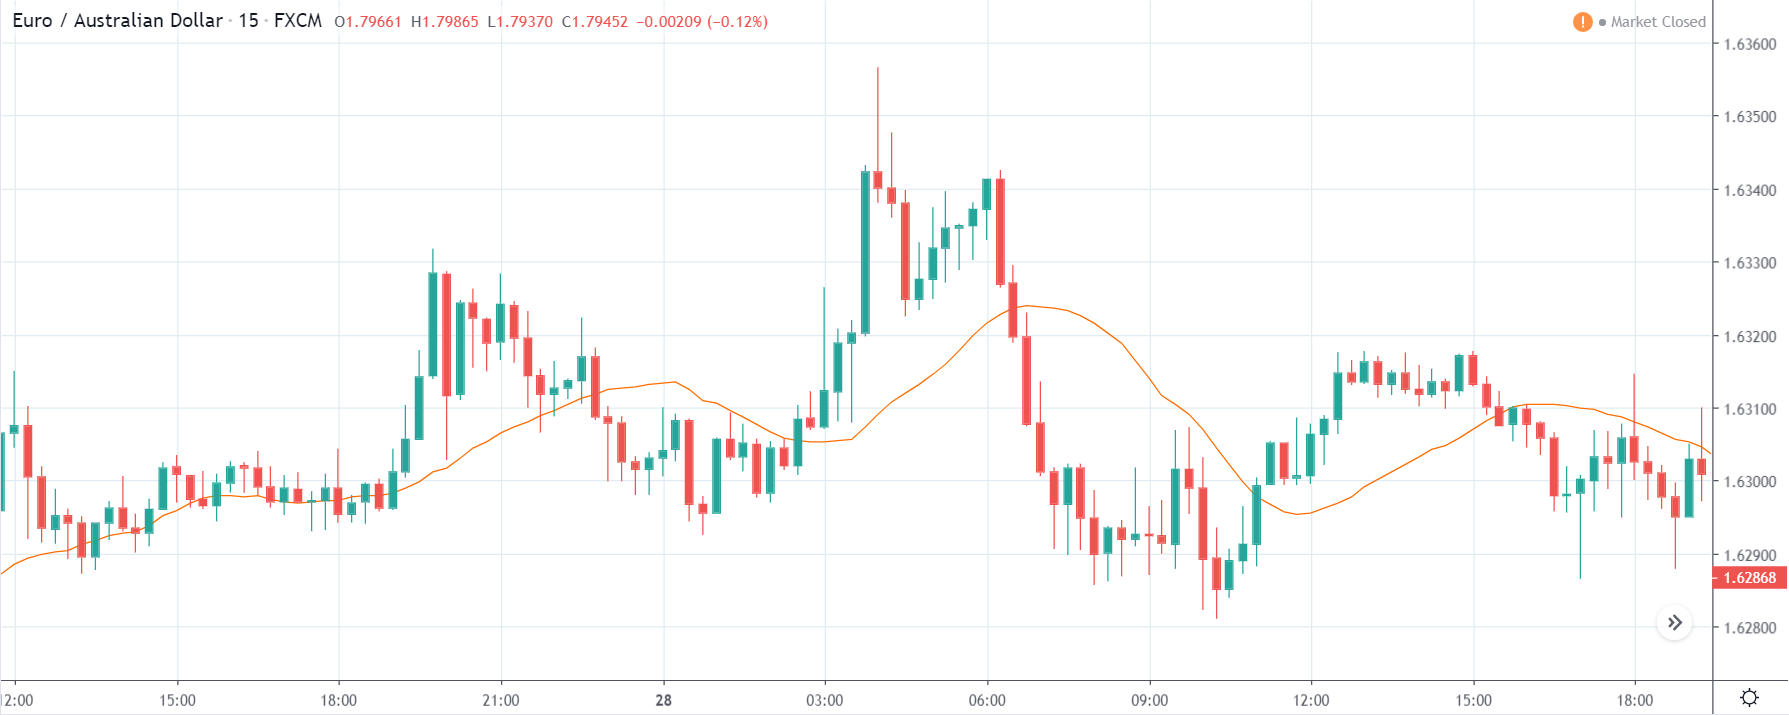
EUR/AUD | Before The Announcement

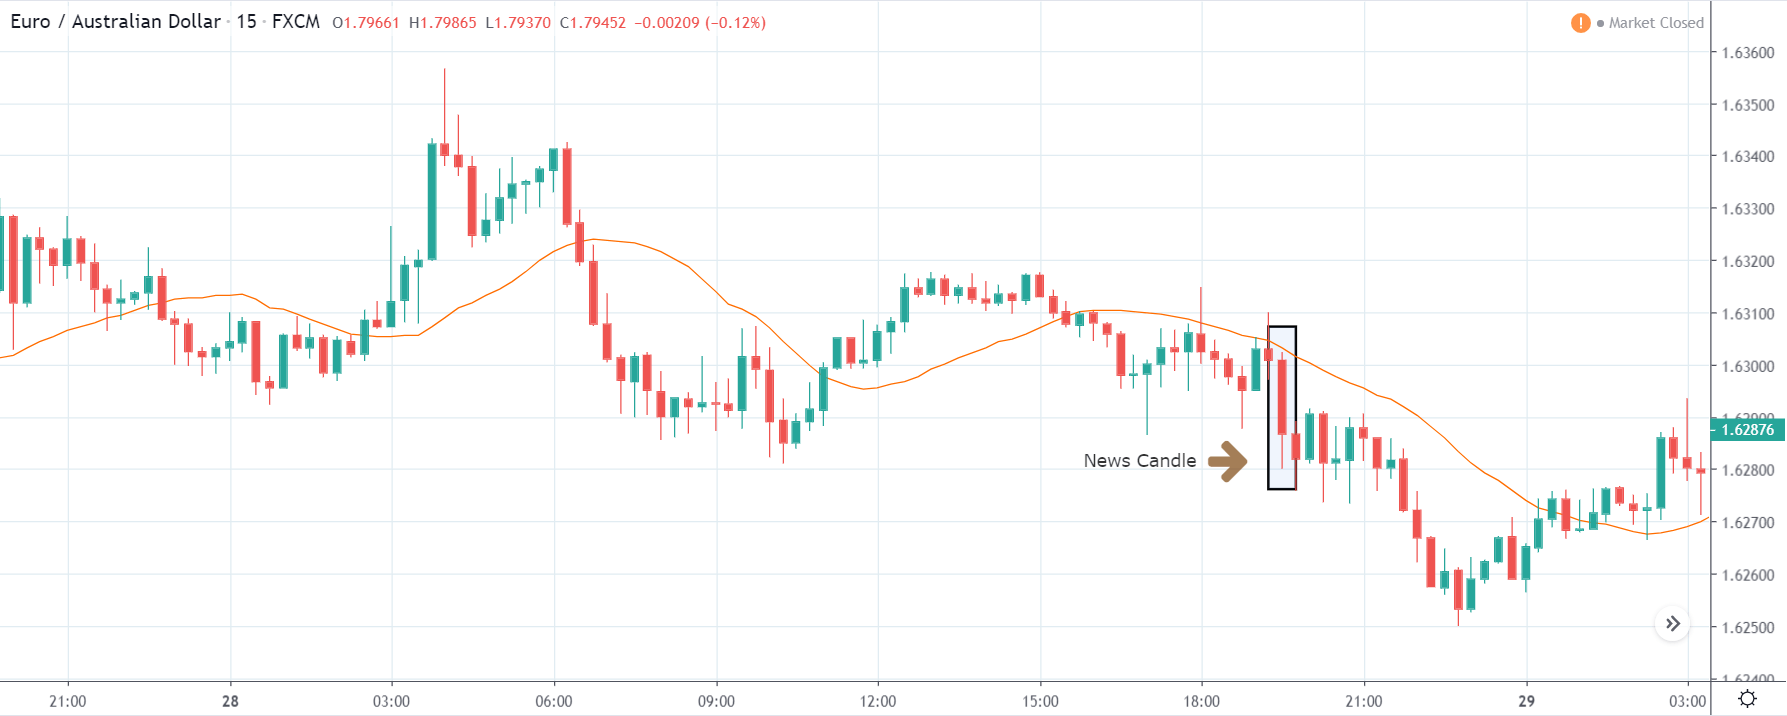
EUR/AUD | After The Announcement

In this currency pair, the Australian dollar is on the right-hand side, which means a positive CPI data should take the currency lower. We can see that the Australian dollar already strong as the market is in a downtrend, and the market participants are optimistic about the CPI data of Australia. After the CPI announcement, the volatility increases on the downside, taking the price to a new ‘low.’ Again, when we witness better than expected data of any economic indicator, we should not be chasing the market but wait for a retracement to key levels. In this case, since we don’t see a retracement after the red ‘news candle,’ only aggressive traders can take ‘short’ positions with the confidence that the CPI numbers were exceedingly better than before and that it will take the currency lower.

That’s about CPI and its impact on the Forex market. We hope you find this information useful and if you have any questions, shoot them in the comments below. Cheers.