Categories
Forex Fundamental Analysis

Do You Know That The ‘Car Production’ Data’s News Release Impacts The Forex Price Charts?

Introduction

Car Production figures are used by economists and investors as a measure of wealth per capita. Among all the Industrial Production figures, which covers different sectors, Automotive industry production figures’ implications are different from industries producing essential goods like (Food, daily needs goods). An increase in vehicle production is indicative of an increase in per capita income, and other economic conditions. Hence, individual analysis of Car Production figures can help investors, and economists to analyze economic health, and standard of living in the country.

What is Car Production?

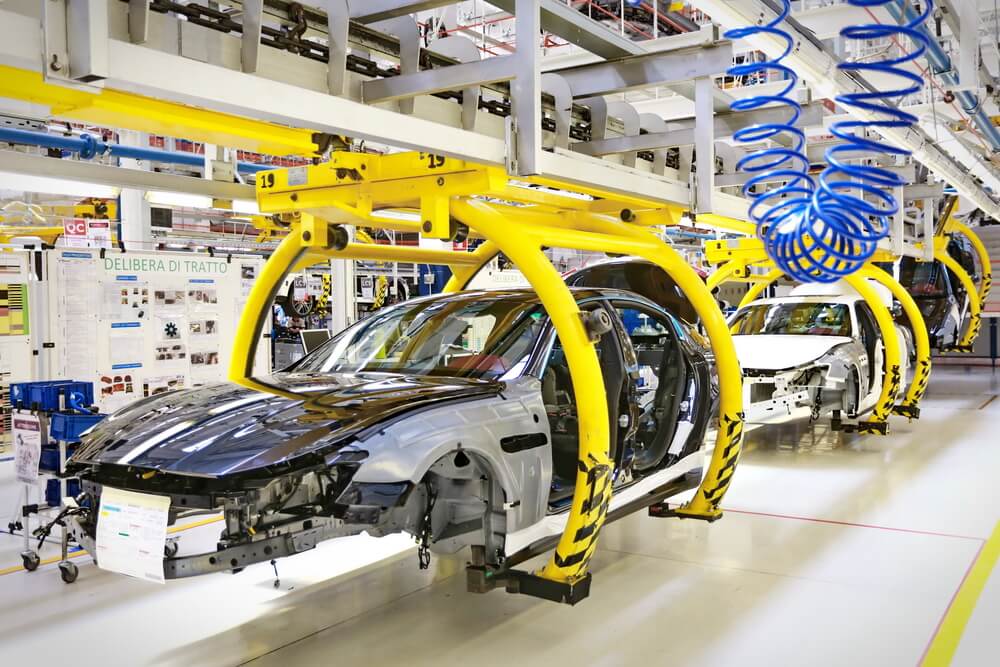
Car Production is the total Auto output of Automative Industries in a given economic region for a specific period. The number of motor vehicles manufactured is assessed and categorized based on the type of vehicle. A typical automotive industry would generally have multiple classes of vehicle manufacturing ranging from 2-wheeler bikes to 18-wheeler trucks. Car Production statistic is the production of Cars (called Auto in the statistics) and excludes Trucks and two-wheeler bikes.

In this statistic, Car Production has a separate and special significance. Consumers make up 66% of the private sector, and businesses make up 34% in the United States. Owning a car is more important to people than owning a house. In today’s mobile world, with different modes of transportation available, the car is still an essential expense for the average public. 85% of the Americans own a car, which indicates its significance in day-to-day life. We cannot deny the importance of having a car for commuting as per our convenience.

How can the Car Production numbers be used for analysis?

In the developing economies like India, the number of households that own a car is just 11% as per a survey in 2016, which is a 200% increase from its previous survey in 2011, where it was only about 5%.

Hence, Car Production can be used to draw multiple conclusions, which are as follows:

Standard of living: As the standard of living increases, more and more people can afford luxury goods. While owning a car might not seem like a luxury, but for the developing economies, it does. Also, the range of cars today that are available for purchase, it mirrors the wealthiness of the economy.

Dependent Industries: A car production typically involves several parts that are obtained from other industries, like the car body requires steel, tires require rubber, etc. Hence, Steel Production figures are influenced by the demand from Car Production figures. One-fifth of American Steel Production and three-fifths of rubber manufactured goes to the Automotive Industry. Machine tools, petroleum refining technology industries, paint, plate-glass industries are all stimulated through the Automotive industry.

Indirect Dependent Industries: Increased Car Production signals more cars or vehicles are going to be on the road, or need to be delivered, which brings business for freight operators, and road construction firms. As traffic increases, Fiscal policymakers intervene and fund road projects to build a better network of highways to solve this issue.

Investors can look at Car Production figures and analyze the stimulus it brings on industries dependent directly or indirectly. For example, a general trend in the local production of Cars increase can signal that a construction company like L &T could obtain a contract for road betterment, or a tire company like MRF could see a spike in their business due to increased demand. The cause-effect analysis can help investors make the right stock decisions.

Car is a convenience and not essential like Food. But it has gained the status of an essential item in developed economies. While the developing economies are also getting there, economists can see the changes in Car Production figures. By doing this, they can understand the change in spending patterns of consumers from saving to purchasing Cars. If these numbers increase, it is an indication of an increase in consumer sentiment, business sentiment, employment, wage growth, an increase in disposable income, or improvement in the standard of living.

In the United States, the Car Production figures are part of the Industrial Production reports. The Industrial Production figures tell the overall macroeconomic picture, about how business production and capacity utilization is increasing but does not tell us what sectors growth are increasing or decreasing and its corresponding implications. Car Production figures, in this sense, paints a better picture.

For example, an increase in Coal production could only imply an increase in exports, which is good for the economy, but an increase in Car Production figures indicate more and more people are coming into the middle-class from lower sections and can afford cars. It implies that the overall standard-of-living is increasing.

Also, the automotive industry is a vital element in many industrialized economies like the United Kingdom, France, Germany, Japan, etc. where healthy amounts of Car Production is essential to maintain International Trade balances.

With more and more emerging economies like China, India, Japan, etc. improving their economic conditions aggressively through export-led growth in the international markets, the overall number of people above the poverty rate is increasing, which would ultimately translate into increasing Car Production and Steel Production figures in the upcoming times. The below plot justifies our conclusions above.

Impact on Currency

Car Production statistic is a proportional indicator; meaning increase or decrease in the statistic is followed by currency appreciation or depreciation, respectively. Although, it is essential to note that Car Production is a lagging indicator as the corresponding increase would have already been implicated through leading and coincident indicators like Consumer, business surveys, or improvement in the Disposable Income figures.

Hence, it is a low impact indicator. It is more useful in the long-term understanding of trends and can help investors with stock-portfolio decisions in the stock market having their stake in the dependent industries, which could be affected by the Car Production figures. It can overall act as a double-check for our fundamental analysis but not as a metric to predict future economic growth.

Economic Reports

The “Industrial Production and Capacity Utilization – G17” reports are published at 9:15 AM every around the middle of the month by the Federal Reserve in the United States on its official website. The reports are in the formats of estimates and revised estimates. Under this section, the report titled “Table 3 Motor Vehicle Assemblies” contains the Autos figures, which we are interested in our analysis.

The International Organization for Motor Vehicle Manufacturers also provides an aggregate summary of vehicles produced on its website.

Sources of Car Production

The monthly Car Production statistics are available on the official website of the Federal Reserve for the United States. The St. Louis FRED website provides a comprehensive list of Industry Production, and Capacity Utilization reports on its website with multiple graphical plots, which are available here. We can also find global Car Production figures for various countries in statistical formats here and here.

Impact of the ‘Car Production’ news release on the price charts

In the previous section of the article, we understood the Car Production economic indicator and saw how investors use it for analyzing the economic state of a country. Car Production numbers are a critical component of industrial growth, which highlights the state of the automation sector of the country. The auto industry contributes 3-3.5% to the overall Gross Domestic Product (GDP) and employs a large number of people across different divisions in the industry. Cars manufacturing is a major contributor to this sector, and thus investors give a reasonable amount of importance to this data.

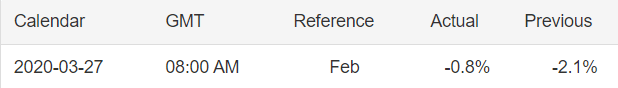
In today’s example, we will be analyzing the impact of Car Production on British Pound, and the below image shows the percentage fall in total production as compared to the previous year. We see that Car Production dropped by 0.8%, which was slightly better than the previous reading. This may be mainly due to slower demand in the local and foreign markets. Let us look at the market’s reaction to this data.

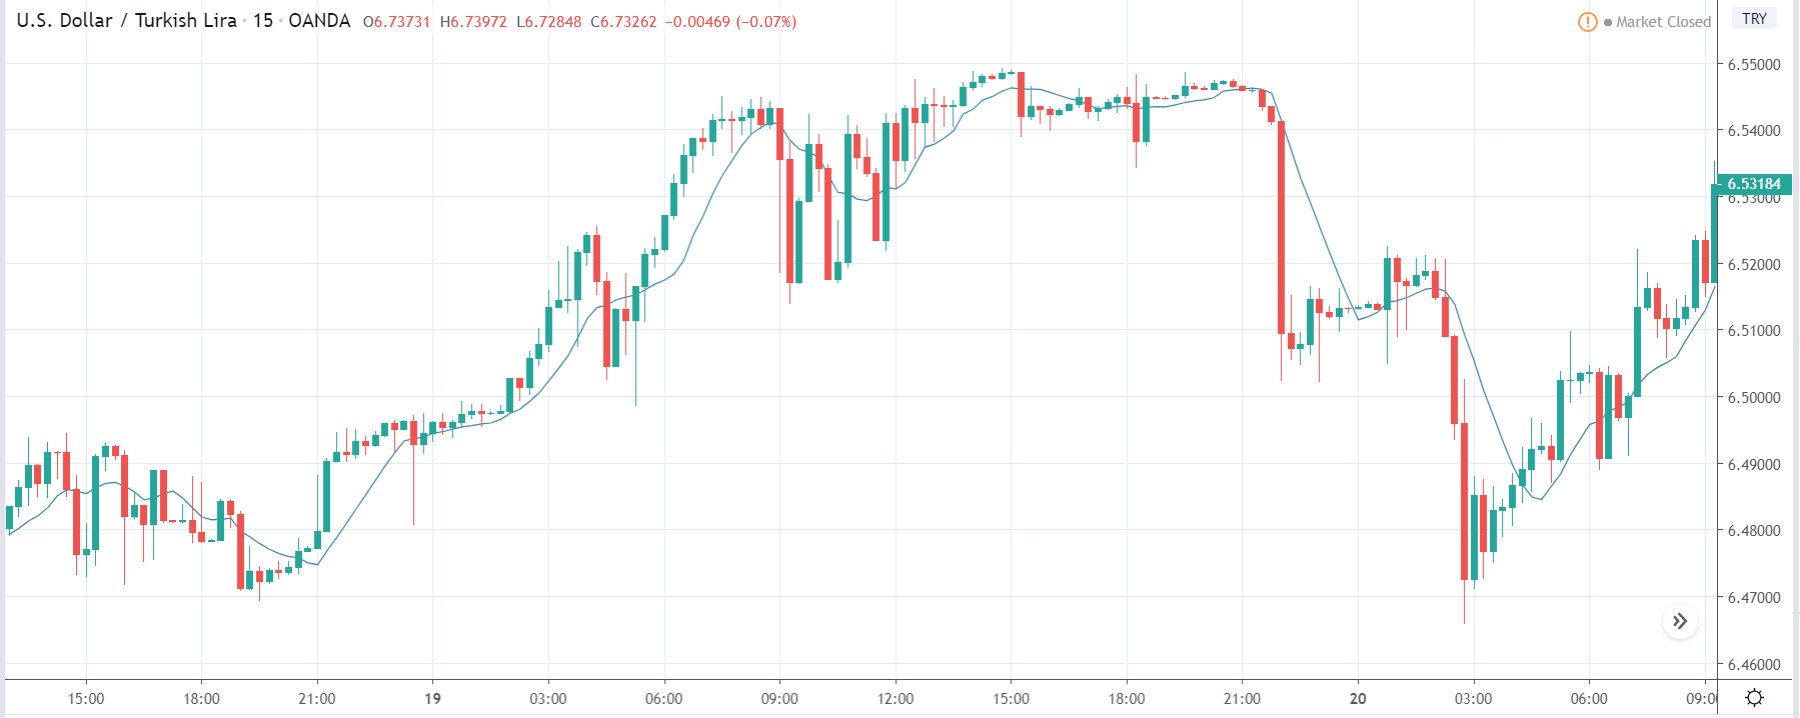
GBP/USD | Before the announcement:

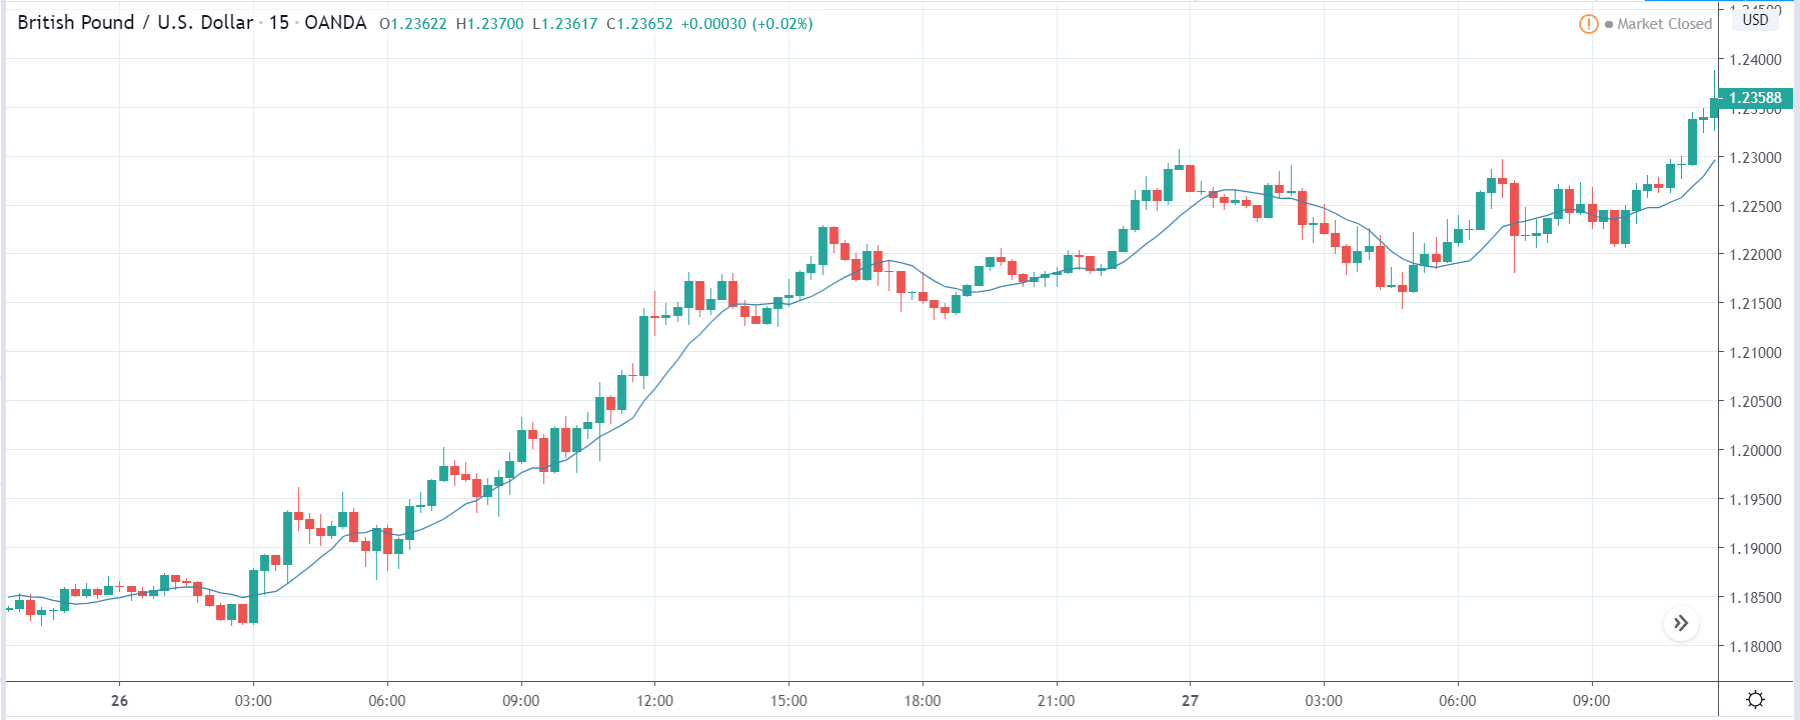
We will begin our evaluation by analyzing the GBP/INR currency pair. The above image shows the behavior of the pair before the announcement is made. We see that the market is resiliently going up with minimum retracement. This means the British Pound is very strong, or the U.S. dollar is really weak. At this point, we cannot take any position in the market as technically; this would mean chasing the market.

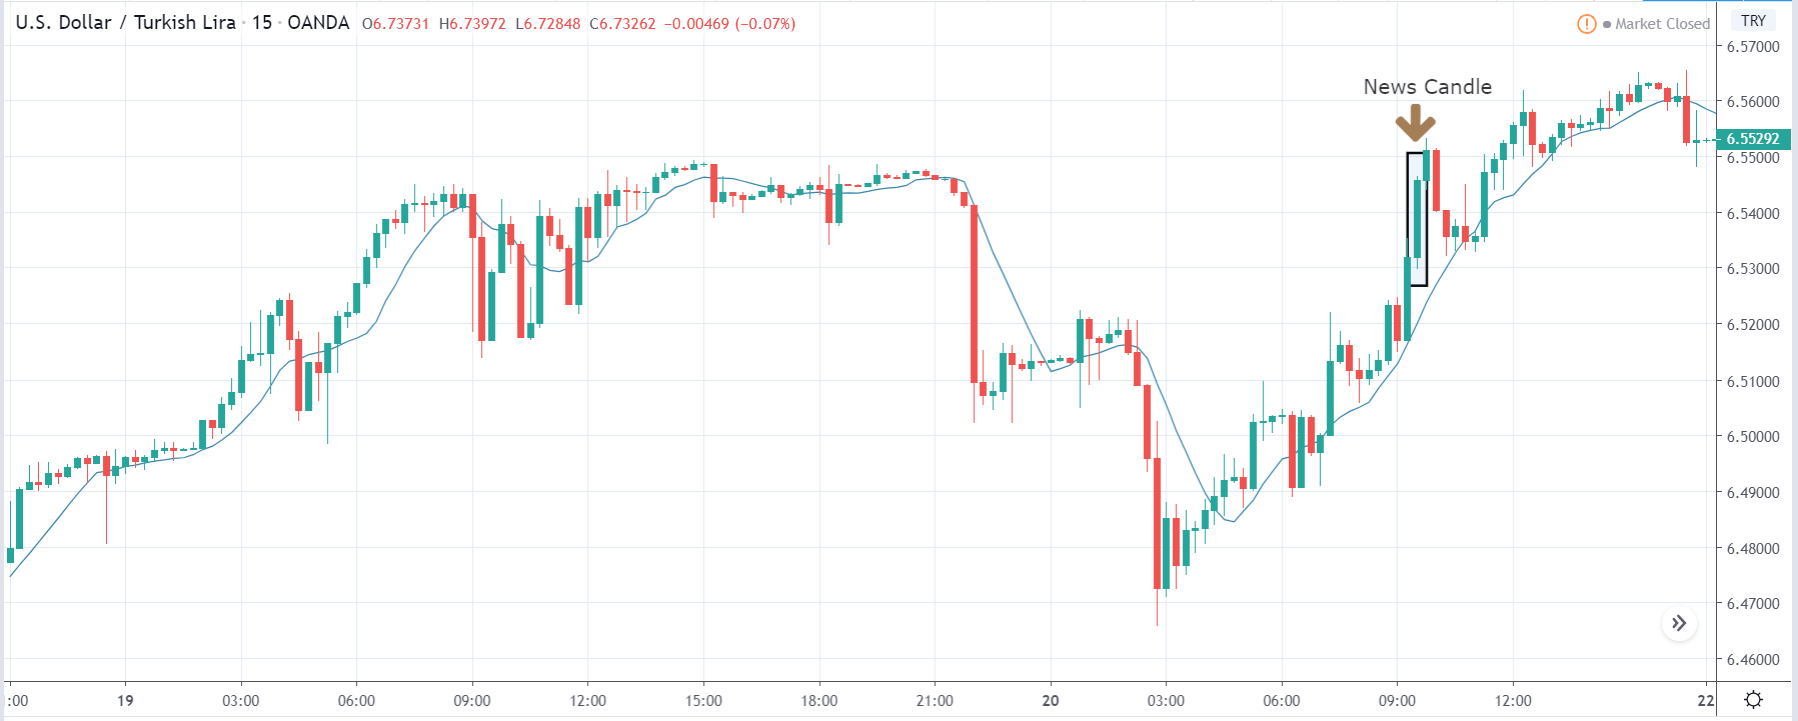
GBP/USD | After the announcement:

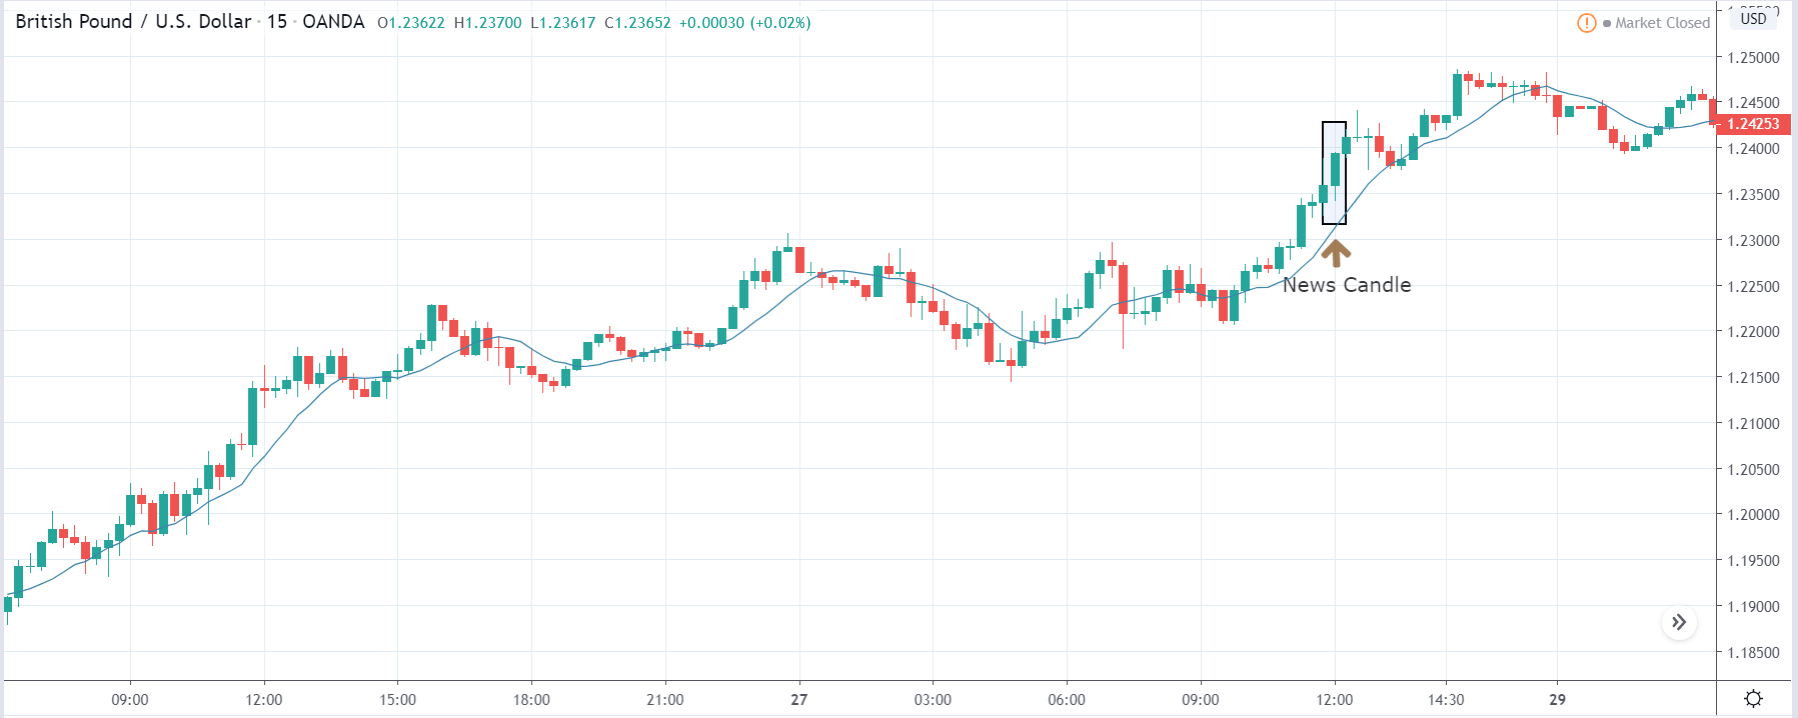
After the news announcement, the price rallies further, and volatility expands on the upside. The Car Production data was taken well by the market players who took the price higher and closed the ‘news candle’ with a decent amount of bullishness. As a result, the uptrend gets extended further due to the positive news data. In order to trade the pair, one needs to wait for the price to retrace to the nearest’ support’ and then analyze accordingly.

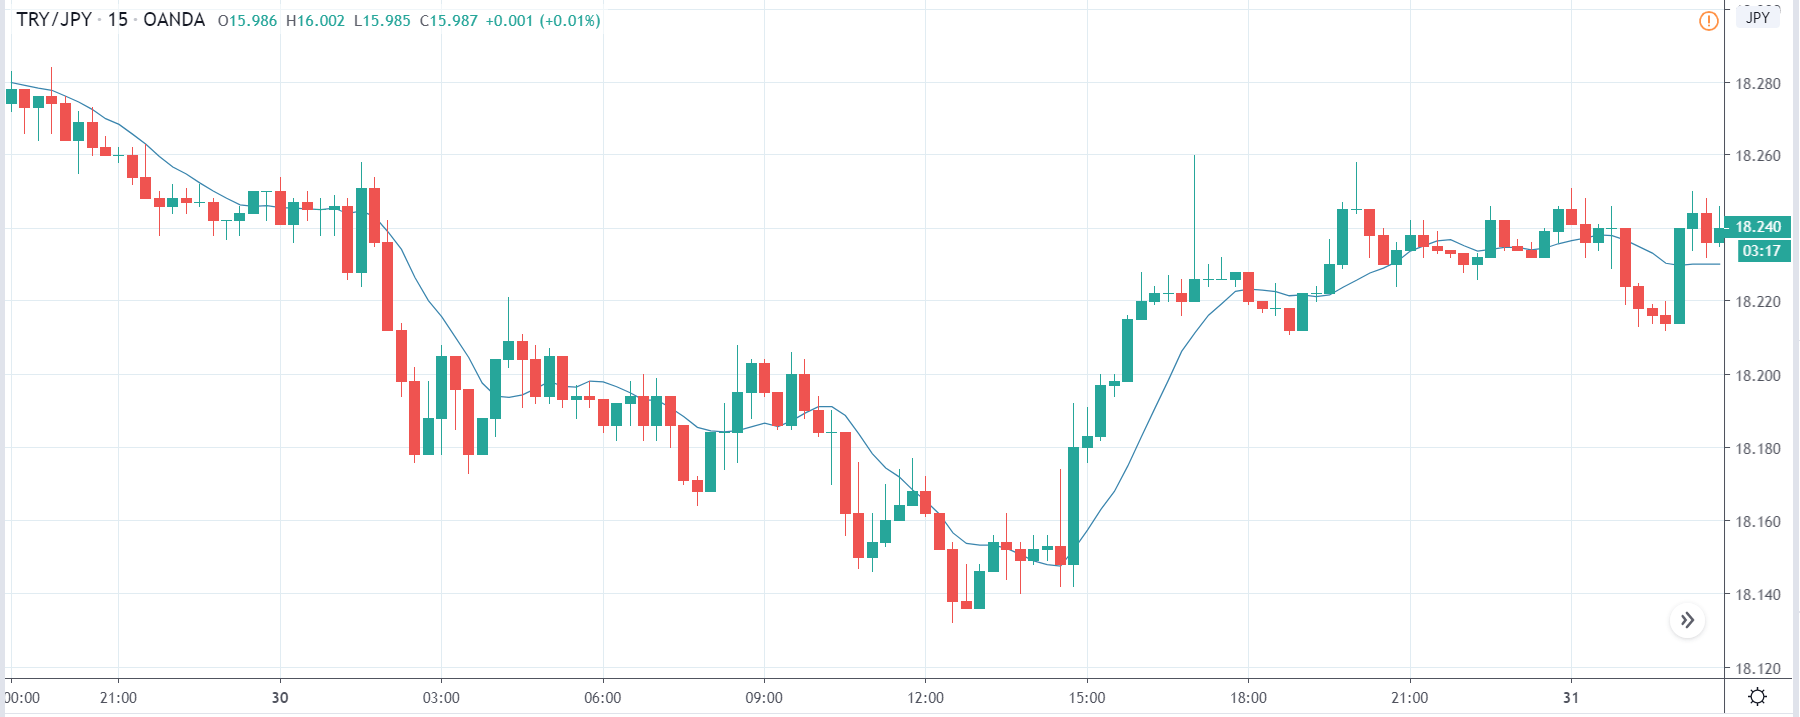
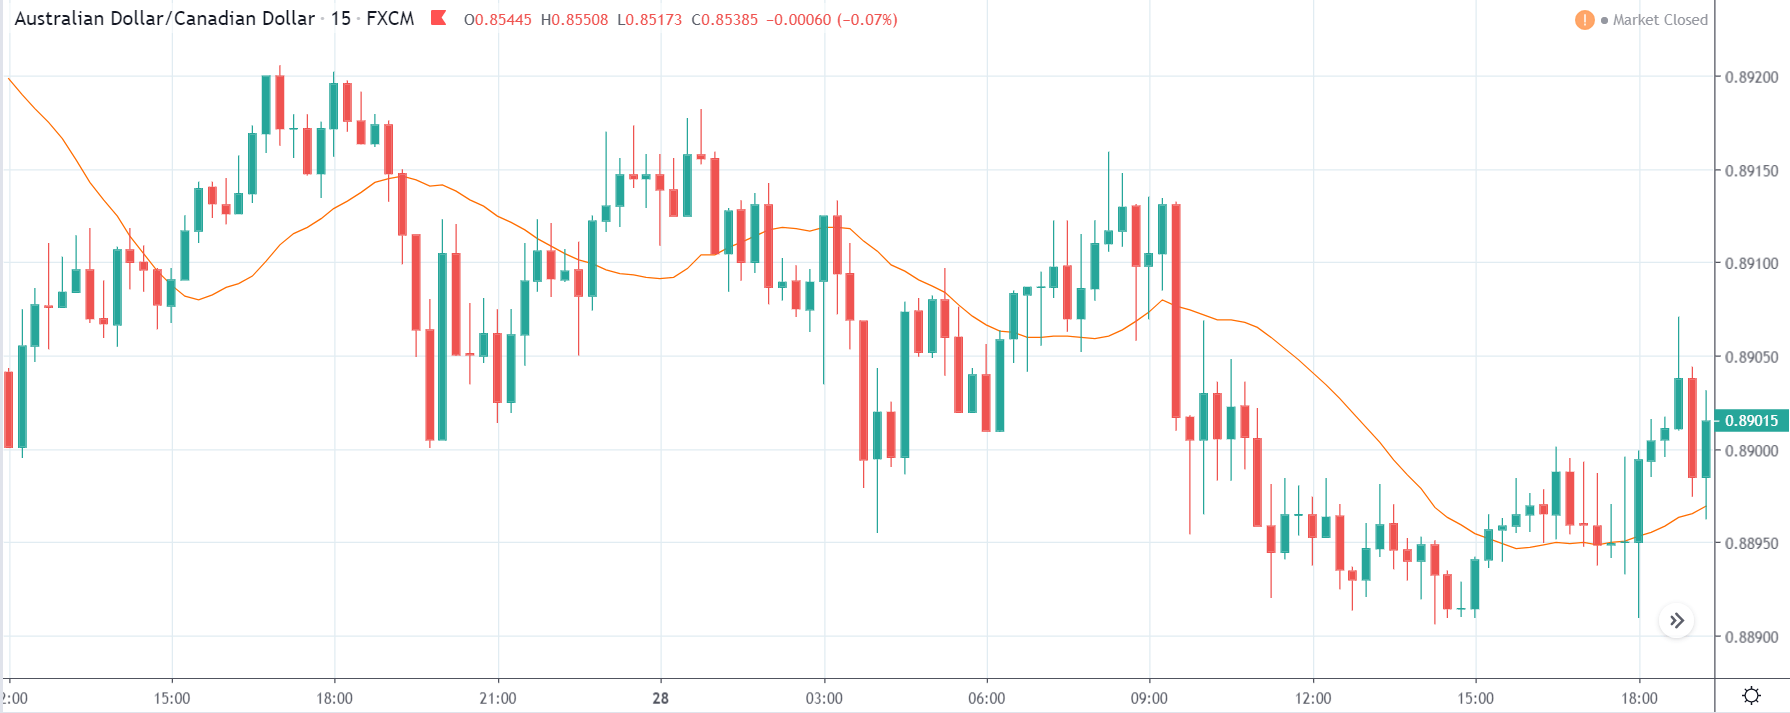
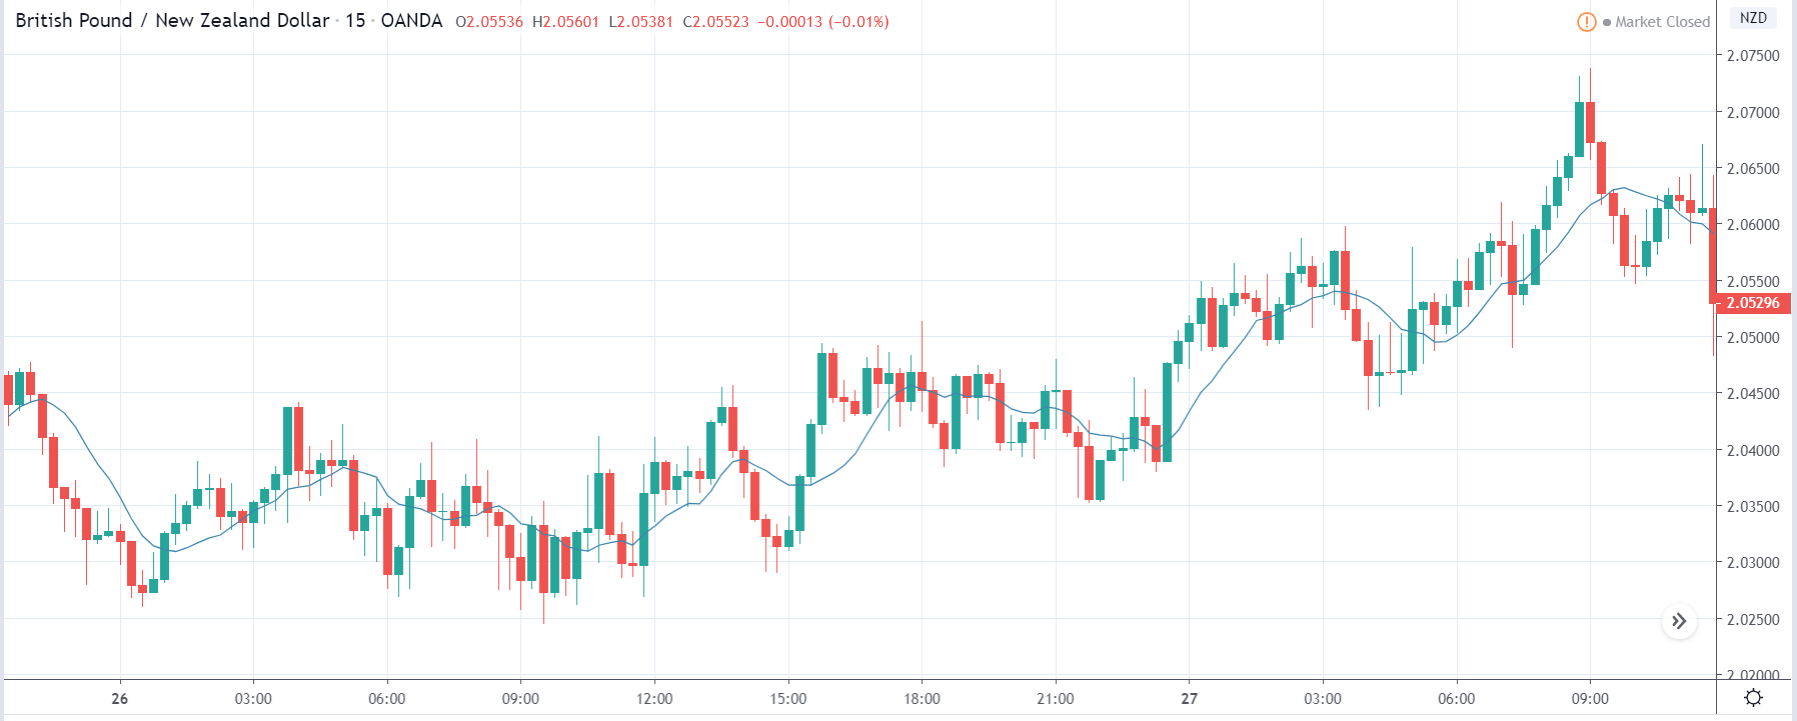
GBP/NZD | Before the announcement:

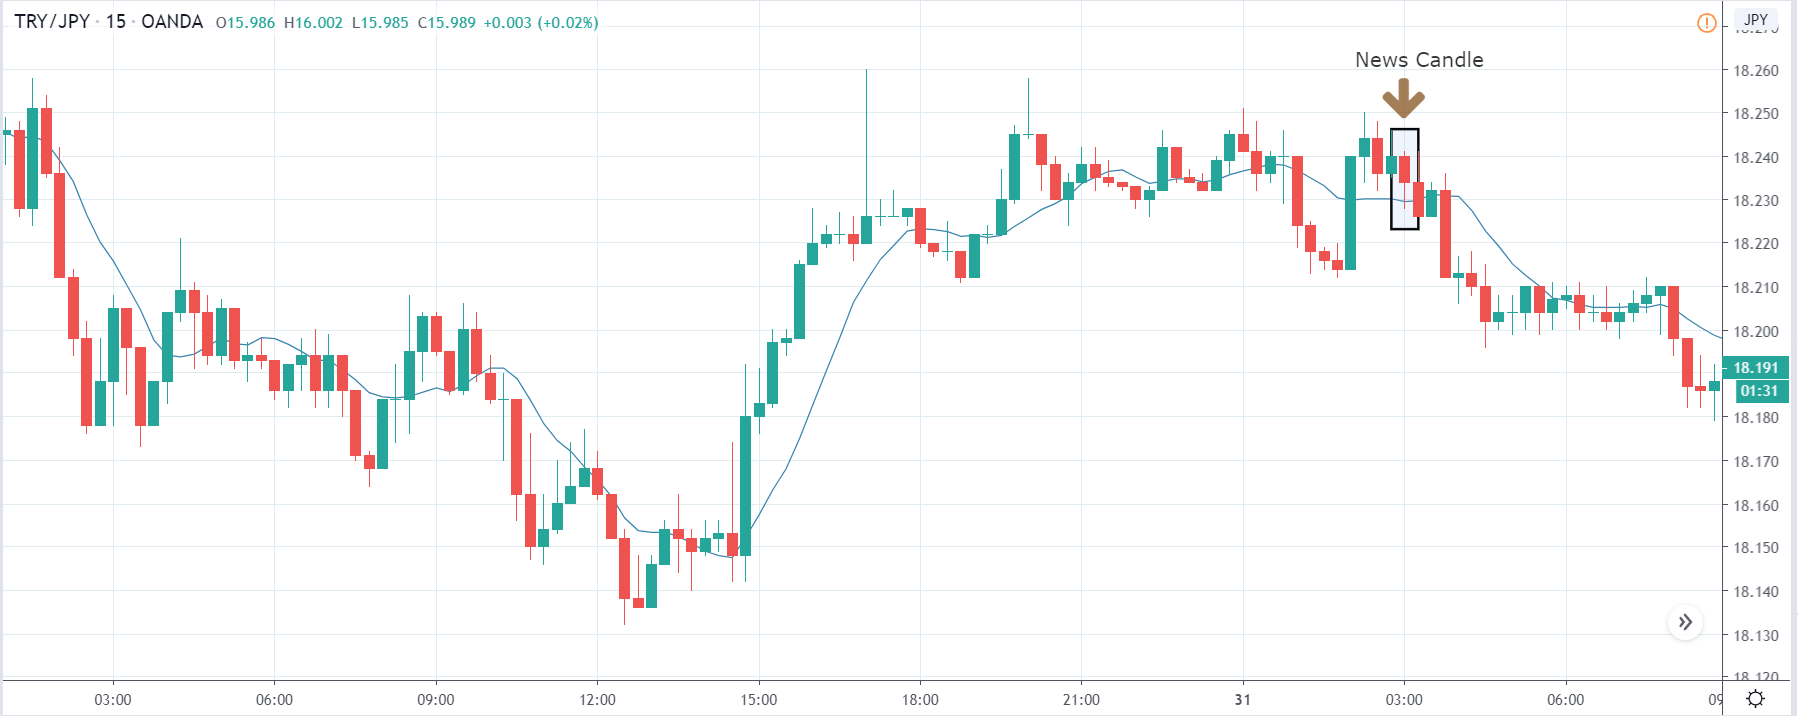
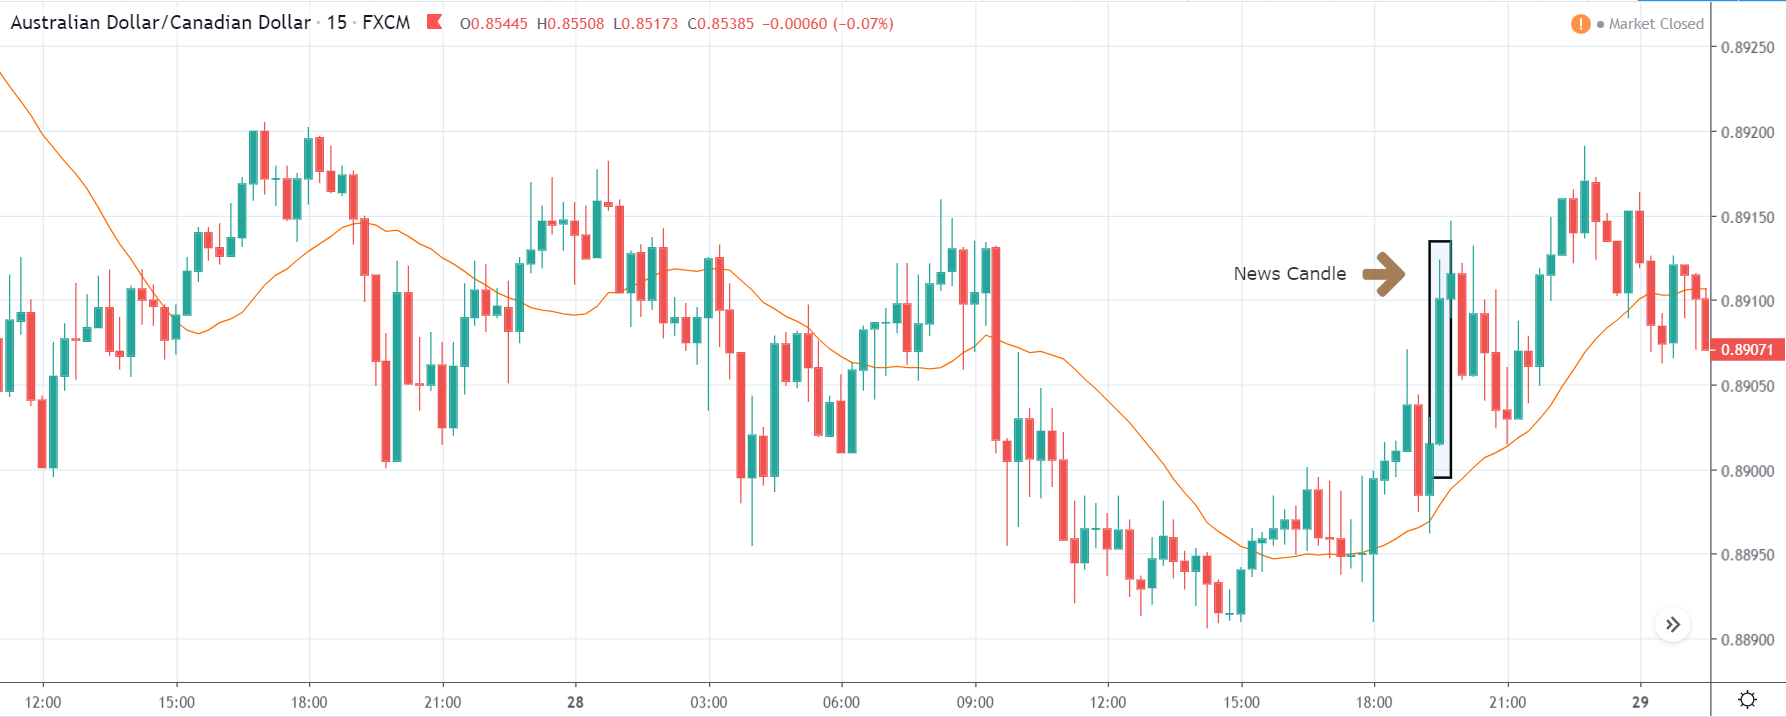
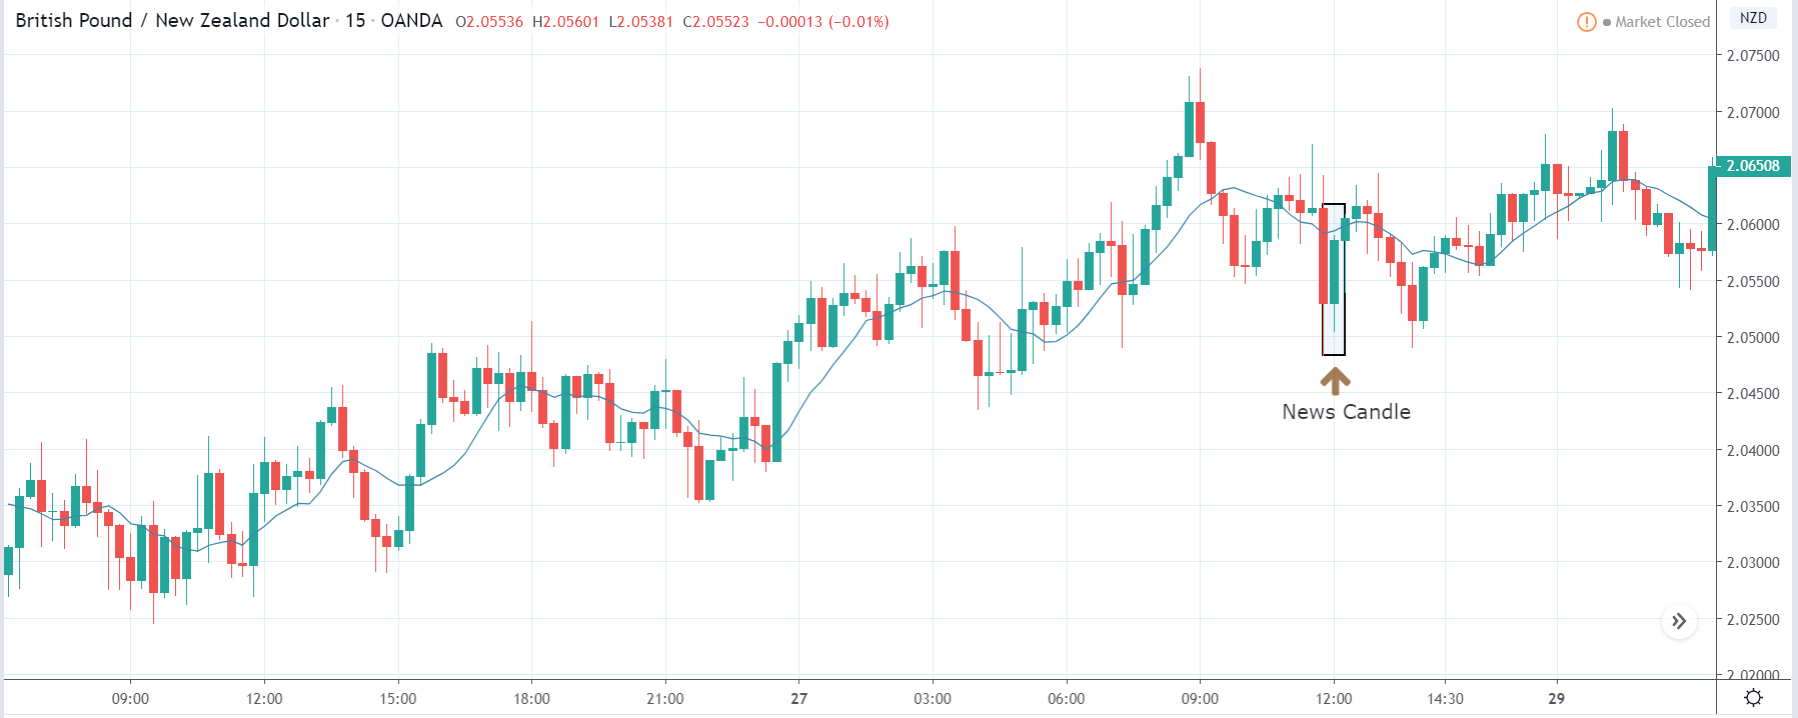
GBP/NZD | After the announcement:

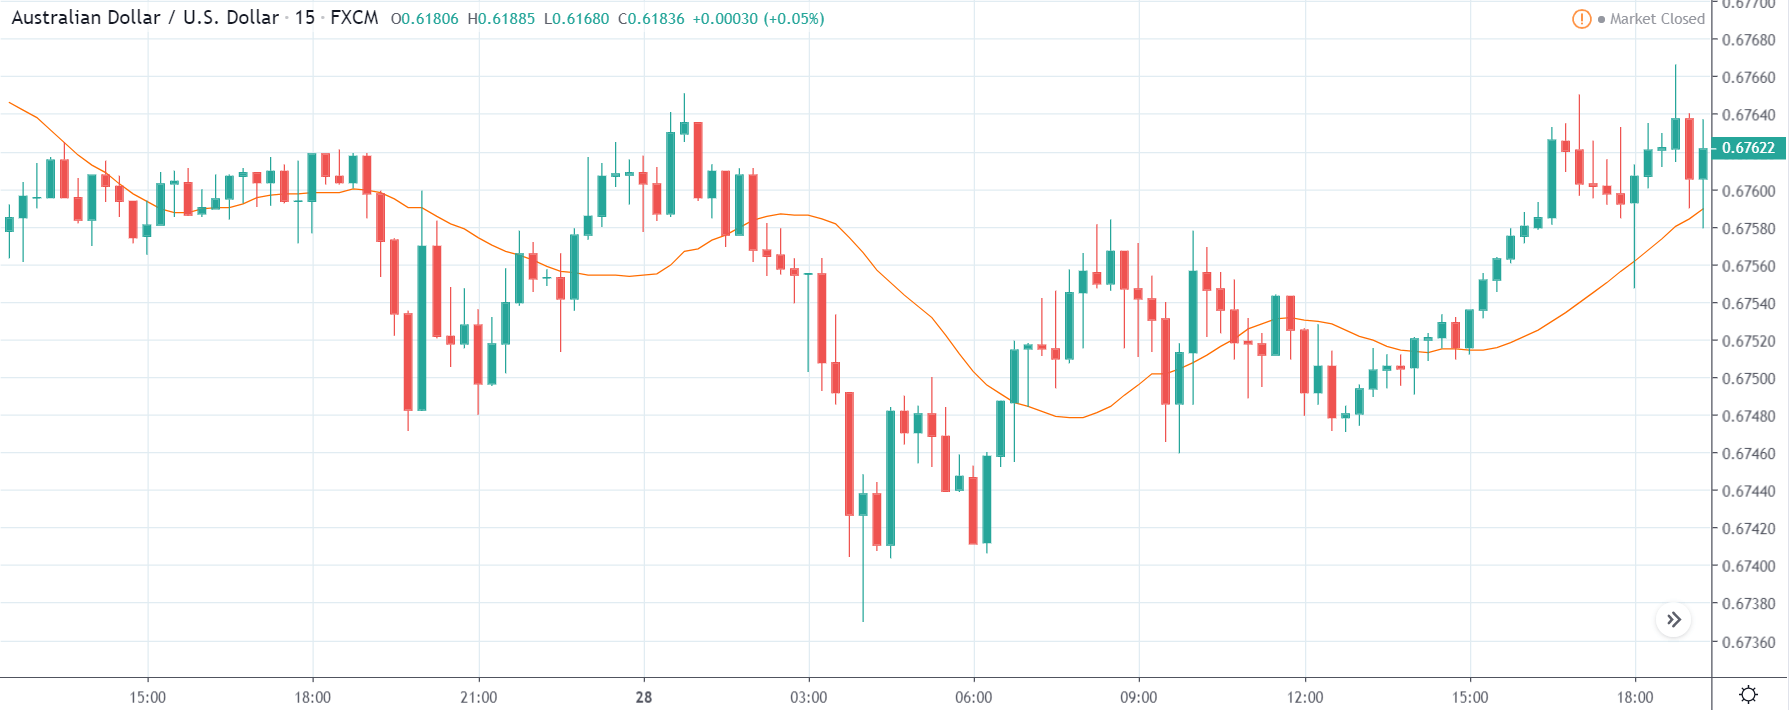
The above images are that of GBP/NZD currency pair, where in the first image, we see that the market is in an uptrend, and recently the price has retraced to a ‘support’ area. Technically, this is an ideal place for going ‘long’ in the market with a small stop-loss loss. The volatility, before the announcement, appears to be on the higher side, so conservative traders need to be cautious while trading the currency pair.

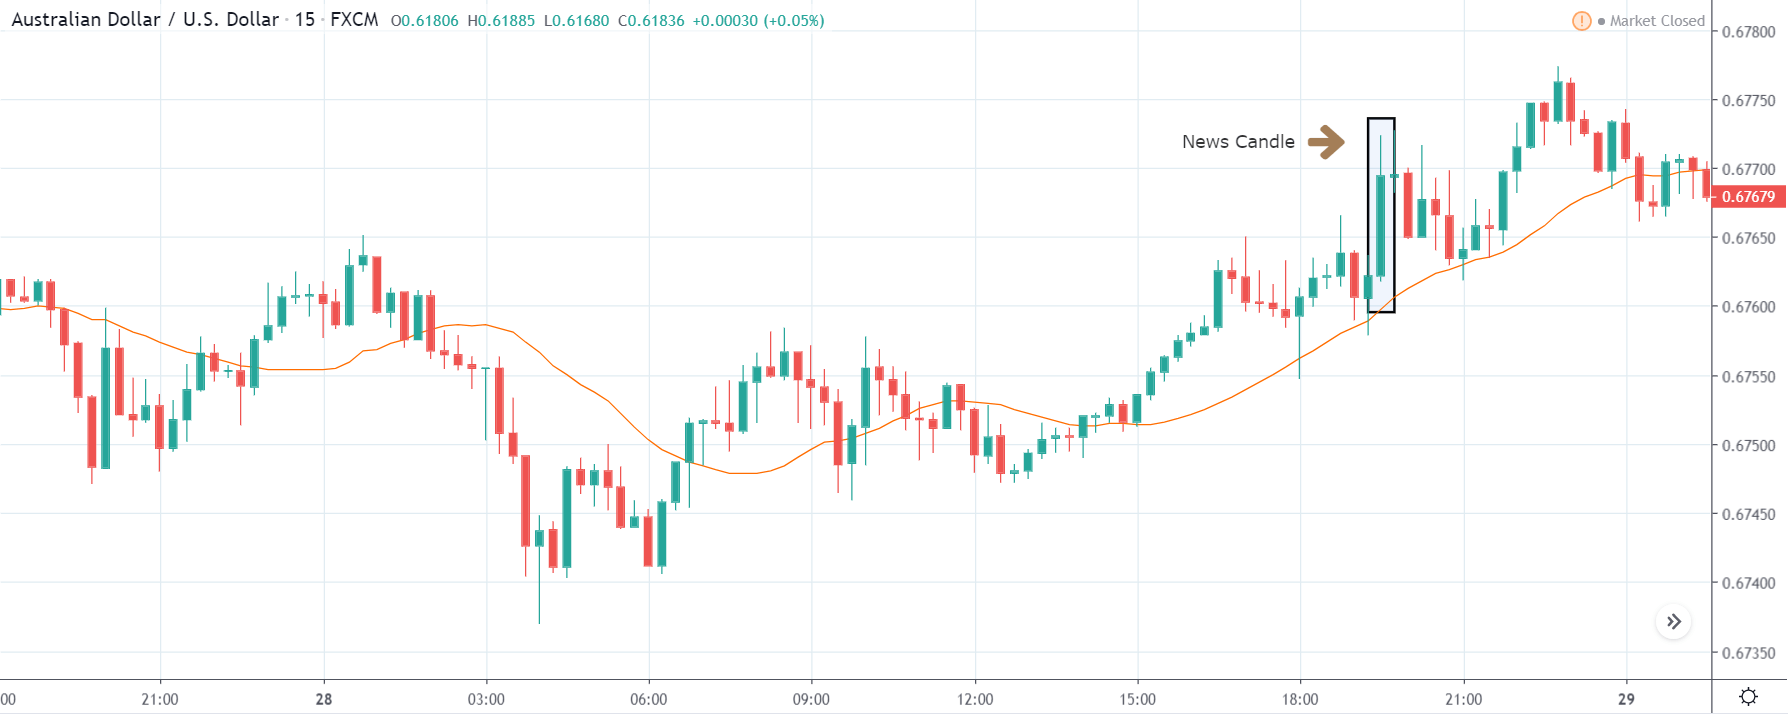
After the news announcement, volatility surges, and the price significantly moves higher within no time. This reflects the positiveness in the Car Production data, which was better than last time. After this sharp reversal, traders can take ‘long’ positions with a stop loss below the ‘news candle.’

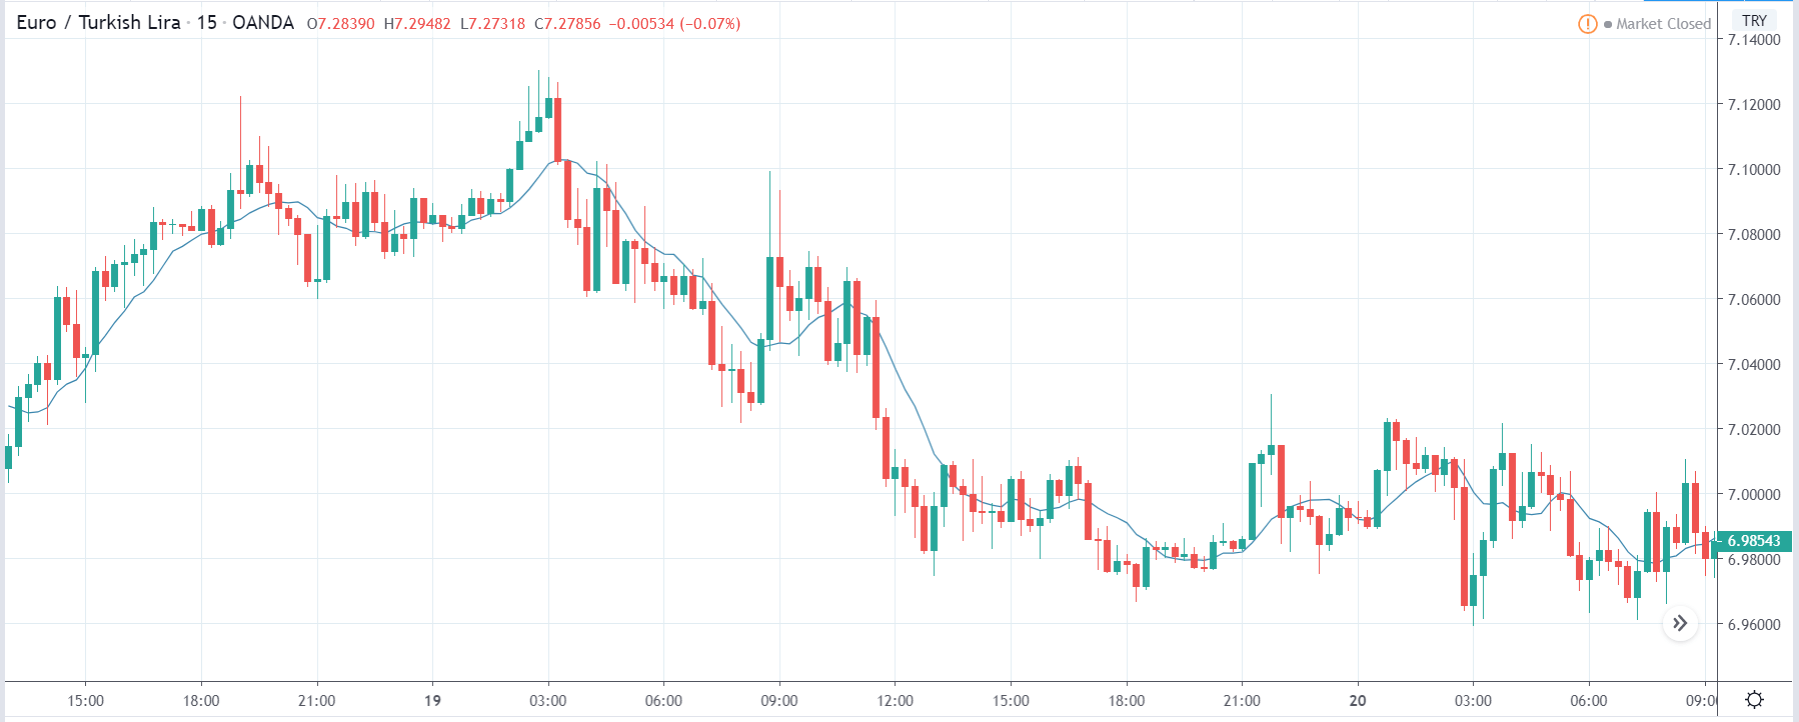
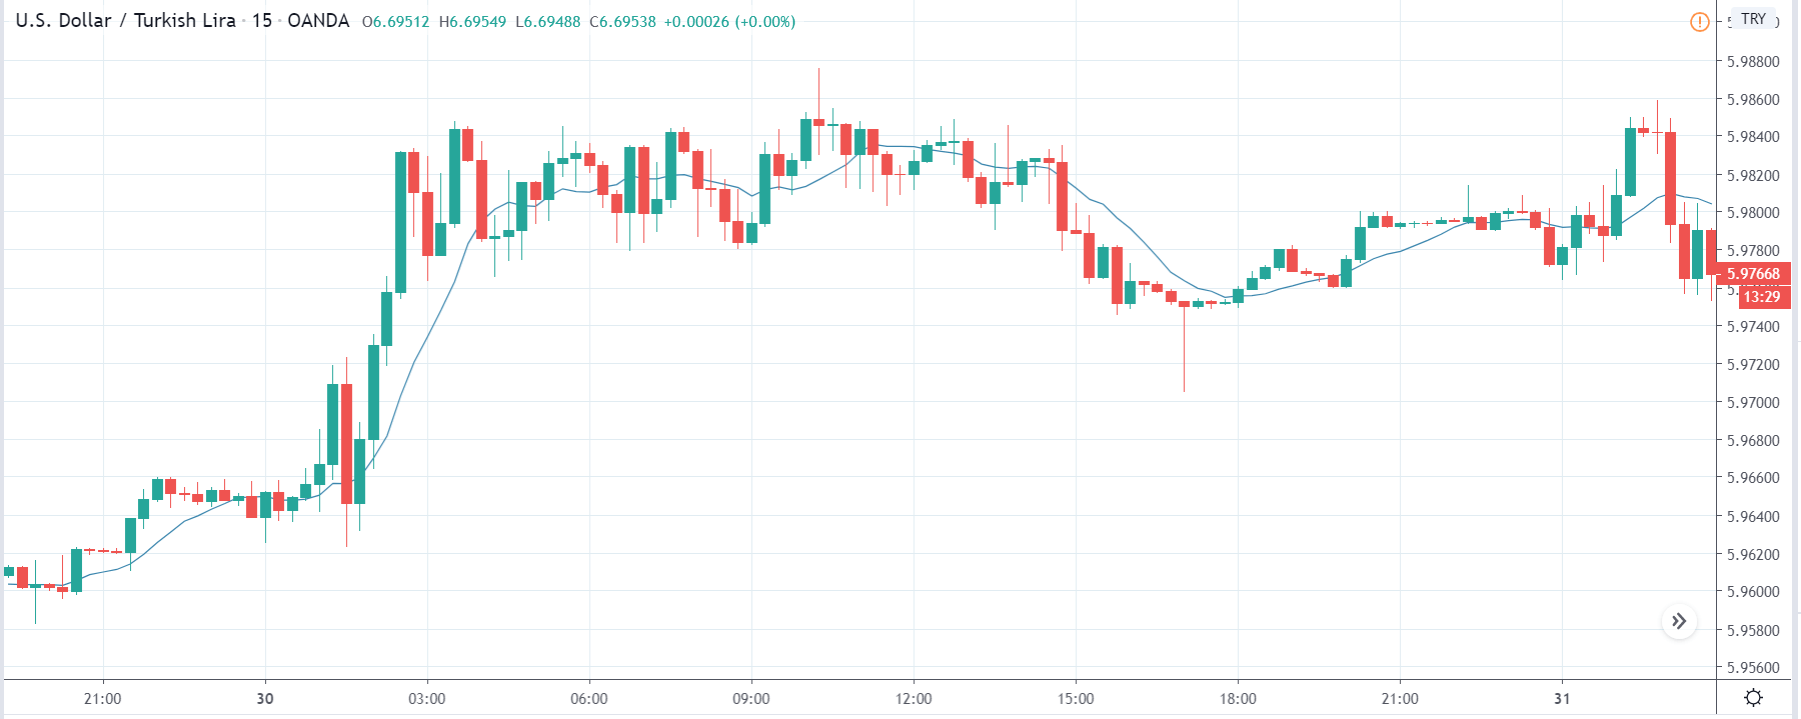
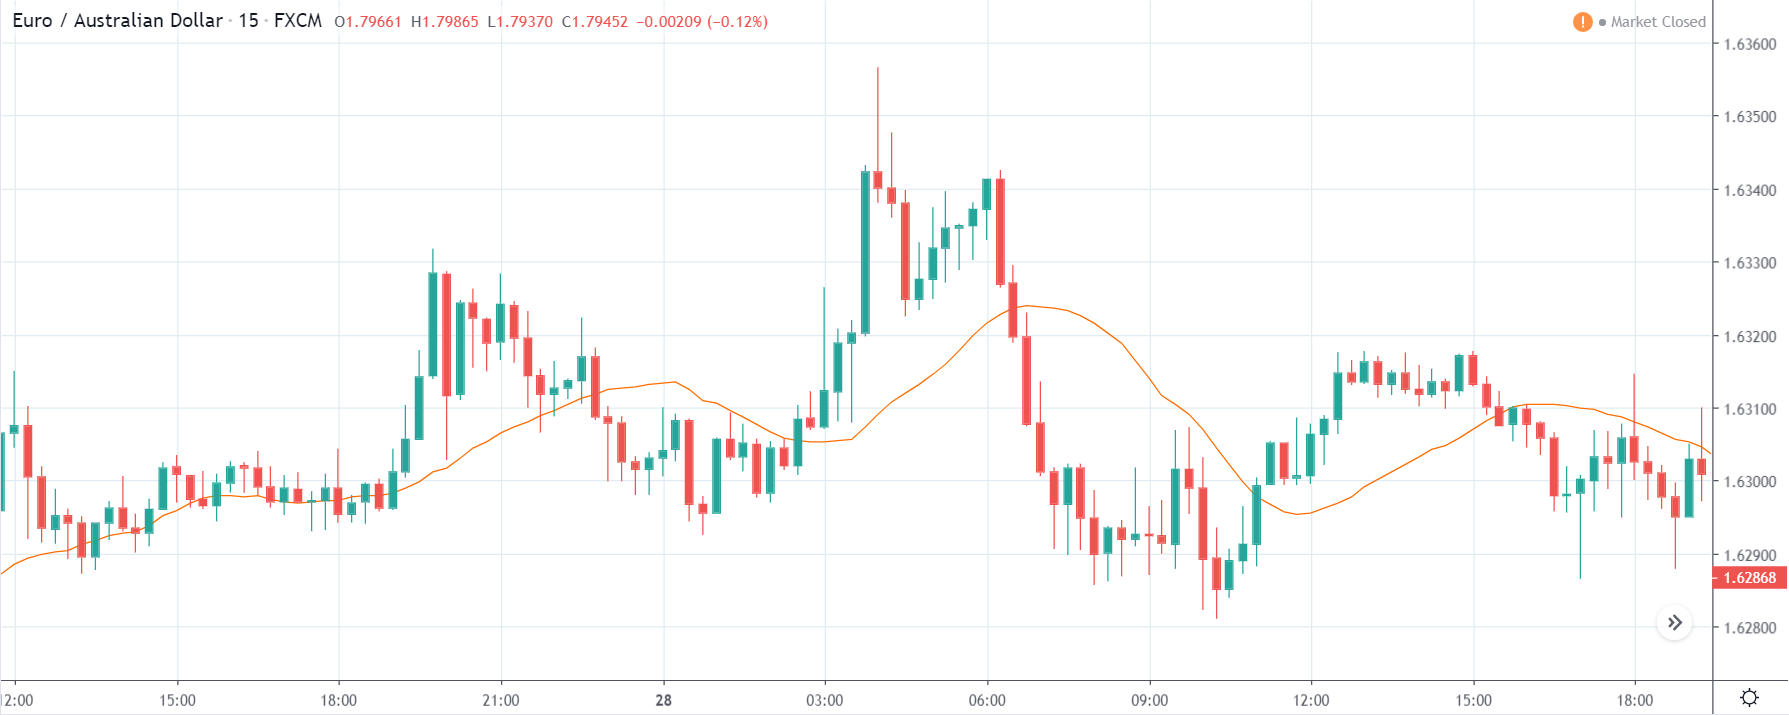
EUR/GBP | Before the announcement:

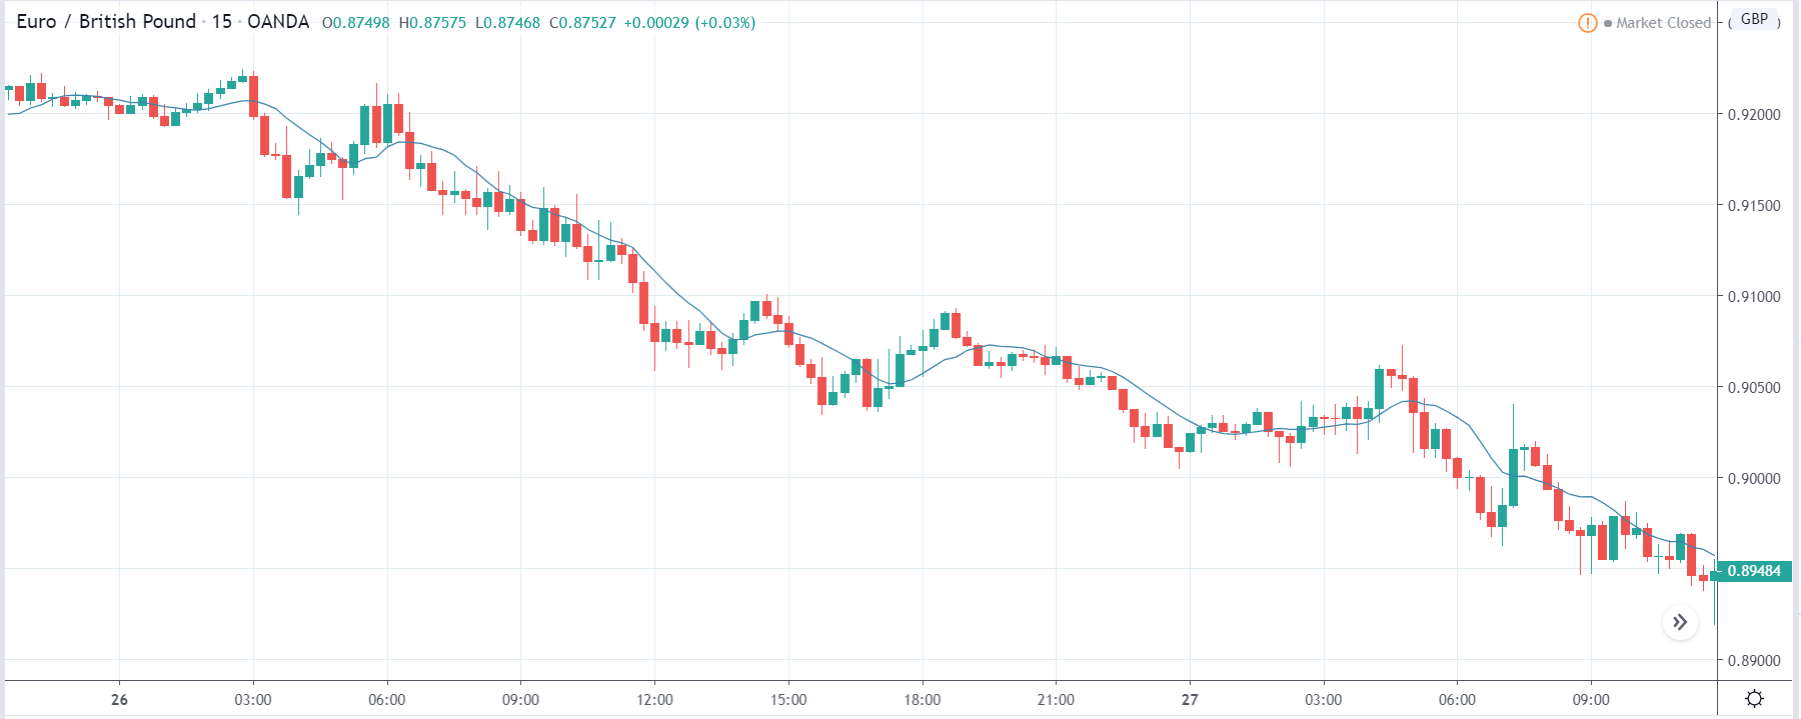
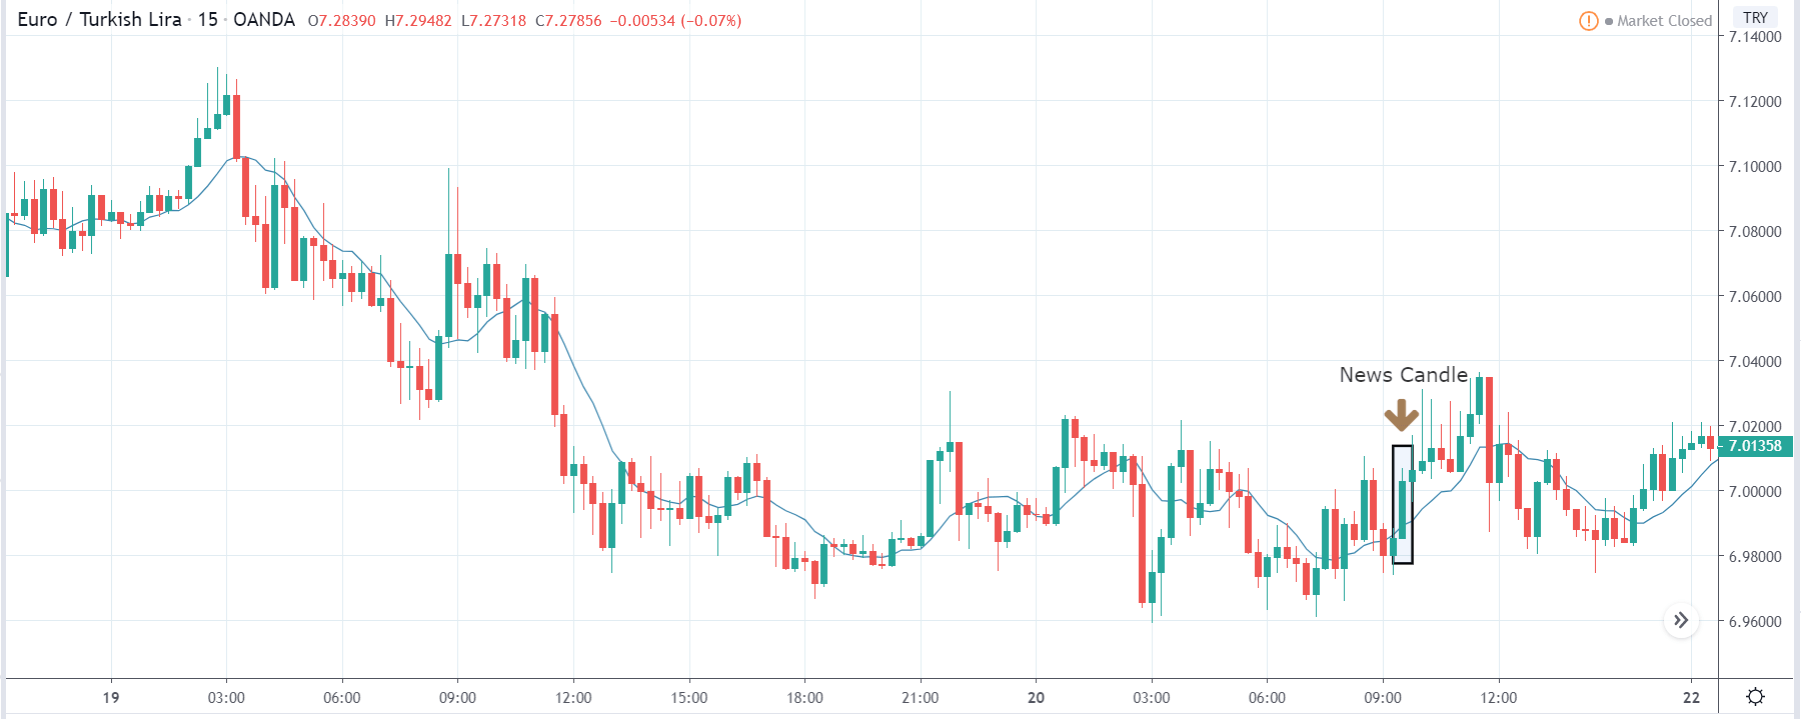
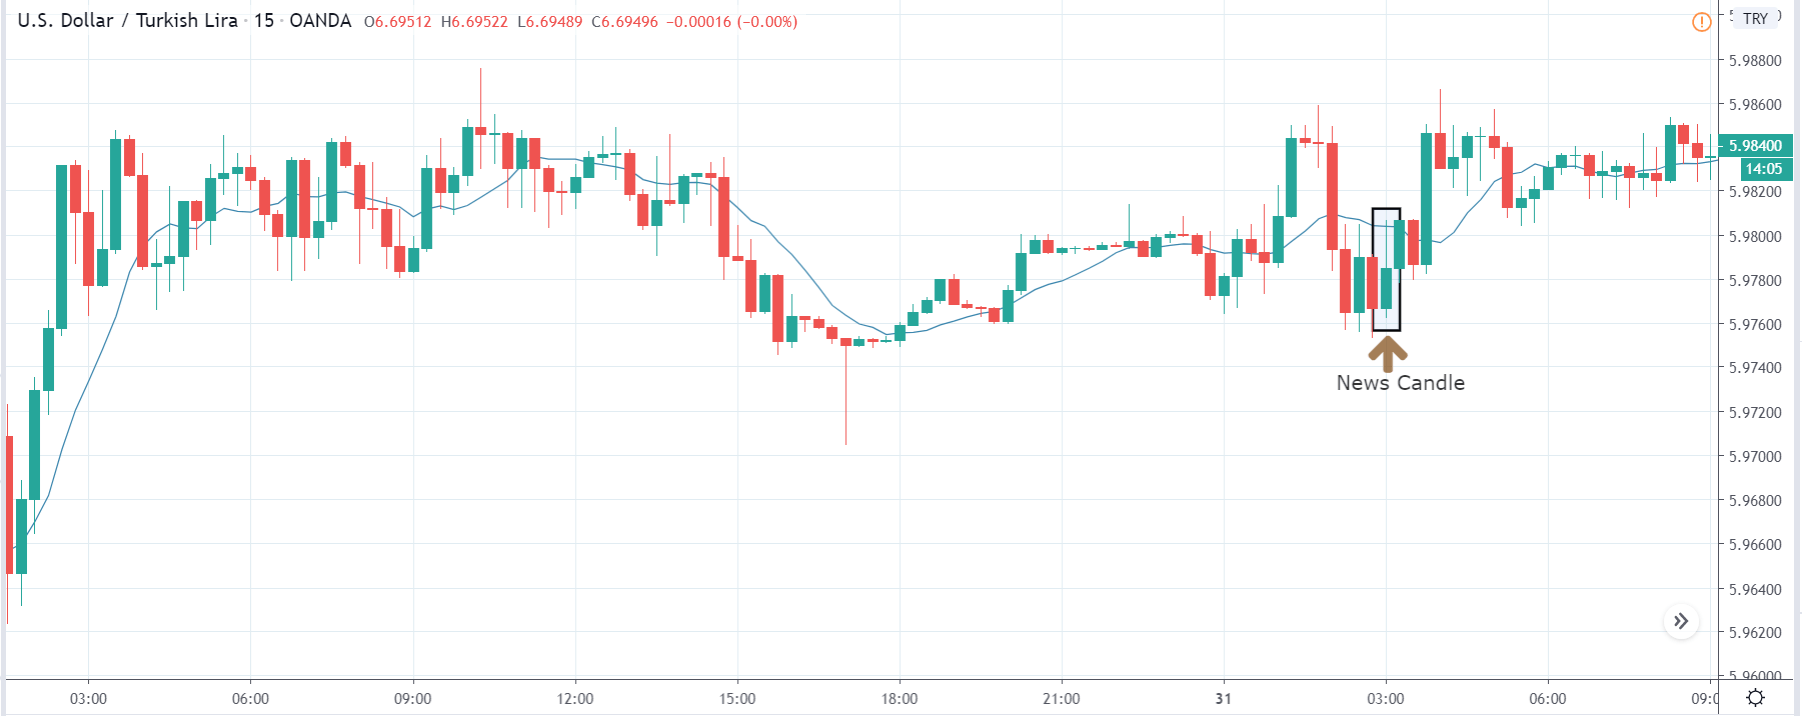
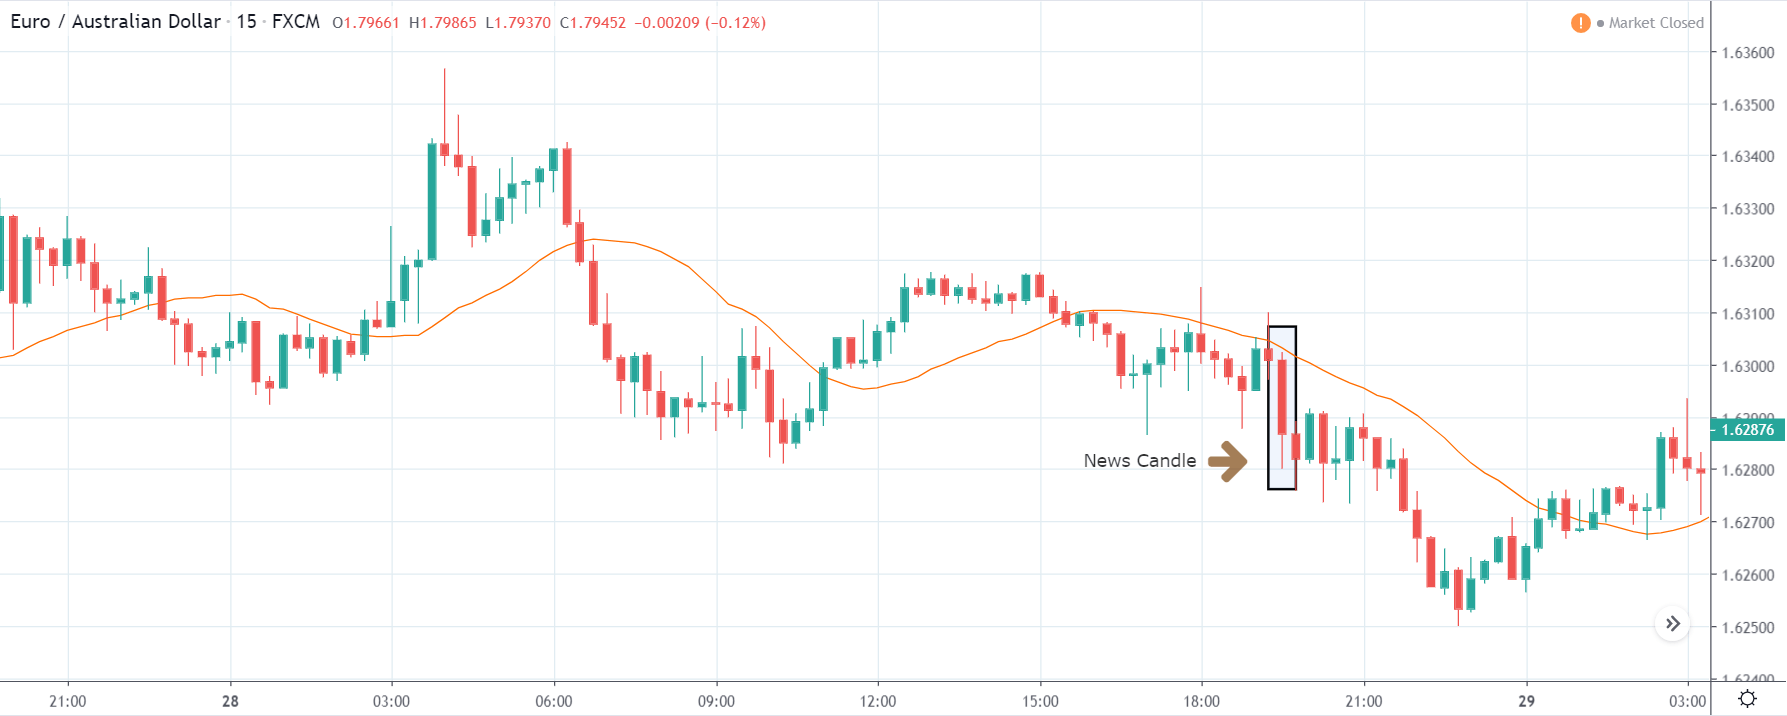
EUR/GBP | After the announcement:

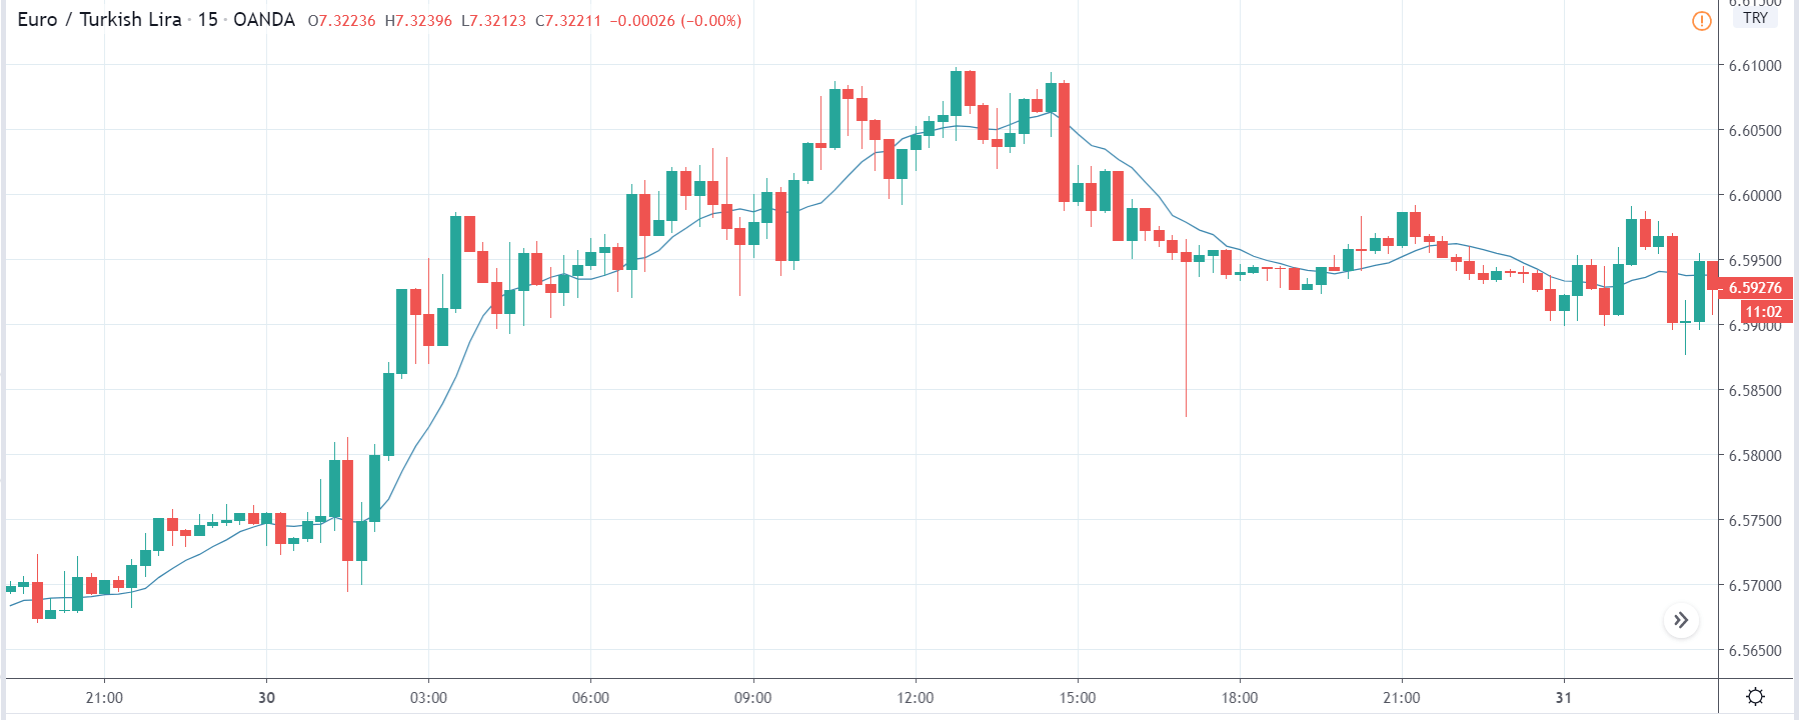
Lastly, we shall analyze the impact on the EUR/GBP currency pair and see the change in volatility. Here, before the news announcement, the market is in a strong downtrend with almost no ‘pullback,’ indicating a remarkable amount of strength in the British Pound. Since we only see nothing but red candles, selling at any point would mean chasing the market. From a risk aversion perspective, we should always trade the retracement of a trend and not when the trend itself.

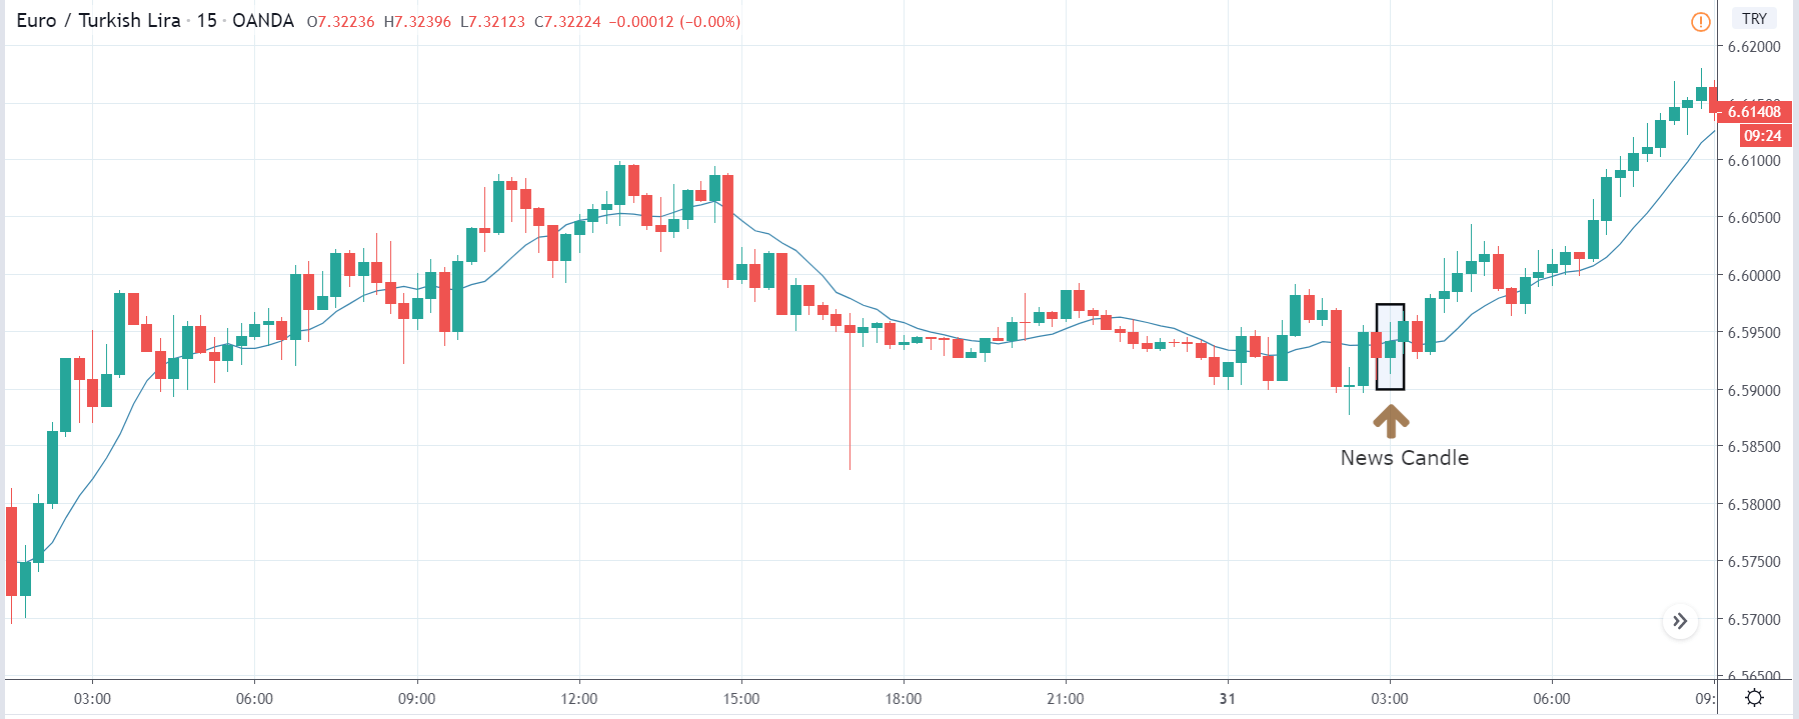
After the news announcement, the market falls further and reacts similarly to the above currency pairs. The positive Car Production data increased the volatility to the downside by further strengthening the British Pound. We will be able to take a sell trade only after the price retraces to the nearest’ resistance’ or ‘supply’ area.

That’s about ‘Car Production’ and its impact on the Forex market after its news release. If you have any questions, please let us know in the comments below. Good luck!

Categories
Forex Fundamental Analysis

How The ‘Government Debt’ Numbers Impact A Nation’s Currency Value?

Introduction

Government Debt as an economic indicator has recently been gaining more attention from economists, investors, and traders. Many economies have chosen to actively take on debts to boost economic growth. Hence, it has become a metric & also a concern for many.

Just like a piling up debt is terrible for a householder, huge government debt is a negative sign for any economy. How the debt is used to run economic activities, methods deployed to repay it, all these have a long-term financial impact. In this sense, Government Debt is a critical metric by itself that needs to be watched out for, as investors decide to lend money to governments, basing this also as one of the reasons.

Government Debt levels have consequences that are many-fold to understand. Hence, understanding Government Debt now is more important than ever as the world’s largest economies are taking on debts beyond their revenues.

What is Government Debt?

Government Debt, also called Sovereign Debt, Country Debt, National Debt is the total public Debt and intragovernmental Debt owed by the governing body of the country. It is the money that the Government owes to its creditors.

            Government Debt = Public Debt + Intragovernmental Debt

Public Debt – It is the Debt held by the public. The Government owes this Debt to the buyers of the government bonds, who can be its citizens, foreign investors, or even foreign governments.

Intragovernmental Debt – It is the Debt owed by the Government to other Government departments. It is generally used to fund Government and citizen’s pensions. The Social Security Retirement account would be one such typical example.

Whenever the Government spends more than its generated revenue, it creates a budget deficit and adds to the total Government Debt. To operate in this budget deficit mode, the Government has to issue treasury bills, notes, and bonds, which are promissory notes to lenders that the Government shall pay back the amount along with interests.

Hence, The National Public Debt is the net accumulation of all annual budget deficits of the Federal Government.

How can the Government Debt numbers be used for analysis?

The Governments depend mainly on public spending to stimulate growth in the economy by assisting businesses and individuals in the form of unemployment compensations, wage hikes, etc. This leaves Government no choice but to fall back on taking on more Debt and keep paying interests from the tax revenues and other income sources.

The piling Debt may let things continue smoothly now but will inevitably tighten the belt for the economy in the future. When Debts go out of hand, it can lead to economic collapse, as default on Debts leads to reduced credibility and may lead to a lack of funds during times of need.

When support is lost for the Government, it has to fall back on assets, selling them and thus going to the brink of bankruptcy. At this stage, a nation is vulnerable as enemy nations can also use this situation to their advantage to wage wars in extreme cases. When there is no monetary support, business slowdowns and recessions are unavoidable.

The following are some strategies the Government may opt to reduce the debt burden:

📎 Low-Interest Rates: By lowering interest rates through open market operations, the Government can make borrowing money easy for the business and people in the economy to boost the economy. This has been the case in the United States. Prolonged low-interest-rate environments have not proven to be an effective solution to Debt-ridden Governments.

📎 Monetization: Countries like the United States, whose currency is not pegged to any other currency or commodity, can print off money and clear Debt. But this can lead to hyperinflation and currency depreciation. Hence, it is not preferable.

📎 Spending Cuts: This is the hard pill to swallow that actually works. It is the spending that leads to an increasing debt burden. If the Government cuts back on spending, which is equivalent to cutting back of money supply into specific segments or programs, that will lead to deflationary situations in the economy that can lead to a recession. Furthermore, when the Government cuts back on spending, they lose the support of citizens and fear losing favors in elections by businesses and the population.

📎 Tax Raises: The main culprit is failing to cut back on spending. As the spending continues to rise year after year, increased tax revenues do little to help reduce the burden of Debt. It is the most common practice but is not effective in the long run.

📎 Pro-Business/ Pro-Trade: By selling off real assets like real estate, gold, and military equipment, the Government can reduce the burden. It is like selling your house to pay off the mortgage. This type of solution is not applicable to all countries, but some like Saudi Arabia reduced their Debt significantly from a debt 80% of GDP to 10% in seven years by selling off oil.

📎 Debt restructuring or Bailouts: When the solvency of the Government is at the brink, Debt restructuring (renegotiating the terms of Debt, or partial payments) is one final option. It is a pseudo-defaulting case. This is not also a practical solution, as the credibility is damaged after this, as it tells the world that the economy is weak.

📎 Default: Defaulting may seem the most effective way to get rid off Debt. This is considered only when there are no other options for the Government. This leads to a lack of future monetary support from the rest of the world. Defaulters like Pakistan, Greece, and Spain are good examples of this. Defaulting occurs when the Debt burden crosses way beyond the tipping point, which is 77%. For the United States, it has already passed 100% in recent years.

Impact on Currency

The National Debt is an increasing concern in recent years as the repayments are starting to take more massive proportions of the Government’s revenue. What method the Government decides to opt for to tackle its debt burden in a given year directs the growth for that business year.

The Government Debt is a proportional indicator, meaning higher Government debt numbers are more stimulating for the economy, and appreciating for the currency and vice-versa. The vital thing to note here is that as long as the Debt has not gone way out of control that the Government cannot afford to pay the interests also. For the United States, the Debt burden will be unbearable by 2034, at which point they have to cut back on spending and raise taxes.

The Government Debt is a lagging and reactionary number. It is taken on to solve an issue and is not an initiative effort. Debt numbers follow the already ongoing situation. Hence, it has a low market impact. The more direct implications of the taken Debt are manifested through press releases and other news reports like wage growth, employment statistics, etc.

Economic Reports

The Treasury Department has the “Debt to the Penny” section on their website which shows, the daily Debt after all purchase and sale of the Government Bonds.

The U.S. Treasury Department releases quarterly, end of the period, the Federal Government’s Debt reports.

Sources of Government Debt

The Office of Management has a historical tables section where we can find Federal Debt records. Some of the most reliable sources are given below.

Impact of the ‘Government Debt’ news release on the price charts 

Government Debt which also known as the national debt, is the public and intergovernmental debt owned by the federal government. The government may take a loan from the World Bank and or from other financial institutions for a variety of reasons. It could be required for fulfilling the needs of the people, for defense purposes, or for stabilizing the economy. A moderate increase in debt will boost economic growth, but too much debt is not good for the economy.

It dampens growth over the long term. Higher debt means a higher rate of interest and, thus, more burden on the government while repaying the loan. Investors compare the debt held by the government and its ability to pay it off. Based on this data, they have a short to long term view on the currency. However, traders do not react violently to the Government Debt news release and make few adjustments to their positions in the market.

In today’s article, we will be analyzing the impact of the Government Debt announcement on Turkish Lira as traders identify the debt of the Turkish Government. The below image shows the previous and latest Government debt of Turkey, which indicates an increase in debt from last month.

USD/TRY | Before The Announcement

The above image represents the USD/TRY currency pair before the news announcement. We see that the chart is in an uptrend and the price has broken many resistance points. Currently, it is approaching a major resistance area from where the market has reversed earlier. High volatility on the upside could be an indication that the market is expecting a weak Government Debt data. One can join the uptrend only after the market gives a retracement.

USD/TRY | After The Announcement

As soon as the Government Debt data is announced, the market violently moves higher, and price rises quickly to the top. The reason behind the increase in volatility to the upside is that the Government Debt increased by almost $70B for the month of March. As a rise in Debt is considered to be negative for the economy, this explains why traders and investors sold Turkish Lira and bought U.S. dollars after the numbers were announced. The bullish ‘news candle’ is a sign of trend continuation, and thus one can go ‘long’ in the pair after a suitable price retracement.

TRY/JPY | Before The Announcement

TRY/JPY | After The Announcement

Next, we will discuss the impact of the news on the TRY/JPY currency pair, where we see that the market is moving in a range, and the overall trend is up. As the Turkish Lira is on the left-hand side, a ranging market indicates an indecision state of the market. Before the news announcement, price is at the ‘resistance’ area, and thus one can expect some selling pressure from this point, which can take the price lower. In such a market scenario, aggressive traders can take a ‘short’ trade in the market, expecting bad news for the economy.

The news release resulted in volatility expansion on the downside as the market reacted negatively owing to poor Government Debt data. The price crashed and closed as a strong bearish candle. But this was immediately retraced by a bullish candle, which could be due to the reaction from ‘support’ of the range. Thus, one should go ‘short’ in the pair after the price breaks key levels as the overall trend is up.

EUR/TRY | Before The Announcement

EUR/TRY | After The Announcement

The above images are that of the EUR/TRY currency pair, and here too, the market is range-bound where the overall trend is down. Since the Turkish Lira is on the left-hand side, a ranging market indicates a moderate strength in the currency. Just before the announcement, price is at the ‘bottom’ of the range, and one can expect some buying strength in the market, which can take the price higher from here. The safer approach is to wait for the shift in volatility due to news release and then trade based on the data.

After the data is released, the market, just as in the above pairs, moves higher sharply, and traders sell Turkish Lira. The bullish ‘news candle’ indicates that the Government Debt data was extremely bad for the economy and thereby prompting traders to go ‘long’ in the pair. As now the price is at resistance, one should wait for a breakout and then ‘buy.’

That’s about ‘Government Debt’ and its impact on the Forex market after its news release. If you have any questions, please let us know in the comments below. Good luck!

Categories
Forex Fundamental Analysis

Comprehending The ‘Tourism Revenues’ Statistics & Its Impact On The Forex Market

Introduction

The global connectivity through the internet, powerful smartphones and gaming technology, we may be led to believe that more and more people prefer to spend time in their home using their entertainment gadgets, but it is not so.

The internet has brought the world closer than ever before, making remote tourist places more accessible and affordable than ever. Tourism Revenues contributes to 2-10% of the total GDP of most countries. Tourist hot spots like Dubai, Mexico, France, Thailand, etc. have Tourism as one of their primary source of revenue generation.

Tourism Revenues, factors affecting it, and measures to improve it all have significant changes in Tourism employment labor, economic growth, and overall development of the economy.  Hence, our fundamental analysis needs to understand the Tourism patterns and its resultant changes in the marketplace.

What is Tourism Revenues?

Tourism is the act of people traveling to and staying in locations outside their usual residing place for leisure, recreation, business, or other purposes for a specified period.  For the general public, a tour typically implies leaving behind their work and home to travel and explore tourist spots with family, friends, or by themselves for refreshment.

Tourists are people coming from outside the current locality into consideration (be it a city, state, or even country) to temporarily visit the place. Business people having to travel on work purposes are also categorized under tourists. Below we have mentioned the three types of Tourism.

Inbound Tourism

Tourists coming into the country to visit are called inbound tourists. This adds to the revenue of the nation as people pay and spend money in domestic currency.

Outbound Tourism

When our citizens go out of our country to foreign destinations for tours, it is called Outbound Tourism. This takes away revenue from our country and adds to the foreign countries, as the domestic currency is exchanged for foreign currency for expenditure purposes.

Domestic Tourism

People of one state visit another state within the country; it is called Domestic Tourism. This is helpful for the visiting state as it brings revenue to the state.

Tourism Revenues

As per the United States Travel Association, in 2019, domestic and international travelers spent 1.1 trillion U.S. dollars. This spending has directly supported 9 million jobs and has generated 277 billion U.S. dollars to the payroll income an 180 billion dollars in tax revenues for federal and local governments.

Travel Industry accounts for 7% of the total private sector employment. The power of job growth through travel is higher than in many other industries. For example, every 1 million dollar sale of travel-related items directly adds to eight jobs compared to only five jobs in the non-farm sectors.

How can the Tourism Revenues numbers be used for analysis?

The following factors affect Tourism Revenues:

 Climate: The environmental conditions at the tourist destination adversely affect tourism. For example, In summer, hill-stations and colder regions see a rise in tourist numbers. If the ecology of the tourist place is balanced (avoiding over-exploitation of nature and over urbanization), unexpected adverse weather conditions can be avoided.

✰ Economic Situations: A healthy economy can support tourism. Financially weak people neither travel nor the Government of a weak economy create and promote an excellent tourist destination. Disposable Income of the people determines whether they can afford to spend on discretionary things like tours and travel. Political unrest and terrorist activities adversely affect tourism. Safeguarding and protection are essential from the Government’s side to assist tourism.

✰ Cultural importance: It is the historical and cultural significance of the places, monuments that attract tourists. Preserving and maintaining heritage sites over urbanization (building roads, houses, malls, or buildings for commercial use) can help foster tourism. 

✰ Research value: Researchers actively seek places undisturbed by human exploitation. The preservation of natural forests, seas, oceans can attract tourists who are Archeologists, Geologists, Biologists, Oceanographers, etc.

✰ Religious places: Tourists usually take tours to escape from their daily challenges and find peace. In this sense, religious destinations are always flooded during specific periods in a year. India is one such example where there are a lot of pilgrimage sites that bring in good revenue for the nation. Preservation and regulation of such religious places support tourism.

✰ Internet: Ease of accessibility to new people via the internet encourages people to explore these places. Enthusiasts only visit unknown and remote sites. The more people have reviewed an area, the more people would be comfortable visiting it.

✰ Amenities: Availability of transport, hotels, guiding services enhance the tourist’s travel experience. Lack of all these necessary facilities would contribute to a mediocre travel experience that would slowly decline the tourist numbers. Ratings of the place affect the tourist numbers in the long run.

✰ Economic Impact of Travel: Travelers create a “multiplier” effect on the economy. Apart from the direct purchase of goods and services by travelers, the indirect acquisition of raw materials needed to manufacture them adds to the indirect travel output.

Due to spending in the local areas, additional sales are generated that are categorized as induced output by tourism. For instance, the total jobs supported by Tourism is 15.8 million. As per the U.S. Travel Association, one in ten non-farm jobs indirectly relies on the travel industry. The travel industry has generated 2.6 trillion U.S. dollars for the economy, contributing about 2.6 % of GDP.

Impact on Currency

Tourism revenue supports jobs and the Income of the economy. Tourism is a proportional indicator. An increase in tourism revenues positively correlates to the currency value. As more tourists arrive, the more the domestic currency is in demand and hence appreciating the currency value and vice-versa.

Changes in Tourism Revenues from year-to-year have a low impact on the currency as it makes up less than 5% of GDP for many countries. For this reason, tourism is seen as a low impact indicator.

Economic Reports

The World Travel and Tourism Council provides a comprehensive summary of Tourism Revenues and its contribution to GDP for most countries on their official website. They publish monthly updates in cooperation with Oxford Economics to provide a brief overview of short term trends in the Travel and Tourism Sector.

The Travel Price Index (TPI) published monthly by the U.S. Travel Association measures the travel inflation and is comparable to CPI (Consumer Price Index).

Sources of Tourism Revenues

The information regarding tourism and related statistics can be found in the sources mentioned below.

Monthly Updates- WTTCWorld Travel and Tourism CouncilMonthly Statistics – USTA for (TPI, Travel Trends, etc.)

Impact of the ‘Tourism Revenues’ news release on the price chart 

Tourism Revenues are slowly becoming a significant source of income for various countries, especially for emerging economies. These revenues contribute a lot to the GDP of a country. Recently, this sector has been gaining a lot of attraction, and as a result,  governments of almost all countries are promoting the tourism industry. Today, we even have an official media release of the revenue generated by tourism alone released by the monetary agency of that country. Therefore, some traders around the world create and remove positions in the market based on the Tourism Revenues data.              

The below image shows the previous and latest Tourism Revenues data of Turkey. This is essentially the amount spent in billions of U.S. Dollars by Foreign tourists. This data is particularly important for developing countries. It is released on a monthly, quarterly, and yearly basis, depending on when the country chooses to publish. A higher than expected reading is considered to be positive for the economy, while a lower than expected reading is considered to be negative.

USD/TRY | Before The Announcement

We shall start with the USD/TRY currency pair and find out the impact of the news release on the pair. As we can see in the above image, the market is moving in a range, and just before the news announcement, it is at the bottom of the range. Technically, this is an area from where the price bounces and moves higher, but since there is a news announcement in some time, it is possible that this level could be broken. Therefore, we need to wait and then trade based on the news outcome and shift in volatility.

USD/TRY | After The Announcement

After the Tourism Revenues data is announced, volatility suddenly increases on the upside, and the candle closes as a bullish candle. The reason behind the sudden weakness in Turkish Lira is from the fact that the Tourism Revenues were almost halved in the fourth quarter compared to the third quarter. This made traders sell Turkish Lira and buy U.S. dollars. The buying strength coming exactly from the ‘support’ is a confirmation sign that the market will move higher, and one can go ‘long’ in the pair with stop loss below the ‘news candle.’

NZD/USD | Before The Announcement

NZD/USD | After The Announcement

The above images represent the TRY/JPY currency pair, where we see that, here too, the market is moving in a range before the news announcement. Since the Turkish Lira is on the left-hand side, price is at the ‘resistance’ area just before the announcement. As volatility is high, traders should wait for the Tourism Revenues announcement to get a clarity of the data. Once we know the actual result, we can trade based on the news.

After the data is released, the market expectedly reacts negatively, and price falls to the downside. This fall is due to extremely weak Tourism Revenues data, which made traders sell the currency. As the volatility increases on the downside and the price goes below the moving average, one can take a ‘short’ trade with a stop loss above the ‘resistance’ of the ‘range.’

NZD/USD | Before The Announcement

NZD/USD | After The Announcement

Lastly, we analyze the impact on the EUR/TRY currency pair, where also the market is moving in a range but with a downward bias. As we witness some selling pressure before the announcement, a positive Tourism Revenue data can be an ideal case for going ‘short’ in the pair expecting further downside. However, if the data was to be positive for the Turkish economy, one should wait for additional confirmation before entering for ‘buy.’

After the Tourism Revenues data released, the moves in both the direction and the candle managed to close in green. We do not see a strong up move in spite of weak Tourism Revenues data because selling pressure is high on the downside. As the candle closes, forming an indecision pattern, it is advised to go ‘long’ in the market only after volatility expands on the upside.

That’s about the macroeconomic indicator – ‘Tourism Revenues’ and the impact of its news announcements on the Forex market. If you have any questions, please let us know in the comments below. Cheers.

Categories
Forex Fundamental Analysis

The Momentous ‘Consumer Price Index’ & How It Impacts The Forex Market

Introduction

Consumer Price Index, in short, known as CPI, is one of the most closely watched Fundamental Indicators. It is the most direct measure of the current inflation in the economy that a citizen can look at and find out. Hence, Understanding the Consumer Price Index, its history, and the resultant effect it has on the market is very important to build an understanding of the macroeconomics of a nation.

What is the Consumer Price Index?

As the name suggests, the calculation of this index is from the viewpoint of the end consumer, i.e., a regular citizen who buys his/her daily needs from a local grocery store or market. Consumer Price Index, in the simplest sense, is the average of the most commonly purchased household goods and services like toothpaste, milk, grocery, petrol, etc. But instead of a simple average here, each good and service is assigned a certain weightage based on their importance or usage degree amongst the population.

For example, milk, which is a daily need for many consumers, will have a higher weightage in the mean price calculation than that of furniture, which we do not purchase daily or frequently. Also, when we say most commonly purchased goods and services, it covers a wide range of goods and services (over 80,000 items) and does not include rarely purchased items like stocks, bonds, foreign investments, or real estate.

How is the Consumer Price Index CPI calculated?

The Bureau of Labor Statistics (BLS) surveys the prices of 80,000 consumer items to create the index and publishes it monthly. The Consumer Price Index has two subcategories; one is CPI-W, which stands for Consumer Price Index for Urban Wage Earners and Clerical Workers. CPI-W statistics are published first, and later the CPI-U (Consumer Price Index for Urban Consumers) values are released. CPI-U is a broader statistic in terms of population and goods & services coverage.

CPI-U is the more accurate and complete statistic relatively as it takes the urban population, which represents about 93% of the United States population into account. While the CPI-W covers only about 29% of the population. Hence, It is the measure of an aggregate weighed in the price level of most commonly bought goods and services. The list includes items like food, clothing, shelter, fuel, transportation fares, service fees (water and sewer service), etc.

Consumer Price Index, whenever released, is given out as a percentage change, and here the change is concerning the previous number, which can be monthly, quarterly, or yearly.

Note: Here, the base year cost amounts to 100, and this base year is in the year 1982 to 1984, where the average amounted to 100. But the data released monthly is shown as a percentage increase or decrease concerning the previous period (usually the previous month).

Why is the Consumer Price Index important?

The importance of the Consumer Price Index is many-fold. First are the range and history of the data. With such a huge data set, the reliability is pretty high, and it usually depicts the macroeconomic picture of a country. For example, the history of CPIAUCSL (Consumer Price Index for All Urban Consumers: All Items in U.S. City Average) goes all the way back to 1947. Second is the frequency & direct ground-level nature of the statistic meaning this data brings out. CPI is a real-time reflection of the current economic situation faced by the end customer or citizens.

Thirdly, the change in CPI is useful to ascertain the retail-price changes associated with the country’s cost of living. Hence it is used widely to assess inflation in the United States. In this Index, there are many subcategories, wherein certain goods and services get included or excluded from the basket to give a more accurate picture of inflation in absolute or relative terms. For example, Core CPI strips away food, gas, and oil prices from the equation as the prices of these items are relatively volatile.

How can the Consumer Price Index be Used for Analysis?

Due to the diversity in the statistics, different sectors of economists can isolate and use the Consumer Price Index for their purpose. For example, the United States Bureau Of Labor Statistics provides indexes based on various geographic areas also. Moreover, they even release average price data for select utility, automotive fuel, and food items, which gives this Index the status of a key indicator in gauging multiple economic indicators.

Consumer Price Index is a widely used indicator for inflation measure. For other economic indicators like hourly wages and currency worth within the nation (dollar’s purchasing capacity to procure goods and services), CPI can be considered as a regulator. On average, for a developed nation like the United States, 0.2-0.5% of Consumer Price Index increase is common, and any number beyond these figures usually indicates volatility in the growth of the economy in either direction.

Sources of Consumer Price Index

The U.S. Bureau of Labor Statistics releases all the indexes that are mentioned above. This data can be found here – Consumer Price Index

You can also find the same indexes along with many others with a comprehensive summary and statistics on the St. Louis Fed website as given below.

CPIAUCSL (CPI for All Urban Consumers: All items in U.S. City Average)

This is a broadly used statistic for measuring the overall inflation. It includes Food and Energy prices, unlike CPIFESL. The information related to this index can be found here.

CPIFESL (CPI for All Urban Consumers: All items minus the Food and Energy in U.S. City)

It excludes volatile components like Food and Energy (Oil Prices) and gives more of a Core CPI change within the United States. The information related to this index can be found here.

Impact due to news release

In this section of the article, we will analyze the impact of the Consumer Price Index (CPI) on a currency right when the announcement is being made and see where the market finally gets to. The image below shows that the CPI data has a huge impact (Red box indicates high impact) on the currency, which means it might cause a drastic change in the volatility after the news announcement. Ideally, if the actual CPI numbers are greater than the forecasted numbers, it is good for the currency and vice versa.

We have taken the recent CPI data of Australia, which is quarter-on-quarter. The quarterly data is more important and impactful than the monthly numbers. The below image gives the 4th quarter data of CPI that was measured in January, and the next quarter data will be released in April. We see below that the CPI data for the 4th quarter was 0.7%, which is 0.2% greater than the previous reading. It is also 0.1% greater than the forecasted number. But, let us see how the market reacted to the data.


AUD/USD | Before The Announcement

The above image represents the chart of AUD/USD, where we see that the market is in an uptrend showing the strength of the Australian dollar. One of the reasons behind the uptrend is that traders and investors forecast the CPI data where they are expecting a 0.1% increase in the same. If the CPI numbers are increased more than expected by the ‘Australian Bureau of Statistics,’ it could be the best-case scenario for going ‘long’ in the market. However, if the numbers are below expectations, volatility could increase on the downside.        

AUD/USD | After The Announcement

Here, we see a sudden surge in volatility on the upside that after the news announcement is made. The reason for this is that the CPI got increased by 0.2%, where the market was expecting a 0.1% rise. The large green candle shows how impactful the CPI data is on the currency. From a trading point of view, one should not be chasing the market but instead, wait for a pullback at the nearest support and resistance area and then take suitable positions. The CPI data was so positive for the Australian dollar that the price does not even come below the moving average. Take Profit‘ for the trade can be at the new ‘high’ with a stop-loss below the opening of the news candle.

AUD/CAD | Before The Announcement

AUD/CAD | After The Announcement

The AUD/CAD currency pair appears to be in a ‘range’ just before the news announcement and is at the bottom of the range. An interesting way of positioning ourselves in the pair is by having small ‘buy’ positions before the news announcement. Because the forecasted CPI data is greater than the previous reading, and we are at a technically important level that is supporting our ‘buy’ positions. The news outcome makes the ‘support’ area work beautifully as the market shoots up to the resistance area. Here too, the data proved to be very positive for the Australian dollar as a higher CPI data drives the currency higher. We can hold on to our trades even if the price is at ‘resistance’ since the news data is very good for the currency, and it has the potential to break the ‘resistance’ and move further.

EUR/AUD | Before The Announcement

EUR/AUD | After The Announcement

In this currency pair, the Australian dollar is on the right-hand side, which means a positive CPI data should take the currency lower. We can see that the Australian dollar already strong as the market is in a downtrend, and the market participants are optimistic about the CPI data of Australia. After the CPI announcement, the volatility increases on the downside, taking the price to a new ‘low.’ Again, when we witness better than expected data of any economic indicator, we should not be chasing the market but wait for a retracement to key levels. In this case, since we don’t see a retracement after the red ‘news candle,’ only aggressive traders can take ‘short’ positions with the confidence that the CPI numbers were exceedingly better than before and that it will take the currency lower.

That’s about CPI and its impact on the Forex market. We hope you find this information useful and if you have any questions, shoot them in the comments below. Cheers.