Introduction
Car Production figures are used by economists and investors as a measure of wealth per capita. Among all the Industrial Production figures, which covers different sectors, Automotive industry production figures’ implications are different from industries producing essential goods like (Food, daily needs goods). An increase in vehicle production is indicative of an increase in per capita income, and other economic conditions. Hence, individual analysis of Car Production figures can help investors, and economists to analyze economic health, and standard of living in the country.
What is Car Production?
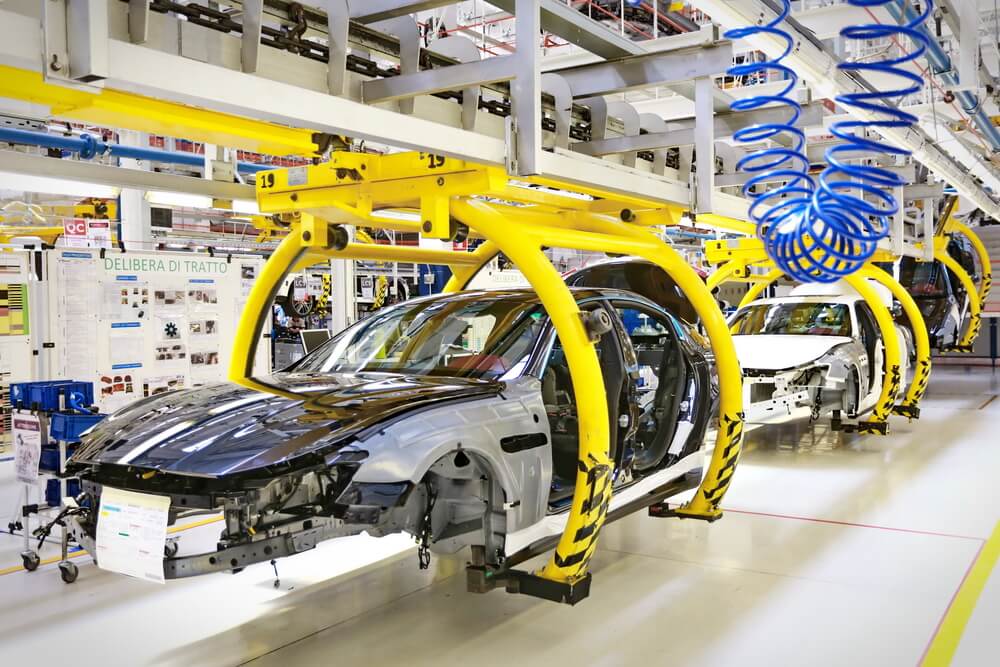
Car Production is the total Auto output of Automative Industries in a given economic region for a specific period. The number of motor vehicles manufactured is assessed and categorized based on the type of vehicle. A typical automotive industry would generally have multiple classes of vehicle manufacturing ranging from 2-wheeler bikes to 18-wheeler trucks. Car Production statistic is the production of Cars (called Auto in the statistics) and excludes Trucks and two-wheeler bikes.
In this statistic, Car Production has a separate and special significance. Consumers make up 66% of the private sector, and businesses make up 34% in the United States. Owning a car is more important to people than owning a house. In today’s mobile world, with different modes of transportation available, the car is still an essential expense for the average public. 85% of the Americans own a car, which indicates its significance in day-to-day life. We cannot deny the importance of having a car for commuting as per our convenience.
How can the Car Production numbers be used for analysis?
In the developing economies like India, the number of households that own a car is just 11% as per a survey in 2016, which is a 200% increase from its previous survey in 2011, where it was only about 5%.
Hence, Car Production can be used to draw multiple conclusions, which are as follows:
Standard of living: As the standard of living increases, more and more people can afford luxury goods. While owning a car might not seem like a luxury, but for the developing economies, it does. Also, the range of cars today that are available for purchase, it mirrors the wealthiness of the economy.
Dependent Industries: A car production typically involves several parts that are obtained from other industries, like the car body requires steel, tires require rubber, etc. Hence, Steel Production figures are influenced by the demand from Car Production figures. One-fifth of American Steel Production and three-fifths of rubber manufactured goes to the Automotive Industry. Machine tools, petroleum refining technology industries, paint, plate-glass industries are all stimulated through the Automotive industry.
Indirect Dependent Industries: Increased Car Production signals more cars or vehicles are going to be on the road, or need to be delivered, which brings business for freight operators, and road construction firms. As traffic increases, Fiscal policymakers intervene and fund road projects to build a better network of highways to solve this issue.
Investors can look at Car Production figures and analyze the stimulus it brings on industries dependent directly or indirectly. For example, a general trend in the local production of Cars increase can signal that a construction company like L &T could obtain a contract for road betterment, or a tire company like MRF could see a spike in their business due to increased demand. The cause-effect analysis can help investors make the right stock decisions.
Car is a convenience and not essential like Food. But it has gained the status of an essential item in developed economies. While the developing economies are also getting there, economists can see the changes in Car Production figures. By doing this, they can understand the change in spending patterns of consumers from saving to purchasing Cars. If these numbers increase, it is an indication of an increase in consumer sentiment, business sentiment, employment, wage growth, an increase in disposable income, or improvement in the standard of living.
In the United States, the Car Production figures are part of the Industrial Production reports. The Industrial Production figures tell the overall macroeconomic picture, about how business production and capacity utilization is increasing but does not tell us what sectors growth are increasing or decreasing and its corresponding implications. Car Production figures, in this sense, paints a better picture.
For example, an increase in Coal production could only imply an increase in exports, which is good for the economy, but an increase in Car Production figures indicate more and more people are coming into the middle-class from lower sections and can afford cars. It implies that the overall standard-of-living is increasing.
Also, the automotive industry is a vital element in many industrialized economies like the United Kingdom, France, Germany, Japan, etc. where healthy amounts of Car Production is essential to maintain International Trade balances.
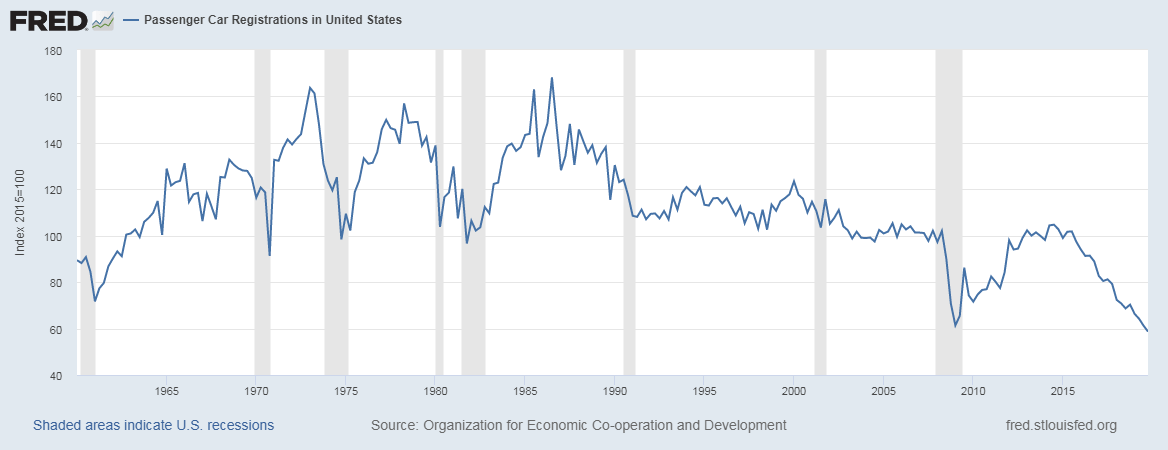
With more and more emerging economies like China, India, Japan, etc. improving their economic conditions aggressively through export-led growth in the international markets, the overall number of people above the poverty rate is increasing, which would ultimately translate into increasing Car Production and Steel Production figures in the upcoming times. The below plot justifies our conclusions above.
Impact on Currency
Car Production statistic is a proportional indicator; meaning increase or decrease in the statistic is followed by currency appreciation or depreciation, respectively. Although, it is essential to note that Car Production is a lagging indicator as the corresponding increase would have already been implicated through leading and coincident indicators like Consumer, business surveys, or improvement in the Disposable Income figures.
Hence, it is a low impact indicator. It is more useful in the long-term understanding of trends and can help investors with stock-portfolio decisions in the stock market having their stake in the dependent industries, which could be affected by the Car Production figures. It can overall act as a double-check for our fundamental analysis but not as a metric to predict future economic growth.
Economic Reports
The “Industrial Production and Capacity Utilization – G17” reports are published at 9:15 AM every around the middle of the month by the Federal Reserve in the United States on its official website. The reports are in the formats of estimates and revised estimates. Under this section, the report titled “Table 3 Motor Vehicle Assemblies” contains the Autos figures, which we are interested in our analysis.
The International Organization for Motor Vehicle Manufacturers also provides an aggregate summary of vehicles produced on its website.
Sources of Car Production
The monthly Car Production statistics are available on the official website of the Federal Reserve for the United States. The St. Louis FRED website provides a comprehensive list of Industry Production, and Capacity Utilization reports on its website with multiple graphical plots, which are available here. We can also find global Car Production figures for various countries in statistical formats here and here.
Impact of the ‘Car Production’ news release on the price charts
In the previous section of the article, we understood the Car Production economic indicator and saw how investors use it for analyzing the economic state of a country. Car Production numbers are a critical component of industrial growth, which highlights the state of the automation sector of the country. The auto industry contributes 3-3.5% to the overall Gross Domestic Product (GDP) and employs a large number of people across different divisions in the industry. Cars manufacturing is a major contributor to this sector, and thus investors give a reasonable amount of importance to this data.

In today’s example, we will be analyzing the impact of Car Production on British Pound, and the below image shows the percentage fall in total production as compared to the previous year. We see that Car Production dropped by 0.8%, which was slightly better than the previous reading. This may be mainly due to slower demand in the local and foreign markets. Let us look at the market’s reaction to this data.

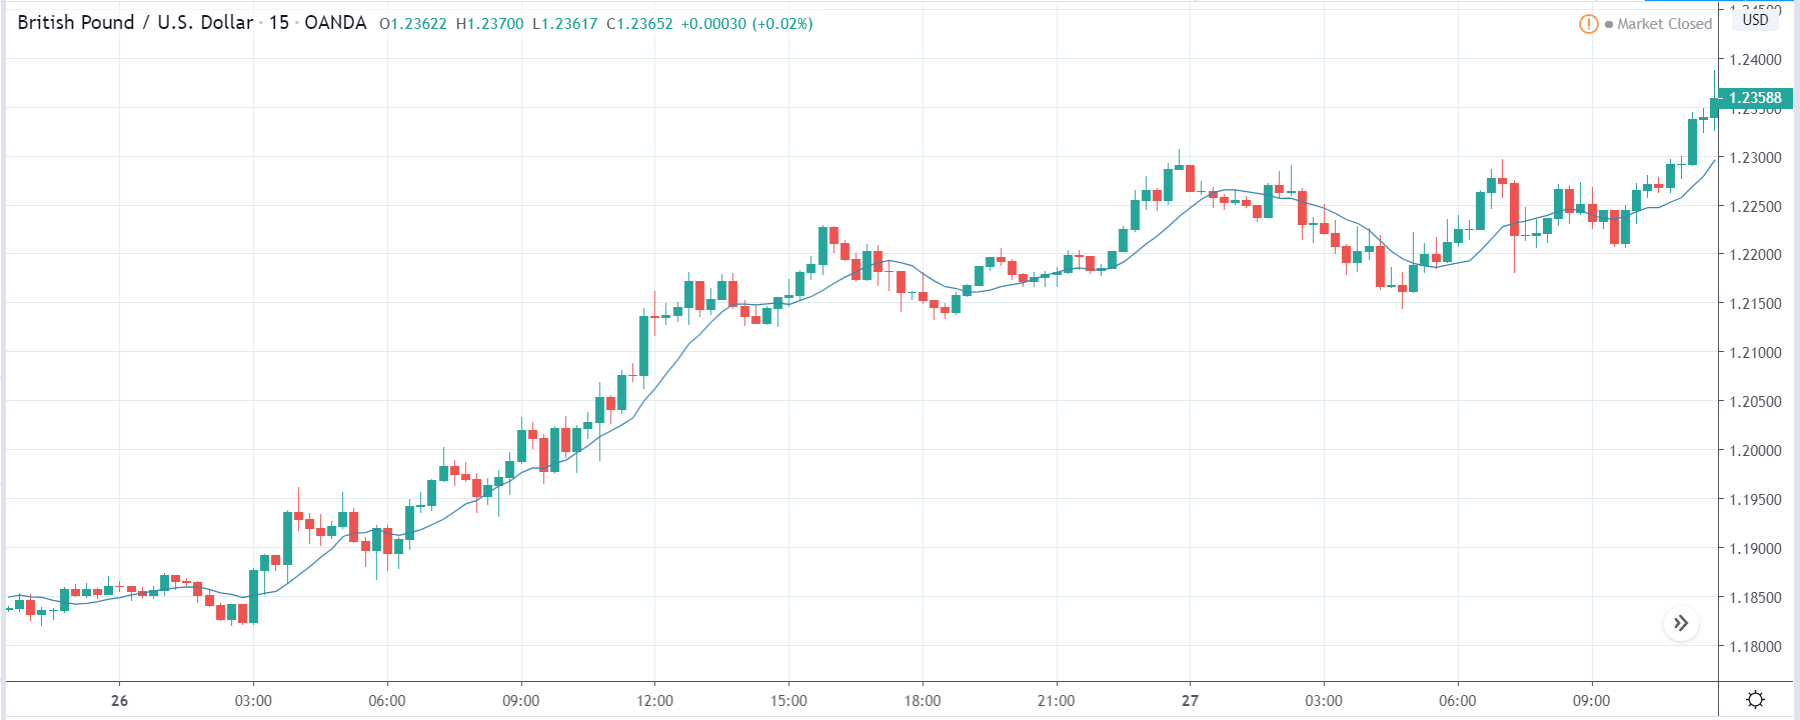
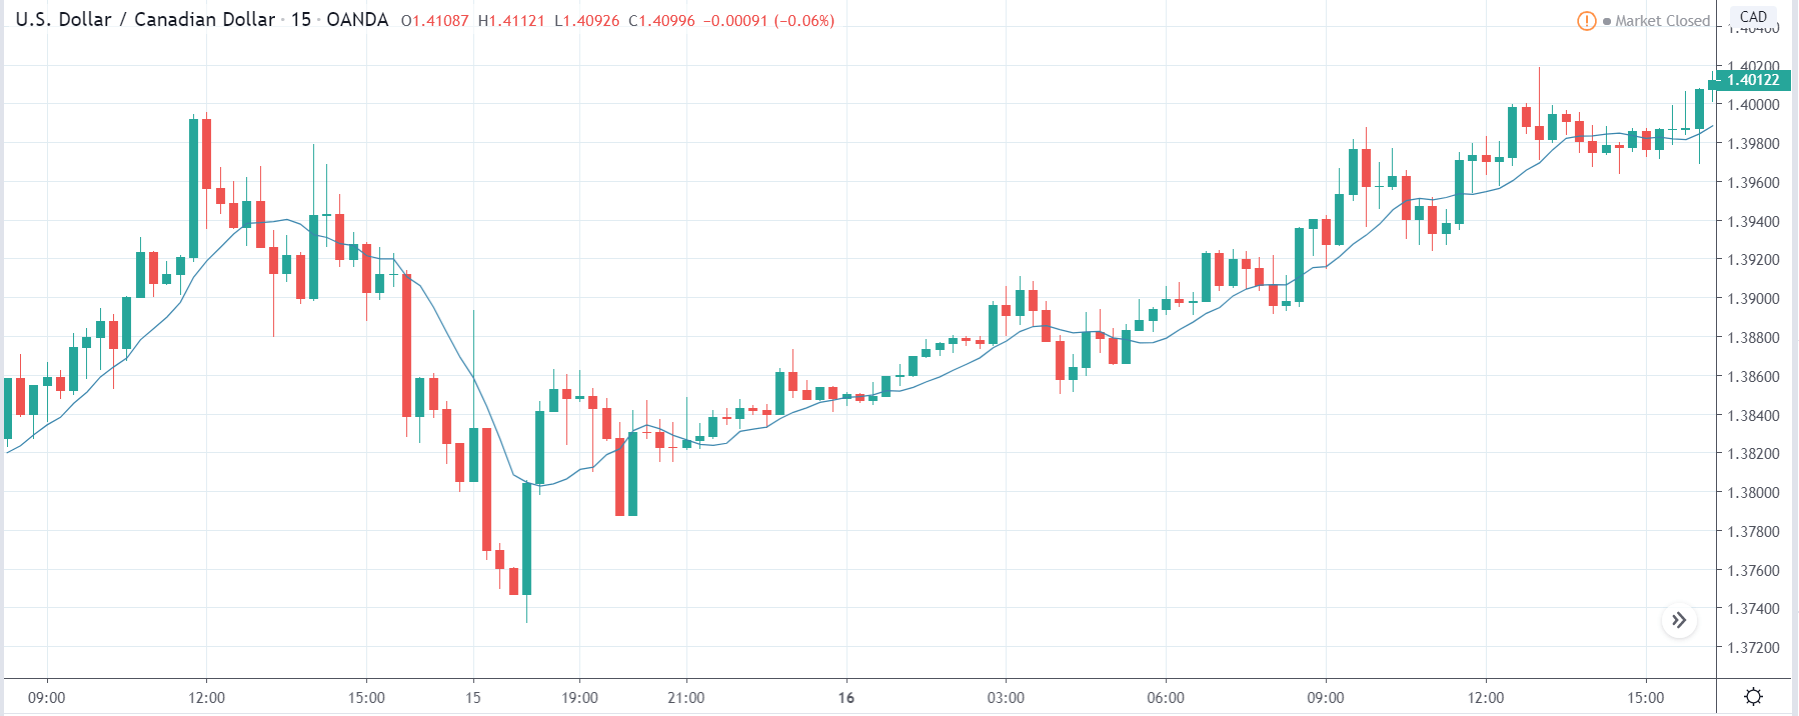
GBP/USD | Before the announcement:
We will begin our evaluation by analyzing the GBP/INR currency pair. The above image shows the behavior of the pair before the announcement is made. We see that the market is resiliently going up with minimum retracement. This means the British Pound is very strong, or the U.S. dollar is really weak. At this point, we cannot take any position in the market as technically; this would mean chasing the market.
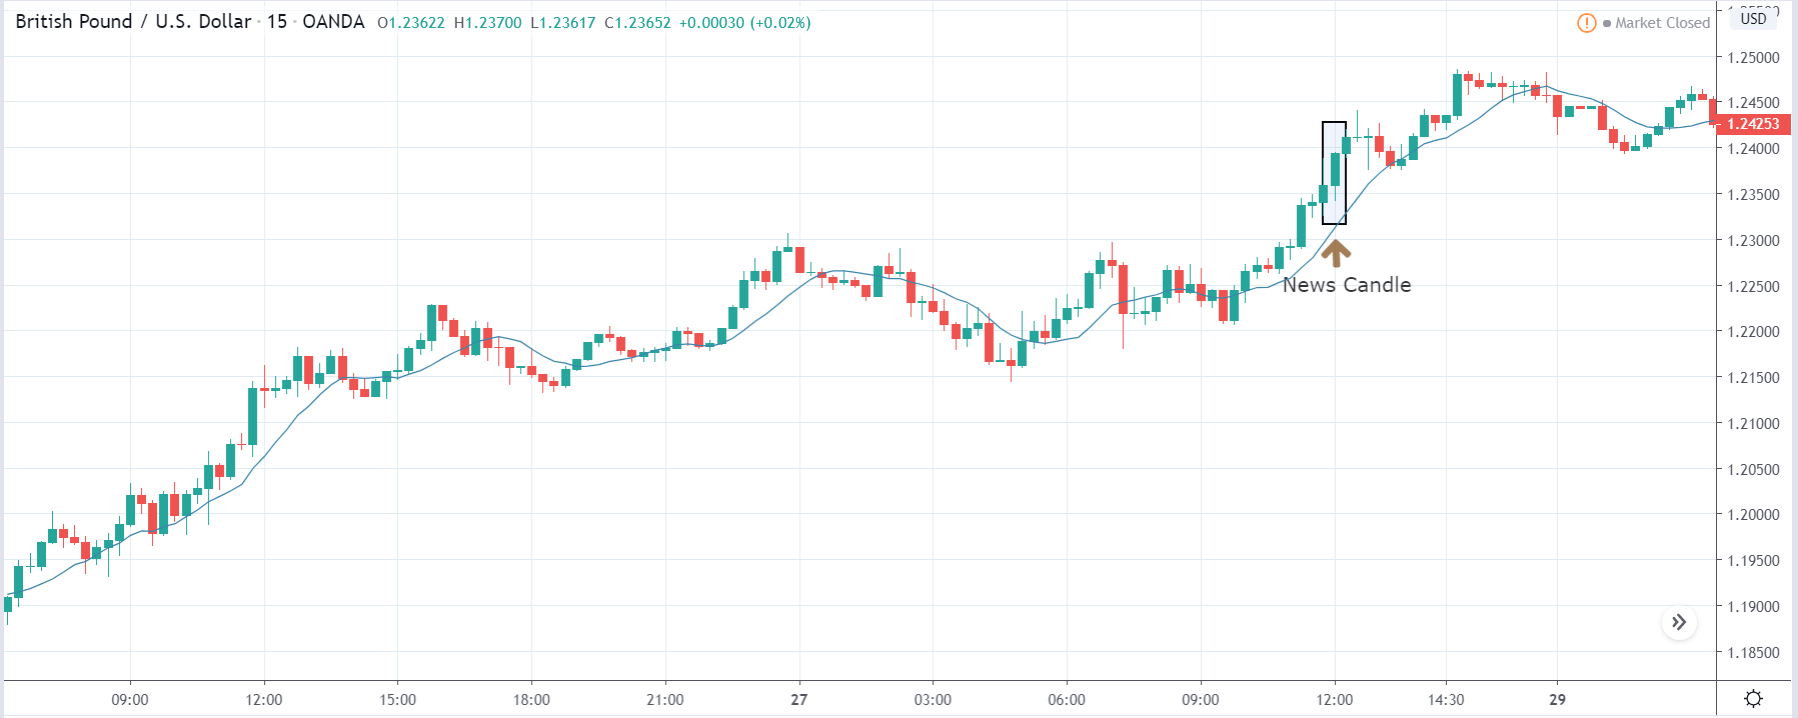
GBP/USD | After the announcement:
After the news announcement, the price rallies further, and volatility expands on the upside. The Car Production data was taken well by the market players who took the price higher and closed the ‘news candle’ with a decent amount of bullishness. As a result, the uptrend gets extended further due to the positive news data. In order to trade the pair, one needs to wait for the price to retrace to the nearest’ support’ and then analyze accordingly.
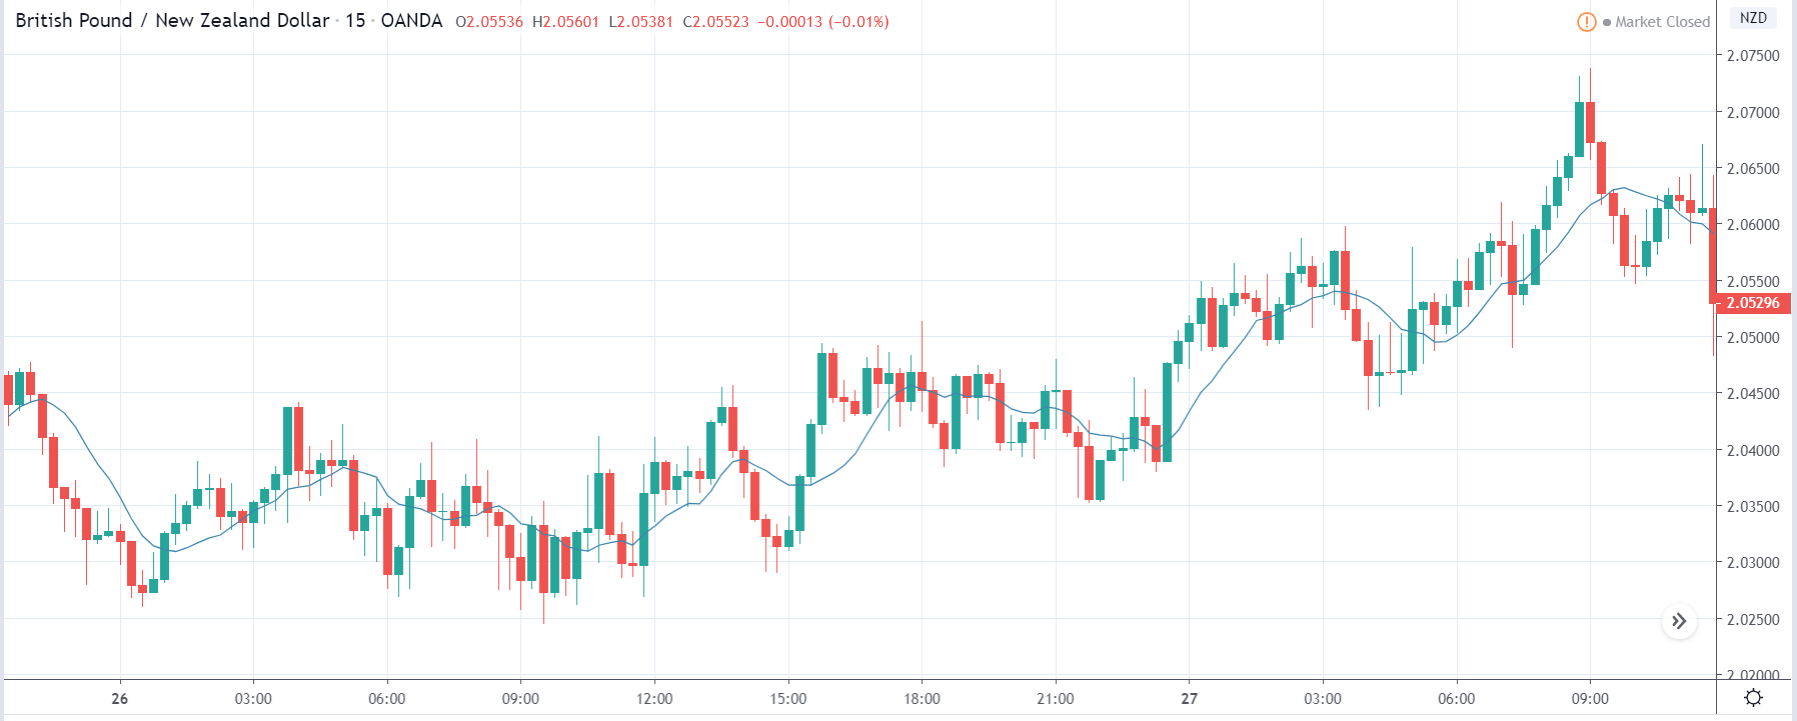
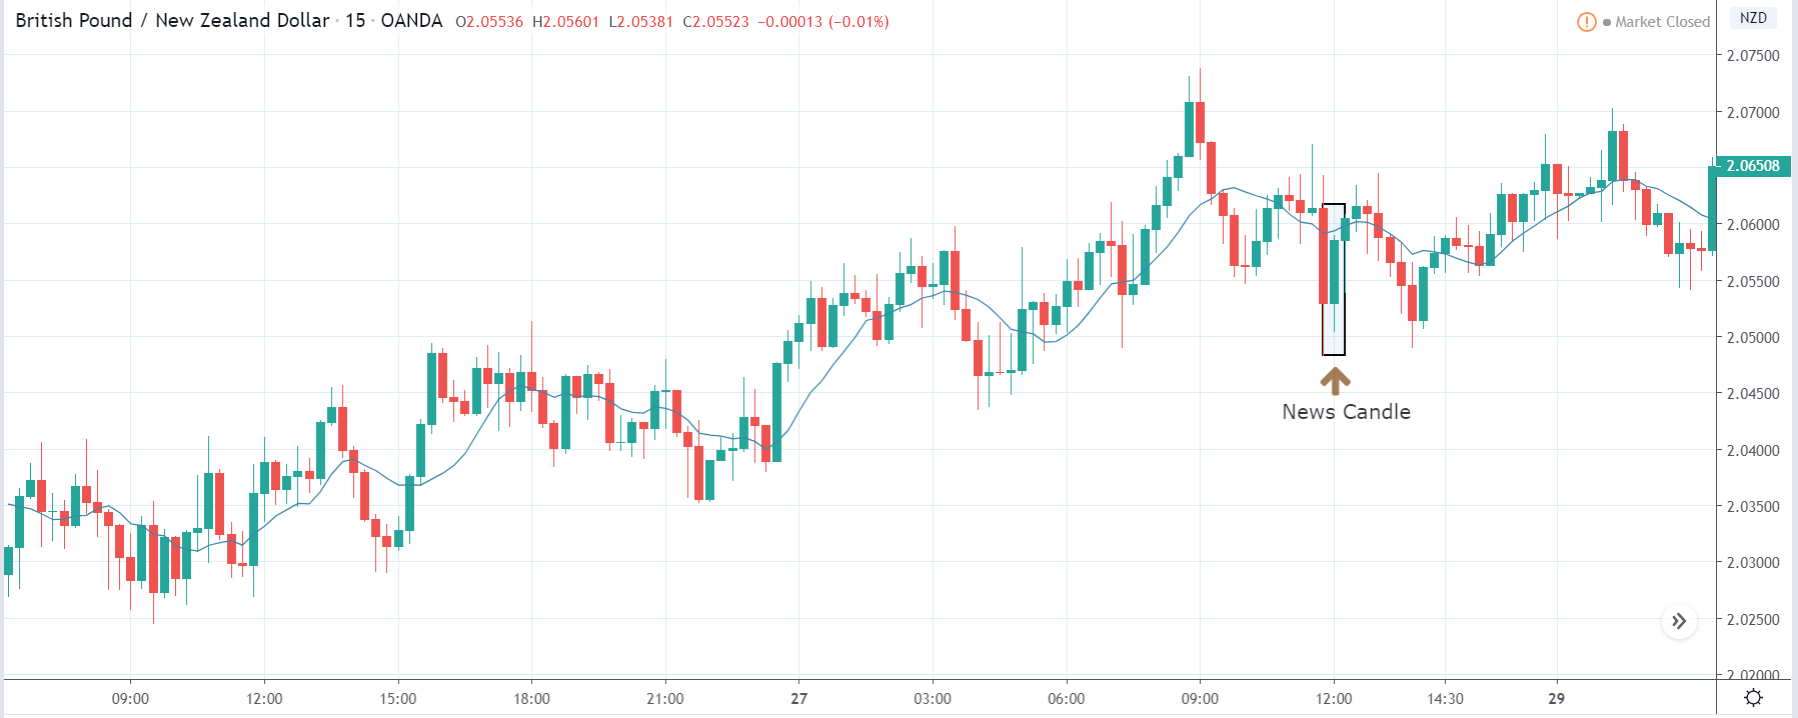
GBP/NZD | Before the announcement:
GBP/NZD | After the announcement:
The above images are that of GBP/NZD currency pair, where in the first image, we see that the market is in an uptrend, and recently the price has retraced to a ‘support’ area. Technically, this is an ideal place for going ‘long’ in the market with a small stop-loss loss. The volatility, before the announcement, appears to be on the higher side, so conservative traders need to be cautious while trading the currency pair.
After the news announcement, volatility surges, and the price significantly moves higher within no time. This reflects the positiveness in the Car Production data, which was better than last time. After this sharp reversal, traders can take ‘long’ positions with a stop loss below the ‘news candle.’
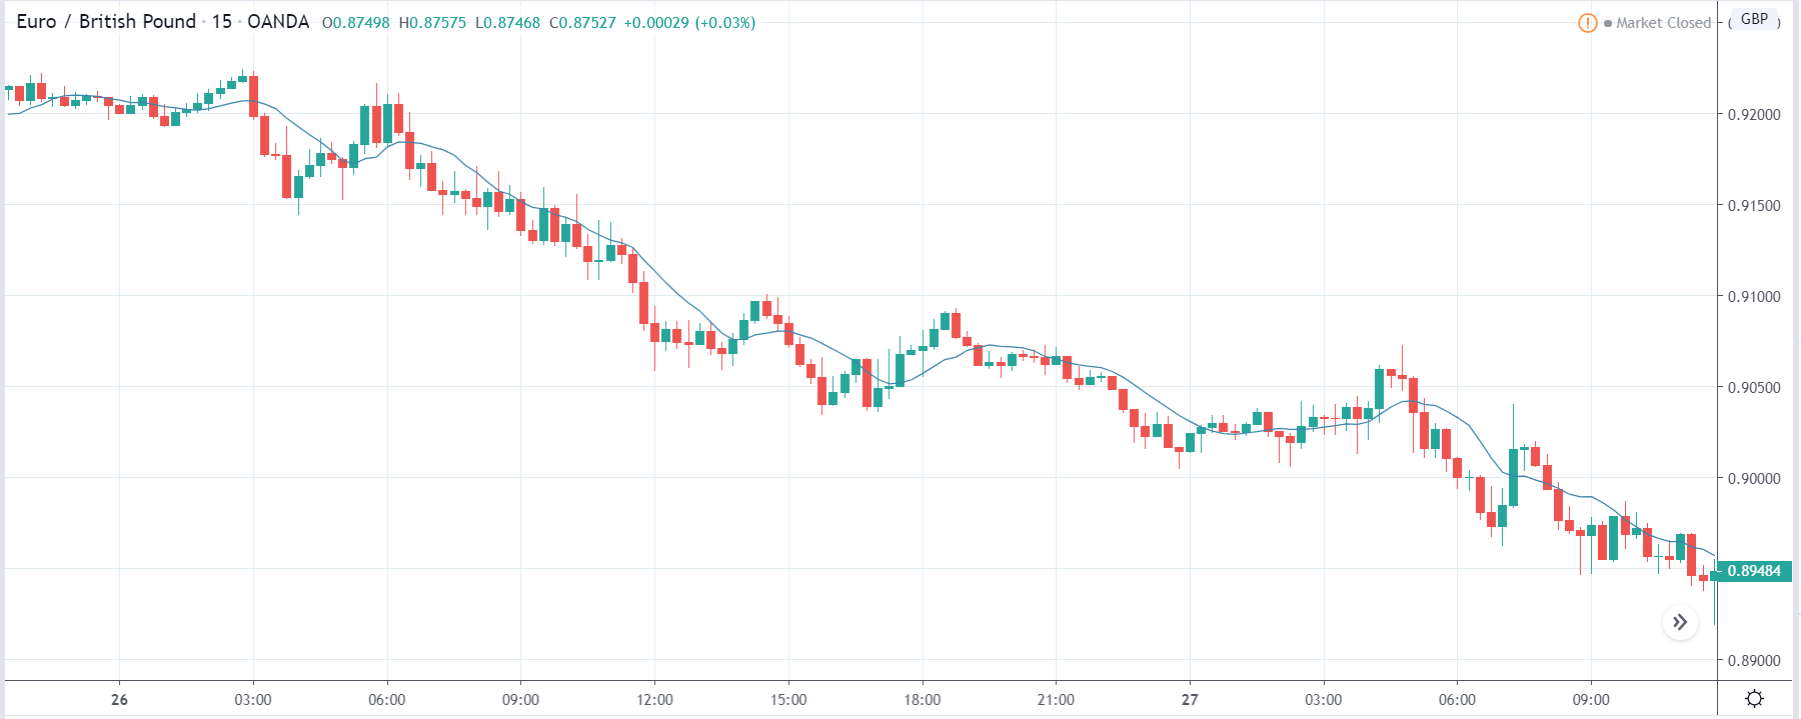
EUR/GBP | Before the announcement:
EUR/GBP | After the announcement:
Lastly, we shall analyze the impact on the EUR/GBP currency pair and see the change in volatility. Here, before the news announcement, the market is in a strong downtrend with almost no ‘pullback,’ indicating a remarkable amount of strength in the British Pound. Since we only see nothing but red candles, selling at any point would mean chasing the market. From a risk aversion perspective, we should always trade the retracement of a trend and not when the trend itself.
After the news announcement, the market falls further and reacts similarly to the above currency pairs. The positive Car Production data increased the volatility to the downside by further strengthening the British Pound. We will be able to take a sell trade only after the price retraces to the nearest’ resistance’ or ‘supply’ area.
That’s about ‘Car Production’ and its impact on the Forex market after its news release. If you have any questions, please let us know in the comments below. Good luck!

