Categories
Forex Fundamental Analysis

What Is ‘GDP From Public Administration’ Forex Fundamental Driver All About?

Introduction

Public Administration is a critical aspect that drives overall economic growth. GDP from Public Administration can give us insights into the strength of the current central authorities’ efficiency in governance. Public Administration is the levers to the economic engine, and it can put brakes or accelerate the economy to sink into a recession or propel to economic growth. Hence, understanding Public Administration and its contribution to GDP will help us better understand its role in society’s functioning as a whole.

What is GDP from Public Administration?

Gross Domestic Product

GDP is the measure of a country’s total economic output. It is the total monetary value of all the goods and services produced within the country regardless of citizenship (resident or foreign national).

It is the market value of all the finished goods and services within a nation’s geographical borders for a given period. The period is generally a quarter (3 months) or a year.

The commonly used term “size of the economy” refers to this economic indicator. The USA is the world’s largest economy, and it means it has the highest nominal GDP or highest economic output.

Public Administration

It is the implementation of government policies. Public Administration is a part of every economy. Policies can be either monetary policy or fiscal policy.

Public Administration is concerned with the operations of government that run the nation. It is centered around the structuring of the Government policies and programs and government officials’ conduct to implement the same.

Public Administration’s definition and goals are vast subjects. In our analysis, we will only focus on the economic impact of Public Administration. 

How can the GDP from Public Administration numbers be used for analysis?

An analogy to understand the importance of Public Administration would be if an economy or nation is viewed as a car or engine. Public Administration would be the brake, gear, and acceleration levers. Levers determines whether the car moves forward or backward, and also the pace of movement.

Similarly, Public Administration determines what direction the economy’s growth is going towards and at what rate. Monetary policy is associated with the Central Bank of a nation. Fiscal Policies are associated with the Central Government. 

Officials working as per the Public Administration policies are called Civil Servants, together the Governing body and its policy determine how effectively the opportunities are maximized to satisfy the public demands and lead to overall economic wellbeing.

Policy reforms and effective Administration can reduce economic disparity amongst different classes of people, increase employment, wages, and business prosperity. Government Spending, Tax programs, Outlays, allowances, funding programs are all part of the Government policy. Public Administration determines how effectively such policies are implemented.

Public Administration provides the foundation for economic activity through laws and as a catalyst to economic wellbeing through its services. 

Without firm laws and regulations and active civil servants, the nation is in jeopardy. Weak governance and policy can sink the nation where corruption, political instability, riots, public protests, etc. can creep in. 

Services like transportation, maintaining law and order, road construction, police, jails, tax exemptions, medicare, social security, etc. directly may or may not generate revenue for the government but indirectly helps other sectors to boost overall economic prosperity.

When a nation’s government fails to stimulate the economy, there is a probability that it will continue for its elected period. Hence, International Investors can glean such clues from GDP from Public Administration figures. They can understand the behavioral nuances of the government and its probable impact in the upcoming quarters.

The government impacts the people and the business. On an absolute basis, the government has complete control over the nation for the elected period. It can bring about any policy reforms they see fit. It can help businesses or impede businesses. It can control money flow through the economy, and how much people pay taxes.

It is also essential to perceive that the GDP from Public Administration is only part of the government’s revenue. It assists in the functioning of other sectors through its public services that are not accounted for in the GDP. 

Hence, GDP from Public Administration itself does not tell us the real contribution of Public Administration in growth. The functions of a government span across various sectors and vary from region to region based on the economic region’s requirements.

Impact on Currency

The GDP from Public Administration is a low impact indicator, as the broader measures like Real GDP and GDP Growth Rates are more important for the Currency Markets. 

GDP from Public Administration does not paint the full picture of the economy, but it tells us the effectiveness of the current government and its policies. Still, for the International Currency Markets, it does not serve as a useful indicator.

It is a proportional and lagging indicator. Higher GDP from Public Administration is good for the economy and its currency, and vice-versa.

Economic Reports

For the United States, the Bureau of Economic Analysis releases quarterly GDP figures on its official website every quarter. The release schedule is already mentioned on the website and is generally released one month after the quarter ends.

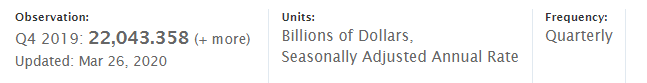
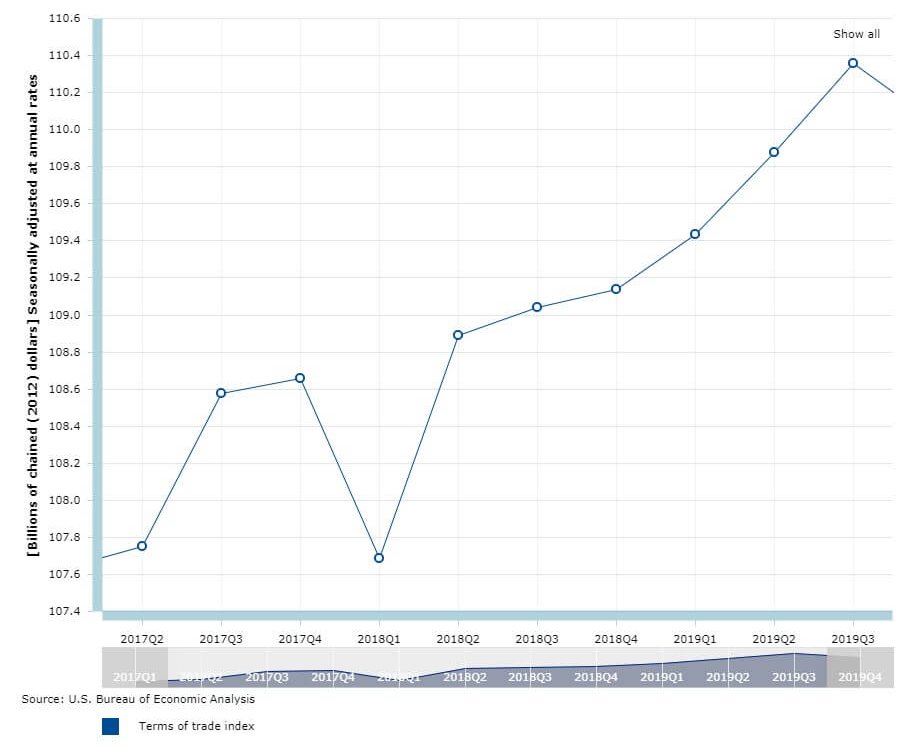
In the full report, we can extract the GDP from Public Administration figures. We can also go through GDP by Industry to get the Public Administration performance in the report. Below is a sample of the same:

World Bank actively maintains track of GDP by Sector figures of most countries on their official website. Public Sector 

Sources of GDP from Public Administration

For the United States, the BEA reports are available here.

We can use the GDP by Industry to see the government’s contribution to GDP here. 

Different metrics like Public Debt, Expenditure, etc. are all categorically available here.

We can also find GDP from Public Administration for different countries here.

Impact of the ‘GDP From Public Administration’ news release on the price charts 

In the previous section of the article, we understood the importance of Public Administration in an economy and how it impacts economic growth. It plays an essential role in overseeing and shaping new impact market strategies. It is the responsibility of public administrators, whether policymakers or non-profit executives, to make use of the opportunity to ensure that the economy flourishes.

Profound policies are needed to facilitate private-sector investment in socially beneficial concerns. All this is in the hands of public administrators and the government. Therefore, the department has a fair amount of contribution to the GDP and the economy. When it comes to investing based on this information, investors do not make investment decisions based on the contribution from different sectors. They look at the final GDP and take a position in the currency.

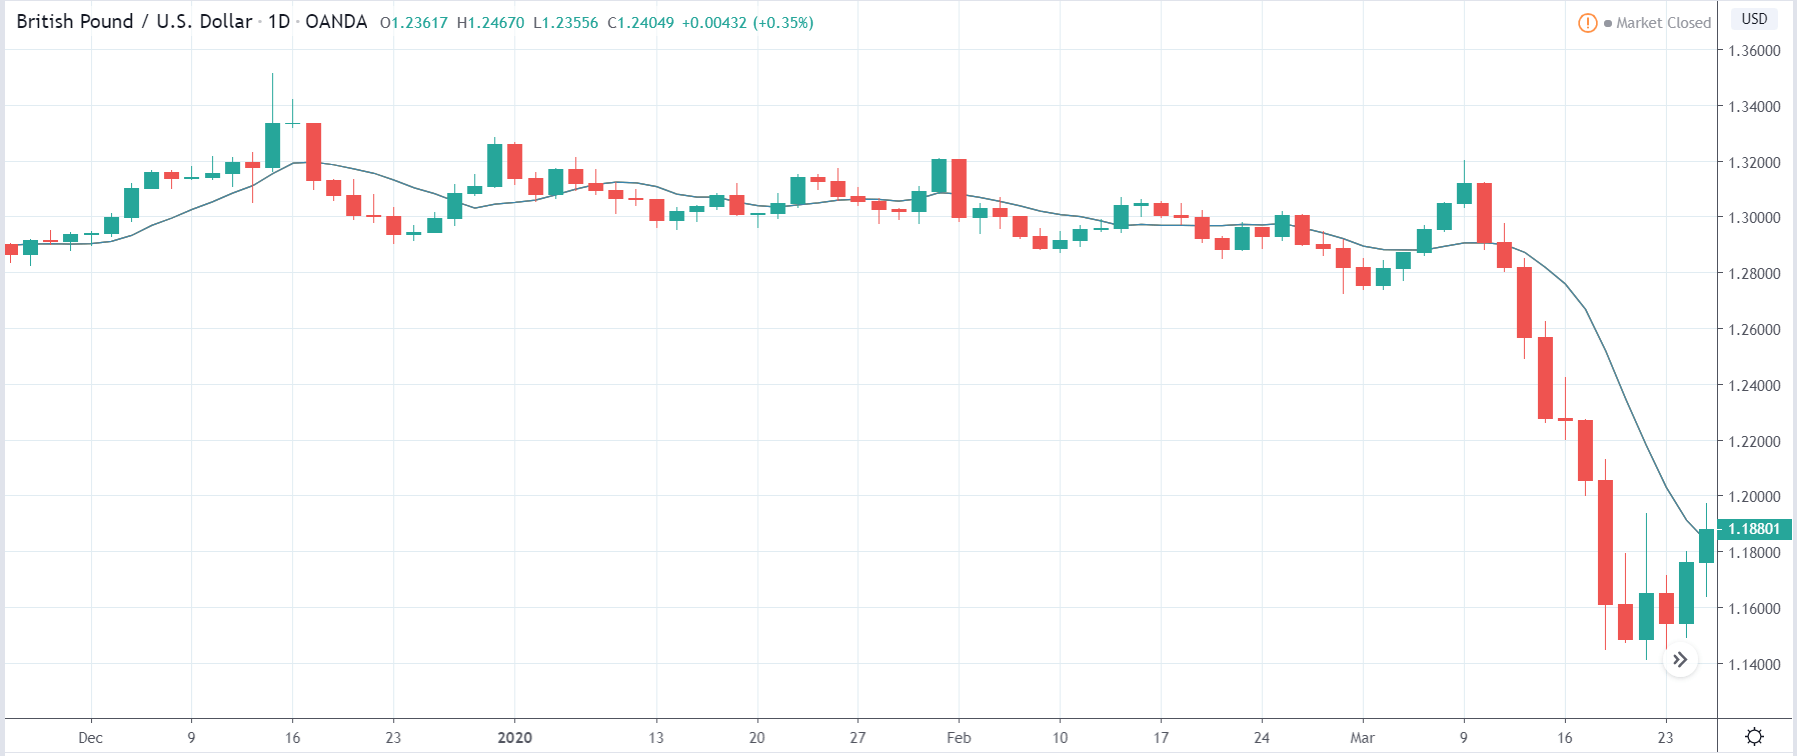
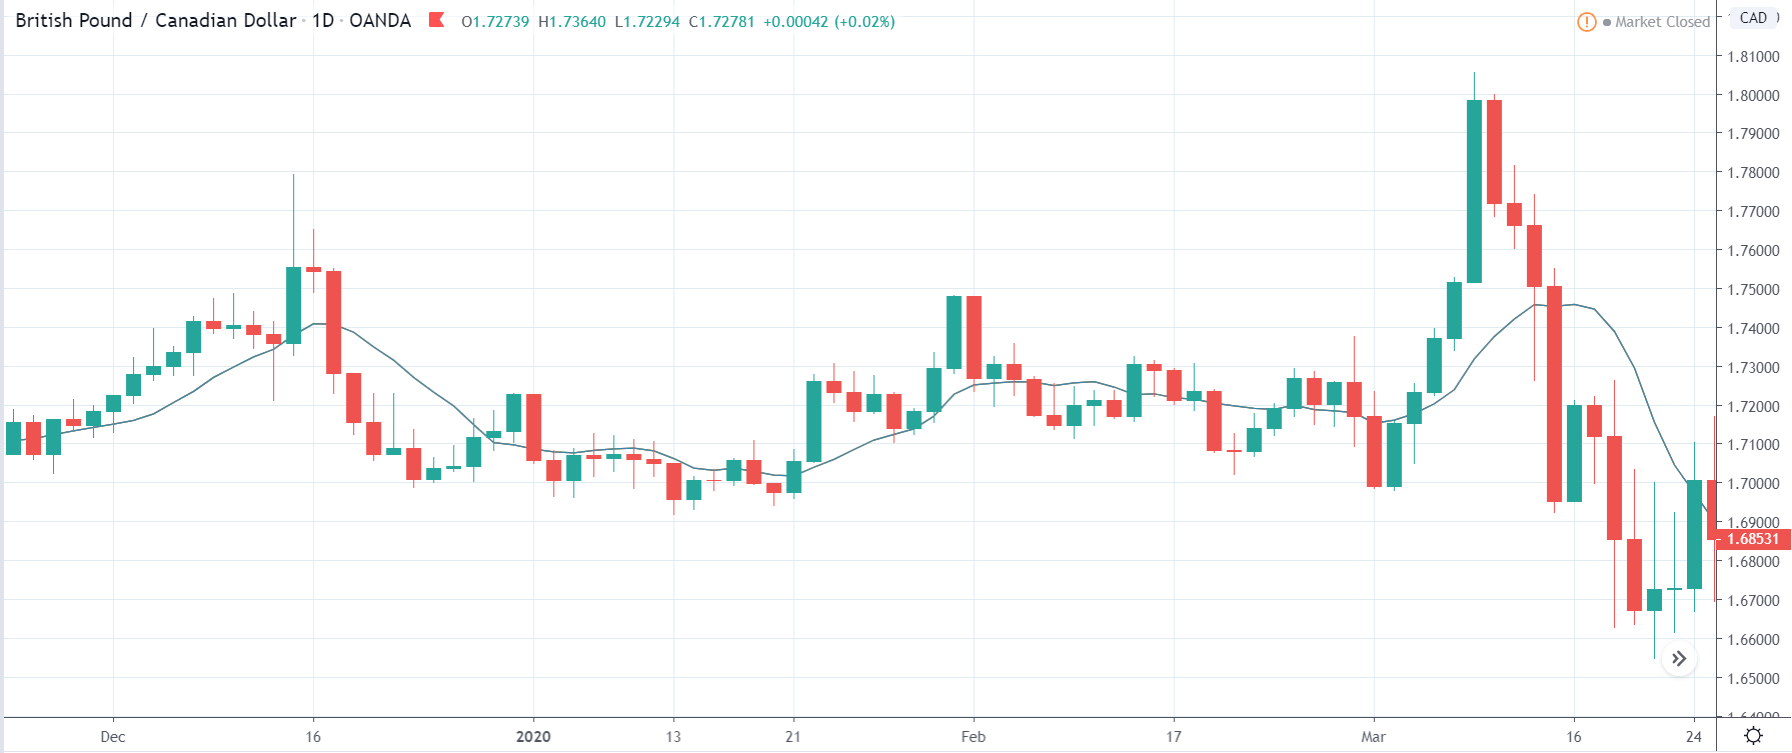
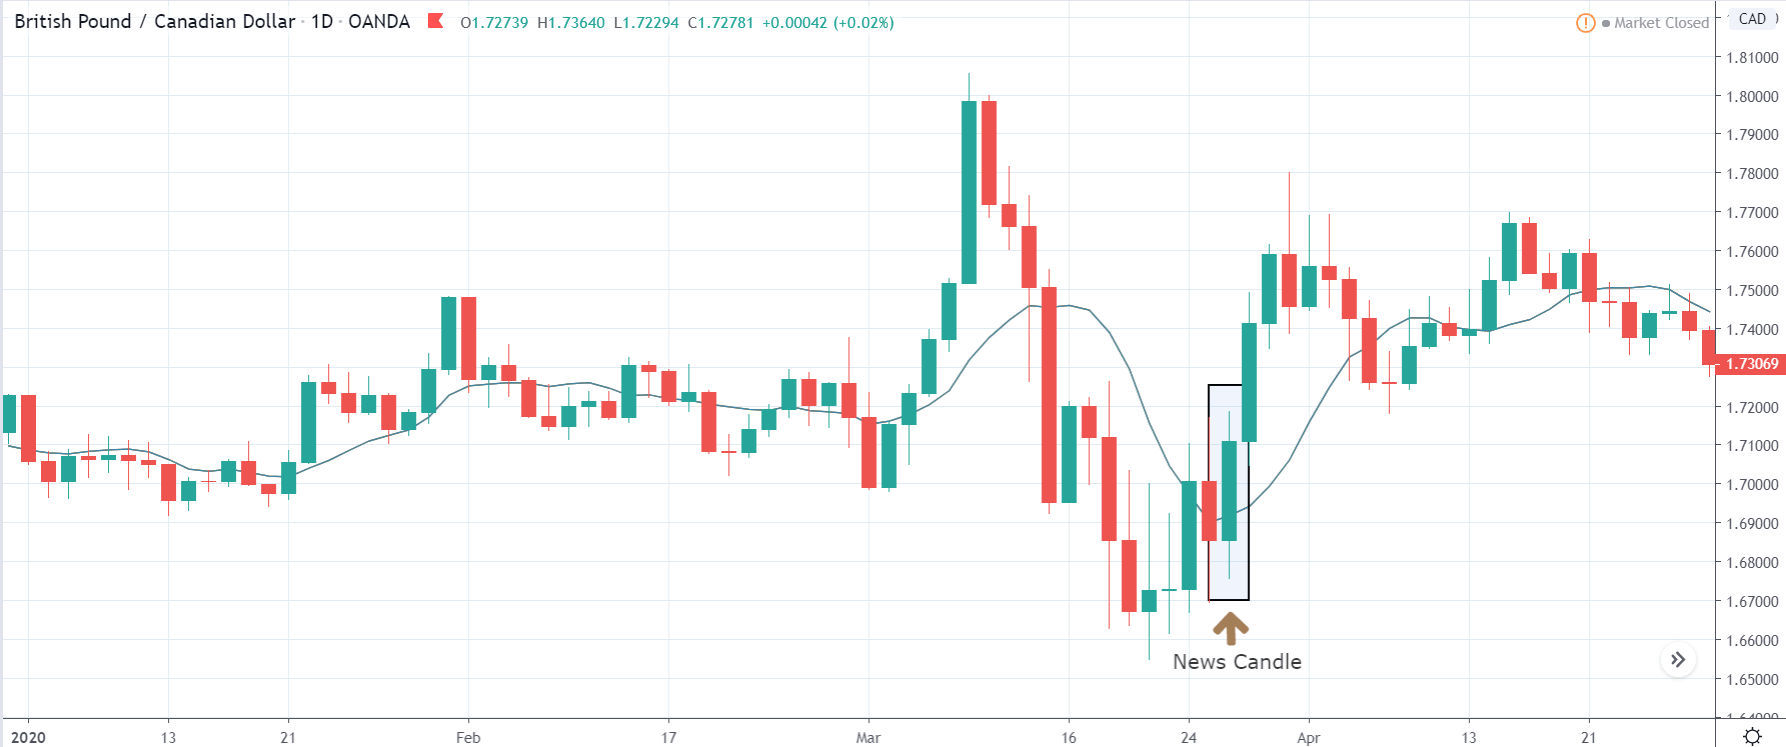
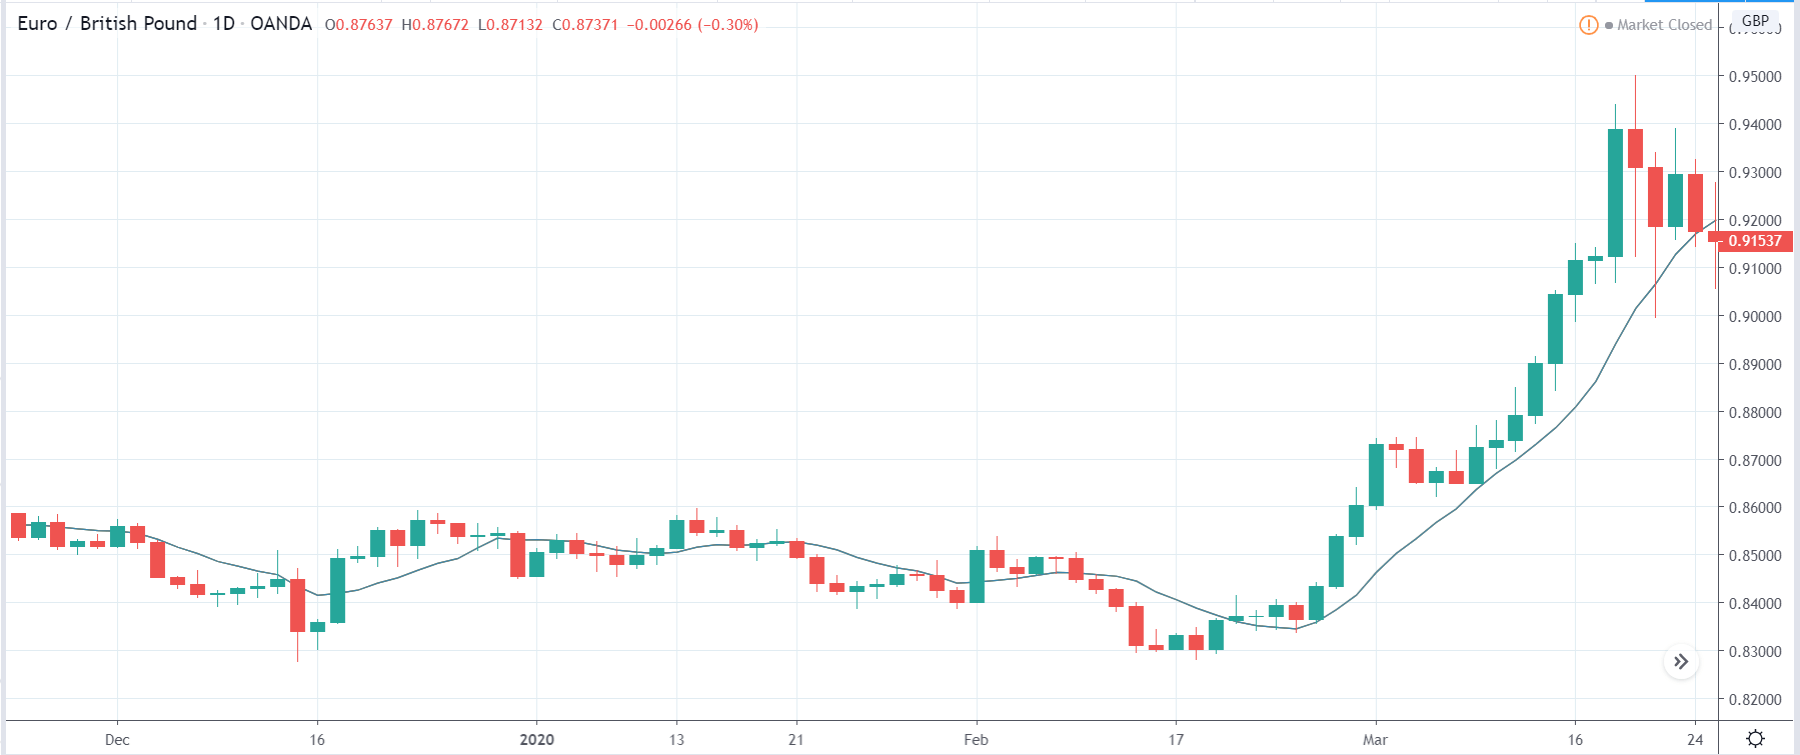
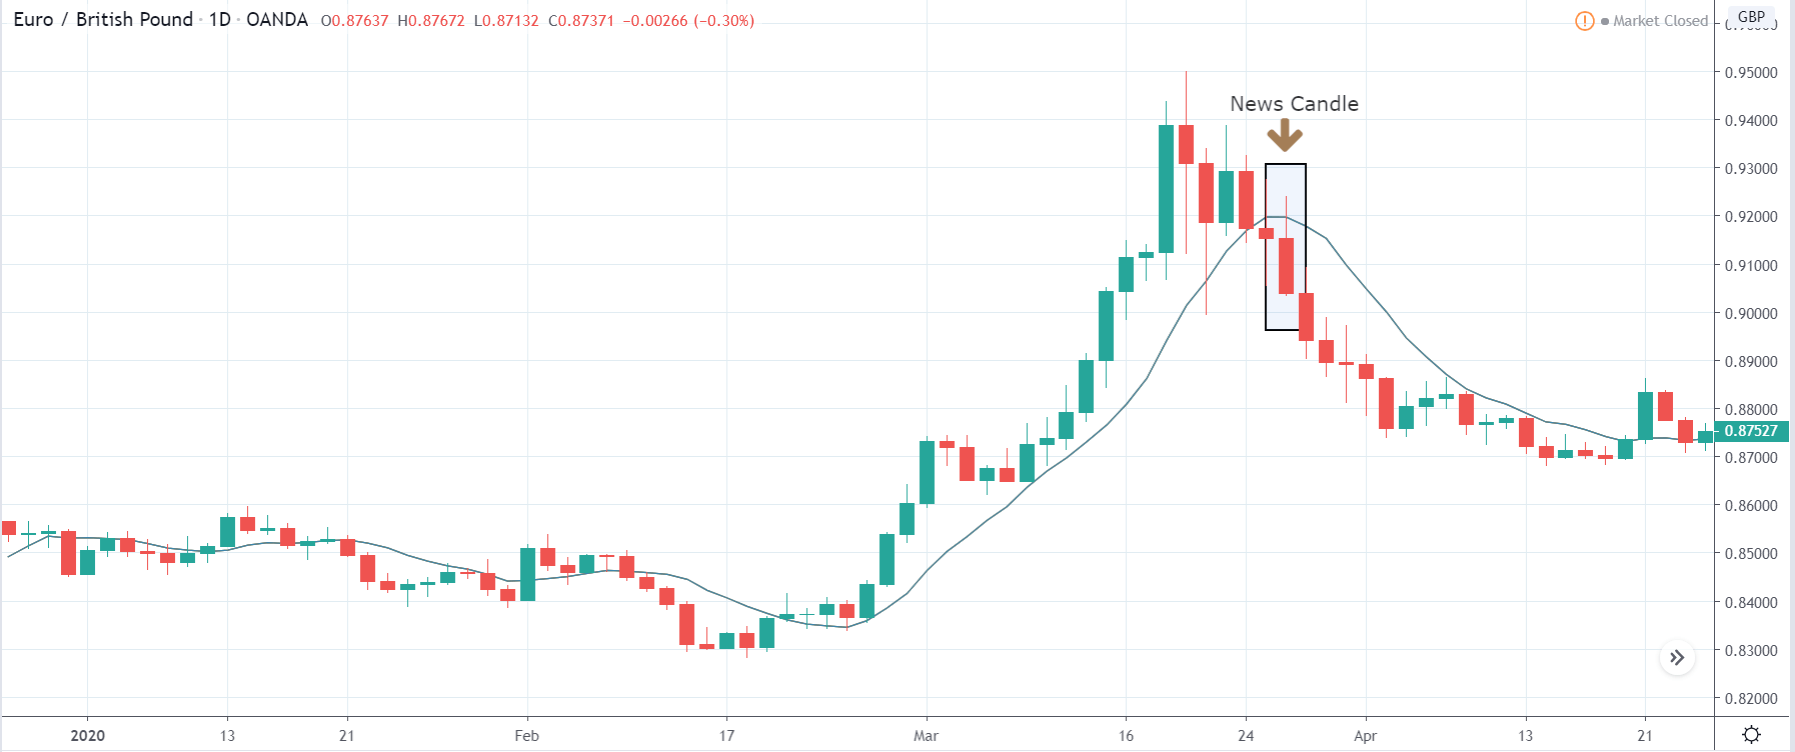
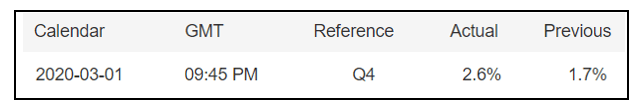
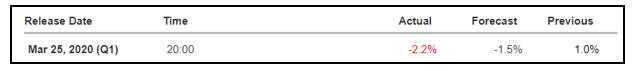
In today’s lesson, we will analyze the impact of GDP on different currency pairs and see the volatility created after the news release. The below image shows the first-quarter GDP data of Singapore, where we see a significant drop in the GDP value compared to the previous quarter. Let us find out the reaction of the market to this data. 

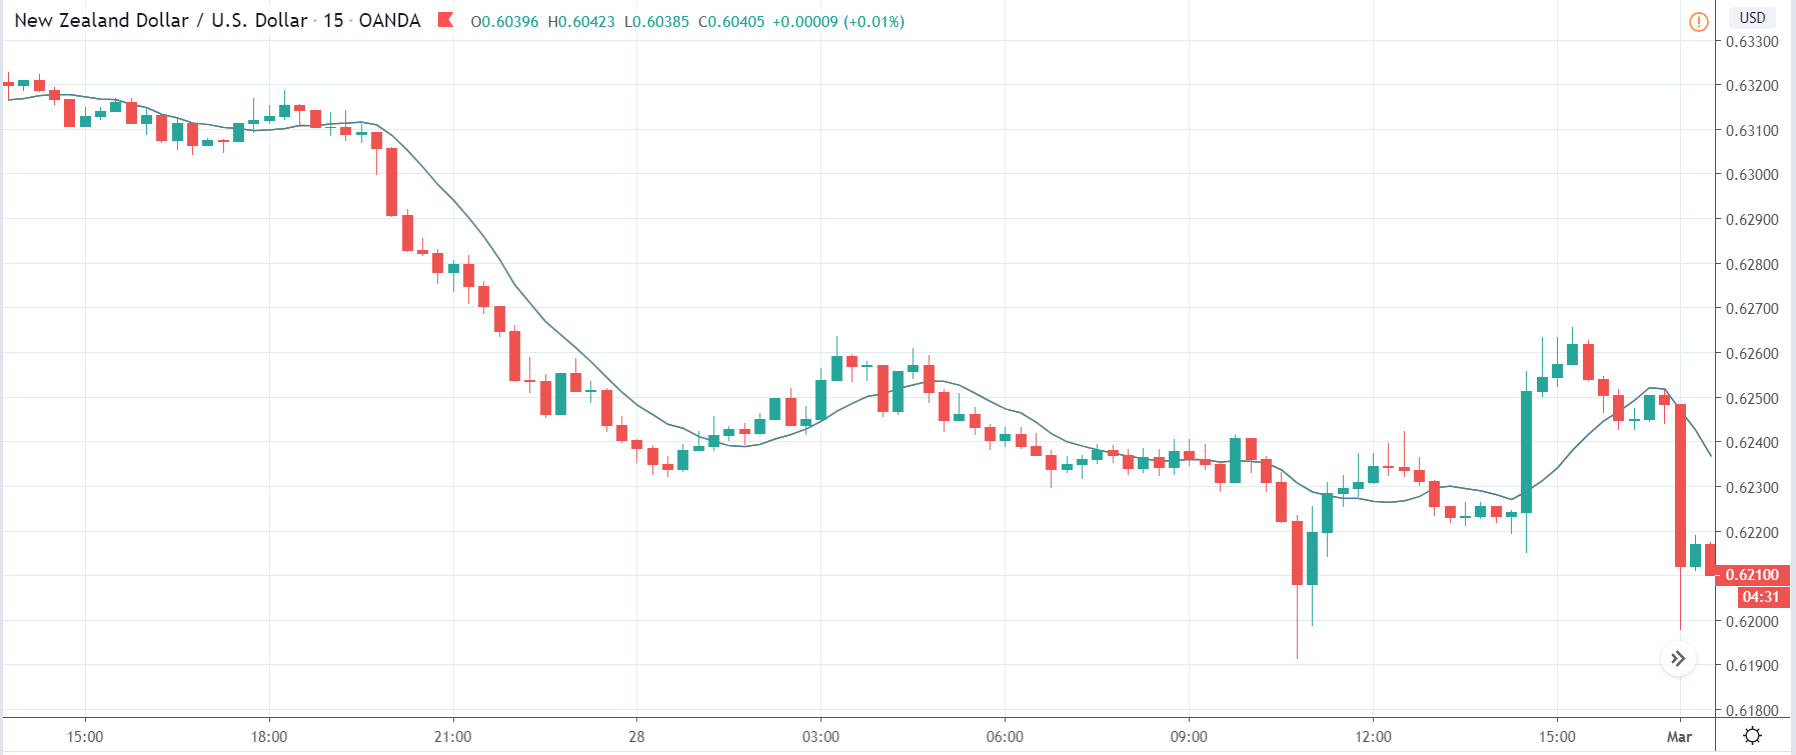
USD/SGD  | Before the announcement


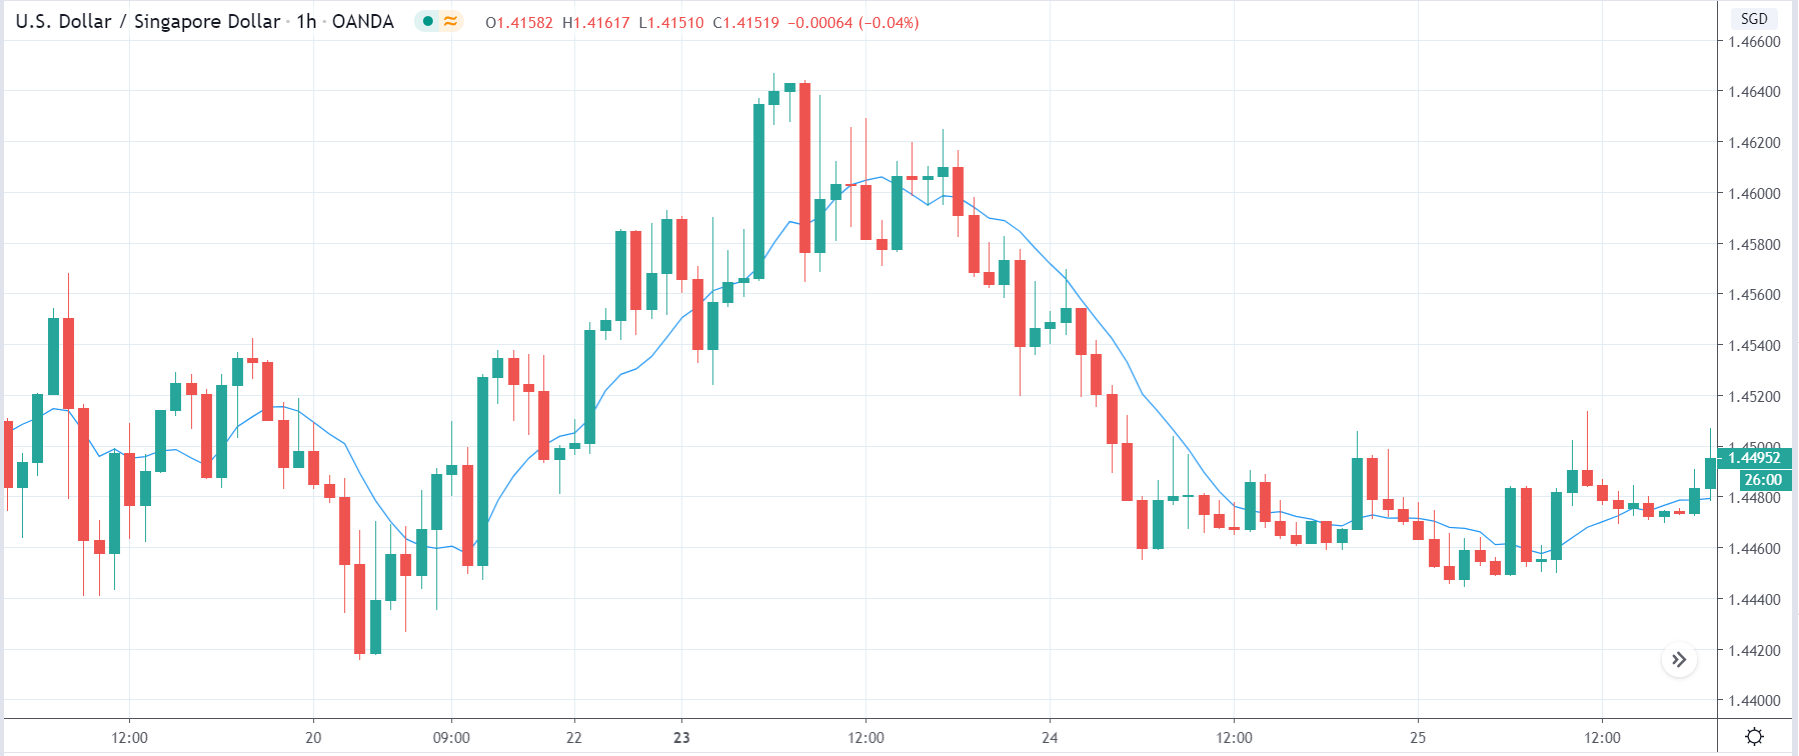
Let us start with the USD/SGD currency pair, where the above image shows the state of the chart before the news announcement. We see that the market is moving in a small ‘range,’ and just before the release, the price is at the top of the ‘range.’ This means we can expect selling pressure from this point that can take the price lower. However, it is better to take a position based on the volatility caused by the news announcement. 

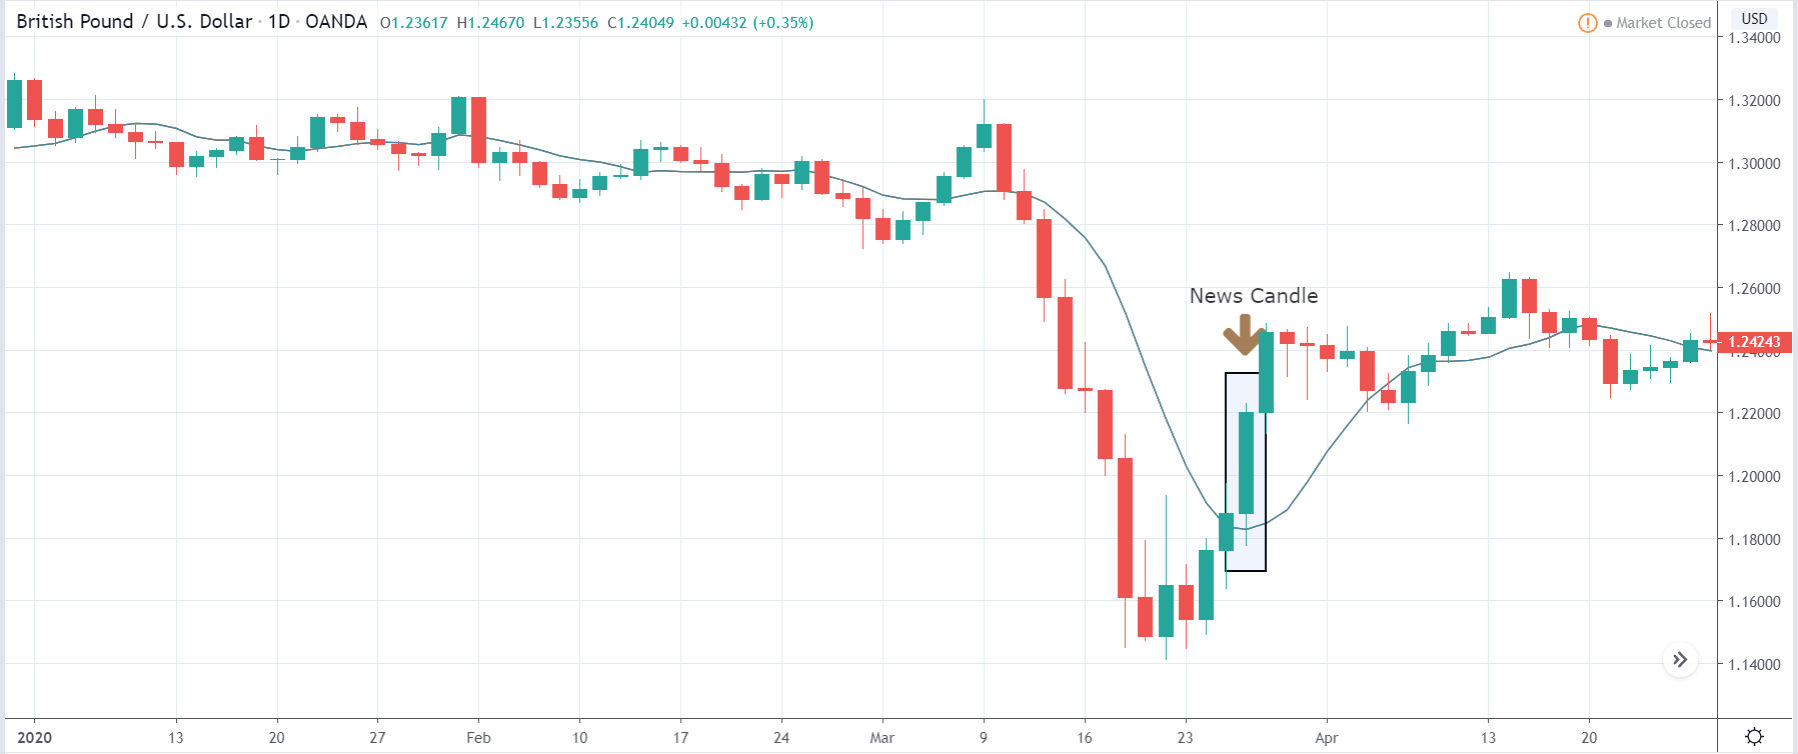
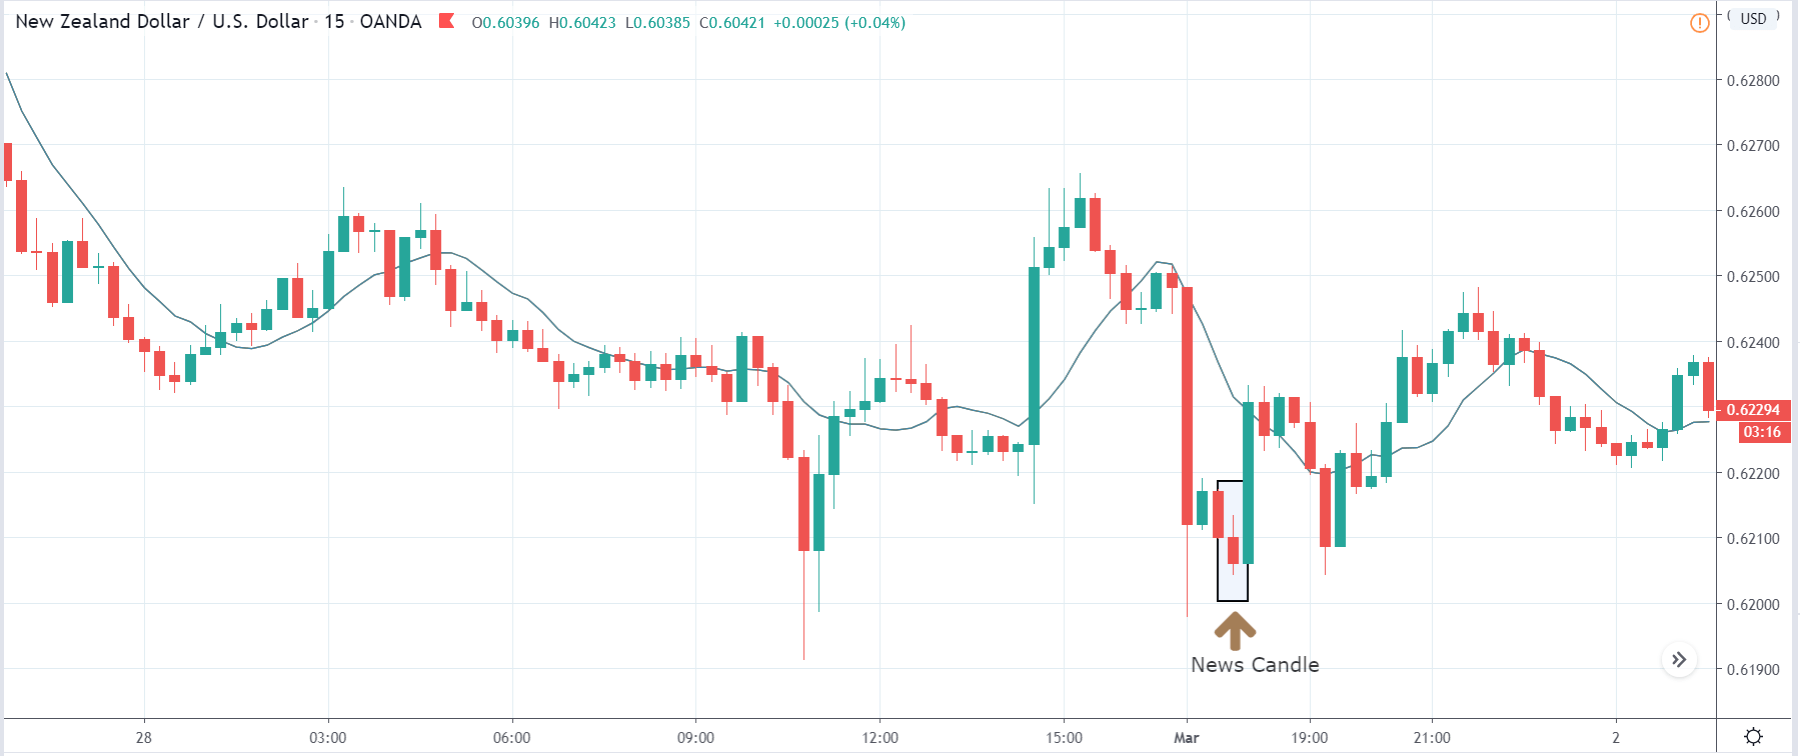
USD/SGD  | After the announcement:

After the news announcement, we see that the price moves lower, and the market falls considerably. The market reacted oppositely to what was expected as it resulted in the strengthening of the Singapore dollar even though the GDP data was negative. The volatility increased to the downside, and eventually, the market turns into a downtrend.    

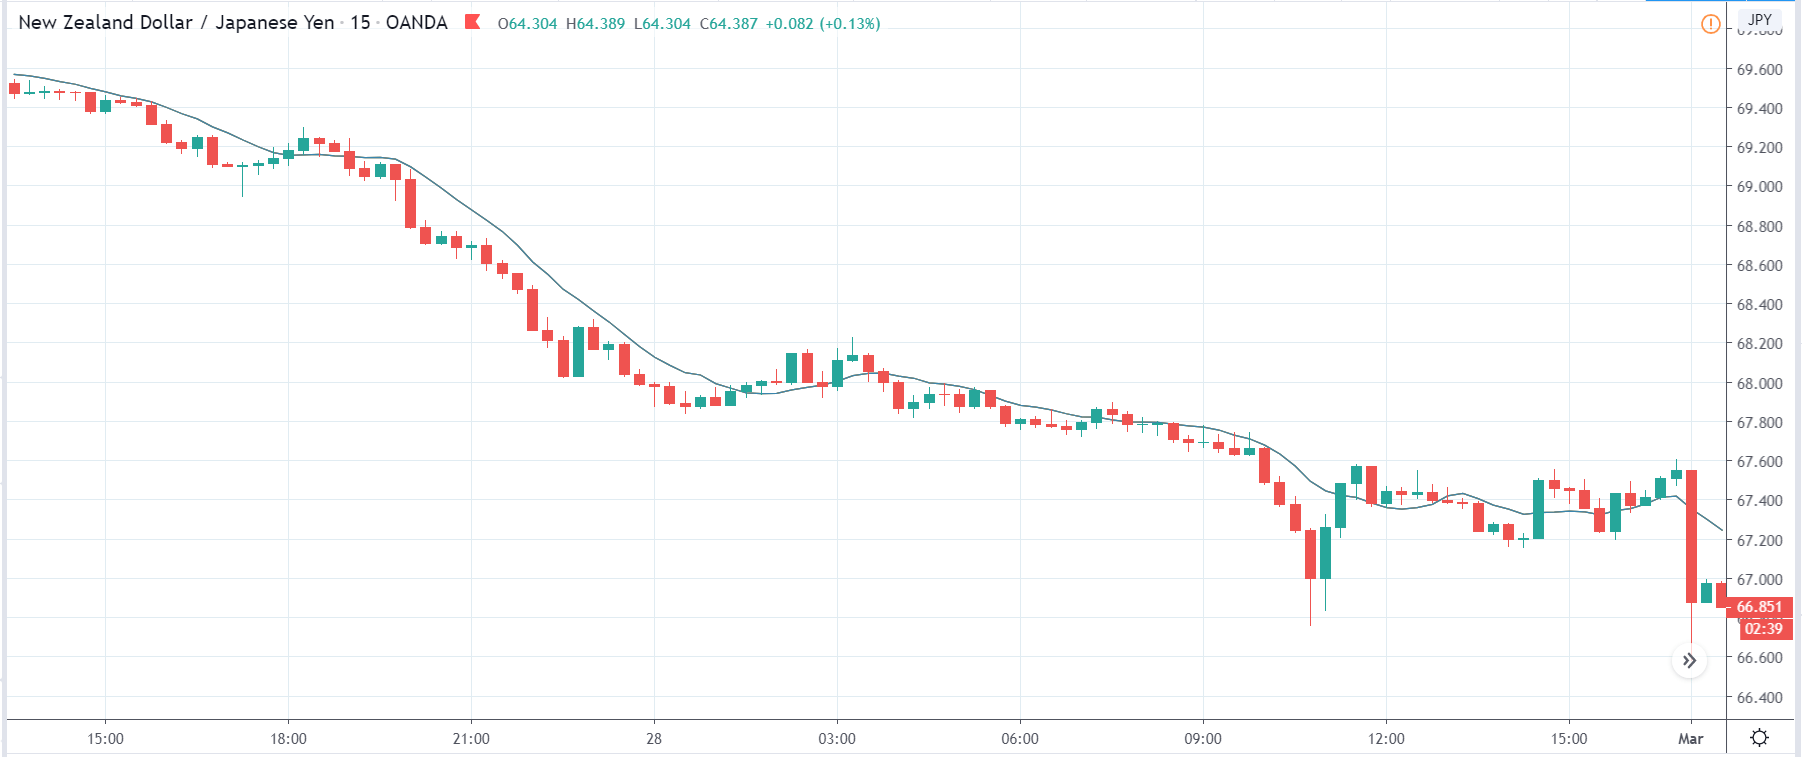
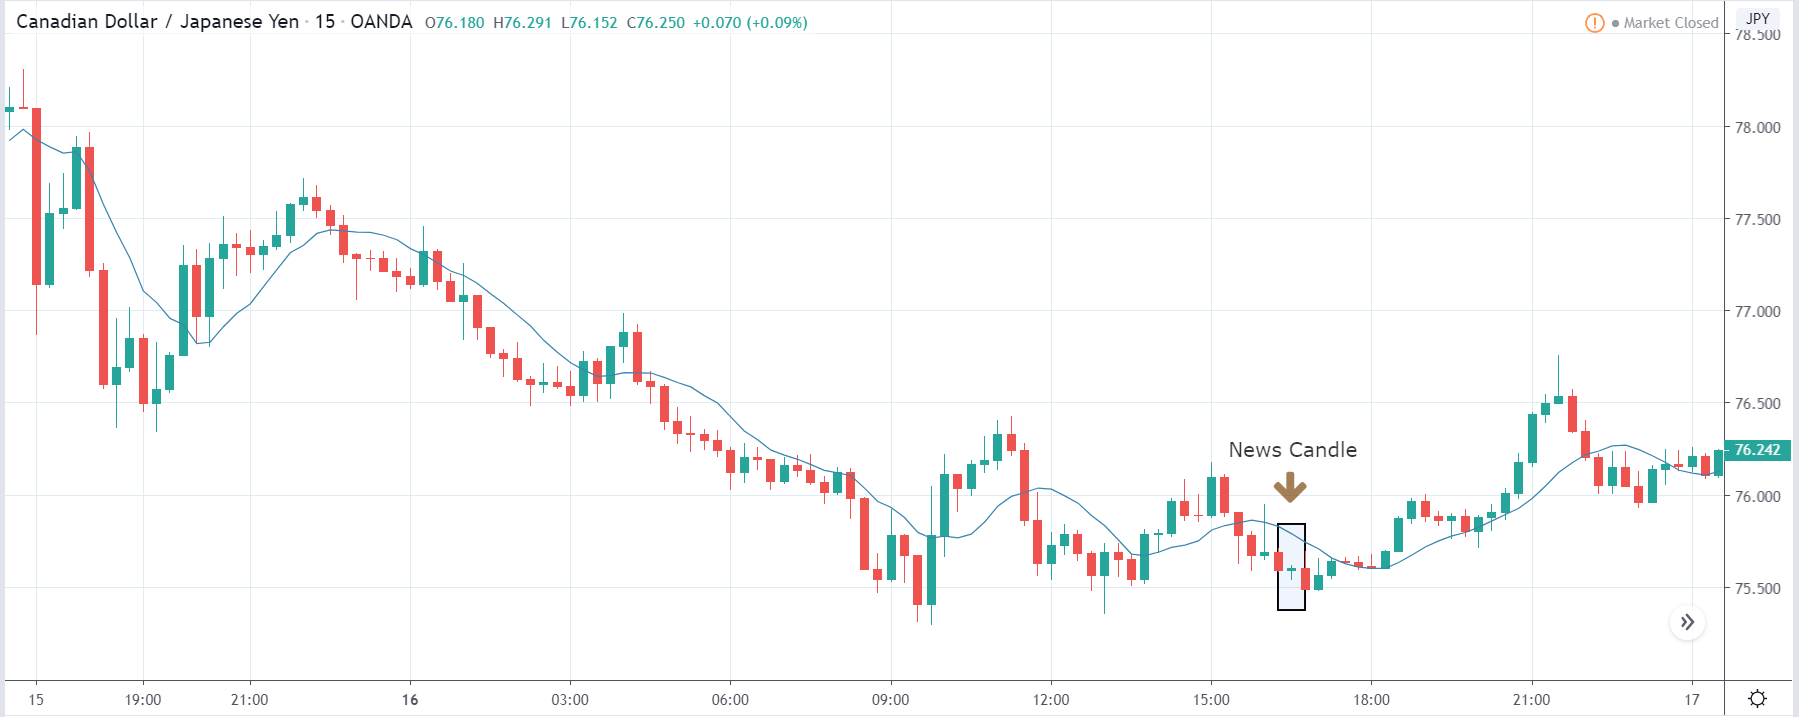
SGD/JPY | Before the announcement

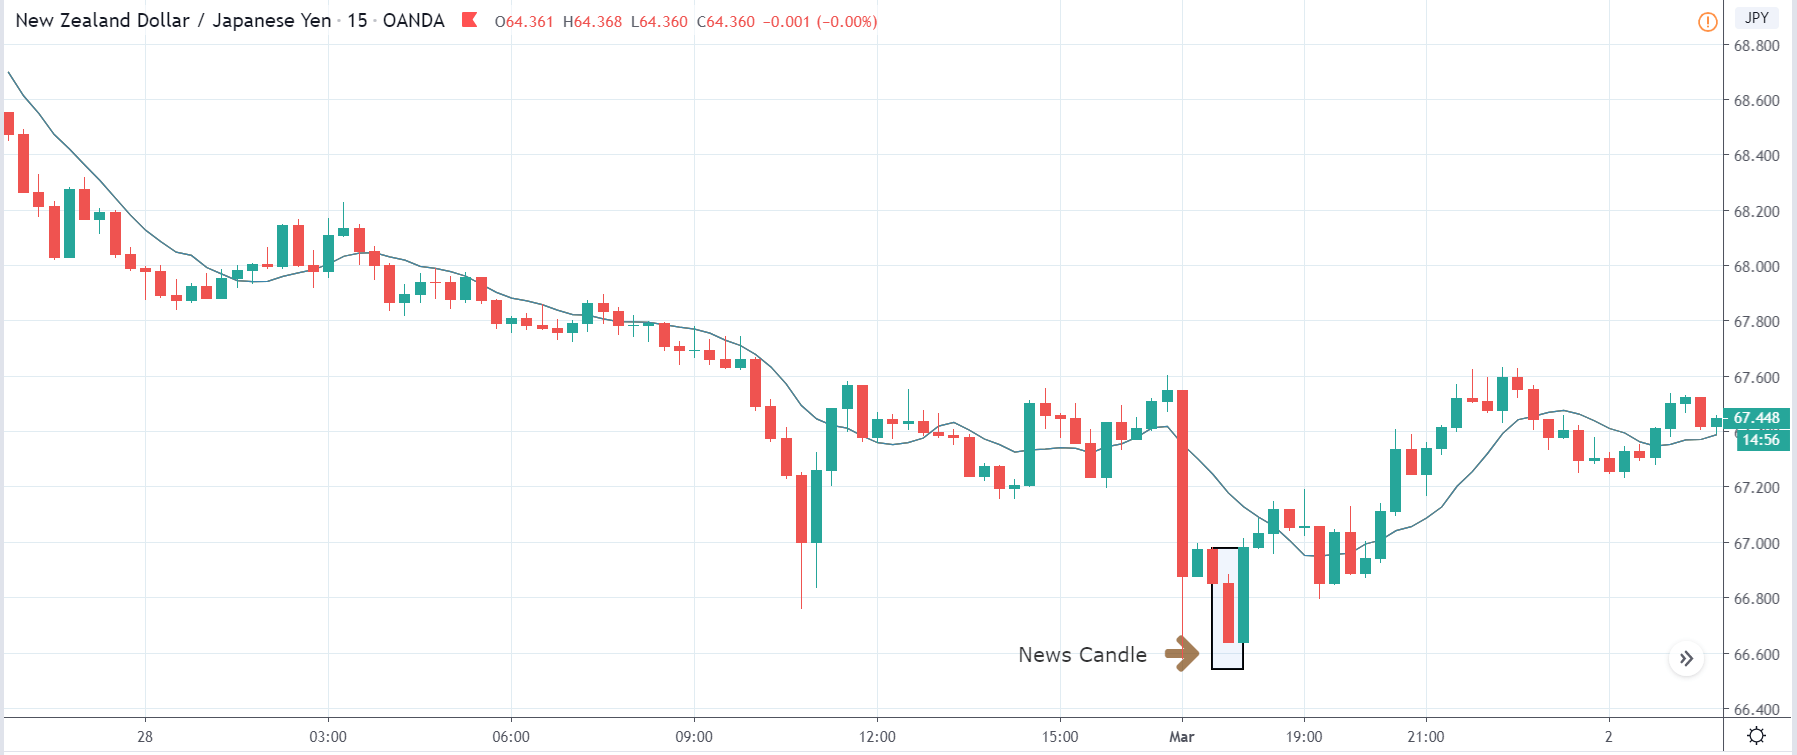
SGD/JPY | After the announcement:

The above images are that of the SGD/JPY currency pair, where we see that the price is precisely at the ‘support’ before the news announcement. There is a high chance that the buyers might come back in the market and go ‘long’ in the currency pair. Since economists forecast a lower GDP for this quarter, it is advised not to take a ‘short’ position before the news release.

After the news announcement, the price initially moves higher, but this gets immediately sold into, and the candle closes with a large wick on the top. We witness a fair amount of volatility in the currency, and finally, it gets extended to the downside. One can take a ‘short’ position in the currency after noticing trend continuation patterns in the market and after confirmation from technical indicators.     

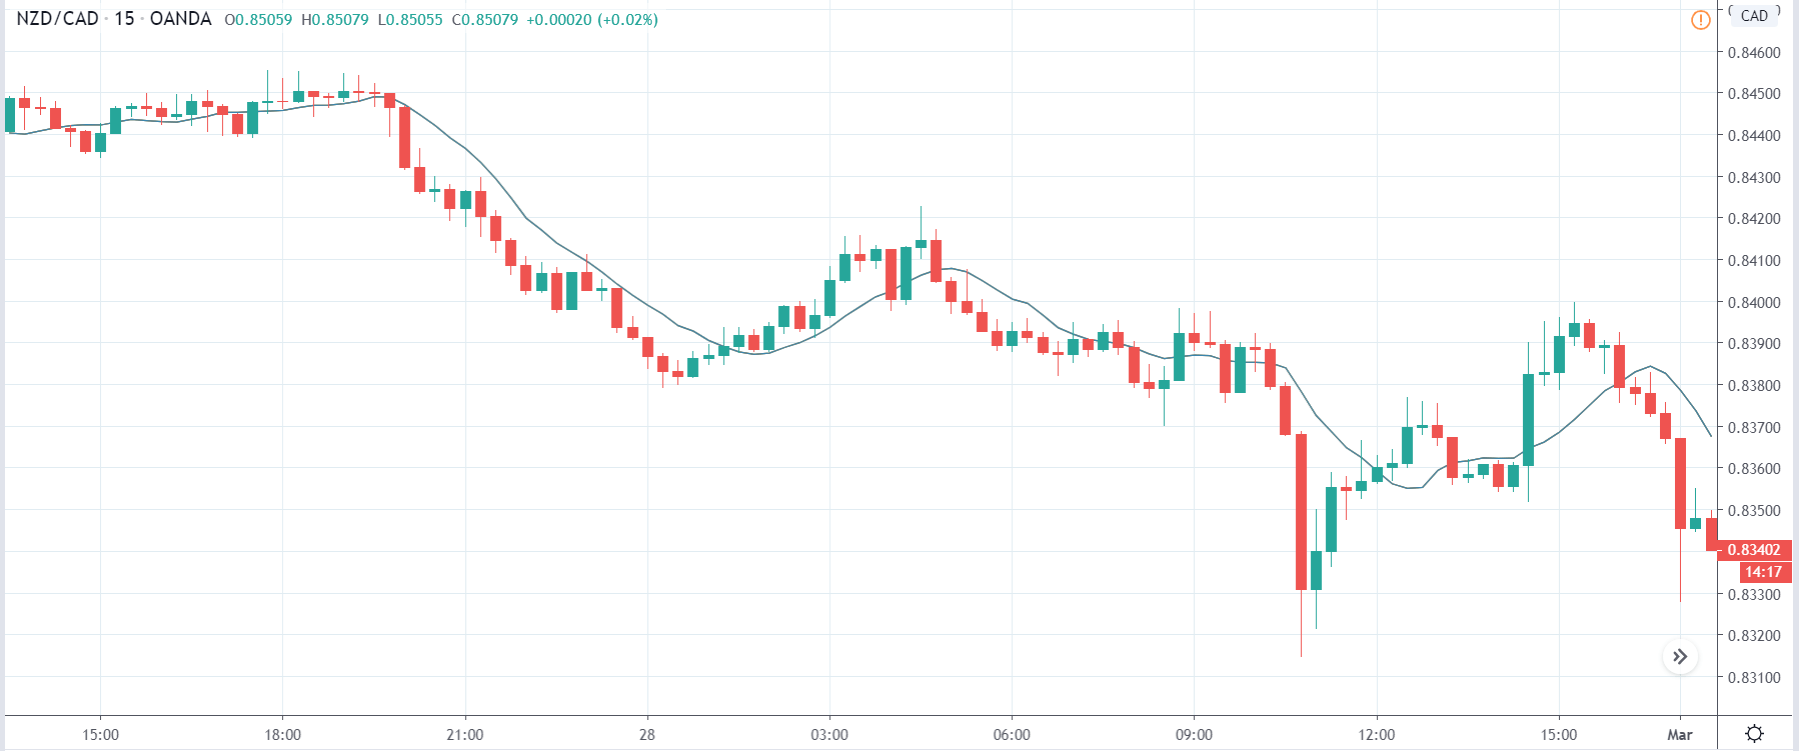
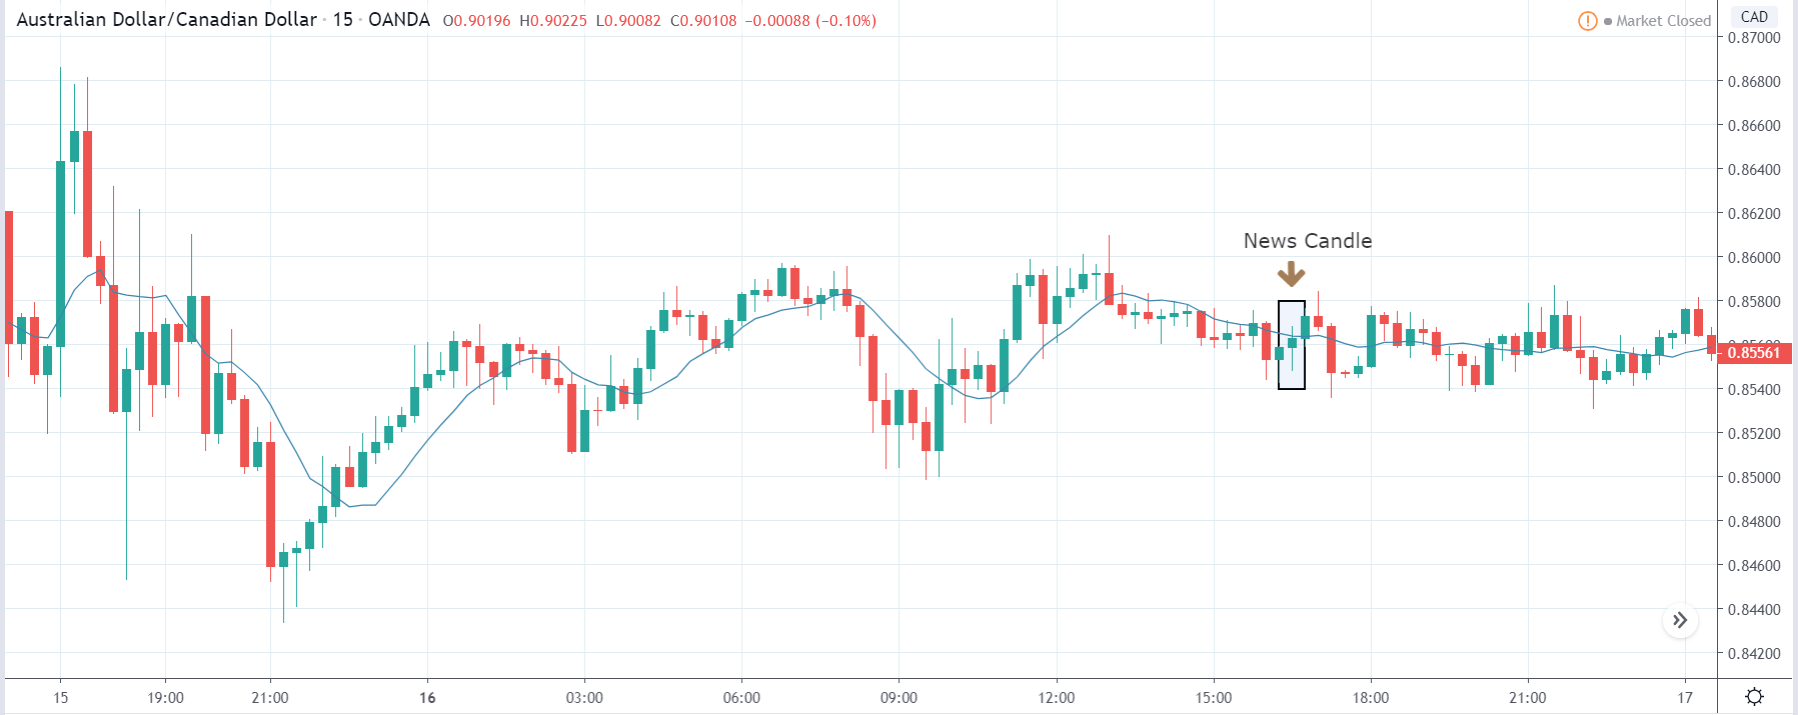
GBP/SGD | Before the announcement

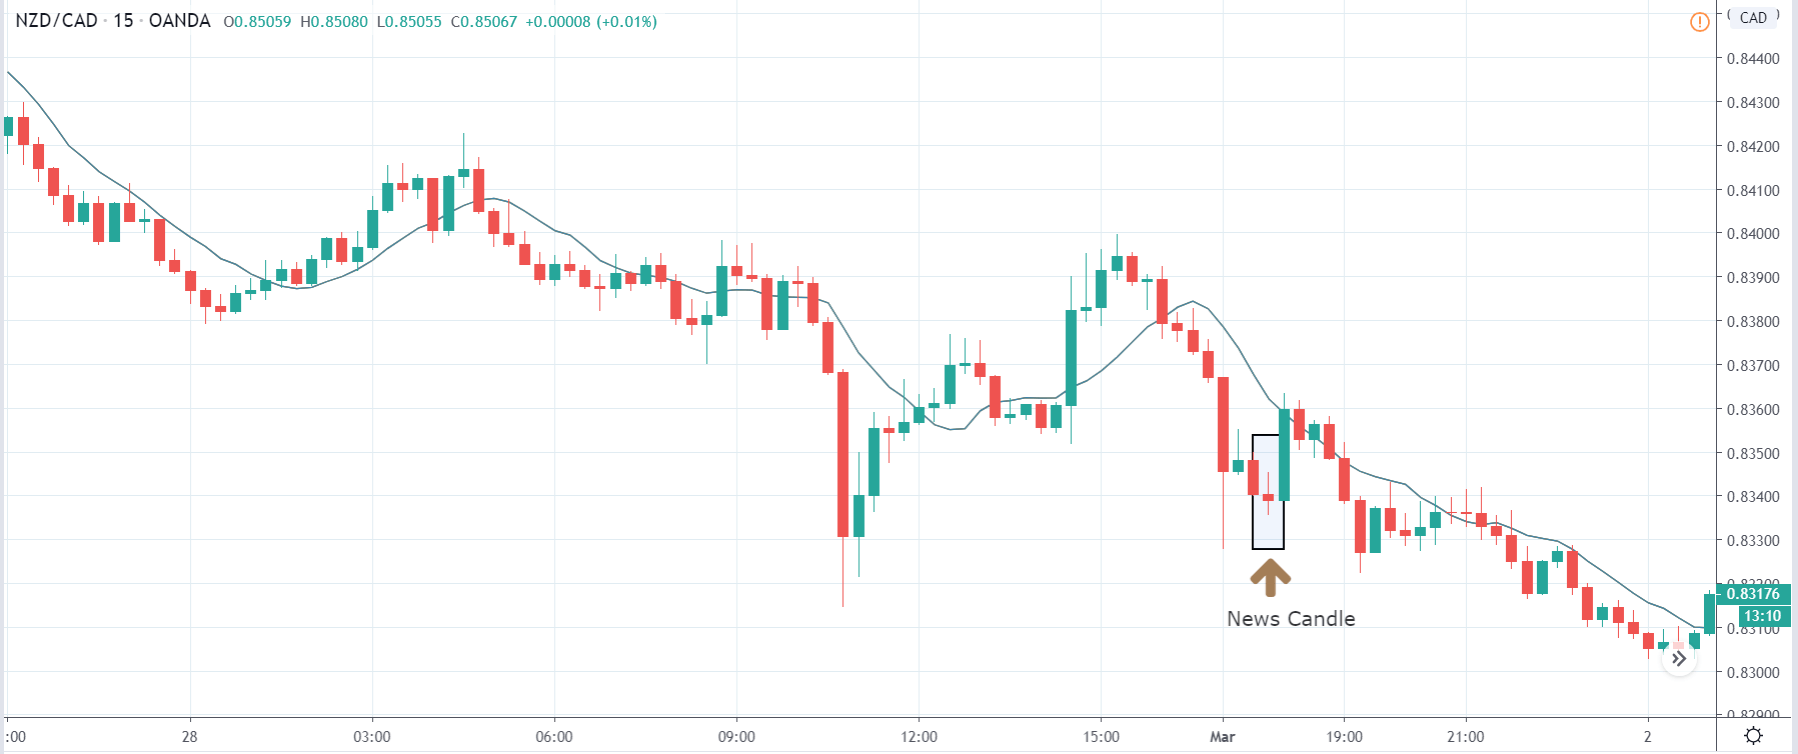
GBP/SGD | After the announcement:

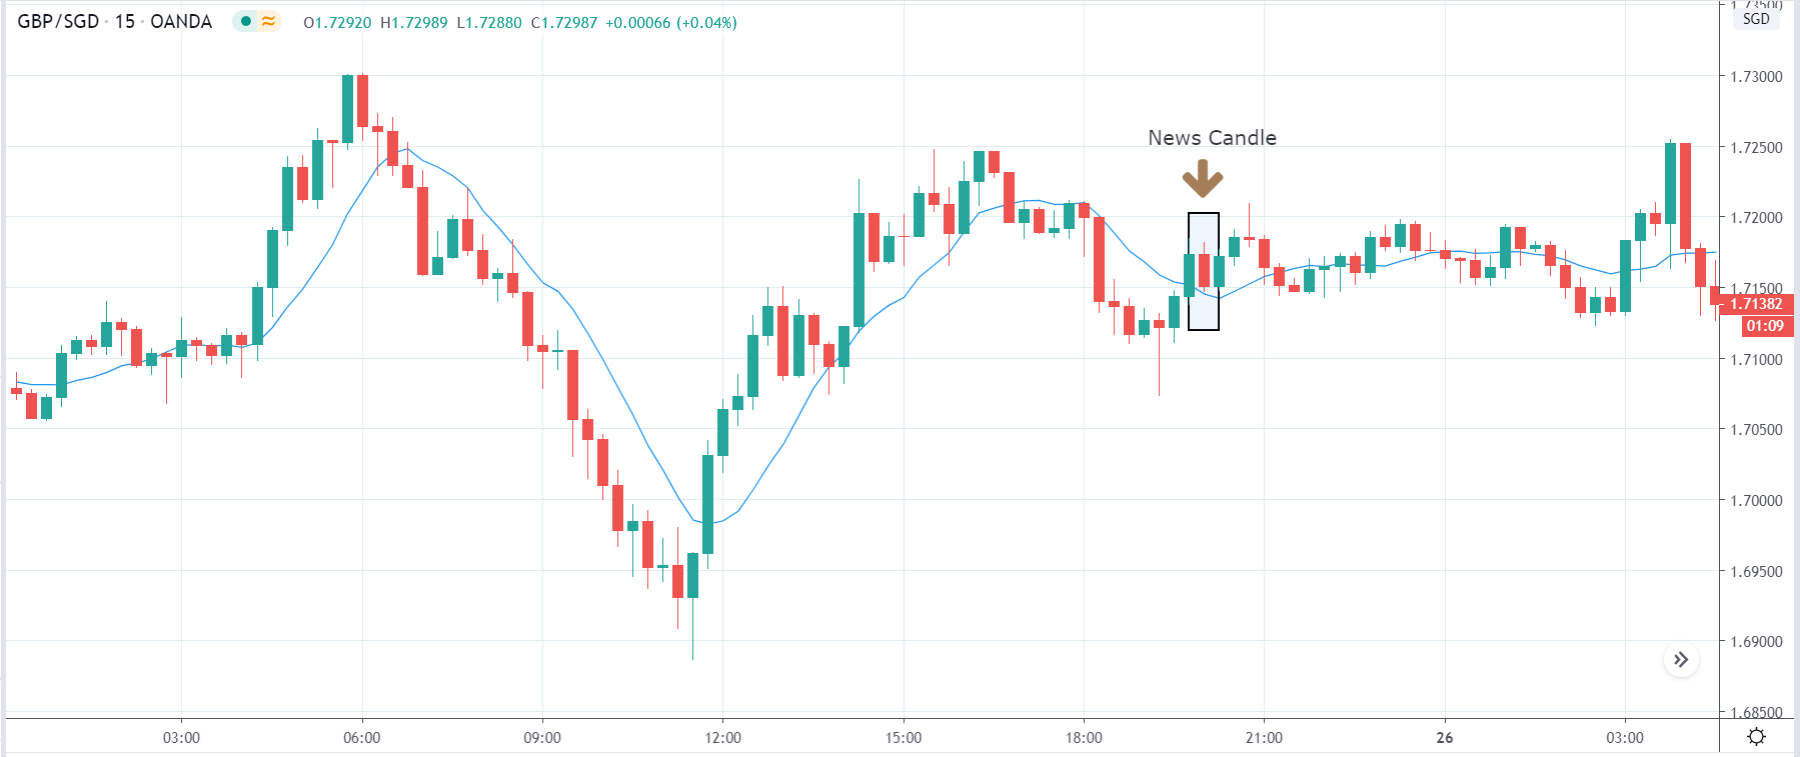
The above images represent the GBP/SGD currency pair, where we see that before the news announcement, the market has reversed to the upside, and currently, the price has reacted strongly from the ‘demand’ area. This indicates a high amount of bullishness in the currency pair and weakness in the Singapore dollar since it is on the left-hand side of the currency pair.

After the news announcement, the market falls lower, and the volatility slightly increases to the downside. The Singapore dollar gets more influential after the news release, despite reporting weak GDP data. Thus, we can conclude that there is some confusion in the market and hence it moves in both the directions. Traders should technically analyze and take positions accordingly. 

That’s about ‘GDP From Public Administration’ and its impact on the Forex market after its news release. In case of any questions, let us know in the comments below. Good luck!  

Categories
Forex Fundamental Analysis

Knowing The Significance Of ‘Gross National Product’ Macro Economic Indicator

Introduction

The two most important metrics of economic growth are the Gross Domestic Product (GDP) and Gross National Product (GNP). Up until 1991 the United States primarily measured its economic growth in terms of the Gross National Product and switched to Gross Domestic Product to make it easy for comparison with other countries, since many other countries were measured through the same.

But in practice, it is always necessary to assess a country’s growth in both the GDP and GNP terms to better understand the overall economic output. Hence, GNP also forms an excellent fundamental indicator of economic growth, almost as important as the GDP.

What is the Gross National Product?

Gross National Product, also called GNP, is the total monetary value of all goods and services produced by the country’s residents and businesses, irrespective of the production location. It means a business earning revenue in a foreign land is included in the domestic country’s GNP. 

Gross National Product defines the economic output based on citizenship, or that country’s native people. Hence, a citizen having an extra income source in any monetary form overseas is factored into the GNP. GNP is higher for countries that have many of their businesses established in a foreign land. Accordingly, any output generated by foreign residents within the country is excluded out from the GNP.

Gross Domestic Product (GDP) v/s Gross National Product (GNP)

It is essential to understand the difference between GDP and GNP during our analysis. GDP and GNP both measure economic output for a given period but differ in how they define the economy’s scope.

Gross Domestic Product is the total value of all goods and services produced by the nation. Here, GDP limits its assessment to the nation’s geographical borders and does not take into account the overseas economic activities of its nationals.

GNP does not restrict itself to the geography of the nation but limits itself in terms of citizenship. GDP does not reflect determinant in nationality. As long as the finished goods and services are within the country’s borders, it is included. On the other hand, GNP will not include any of the domestic borders’ revenue if it is from a foreigner.

The formula for GNP is given as:

GNP = Consumption + Investment + Government + Net Exports + Net Income

In the above equation,

  • Net Exports stands for the difference between the revenue generated from Exports and revenue going out for imports.
  • Net Income stands for the income of domestic residents from overseas or foreign investments minus net income of foreign residents from domestic investments.

The GNP is very indicative of the financial well-being of a country’s nationals and its country-based multinational corporations. From a relative perspective, it does not tell us much about the country’s health, as the GDP does. GNP is a more realistic measure of a country’s Income than its production.

To clarify the role of each metric better, consider the below examples:

Microsoft is the United States-based multinational company. It has a branch in India. The revenue generated from the Microsoft-India branch will be included in the GNP of the United States, but not in India’s GNP. On the other hand, Microsoft-India’s revenue is not included in the GDP of the United States but is included in India’s GDP.

How can the Gross National Product numbers be used for analysis?

It is essential to understand that GNP does not reflect the domestic (geographical basis) conditions well. If a natural disaster were to occur within the United States, then the GNP would not be as affected as the GDP, as the foreign revenue by its residents would not depend on the domestic situations. Hence, GDP is a more accurate measure of economic activity. On the other hand, its citizens’ financial well-being is more accurately measured through GNP than GDP.

GDP is a measure of economic health, while GNP is a measure of a nation’s Real Income. Both are different but related. A country like China, where many companies from other countries have their business has higher GDP than GNP, on the other hand, the United States, which has many of its firms’ production houses outside its land, has higher GNP than its GDP. Significant differences between the GDP and GNP values can be accounted to the openness of the countries to International Trade and Global Markets.

Impact on Currency

The Gross National Product is itself susceptible to the currency and exchange rate. When the currency falls, the Gross National Product increases due to the strengthening of other countries’ currencies where the domestic firms are doing business. The health of the economy is not gauged by the GNP accurately. Currency movements are not as driven by the GNP as they are by the GDP. Hence, it is more critical as a financial indicator than as an economic indicator in our analysis.

It is a lagging and proportional indicator, and hence the impact of the GNP is not as pronounced as the GDP, as all other countries use GDP as their primary measure of economic health. Investors, economists, policymakers, and traders all use GDP primarily over GNP to assess the economy’s current health and direction. Hence, it is a low impact indicator of our fundamental currency analysis.

Economic Reports

For the U.S., the Bureau of Economic Analysis releases quarterly reports of the Gross Domestic Product, which contains the GNP information. The St. Louis FRED consolidates the same data and maintains it on its website.

Sources of Gross National Product

The St. Louis FRED website holds the GNP data that is very easy to access and analyze, and the link is here.

GNP data for various countries can be obtained here

Impact of the “Gross National Product” news release on the Forex market

In the above section of the article, we defined the Gross National Product (GNP) and described the analysis method. We will extend our discussion and understand the impact of the Gross National Product news announcement on the value of a currency. The GNP gives an estimate of the total value of all the final products and services rolled out in a given period utilizing production owned by a country’s residents.

The GNP includes personal consumption expenditures, domestic investment, government expenditure, net exports, and Income from foreign investments. A small distinction between the GNP and GDP is that GDP measures the value of goods and services produced within the country’s borders. In contrast, GNP calculates the value of goods and services produced by the country’s citizens only both domestically and abroad. However, GNP is also one of the most commonly used indicators for measuring the country’s economy.    

In today’s example, we will analyze the impact of the United Kingdom’s GNP on the value of the Great British Pound. The below image shows the GNP in the U.K. during the fourth quarter, which was higher than the third quarter. Let us find out the impact.  

GBP/USD | Before the announcement:

We will begin our discussion with the GBP/USD currency pair to observe the change in volatility after the news announcement. The earlier image shows the state of the chart before the news announcement, where we understand the market is in a strong downtrend, and recently the price seems to be moving upwards. This could be a possible price retracement that could lead to the continuation of the trend and an opportunity. 

GBP/USD | After the announcement:

After the news announcement, the market gets very bullish, and we see a sharp rise in the price. The positive reaction from the market is a result of the upbeat GNP data, which was better than expectations. This brought cheer among the market participants who took the price higher by strengthening the British Pound. We should not take any ‘short’ position until we notice trend continuation patterns in the market.

GBP/CAD| Before the announcement:

GBP/CAD| After the announcement:

The above images represent the GBP/CAD currency pair, where in the first image, we see that the market appears to be moving within a ‘range’ with the price currently at the bottom of the ‘range.’ Before the news announcement, the currency pair is very volatile, suggesting that there is a lot of trading action in this pair. In such high volatile environment, we recommend waiting for the news release and then taking a suitable position in the pair.

After the news announcement, the price suddenly moves higher and volatility expands on the upside. The bullishness in the British Pound is a consequence of the optimistic GNP data, which showed a growth in the economy during the fourth quarter. Since the price is at the bottom of the ‘range,’ one can take ‘long’ in this currency pair with a target until the ‘resistance.’

EUR/GBP | Before the announcement:

EUR/GBP | After the announcement:

The above images are that of the EUR/GBP currency pair, where we see that the market is in a strong uptrend before the news announcement, signifying the enormous amount of strength in the British Pound, since the currency is on the left-hand side of the pair. Depending on the outcome of the news and change in volatility, we will analyze the currency pair accordingly.

After the news announcement, market crashes, so much that the price goes below the moving average. The ‘news candle’ closes, forming a reversal candlestick pattern that could lead to the beginning of a downtrend. The volatility increases to the downside as the GNP data was reasonably good.

We hope you understood what ‘Gross National Product’ is and its impact on the Forex price charts. Cheers!

Categories
Forex Daily Topic Forex Fundamental Analysis

Understanding The Importance Of ‘Terms Of Trade’ As A Macro Economic Indicator

Introduction

Terms of Trade is a direct and useful measure of an economy’s International Trade health and gives us a good measure of how fast capital is moving in or out of the country. Terms of Trade make analyzing Balance Of Payments and, more specifically, Current Account Balance easier. Understanding of Terms of Trade can help us better analyze the current liquidity of the economy and its changes in a more crude way.

What are Terms Of Trade Indices?

Terms of Trade is the ratio of its Export Prices and Import Prices. It is the ratio of money received on exports to money spent on imports. If there is an individual’s analogy to be made, then it would be the ratio of an individual’s monthly income to his monthly expenses. Mathematically, it would be the number of export goods that can be purchased per unit of import.

Terms of Trade ratio expressed in percentages, and hence the ratio is multiplied by a hundred. A TOT figure above100 indicates that the country is receiving more on its exports than on its income and vice-versa.

When a country has a TOT figure of more than 100, it means that it is receiving more capital on exports compared to sending capital out on imports. Hence, on an overall basis, capital is flowing into the country. Higher the ratio, the faster the rate at which capital flows into the country. It ultimately translates to the pace at which a country is becoming wealthy and liquid.

When a country has a TOT figure less than 100, it means capital is flowing out of the economy, and its import expenses exceed that of its export revenue generated. Continued periods of TOT figures less than 100 will drive the economy to a vicious debt cycle from which recovery may be difficult. The ratio will tell us how fast the capital is depleting from the economy and is nearing a financial crisis. Countries prefer to have a ratio above 100.

The ratio tells us the rate at which the economy is accumulating capital. On the global market place and International Trade, the ratio will determine what portion of the world’s wealth goes to each country. In other words, based on the demand and supply on the international markets, the ratio will tell us how profits from international trade will be distributed amongst the participating countries.

How can the Terms Of Trade numbers be used for analysis?

Since TOT is a ratio change in TOT, figures can imply multiple things. An improvement in TOT figure could mean:

  1. Export prices have increased in contrast to Import prices being stagnant or dropped.
  2. Export prices would have dropped but not as sharply as import prices. Both dropped but not to the same degree.
  3. Export prices would have stayed the same while Import prices would have dropped.

All the above scenarios can lead to an improvement in the TOT figure. Hence, simple changes in TOT figures cannot be directly used to draw economic conclusions. It is crucial to understand the factors that have resulted in a change in TOT numbers. It is crucial to know whether the change is a consequence of a short-term shock or development or a consistent long-term trend that will persist throughout the coming periods.

TOT is susceptible to multiple economic factors, some of which are:

Exchange rate: A decrease in exchange rate adversely affects imports and benefits exports and vice versa. Imports become costly, and exports become cheap, adversely affecting TOT.

Inflation: The inflation rate across different economies and different sectors affect different economies having different export and import portfolios. For example, a sharp increase in Iron Ore prices can greatly benefit Australia, whose chief exports are Iron Ore, while it can affect importing countries like China and Japan adversely. So inflation across sectors have different impacts across economies and within the country amongst different sectors.

Demand and Supply: Increase in demand, coupled with the availability of those resources also affects TOT as exports and imports are a function of demand and supply. Scarcity increases prices and oversupply decreases the same.

Quality of Produce: Size and quality affect the pricing of products. A high-quality product is likely to cost more and benefit the exporter more. Hence, the portfolio of the country’s exports and imports determines the TOT fluctuations of different product grades.

Trade Tariffs: Protectionist strategies from Governments lead to putting trade barriers on imports. The political and trade ties between countries can also affect the long term trend of TOT figures for a given economy.

Portfolio of Exports and Imports: What types of Goods and Services a country exports and imports also matter. Countries that export goods and services that are more of primary importance (ex: food and energy) tend to always have high demand and TOT ratio more than 100 both within the economy and on the global economy.

Impact on Currency

When the TOT figure is above a hundred, it implies domestic currency is flowing into the country and creating a deficiency in the global market. Hence, higher TOT figures will increase its currency demand and thereby leading to currency appreciation. On the other hand, a continued TOT less than 100 indicates the world is being supplied with domestic currency and therefore leads to currency depreciation.

It is a coincident indicator and is more useful as a long-term trend indicator rather than short-term changes. The indicators affecting TOT would have been identified through Trade agreements or other media sources in general and hence, is a mild-impact indicator.

Economic Reports 

The Bureau of Economic Analysis publishes its TOT figures in the National Income and Product Accounts every quarter of the year on its official website. Below is a figure for an illustration of the same:

We can also find the aggregated TOT reports for the OECD countries on the official website. The World Bank also aggregates and maintains TOT data for most countries on its official website.

Sources of Terms Of Trade

For the US, we can find the Terms of Trade in their National Income and Product Accounts here:

BEA – National Income and Product Accounts

OECD – Terms Of Trade

World Bank – TOT

We can also find Terms of Trade Index for many countries categorized here.

Impact of the ‘Capacity Utilization’ news release on the price charts

In the previous section of the article, we learned the Terms of Trade economic indicator and understood its significance in an economy. The ToT Index measures the ratio of an export to the price of an import, per commodity. A country that heavily relies heavily on exports, this number gives an important hint of the nation’s growth. Even though the Terms of Trade is useful in determining the balance of trade in a country, it does not have a major influence on the GDP of the economy. Therefore, investors don’t give much importance to the data during the fundamental analysis of a currency.

Today, we will be analyzing the impact on Terms of Trade on different pairs and witness the change in volatility due to the news release. The below image shows the latest Terms of Trade data of New Zealand that indicates an increase in the value compared to the previous quarter. A higher than expected reading is considered to be positive for the currency while a lower than expected reading is considered as negative. Let’s see how the market reacted to this data.

NZD/USD | Before the announcement:

We shall start with the NZD/USD currency pair to examine the impact of Terms of Trade on the New Zealand dollar. In the above price chart, we see that the market is in a strong downtrend before the news announcement with increased volatility. Currently, the price is at a key technical area, which is known as the ‘demand’ area, and hence we can expect buyers to come in the market at any moment. Thus, once needs to be cautious before taking a ‘short’ trade.

NZD/USD | After the announcement:

After the news announcement, the market moves lower and volatility increases to the downside. The Terms of Trade data showed an increase in the total percentage, but this was not good enough for the market players who apparently took the price down and weakened the New Zealand dollar. Although the ‘News Candle’ closes in red at the time of release, it gets immediately taken over by a bullish candle, as this was a ‘demand’ area.

NZD/JPY | Before the announcement:

NZD/JPY | After the announcement:

The above images represent the NZD/JPY currency pair, where we see that the characteristics of the chart are similar to that of the above-discussed pair. Before the news announcement, here too, the market is in a strong downtrend, and the volatility appears to be high on the downside. One thing that is different in this pair is that the price is presently at its lowest point and seems to have made a ‘lower low.’ This means New Zealand is weaker in this pair.

After the news announcement, market crashes and the price drops sharply. The Terms of Trade has a similar impact on the pair, where we see a further increase in volatility to the downside. Again. the weakness does not sustain, and the price shows a large bullish candle after the ‘news candle.’

NZD/CAD  | Before the announcement:


NZD/CAD  | After the announcement:

Lastly, we shall discuss the impact on the NZD/CAD currency pair and observe the change in volatility. Here, we see that the market is continuously moving lower before the news announcement indicating a great amount of weakness in the New Zealand dollar. Just before the news release, the price seems to be approaching the ‘demand’ area, which can possibly change the trend for a while by initiating some bullishness in the pair.

The Terms of Trade news announcement gets lukewarm from the reaction where the price initially moves higher little and finally closes forming a ‘Doji’ candlestick pattern. The news release leads to further weakening of the currency where the volatility expands on the downside.

That’s about ‘Terms Of Trade’ and its impact on the Forex market after its news release. If you have any questions, please let us know in the comments below. Good luck!

Categories
Forex Fundamental Analysis

The Importance of the ‘Car Registrations’ Data While Gauging The Economy’s Health

Introduction

Since the advent of mass production of Cars, by Henry Ford in 1913, the automobile industry has been booming. The consequent effects on the dependent industries are as significant as the study of Automobile Industries itself. Car Registration statistics are useful for policymakers, and many dependent industries of automobiles.

What is Car Registrations?

Vehicle Registration is the process of registering a newly purchased or resold vehicle with a government authority. The primary purpose is to link every car with a corresponding owner. It helps in identifying owners of lost vehicles and reckless driving caught on traffic cameras, etc.

How can the Car Registration numbers be used for analysis?

Car Registrations in our analysis is useful to the following sectors of people:

Policy Makers – Car Registration statistics are useful for policymakers to predict traffic volume, forecasting congestions in narrow road areas, and planning new highway construction projects to facilitate smoother transportation.

Oil Vendors – It is useful for the Oil vendors, who can use this data to forecast an increase or decrease in fuel demand and adjust their inventory or stock in advance to meet the demand.

Road Construction companies – Companies can track regional increases in car sales and identify traffic patterns, to put forward a proposal for road construction to government officials to get a construction contract.

Modification Jobs – Many companies in the modern world offer customization options. By monitoring what type of cars are more frequent and in which locations, can help such small scale businesses to set up their business, and offer suitable services.

Sales analysis by Car Manufacturers and Investors – Car Registration figures are the number of cars purchased by customers and are on-road as we speak. The Car Production figures show the picture from the manufacturer’s perspective, while Car Registrations show the actual demand from the customer’s viewpoint. It is the actual sale that counts, and Car manufacturing companies can analyze what type of cars are trending the market right now, which can help them build similar models of cars. Investors can analyze this data to know which company sales are growing in which sector, and where potential growth lies in different regions.

Environmental Analysts: Cars are one of the primary sources of Air pollution, by analyzing the trend in Car Registrations, environmental analysts can assess whether people are shifting to more eco-friendly options like electric cars. Thereby research the implications for submission of their reports on environmental impacts.

Of these factors, road construction, sales analysis is essential, and that is what most of the time data is mainly used for.

In the aspect of economic growth, Car Production and Car Registration statistics point in the same direction, where  Car Registration is more accurate, as production does not equal equivalent purchase.

As more Cars are registered, it indicates more consumers can afford it. It indicates consumers have enough disposable income and are financially stable enough to either procure a loan or direct purchase. It also indicates, banks also have enough liquidity to disburse loans for such purposes.

Historically, during times of recession, there is a corresponding decrease of Car Registrations, as evident from the above graph, as Consumer Sentiment is low, and prefer to save more than spend to save for a future rainy day. Overall, Car is not a cheap commodity, and an increase in its registration indicates, increased Consumer Confidence, and tells us the economy is stable and faring well.

With more emerging economies like India, Japan, etc. improving their economic conditions by export-led growth in the global markets, the total number of people who are above the poverty level is increasing. This would ultimately translate into increasing Car Registration figures in the upcoming times. The below plot justifies this:

As the standard of living improves in the emerging economies, we are bound to see an increase in demand for automotive, in those countries. As people become wealthier and have extra income after accounting for the daily needs, people open up to the more non-essential or luxury goods, and first in that list comes a car and a home in most developing economies. Hence, increased car registration figures are a sign of an increase in the standard of living of that economy.

Impact on Currency

Car Registrations are a lagging indicator of economic health, as purchase happens only when the economic conditions have improved significantly and have continued to stay good for a while. In this sense, it is a lagging indicator, compared to other leading and coincident indicators like Disposable Income, Interest Rates, Personal Consumption Expenditure, etc. for traders.

Hence, it is a low impact indicator, as the change in numbers is backward-looking and not forward-looking. It is more useful for policymakers and investors interested in Automotive industries looking for investment ideas and opportunities.

It is a proportional indicator, and a decrease in registrations of new vehicles is just signaling weakening economy and corresponding currency devaluation, which has already been confirmed by other indicators. It will be just confirming our predictions from leading indicators.

Economic Reports

The Federal Highway Administration keeps track of the total vehicle registrations by type and builds on its official website.

The Organization for Economic Co-operation and Development maintains the data for all its member countries, which is available on the St. Louis Fred website that is easier to access.

Sources of Car Registrations

Federal Highway Administration State Vehicle Registrations – 2018

Annual Motor Vehicle Registration – Total – CEIC Data

The St. Louis FRED data also maintains data extracted from the OECD database about the vehicle registrations here and here. We can find the monthly data for the Car Registrations data in the statistical form here and here.

Impact of the ‘Car Registrations’ news release on the price charts

After getting a clear understanding of the Car Registration fundamental indicator, we will now try to comprehend the impact of the indicator on different currency pairs and observe the change in volatility due to the news announcement. The Car Registrations figure gives an estimate of the total number of purchased Cars and which is billed to the customer during that month. The indicator helps us to understand the growth in the purchasing power of people in a country. Even though the purchasing power is measured by many other parameters, Car Registration is one of the major factors. Thus, traders do not give much importance to this data while analyzing a currency.

In the following section of the article, we will analyze the impact of the Car Registration economic indicator on various currency pairs and try to interpret the data. The below image shows the Car Registrations data of Canada, where the data says there were 113K registrations in January. There is a decrease in the number of registrations as compared to the previous month. Let us find out the reaction of the market.

USD/CAD | Before the announcement:

We shall begin with the USD/CAD currency pair for analyzing the impact. The above image shows the position of the chart before the news announcement. We see that the currency pair is an uptrend making higher highs and higher lows and apparently has broken out above the ‘supply’ area. This means the uptrend is getting stronger, and the news will determine if it will continue further or not.

USD/CAD | After the announcement:

After the news announcement, the price moves in both directions but very little. The currency pair exhibits the least amount of volatility due to the news release, and the candle closes, forming a ‘Doji’ candlestick pattern. The lukewarm reaction of the market indicates that the data was not very disappointing, and thus traders do not make changes to their positions in the currency pair.

CAD/JPY | Before the announcement:

CAD/JPY | After the announcement:

The above images represent the CAD/JPY currency pair where before the announcement, we see that the pair is in a strong downtrend, and as the Canadian dollar is on the left-hand side, it shows extreme weakness in the base currency. Recently, the price seems to be moving in a range, and just before the news release, the price was at the bottom of the range. Thus, buying force can be seen at any time in the market from this point.

After the news announcement, the market falls slightly but gets immediately bought back. Due to a lower Car Registrations, market players initially sold the currency but later took the price higher as the data was not very bad. Technically, this is a ‘support’ area, and thus traders went ‘long’ in the market, which resulted in the price rally. Therefore, the impact due to the news announcement was least in the currency pair.

AUD/CAD | Before the announcement: 


AUD/CAD | After the announcement:

Lastly, we discuss the AUD/CAD currency pair where, before the announcement, the market is range-bound, and there isn’t any clear direction of the price. The currency pair is seen to exhibit minimum volatility before the news release. It is necessary to have market activity in order to analyze a currency pair rightly. Trading in such currency pairs attract extra slippage and spread.

Therefore, it is advised not to trade in pairs where the volatility is less. After the news announcement, the price moves higher, and ‘news candle’ closes with a slight amount of bullishness owing to poor Car Registration data. But since the news data is not very important to traders, we cannot expect the market to start trending after the news release also. We need to wait until the volatility increases, to take a trade.

That’s about ‘Car Registration’ and its impact on the Forex market after its news release. If you have any questions, please let us know in the comments below. Good luck!