Introduction
GDP per capita is the primary economic indicator in macroeconomics to measure the standard of living and economic prosperity. While GDP indicates the economy’s size in terms of economic output, it does not reveal for what populace the output is divided. Hence, GDP per Capita is more suited to assess the wealthiness of the country’s population.
Every nation strives to improve its standard-of-living by increasing the wealth of the population beyond just meeting daily needs. Hence, GDP per Capita becomes an important economic indicator for countries’ comparison of how well-off their people are.
What is the GDP per Capita?
GDP
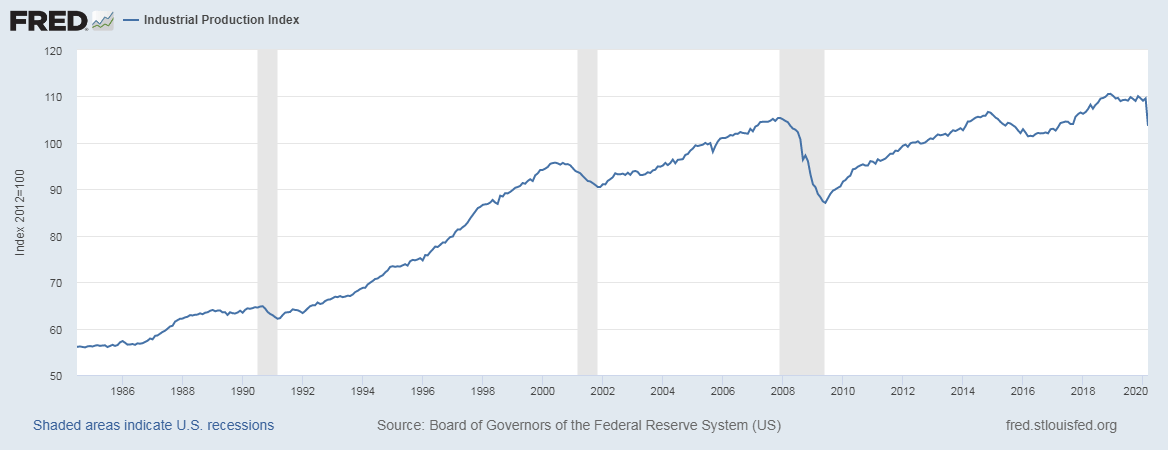
GDP is the measure of a country’s total economic output. It is the total monetary value of all the goods and services produced within the country regardless of citizenship (resident or foreign national). It is the market value of all the finished goods and services within a nation’s geographical borders for a given period. The period is generally a quarter (3 months) or a year. The commonly used term “size of the economy” refers to this economic indicator. The USA is the world’s largest economy, and it means it has the highest nominal GDP or highest economic output.
GDP Per Capita
It is a metric that is obtained by dividing a country’s GDP by its population count. Here, “per Capita” translates to “per average head” or “for one individual.” Hence, GDP per Capita is the measure of economic output per person.
If we want to compare GDP per Capita amongst countries, we use the Purchasing Power Parity (PPP). Through PPP measure, we can compare countries on equal terms, as many countries have different currencies, comparing economic output becomes difficult. Hence PPP measures everything in the United States dollar terms, thus creating a base standard for comparison.
How can the GDP per Capita numbers be used for analysis?
Since GDP is the total economic output, countries with lower economic output than other countries may not necessarily be poorer. On the contrary, it could be wealthier. For example, Qatar has only 19 billion US dollars GDP in comparison to the USA, which has 20.54 trillion US dollars. But Qatar is the number one ranked the country as per GDP per Capita. It has 126,898 US Dollars compared to the United States that has only 62,794 US Dollars. Hence, the people of Qatar are wealthier than those in the United States.
Here, we have to understand GDP per Capita is a function of the population. Higher population results in higher GDP prints but also distributes the GDP amongst more people. Qatar is a prosperous country with sizeable natural oil resources, which is not a labor-intensive task to extract and export. Hence, the high GDP through Crude Oil exports is divided amongst a few populace of 2.7 million people compared to the United States 328 million. The USA is the third most populous country after China and India.
Overall, small and prosperous countries and developed industrial nations tend to have high GDP per Capita. The wealthiest and most impoverished countries are also assessed based on the GDP per Capita as a primary metric.
The income per capita and GDP per Capita are the two most common tools for measuring economic wealth and prosperity. GDP per capita is more popular and widely used as it is more regularly tracked and maintained on a global scale by most countries. It, in turn, helps in ease of calculation, usage, and comparison amongst countries.
It tells us how much economic output is attributed to a citizen. Hence, it is a measure of national wealth. On the other hand, it can also tell us the economic productivity of the people. Productive and talented groups of people will contribute more value to the GDP prints.
GDP per capita is used alongside GDP and other GDP related metrics like the GDP Growth Rate, Real GDP, by policymakers to assess the economic health and take necessary actions to drive the economy in the right direction. When the GDP prints are consequently decreasing for two quarters, Central Authorities intervene through monetary and fiscal levers to counter deflation and stimulate economic growth through inflationary pressures.
GDP metrics are closely watched by investors (domestic and foreign alike) to make investment decisions. Declining GDP holds off investments from investors, due to decreased confidence and vice-versa.
Impact on Currency
GDP metrics are used in a variety of ways by a variety of people. Economists and Central Authorities primarily use GDP per Capita to understand the economic wellbeing of its people. GDP Growth Rate is primarily used by Traders, Business people, and Investors to make business decisions.
GDP per capita would likely be more useful for Policymakers, and Business people. Business people can use this as a wealth metric and consequently decide the products that would suit the budget of people. The higher the wealth of the individual citizen, the costlier products and services they can afford. Hence, business decisions can also be impacted.
It is a proportional high impact indicator. Fluctuations in the GDP metrics bring a lot of volatility in currency markets. Falling GDP metrics are terrible for the economy, its businesses, consumers, and the Government. GDP impacts everyone. Hence, Central Authorities are committed to maintaining GDP Growth and take the necessary actions to avoid deflation. Businesses also hold off investment decisions in the stagnating economy and vice-versa.
Higher GDP per Capita is good for the currency and the economy and vice-versa. Although for trading decisions, GDP Growth Rate serves as a more relevant metric for comparisons amongst different currency countries.
Economic Reports
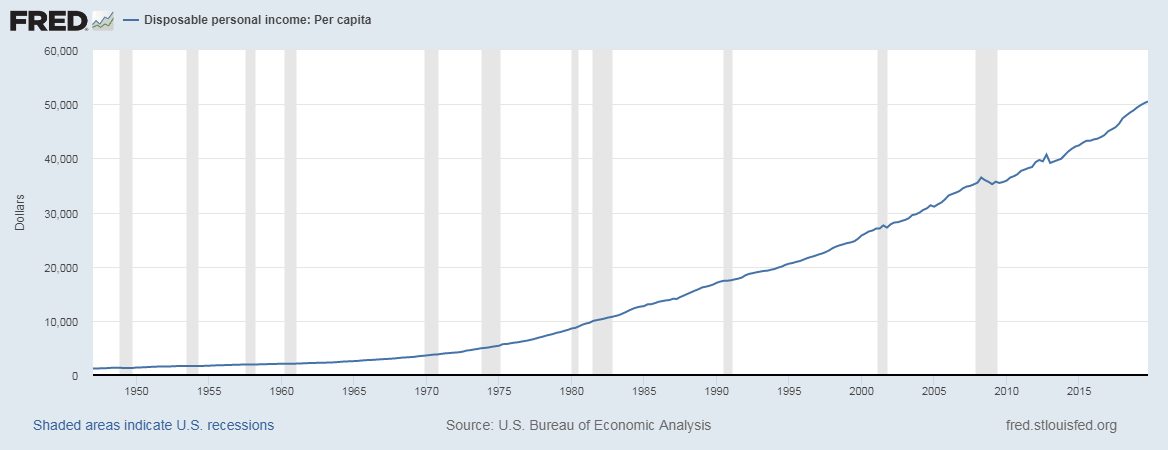
For the United States, the Bureau of Economic Analysis releases quarterly GDP figures from which we can obtain our statistics on its official website every quarter. The release schedule is already mentioned on the website and is generally released one month after the quarter ends.
Major international organizations like the World Bank, International Monetary Fund, OECD, etc. actively maintain track of GDP figures of most countries on their official website:
Sources of GDP per Capita
For the United States, the BEA reports are available here.
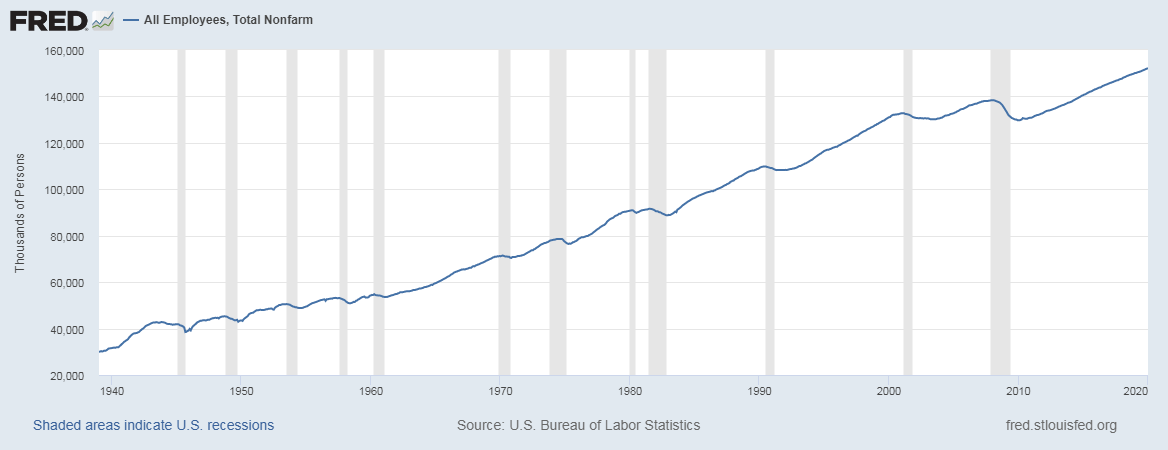
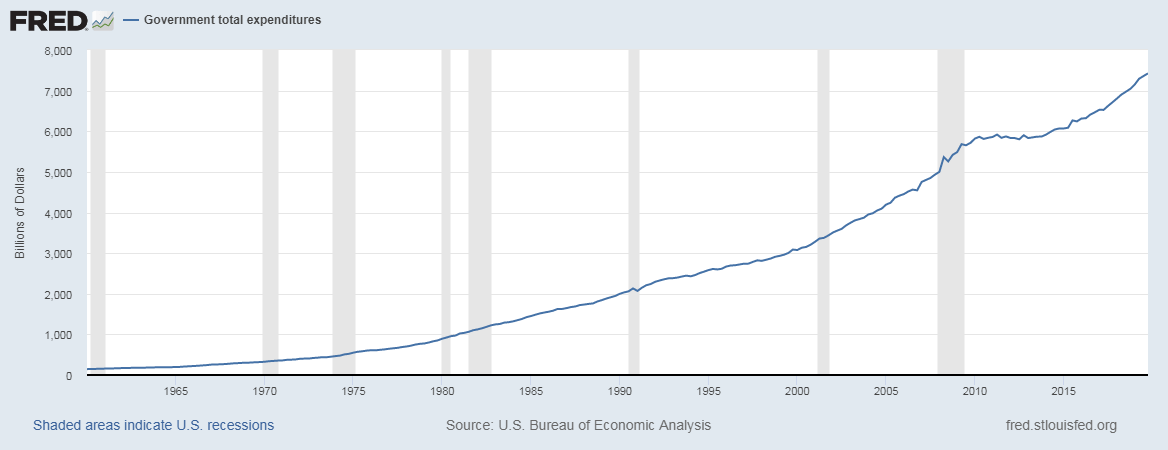
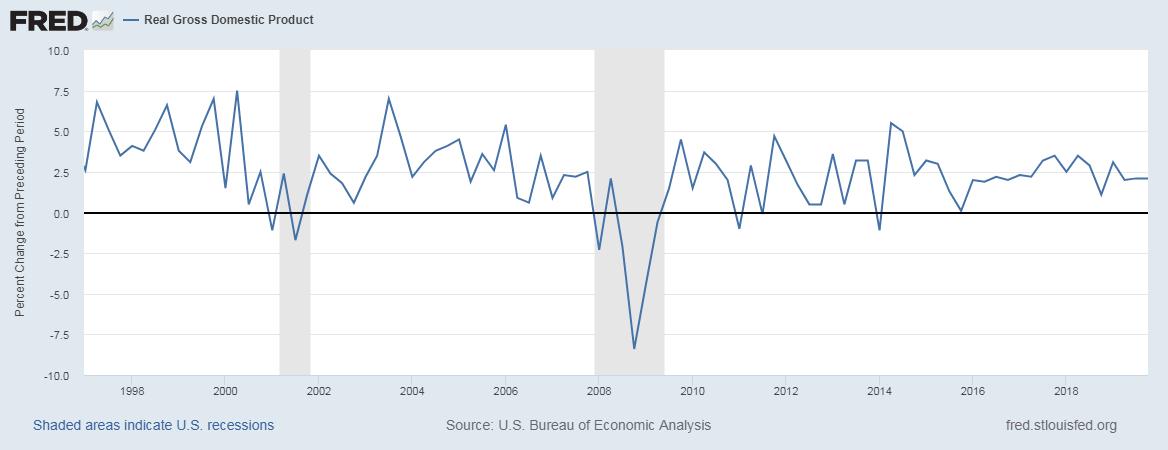
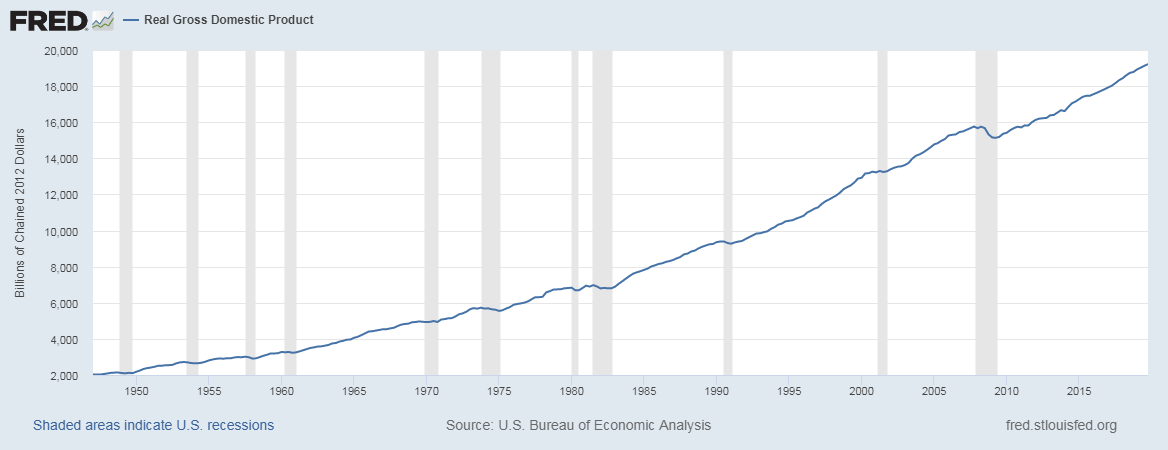
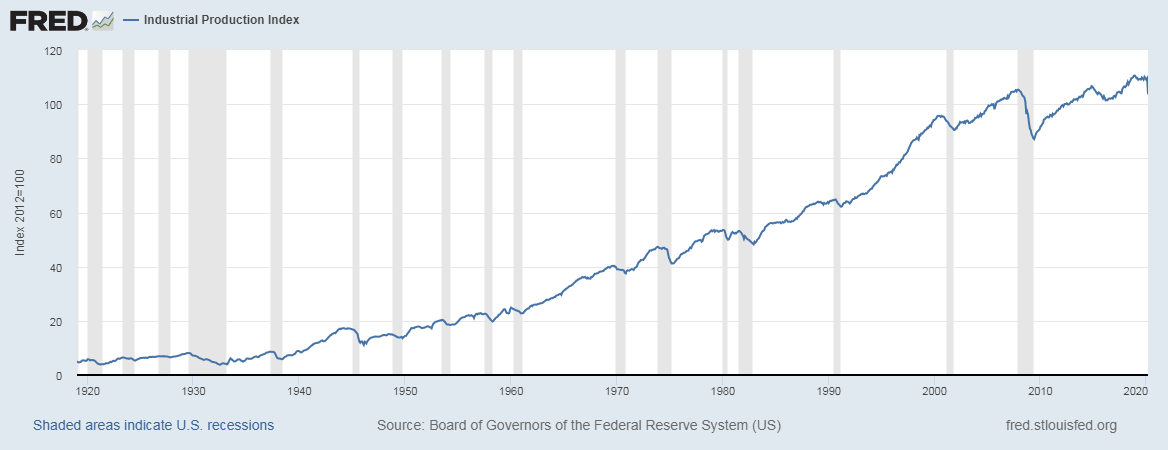
The St. Louis FRED keeps track of all the GDP and its related components in one place on its official website. You can find this information in the below-mentioned sources.
Impact of the “GDP per Capita” news release on the Forex market
In the above section of the article, we saw the definition of GDP Per Capita and understood how it differs from the nominal GDP. Per Capita GDP is calculated by dividing GDP over the entire population of the country. GDP Per Capita is a universal measure used by most economists to gauge the prosperity of nations.
It provides insight into the economic prosperity and economic development across the globe. Countries with high technological progress see a significant increase in GDP Per Capita. It is also a significant indicator of comparing the economic growth between the two countries. GDP Per Capita if often analyzed alongside GDP. GDP Per Capita considers both the GDP and its population.

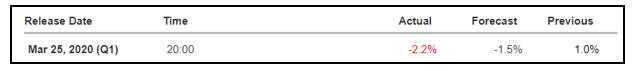
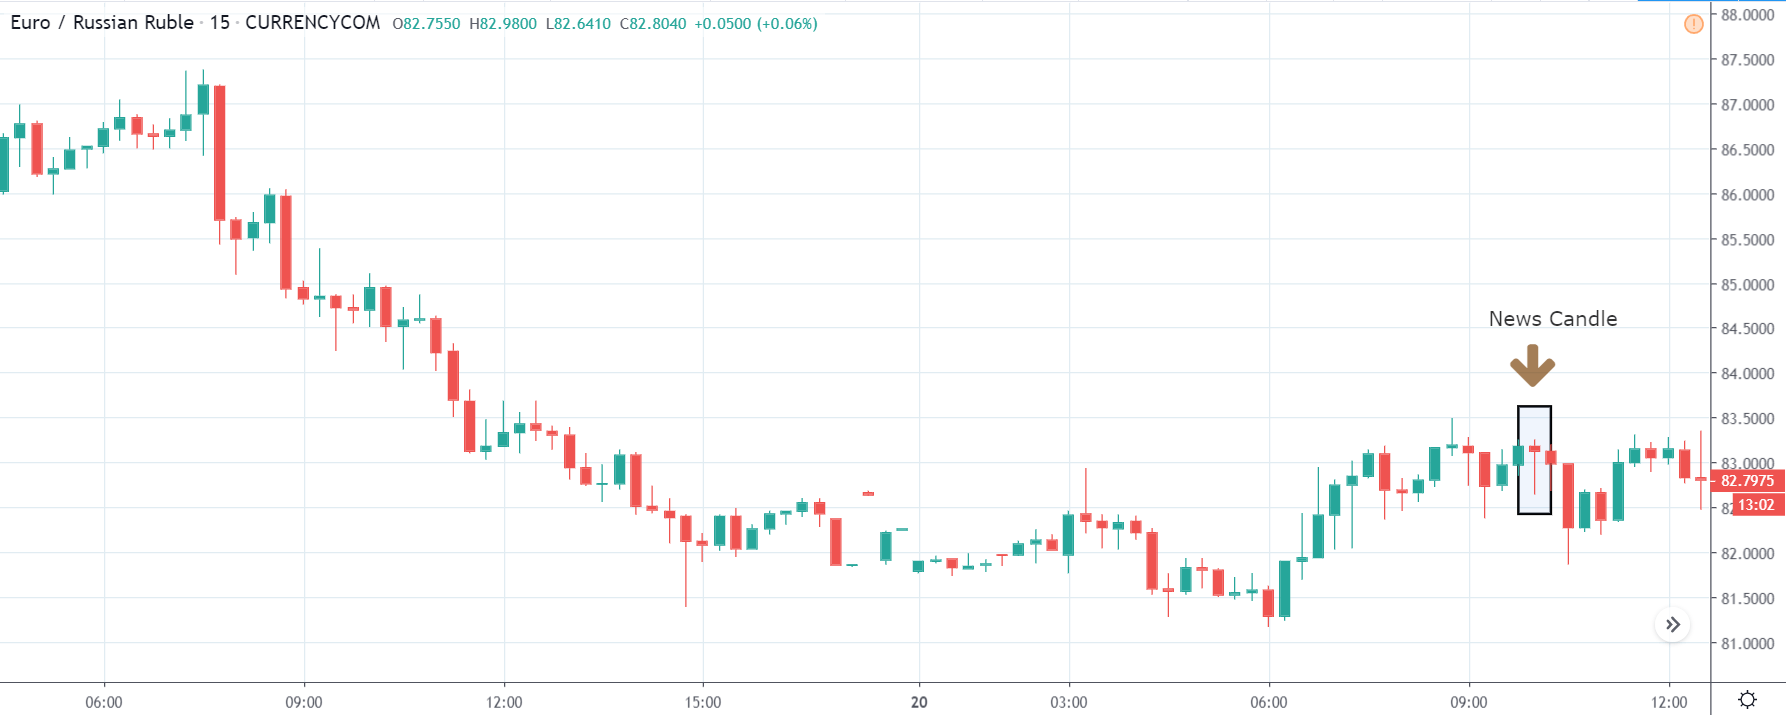
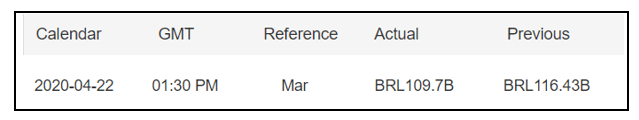
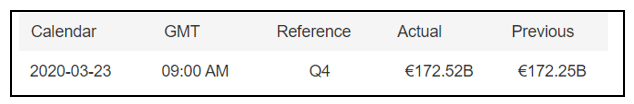
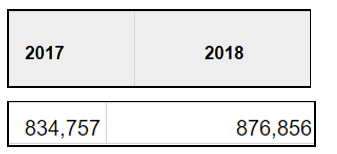
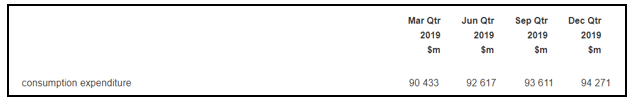
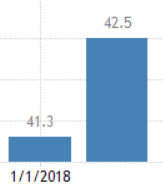
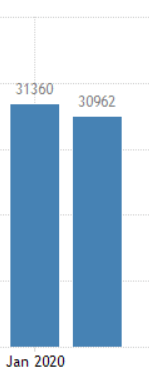
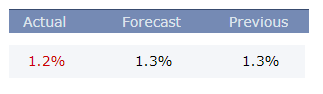
In today’s lesson, we will analyze the impact of GDP on the value of the currency and observe the variation in volatility due to the news announcement. In this regard, we have collected the year-on-year GDP of Japan, where the below image shows the GDP measured in the last fiscal year. Let us find out the reaction of the market to this data.
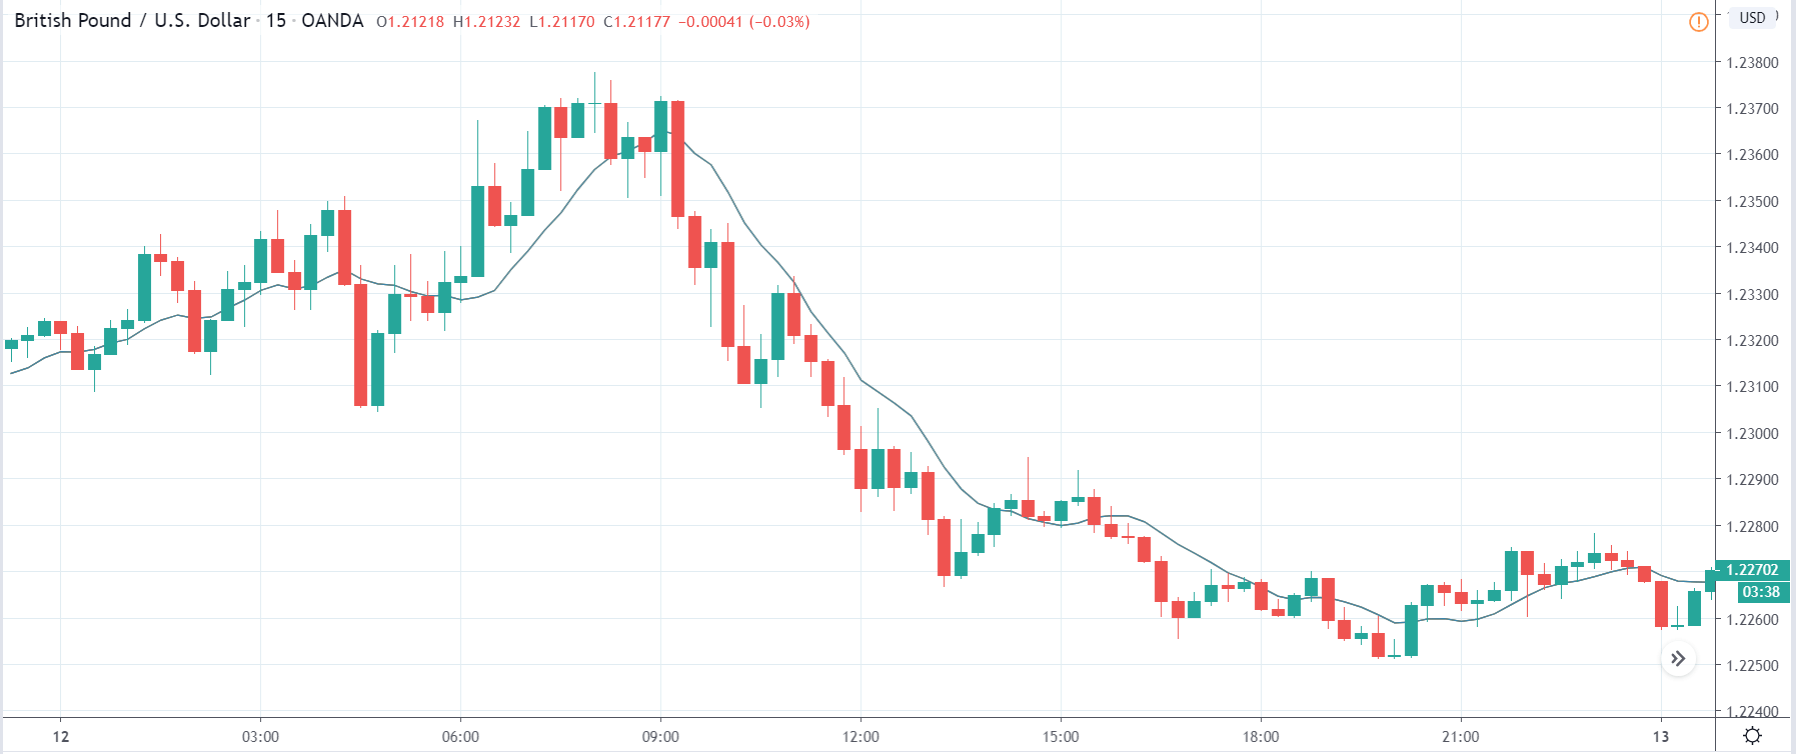
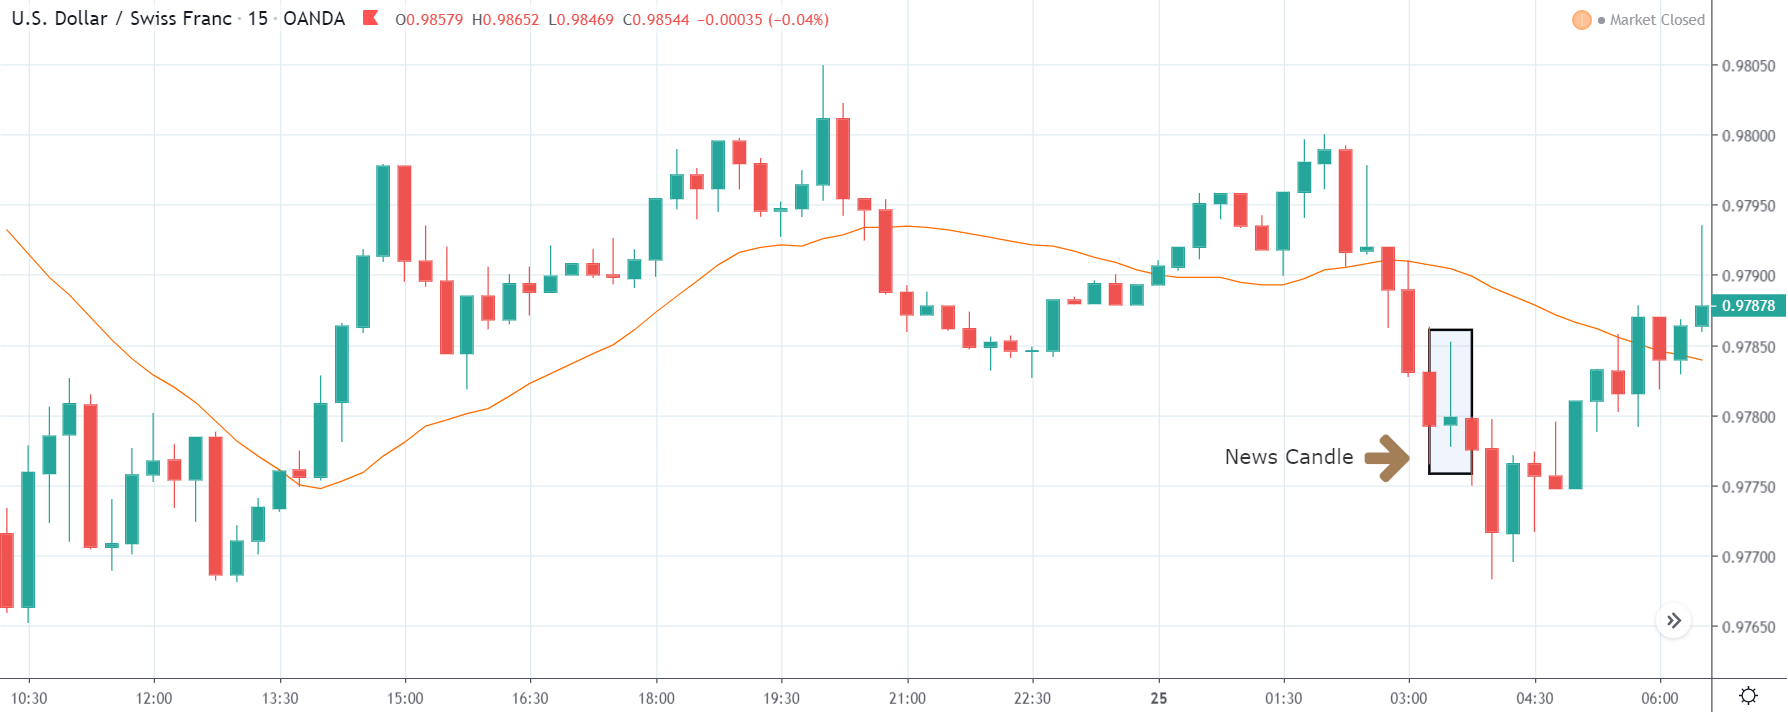
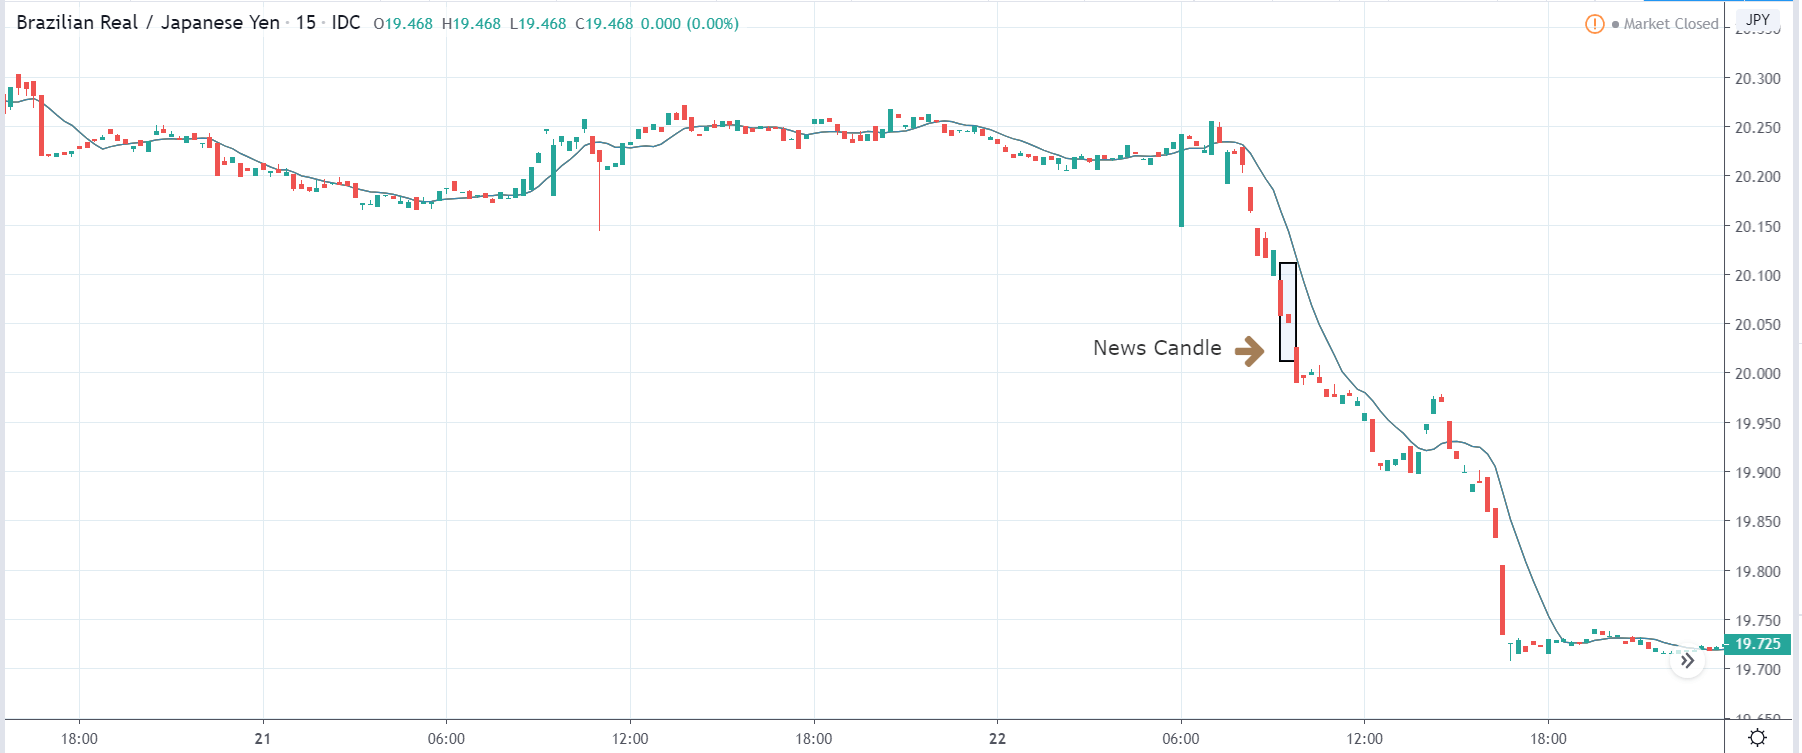
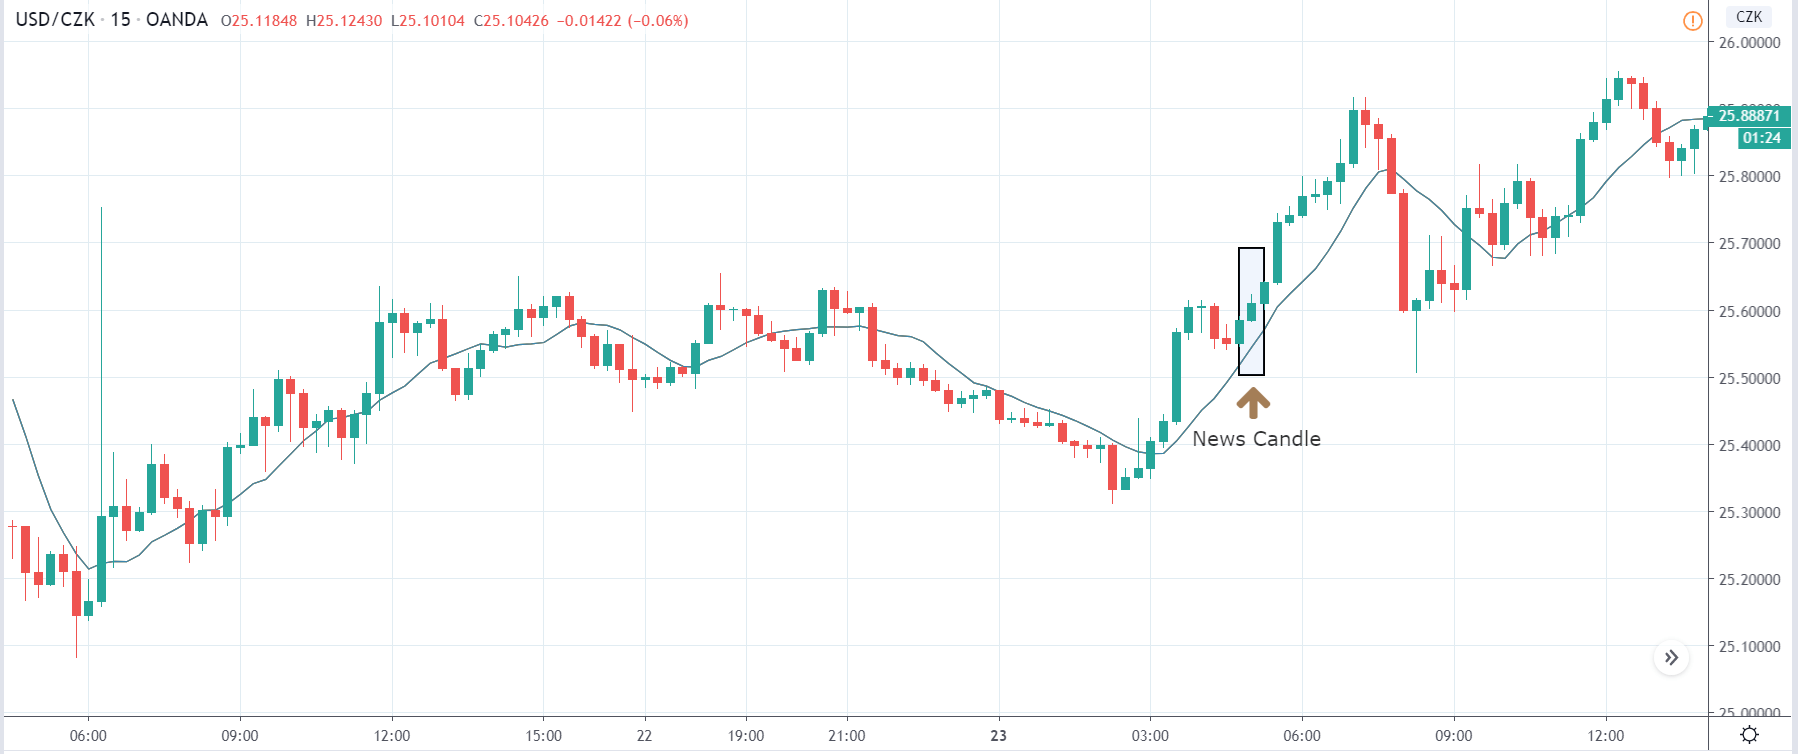
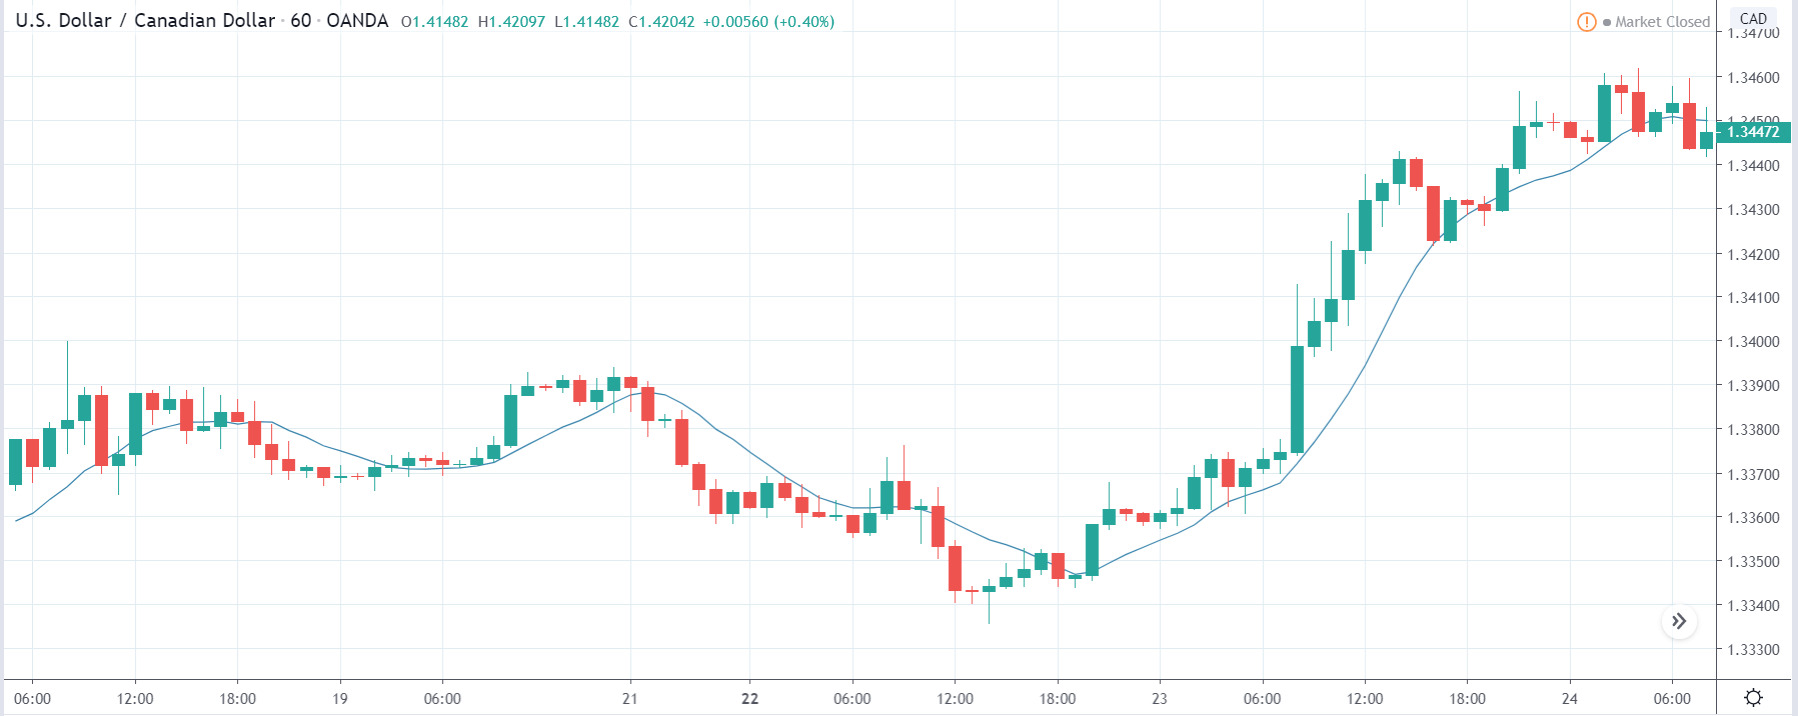
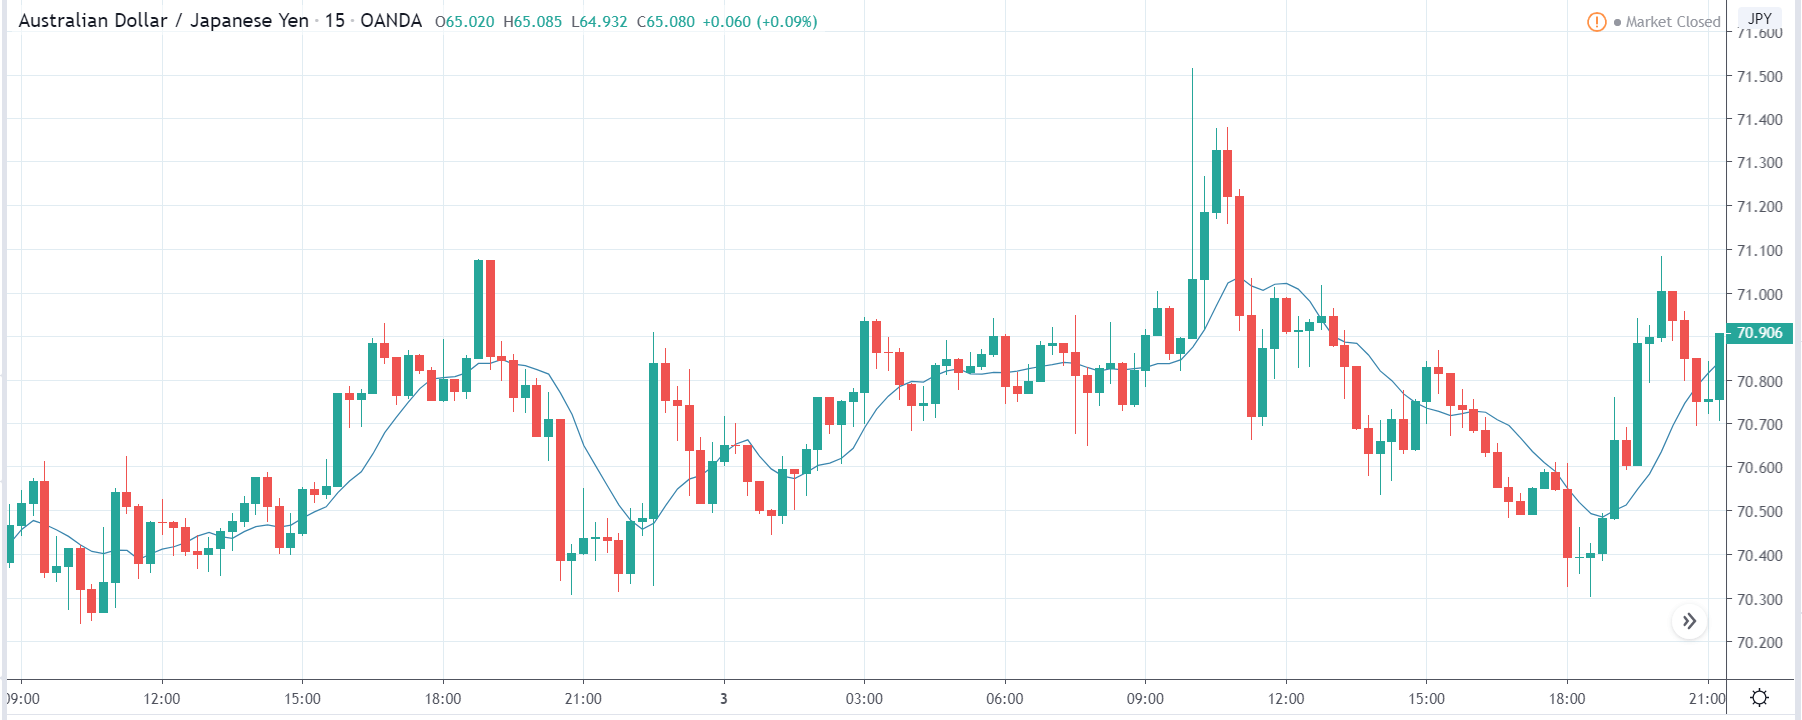
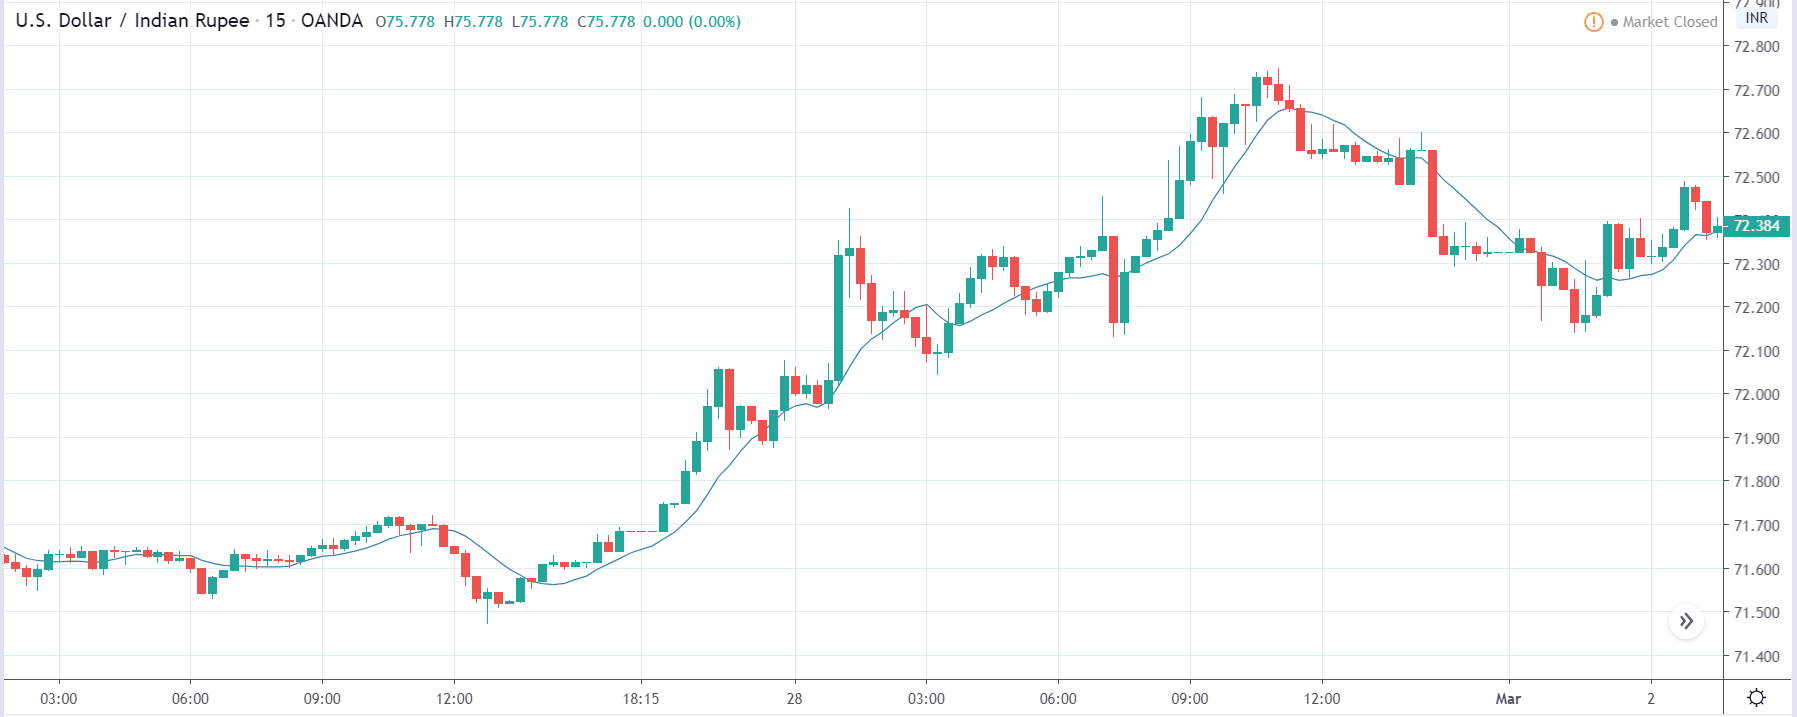
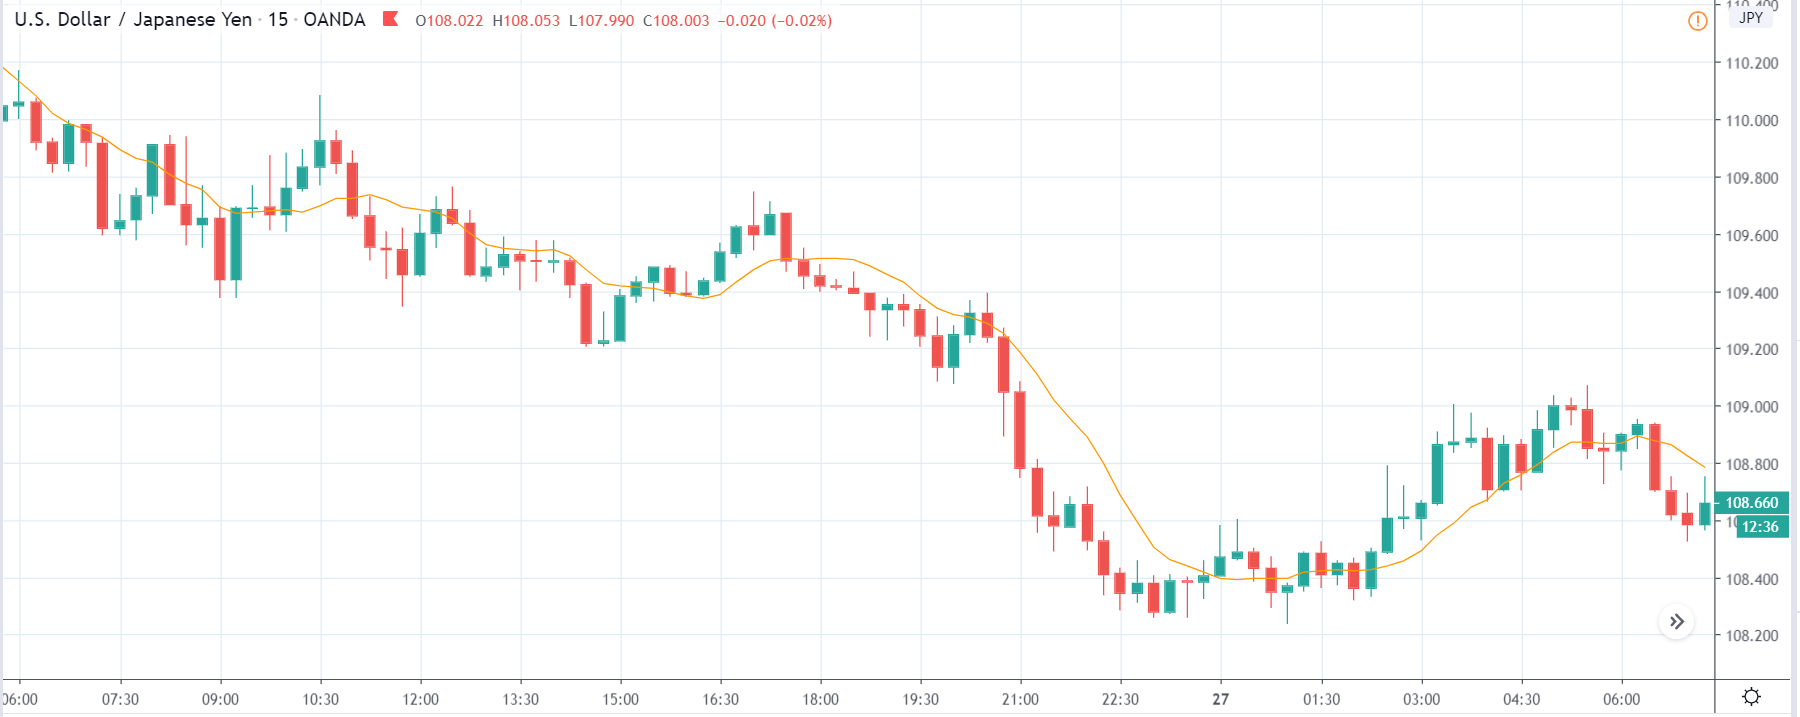
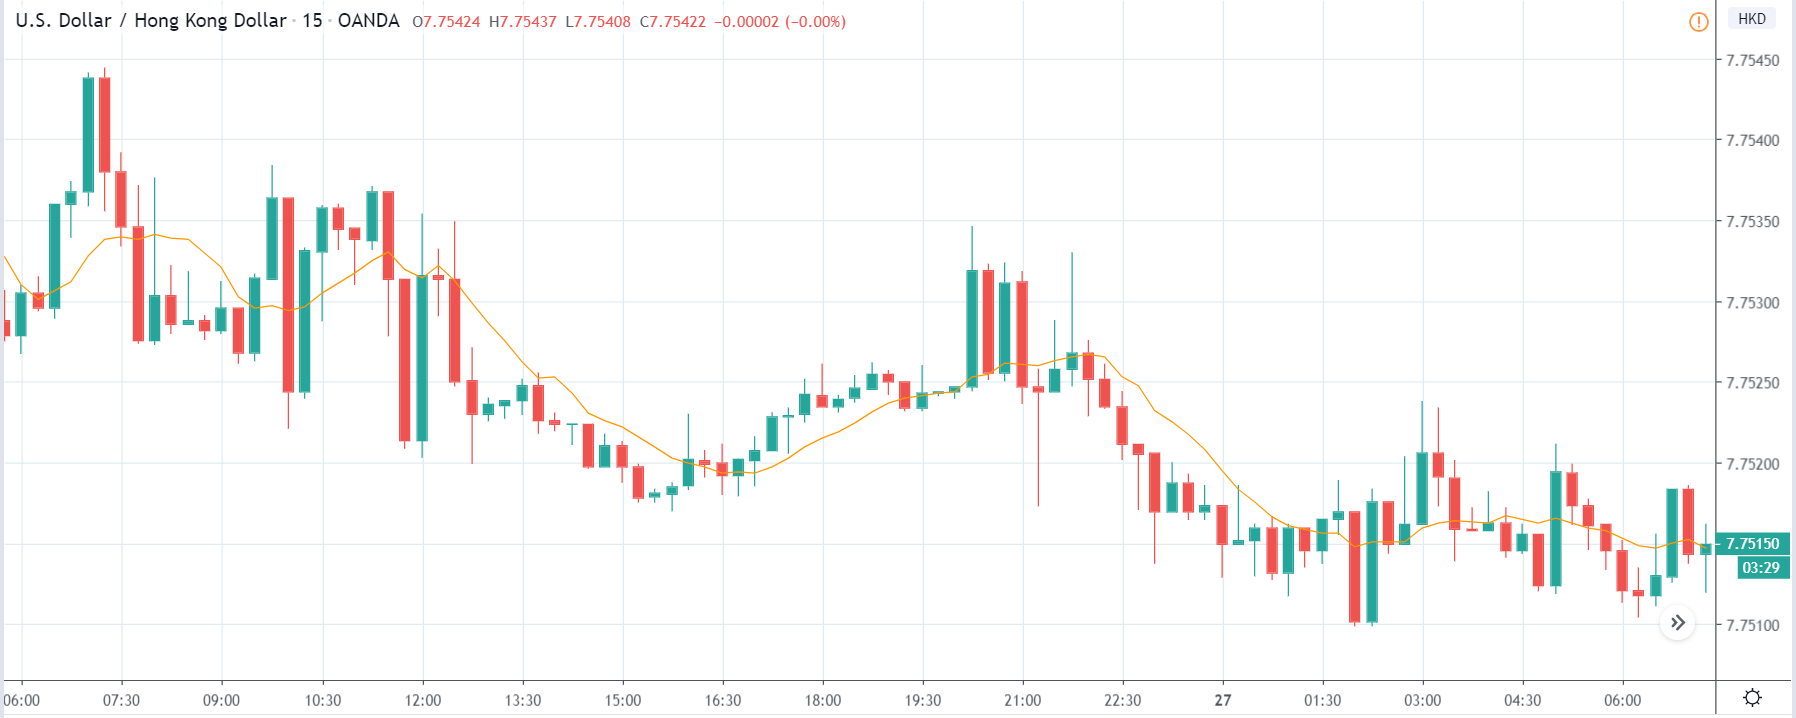
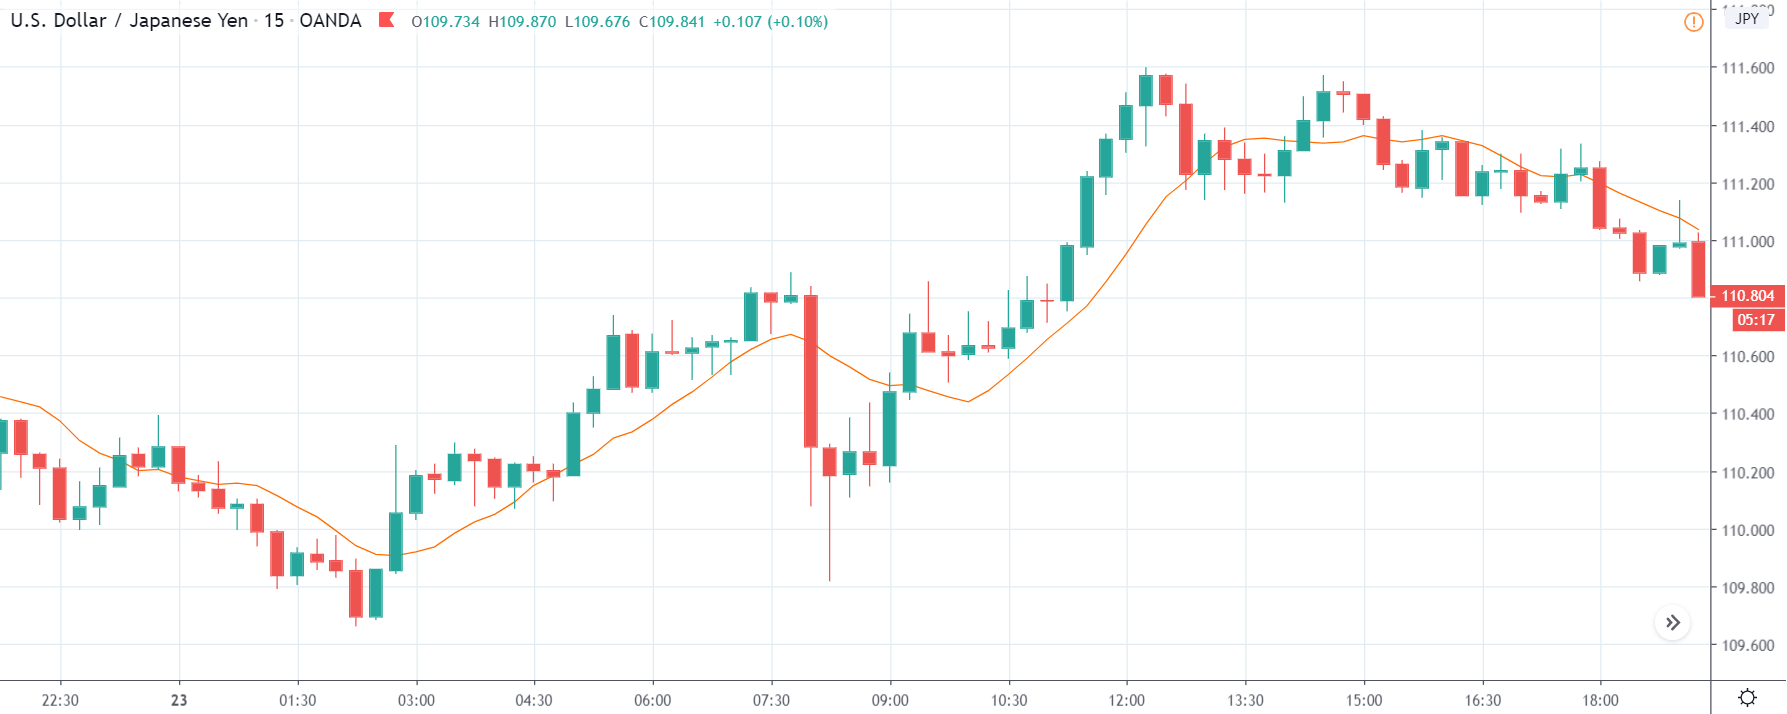
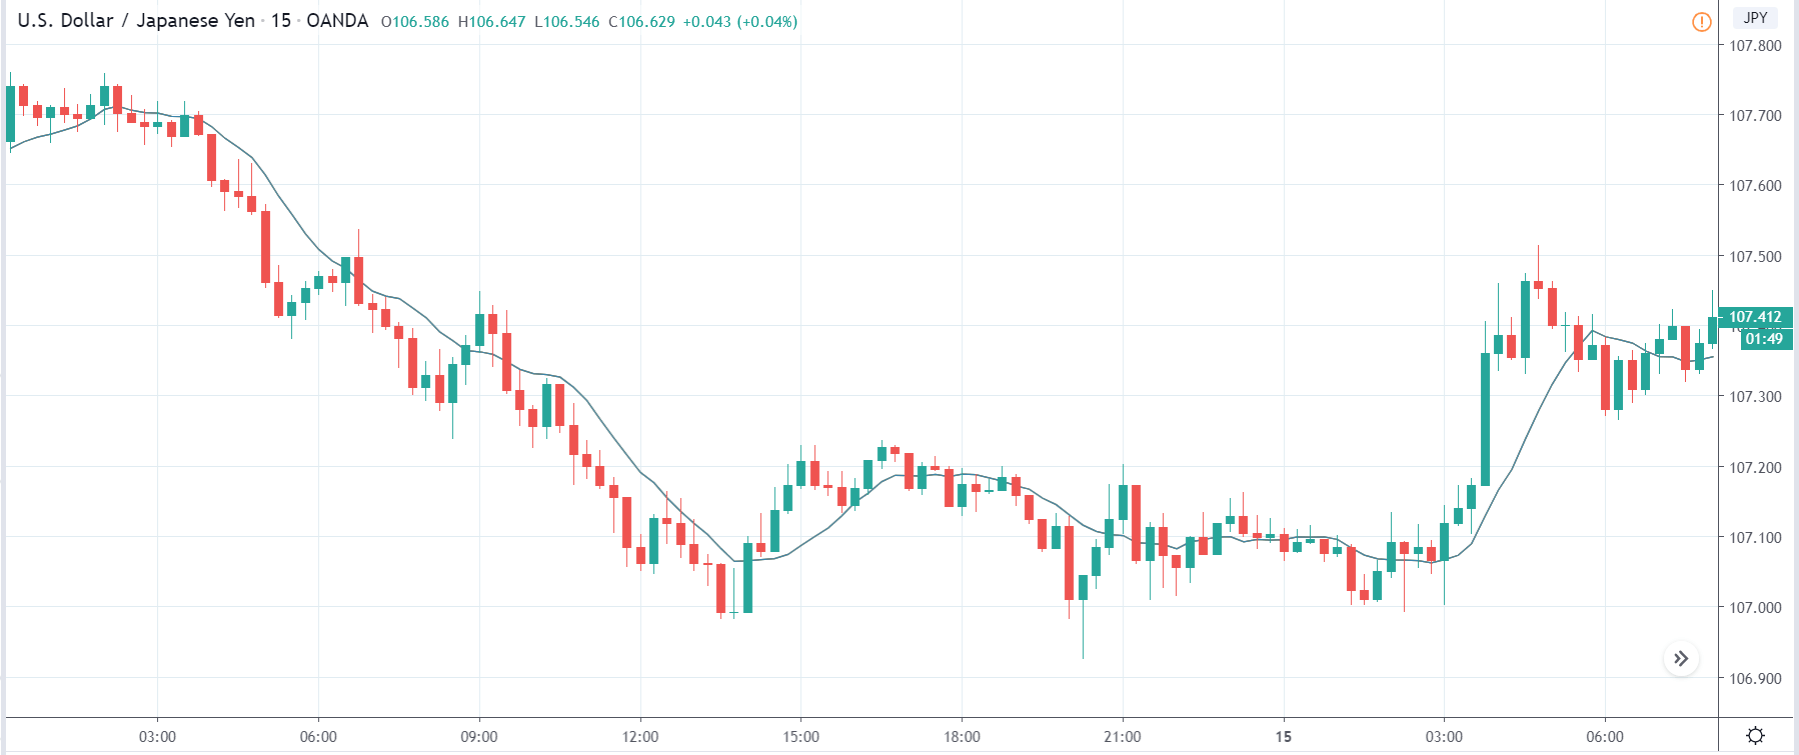
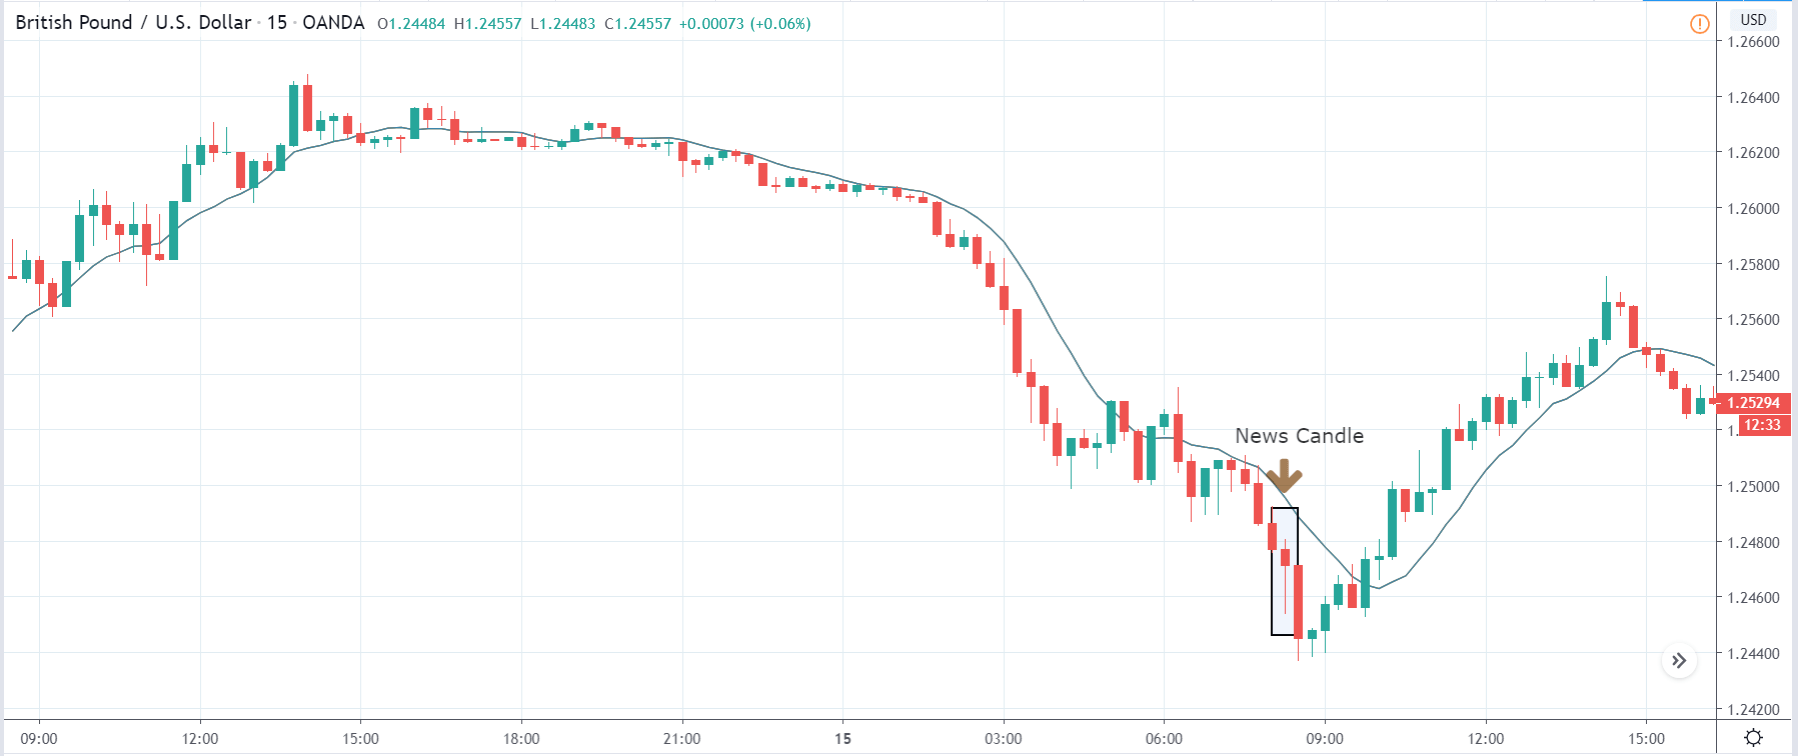
USD/JPY | Before the announcement:
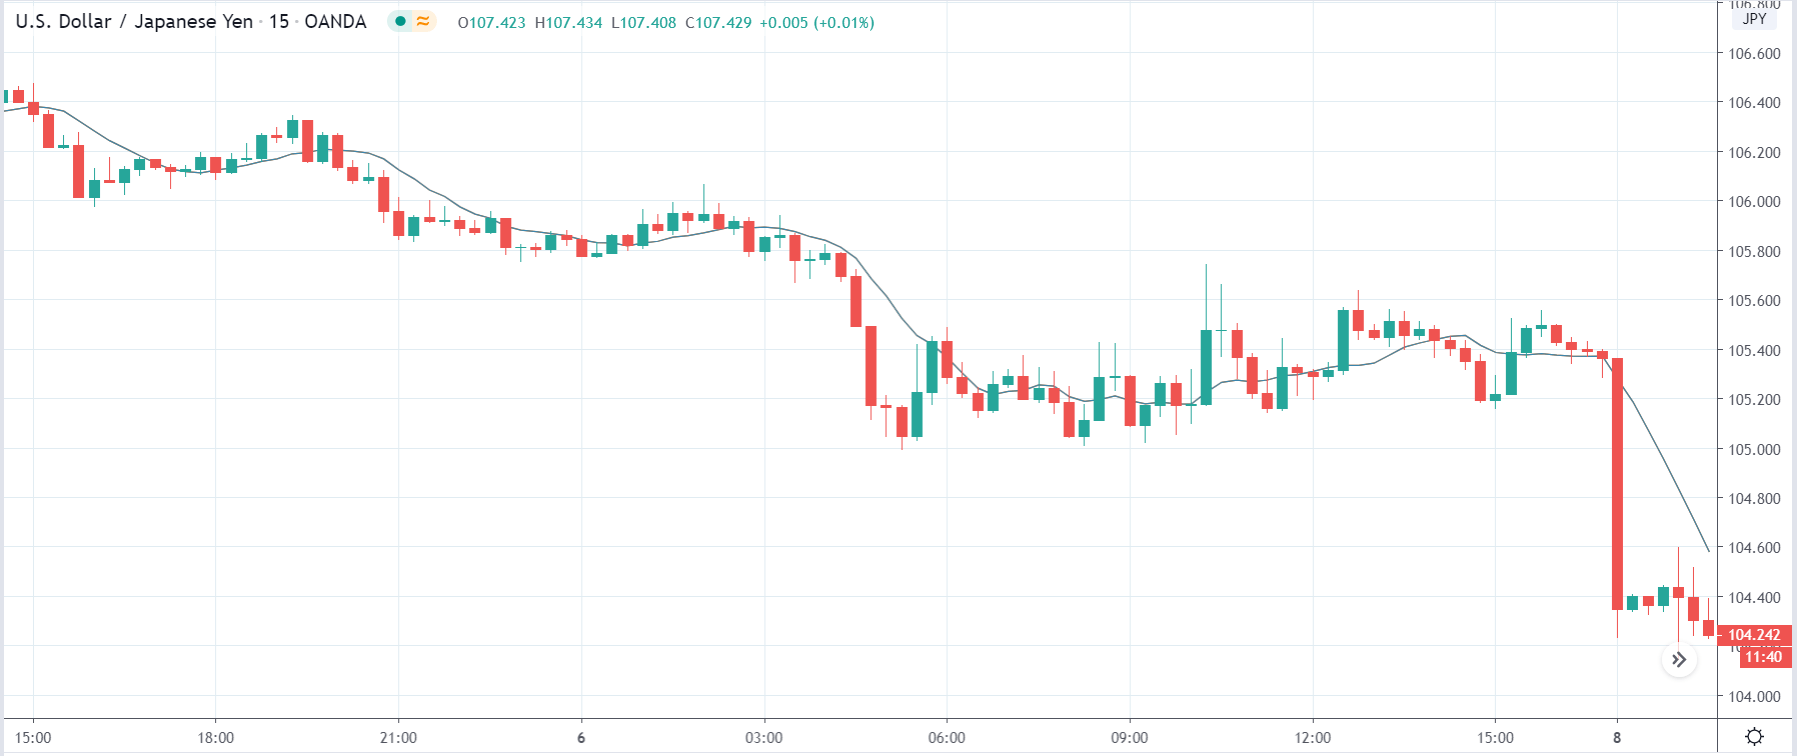
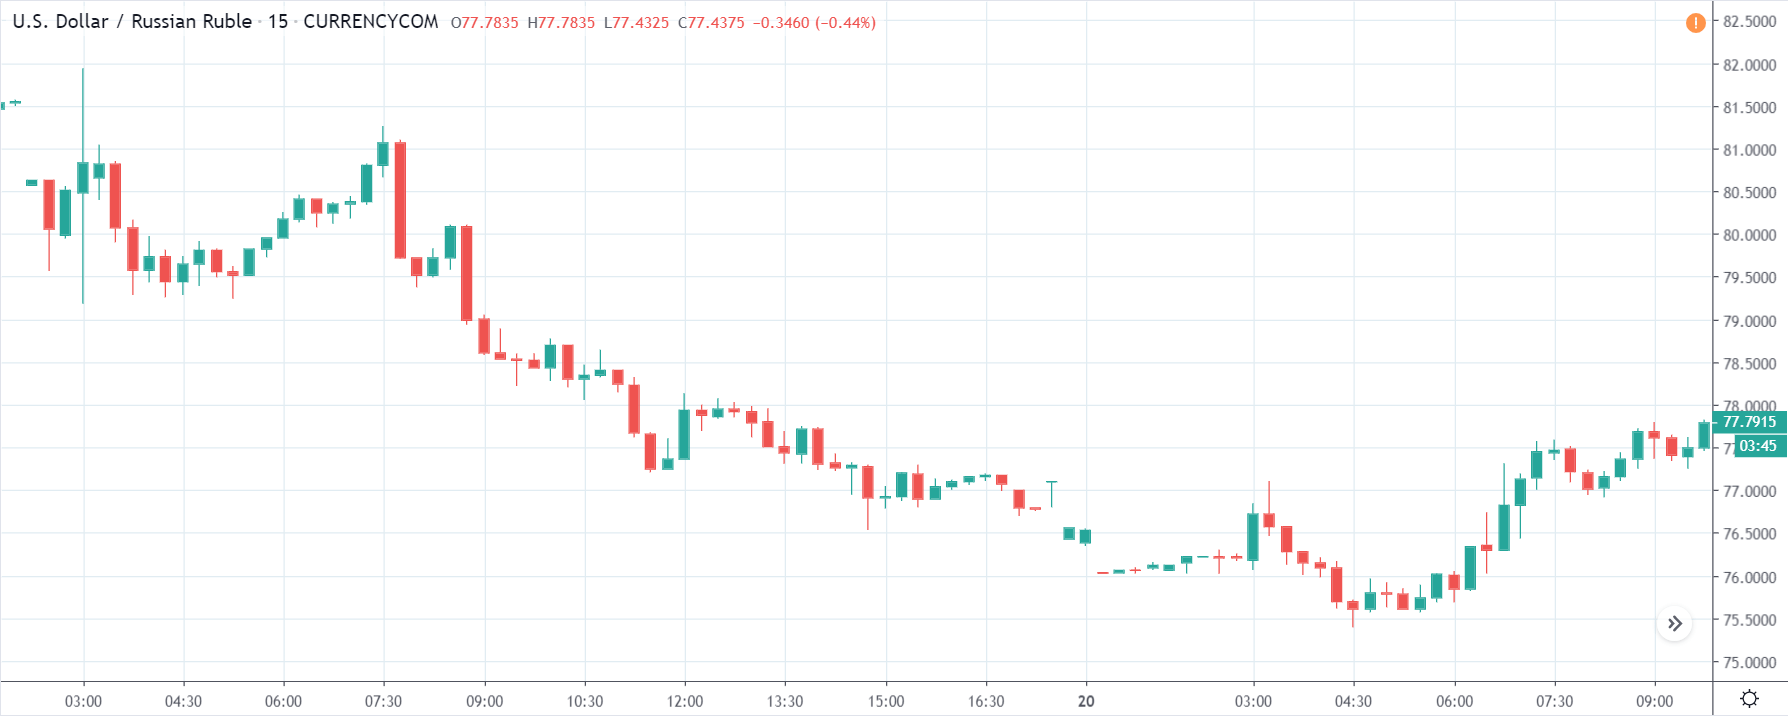
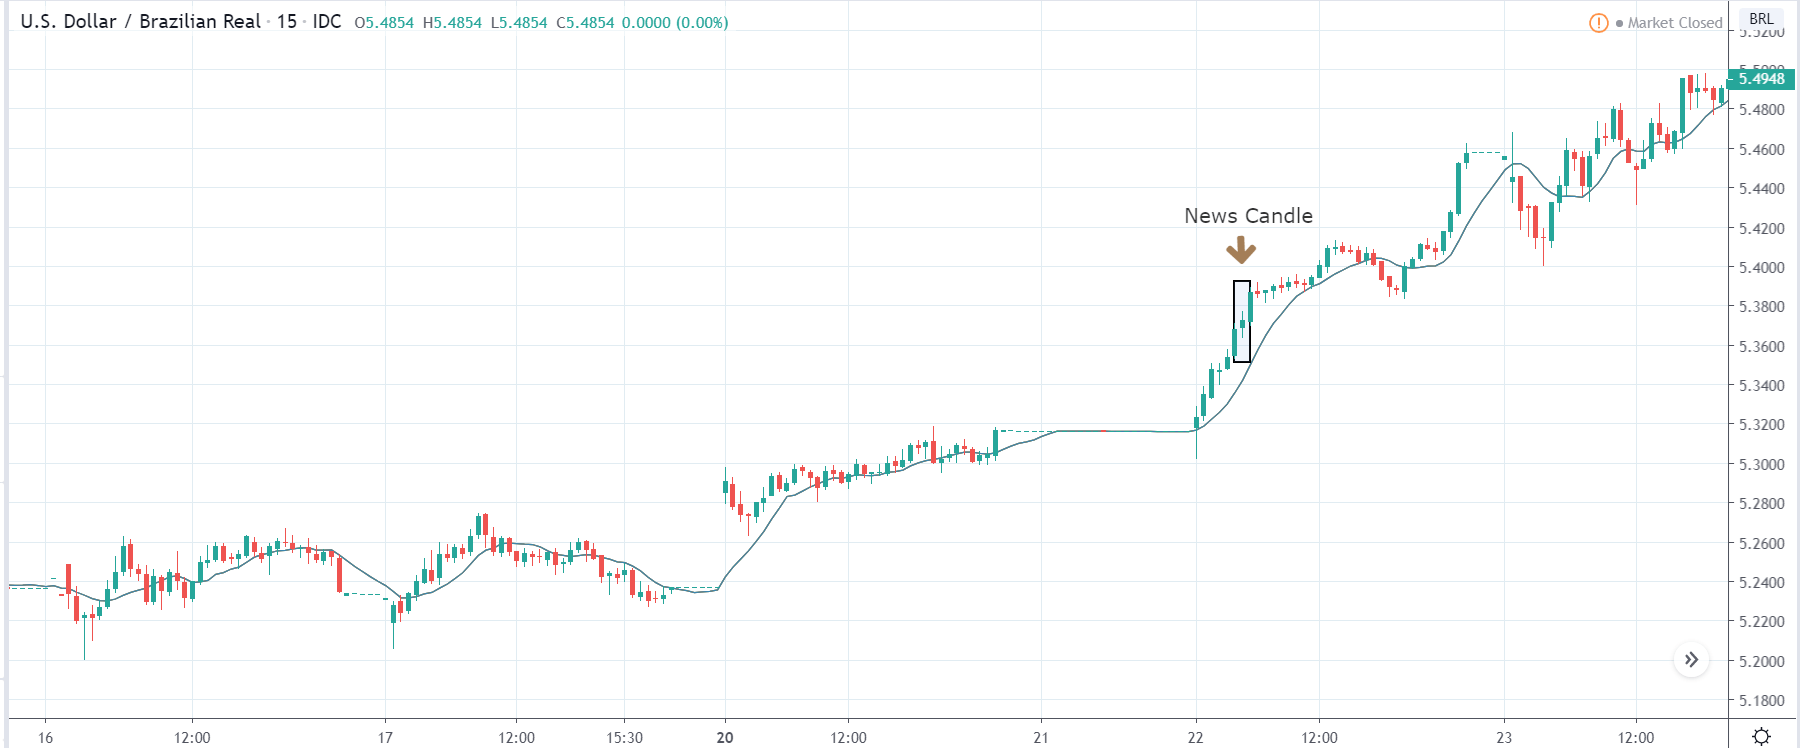
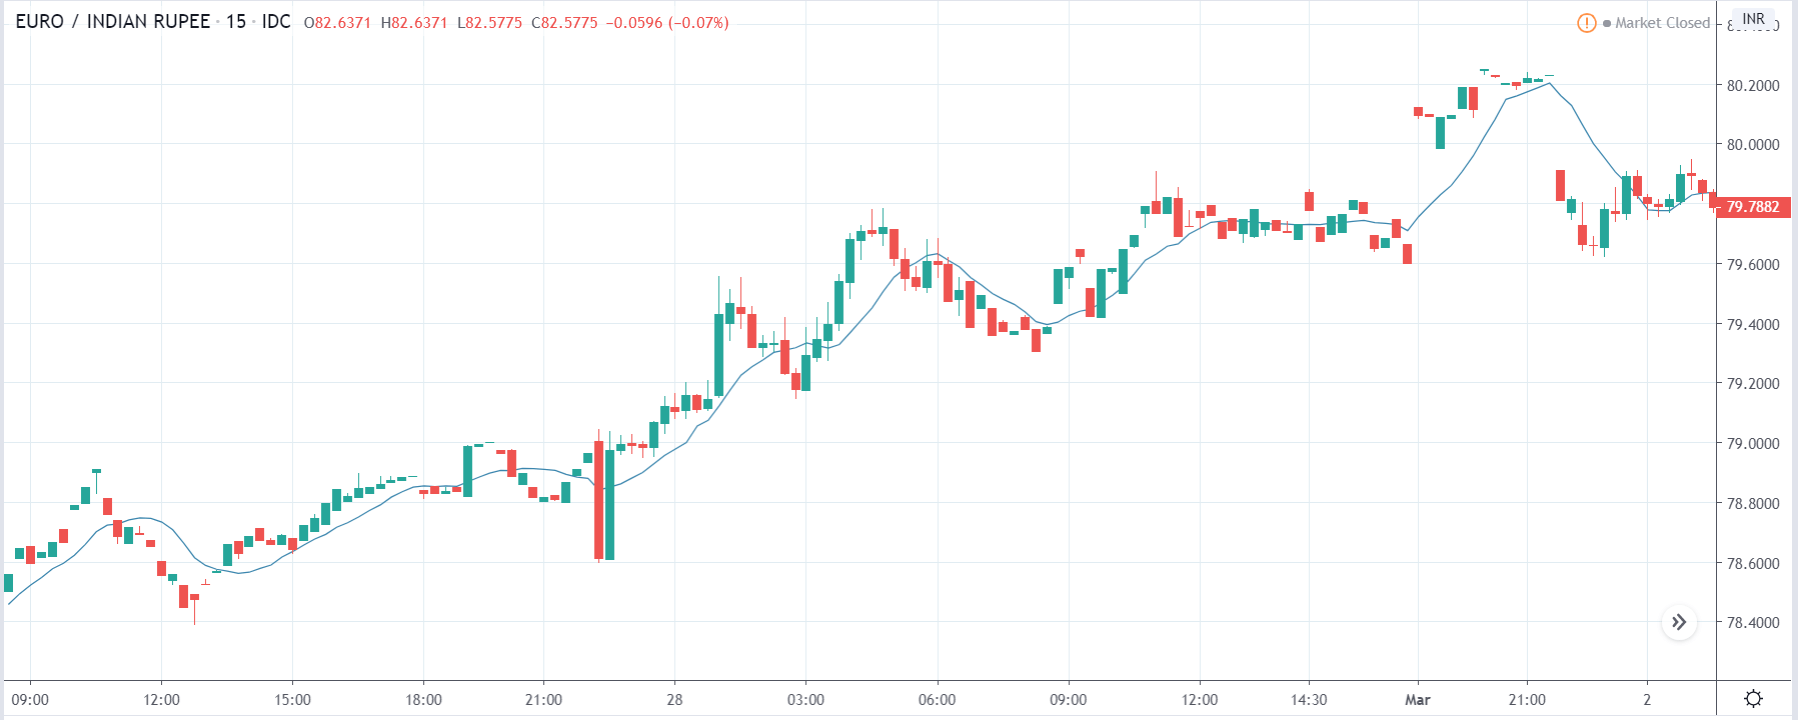
We shall start with the USD/JPY currency pair to observe the impact of GDP data on the Japanese Yen. We can see in the earlier image that the market is in a downtrend with a large bearish candle visible a few minutes before the news release. As the market is very bearish, we will look to the currency pair after a price retracement to a technically significant level. At this point, we cannot take any position in the market.
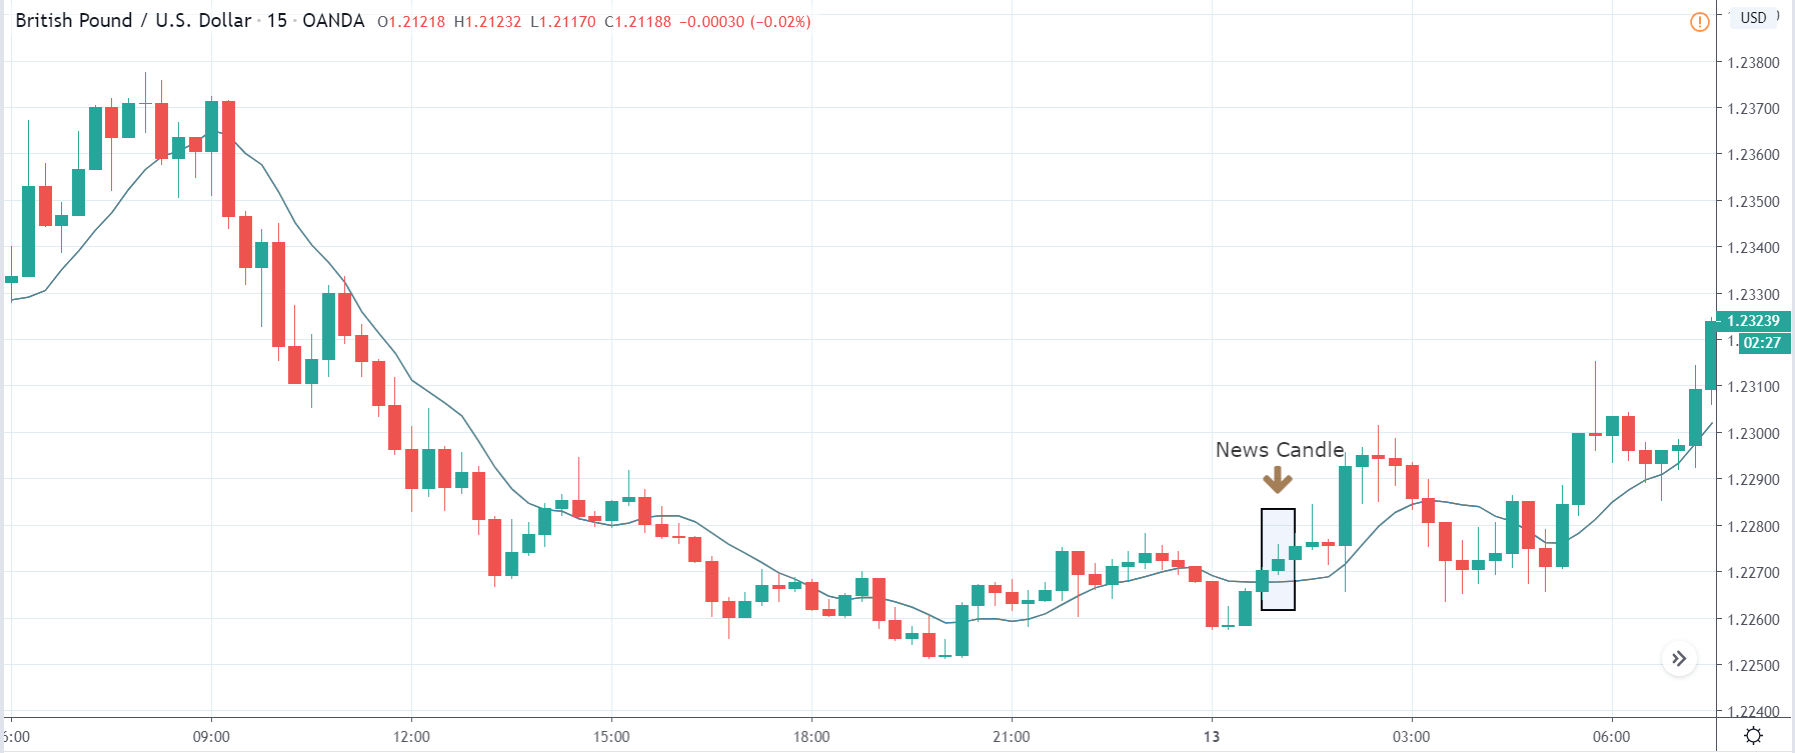
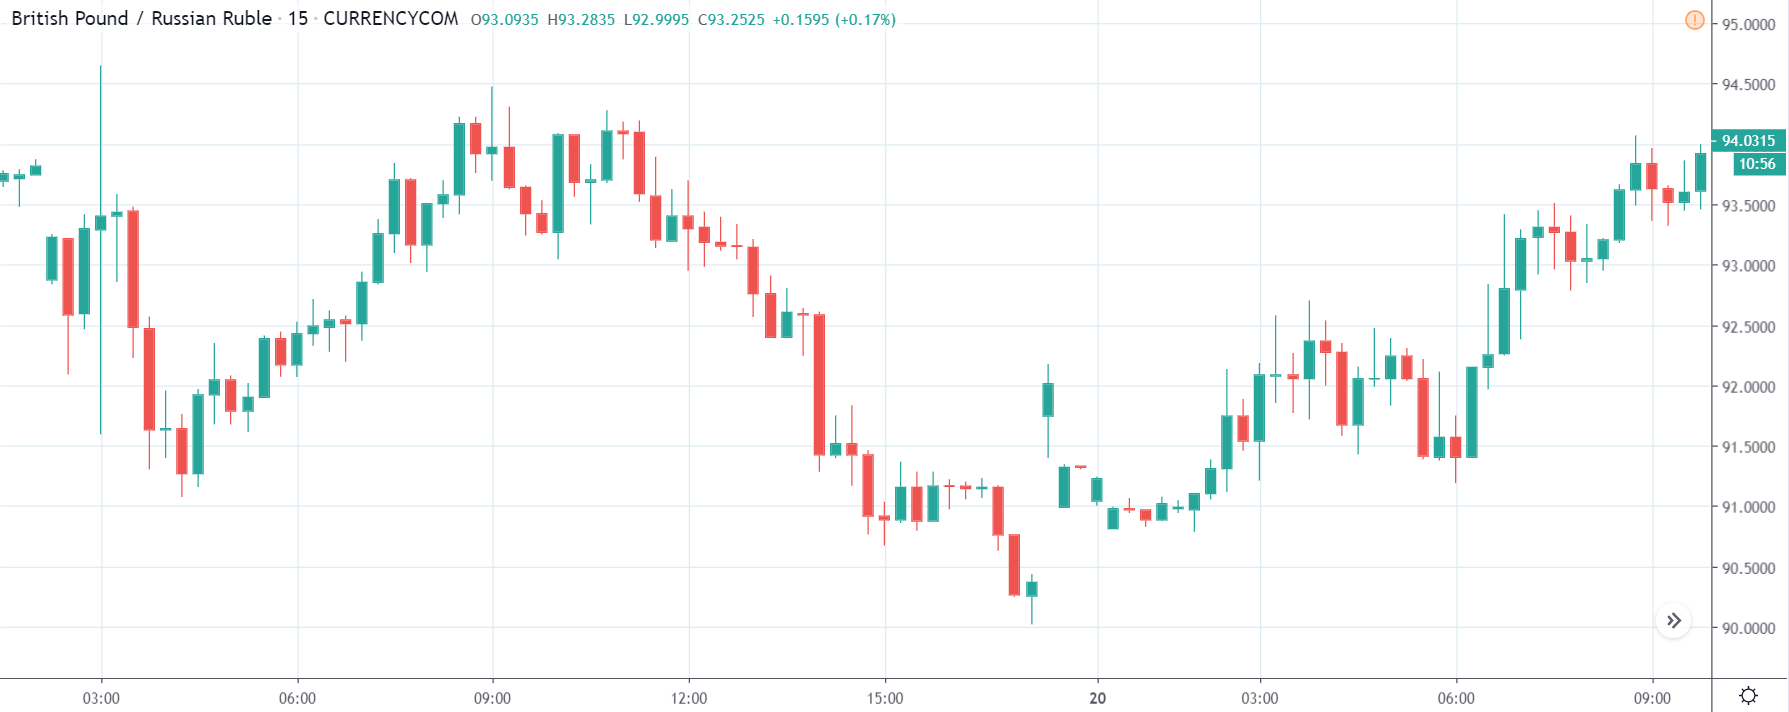
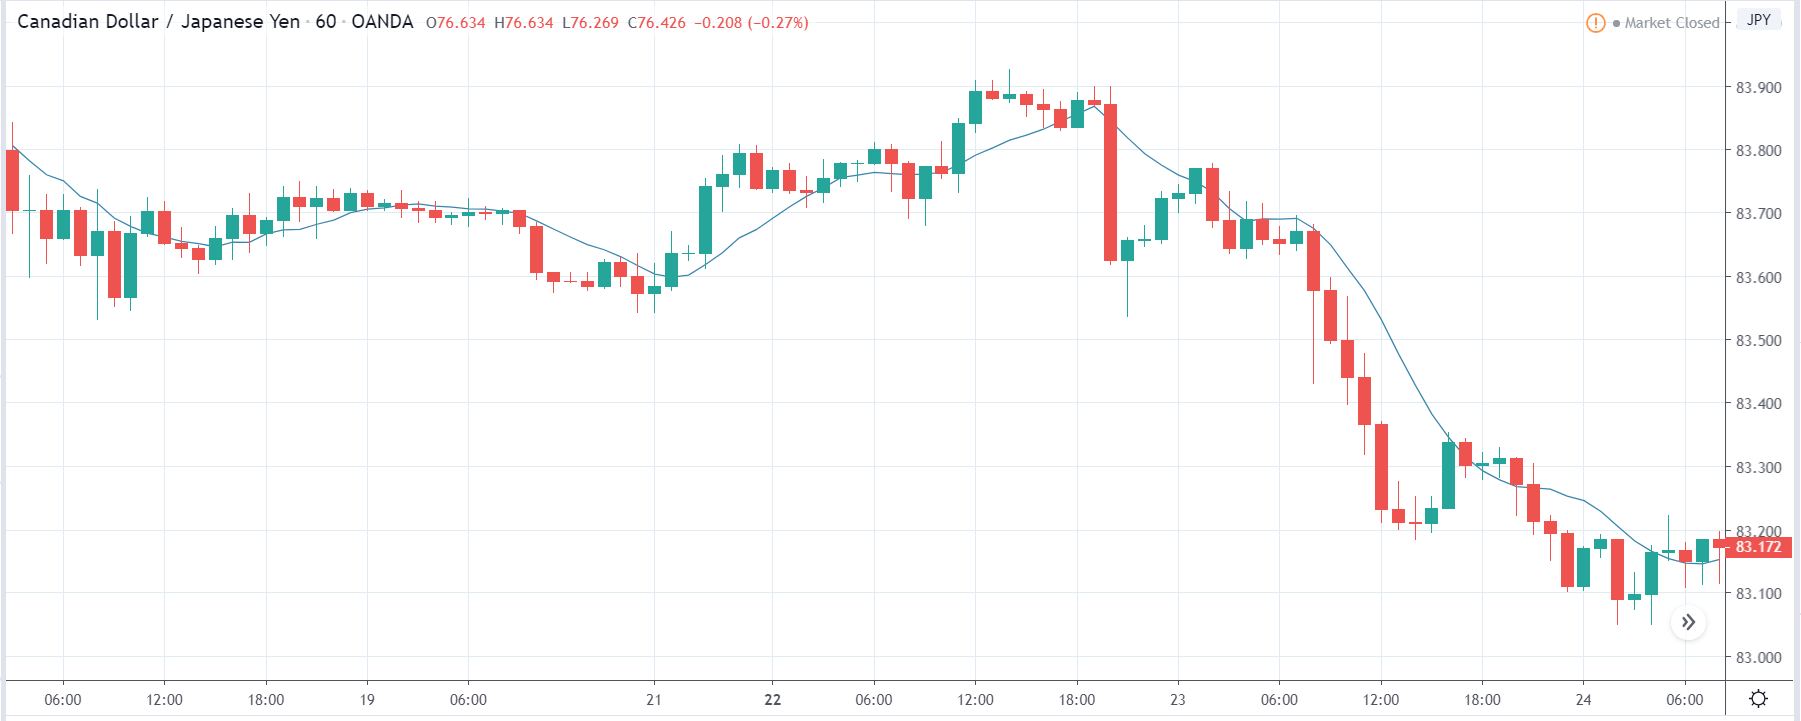
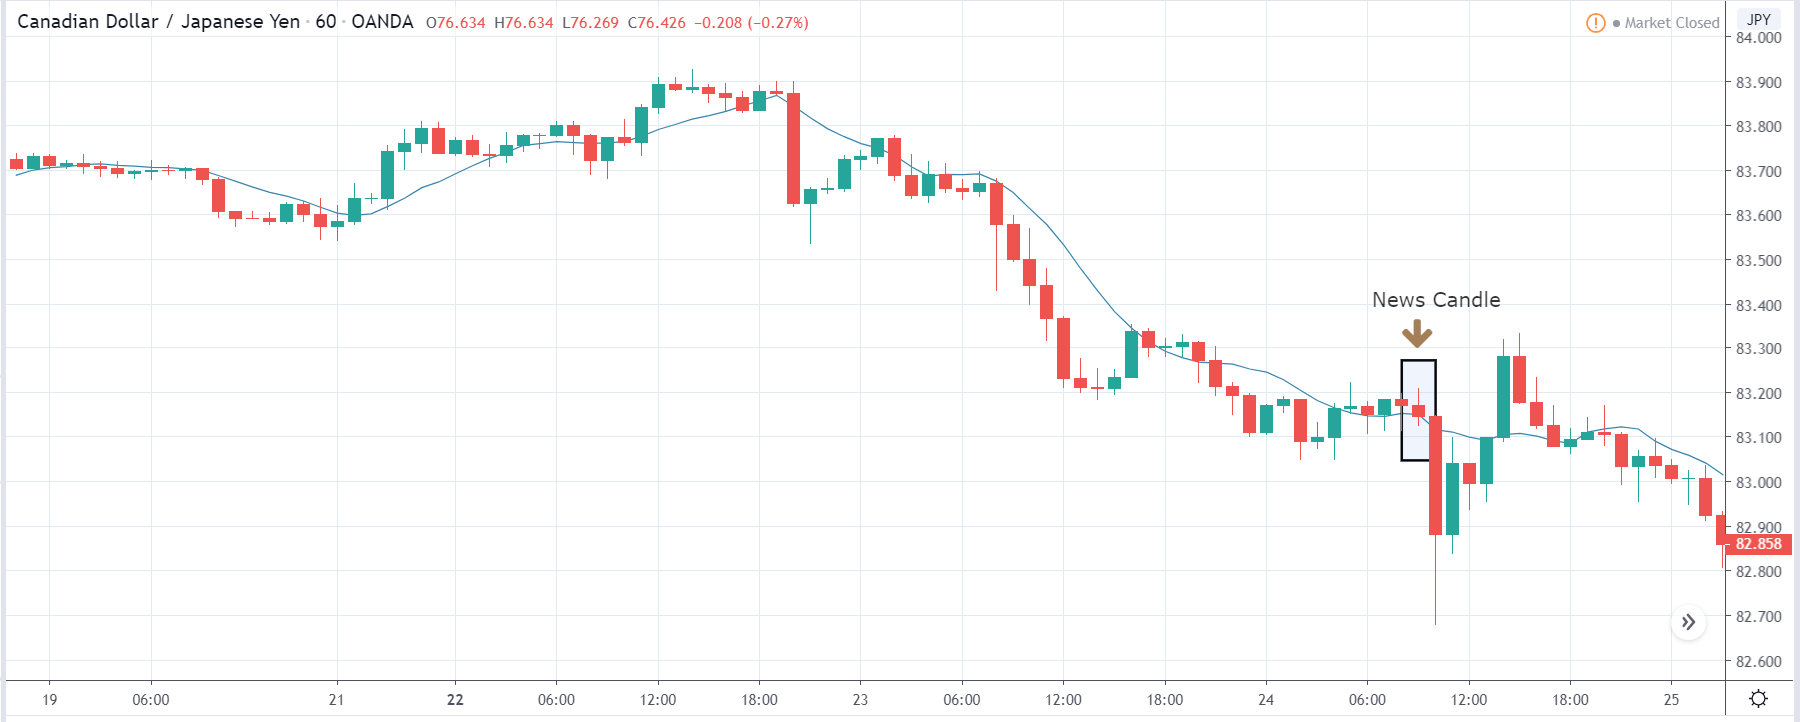
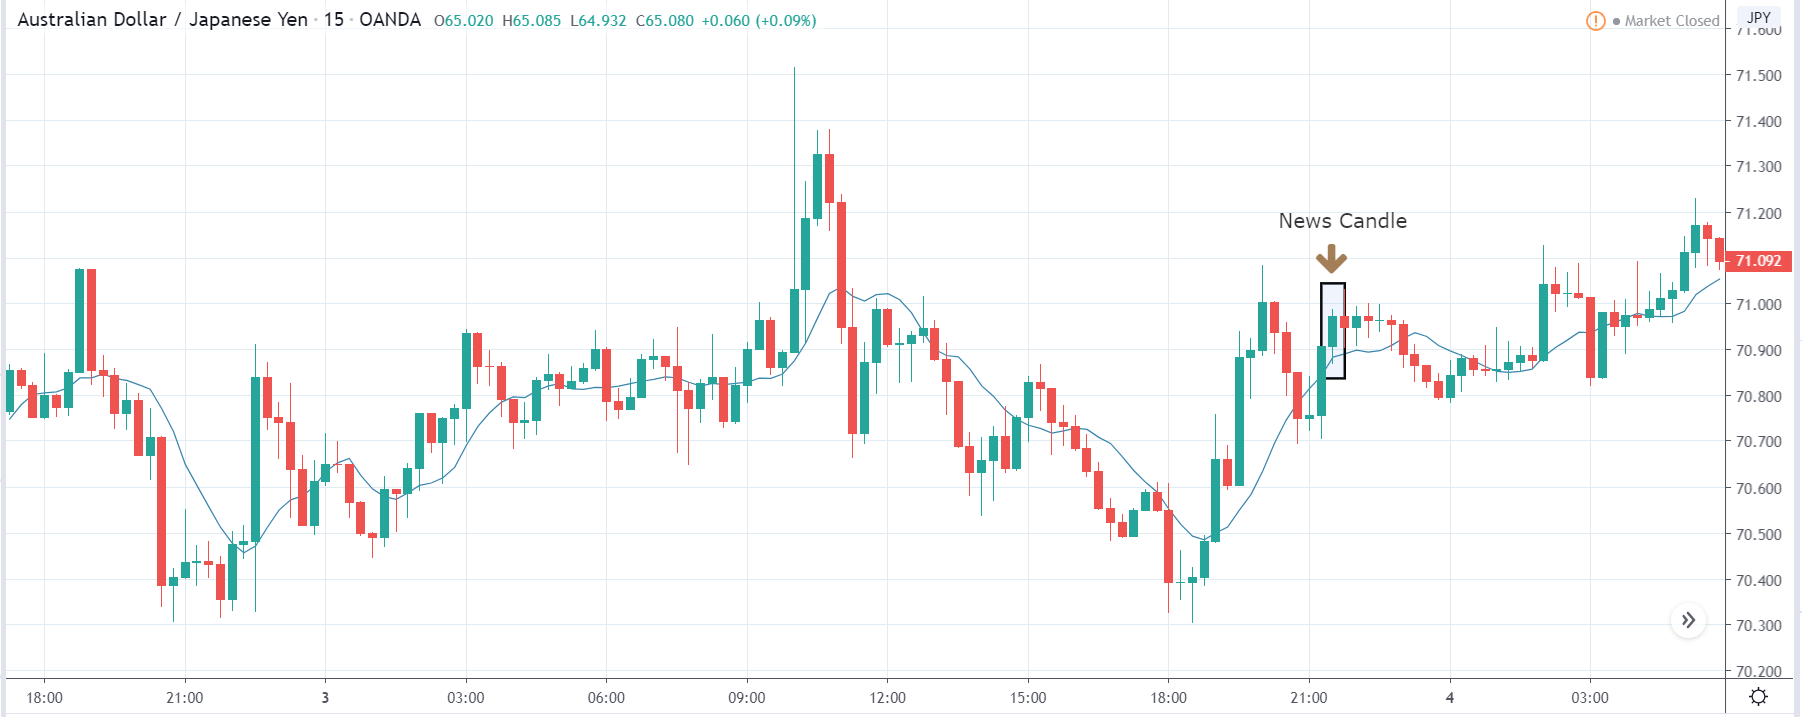
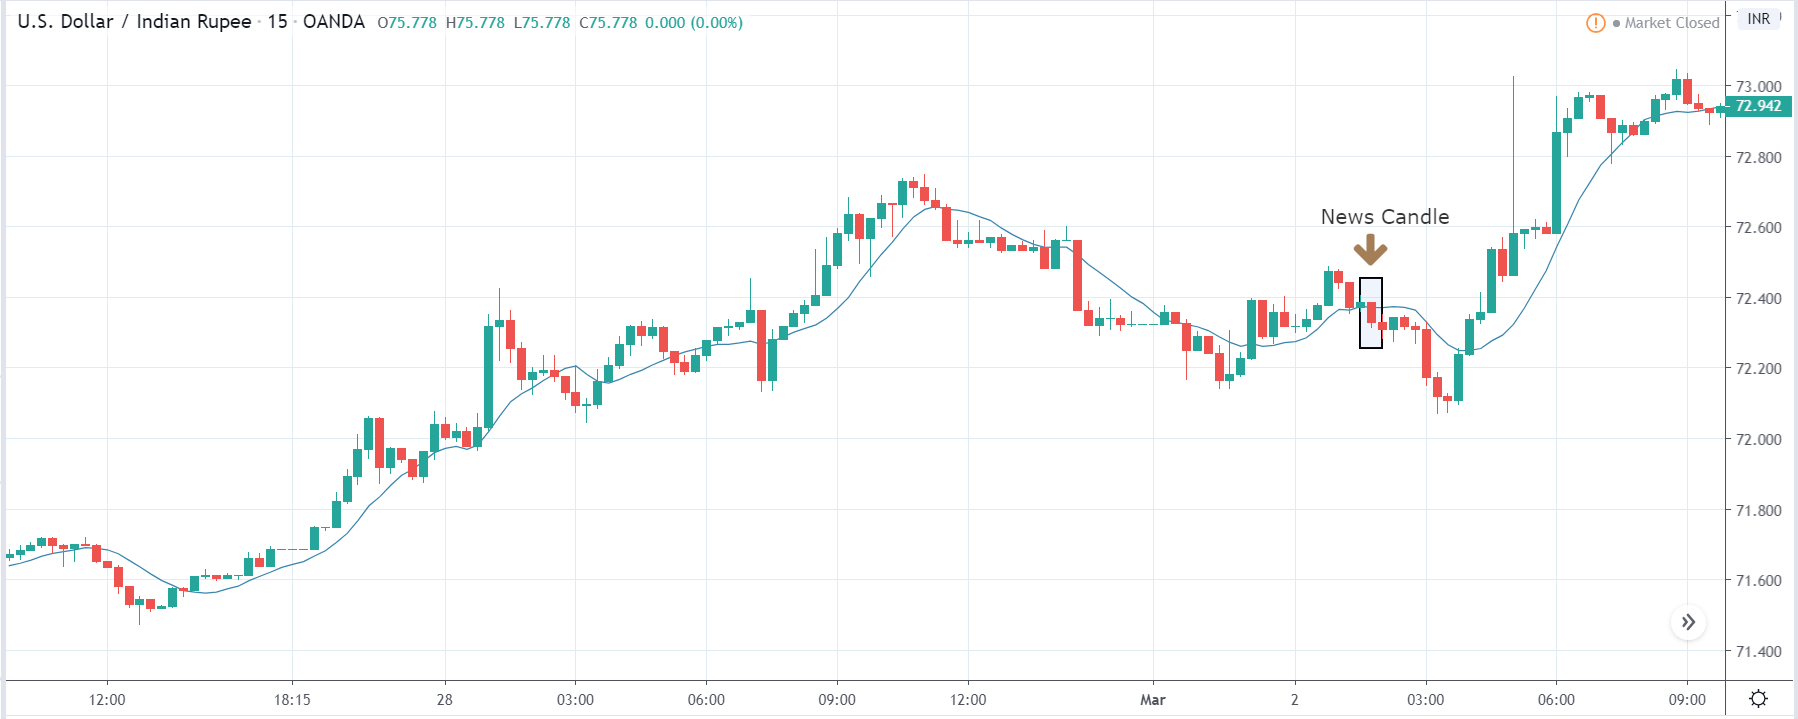
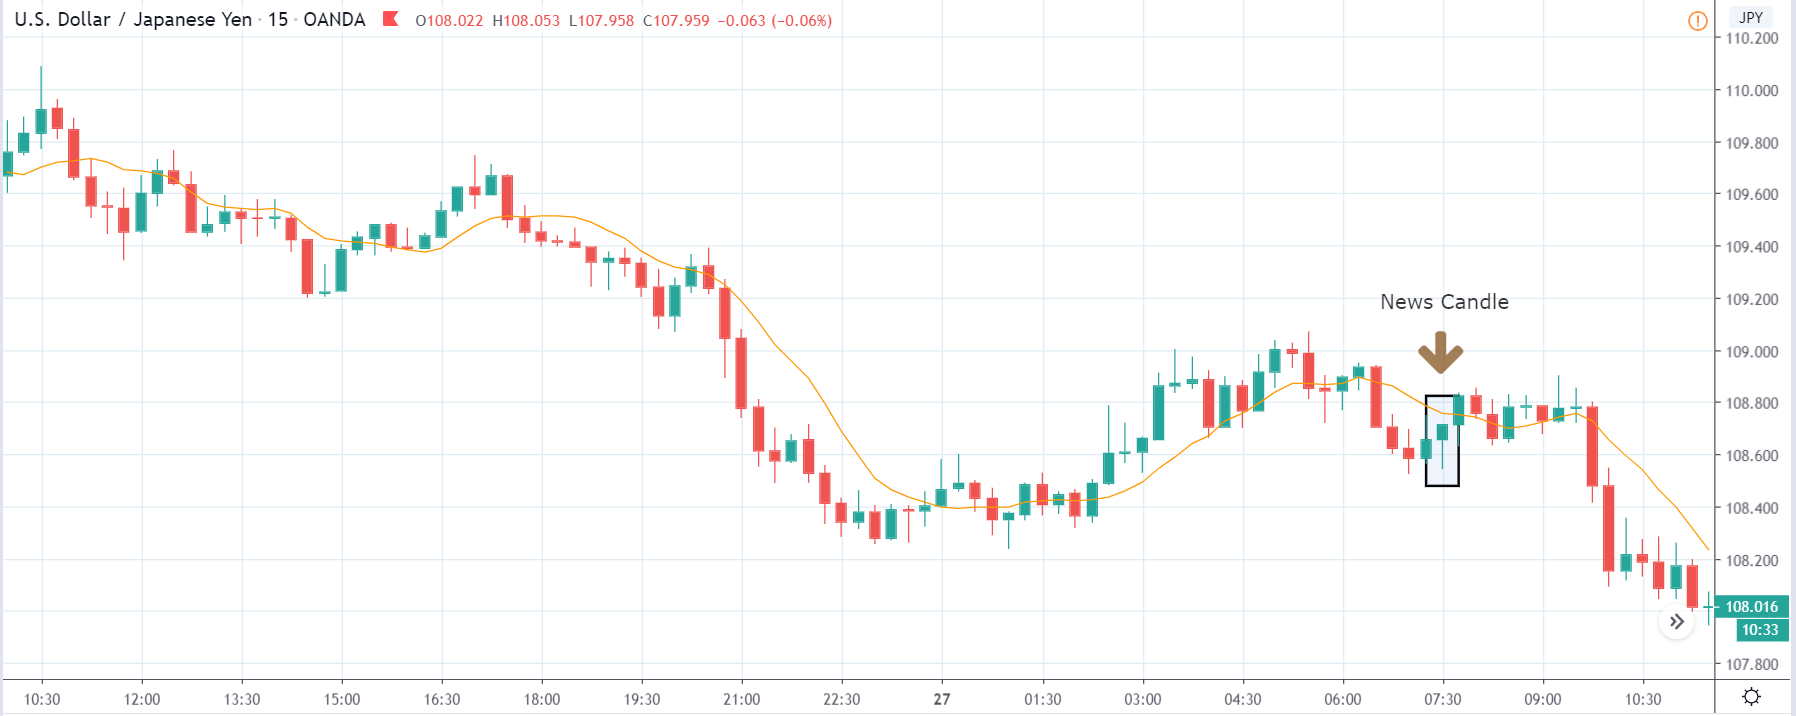
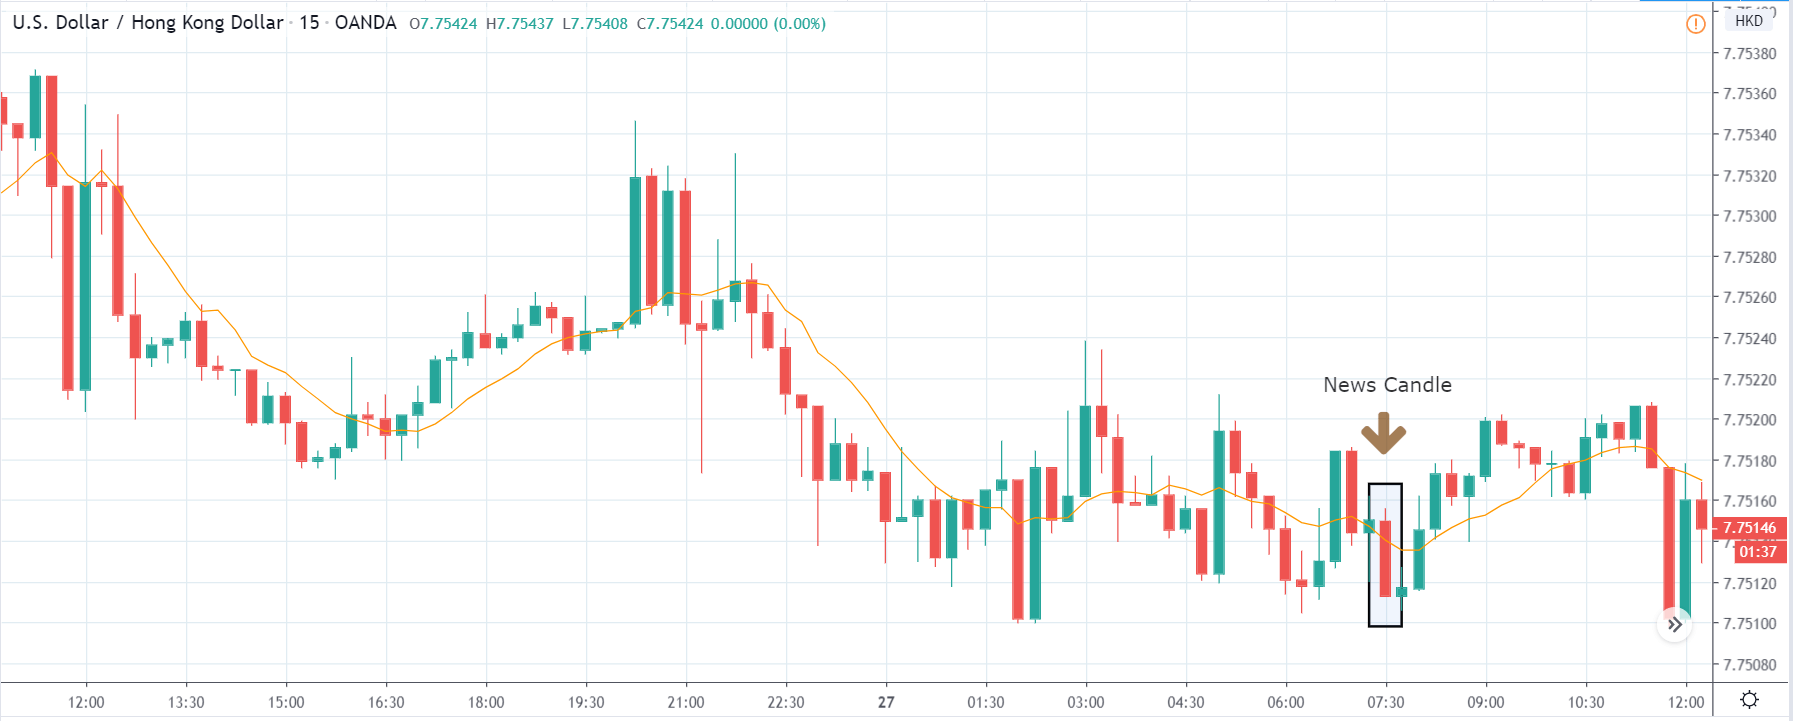
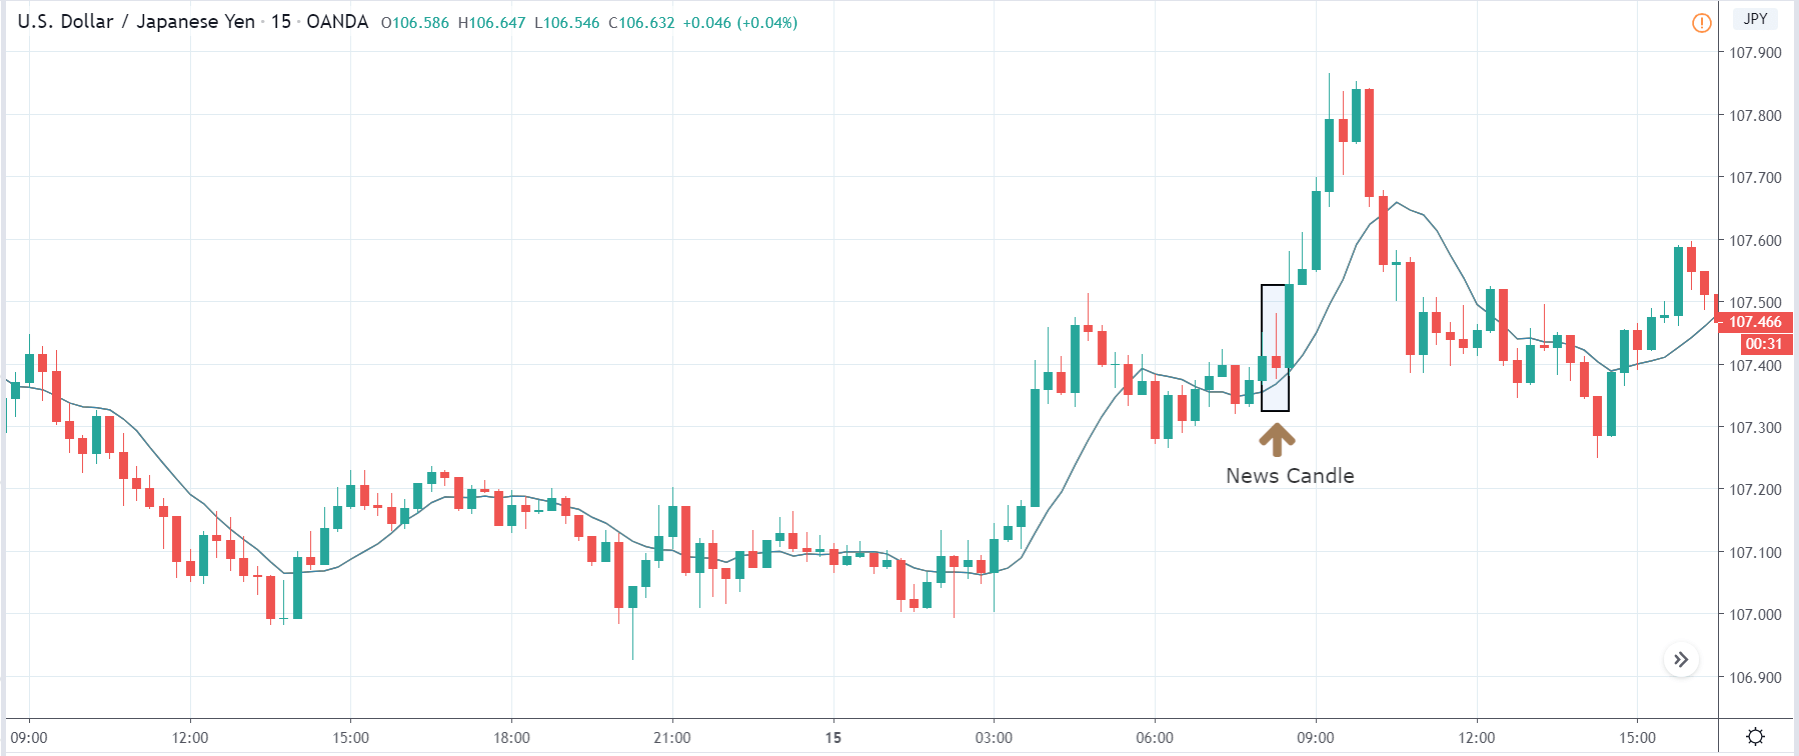
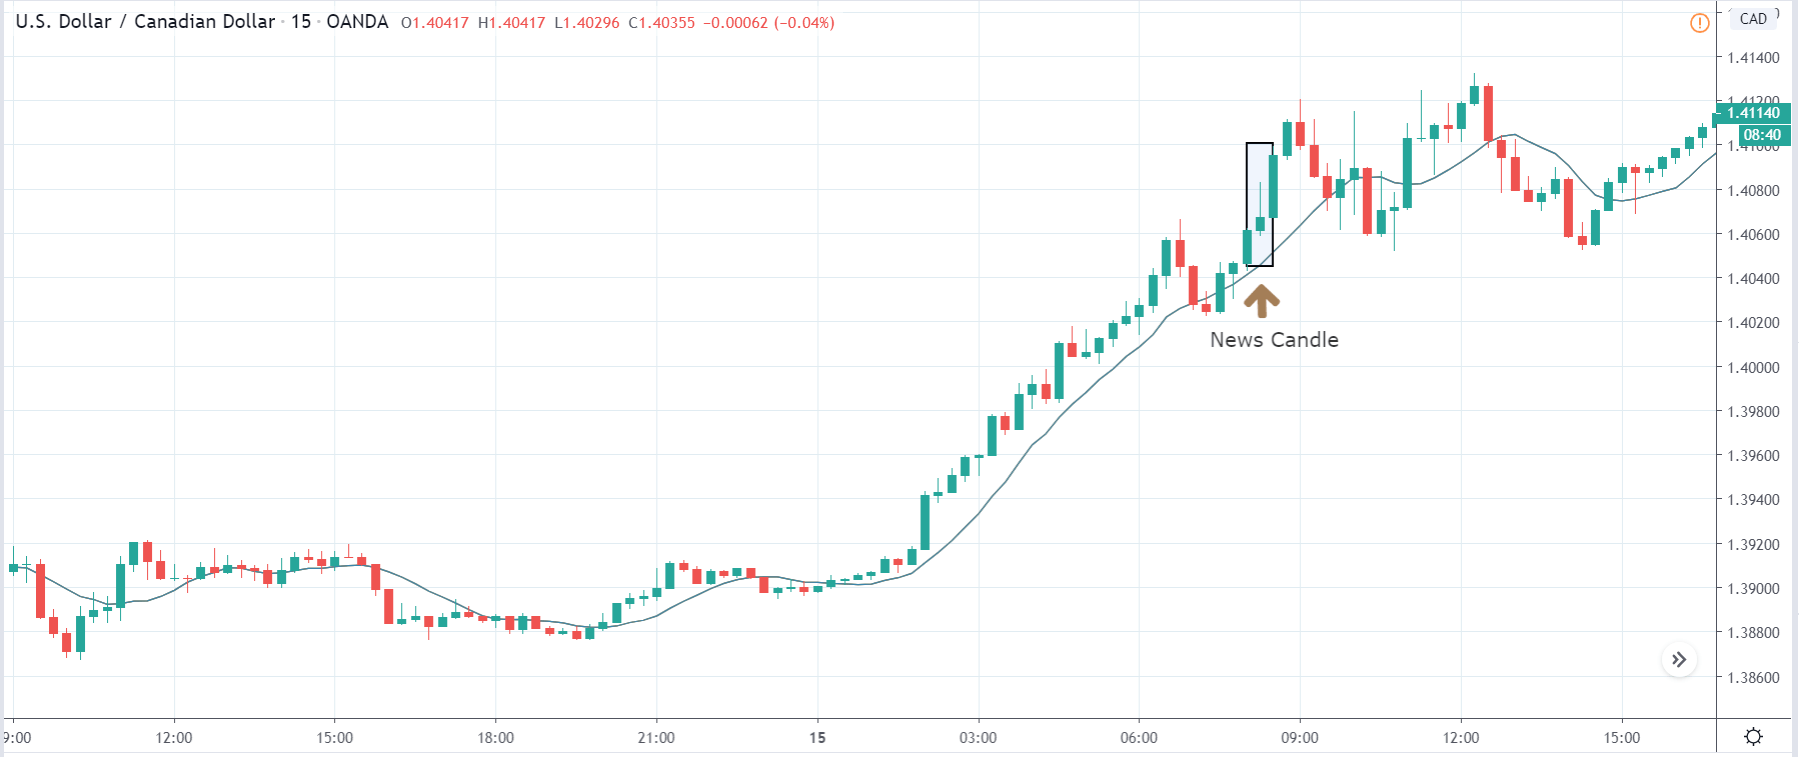
USD/JPY | After the announcement:
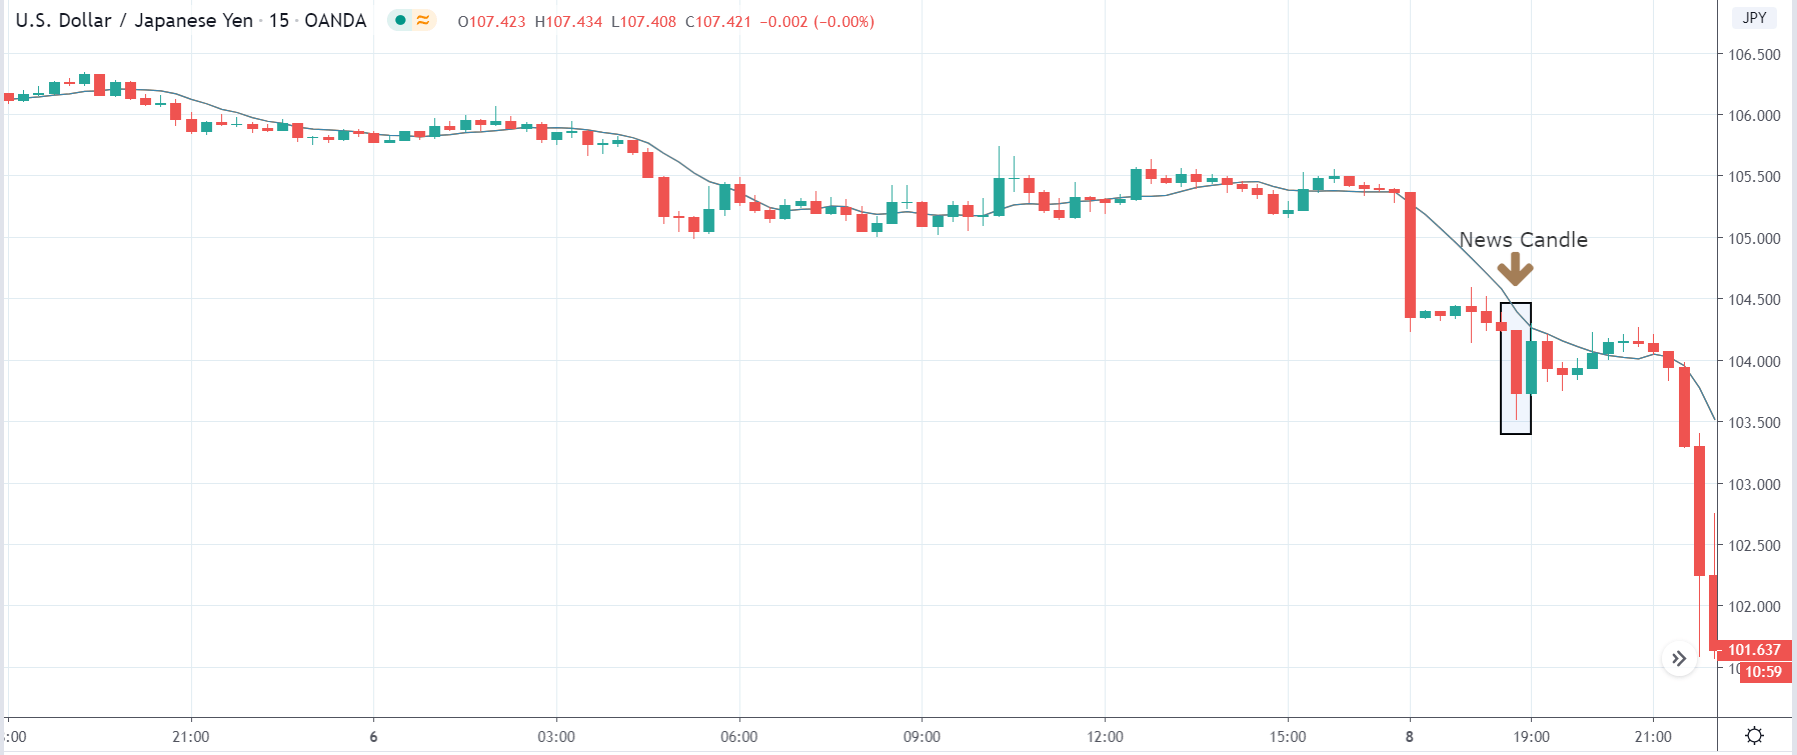
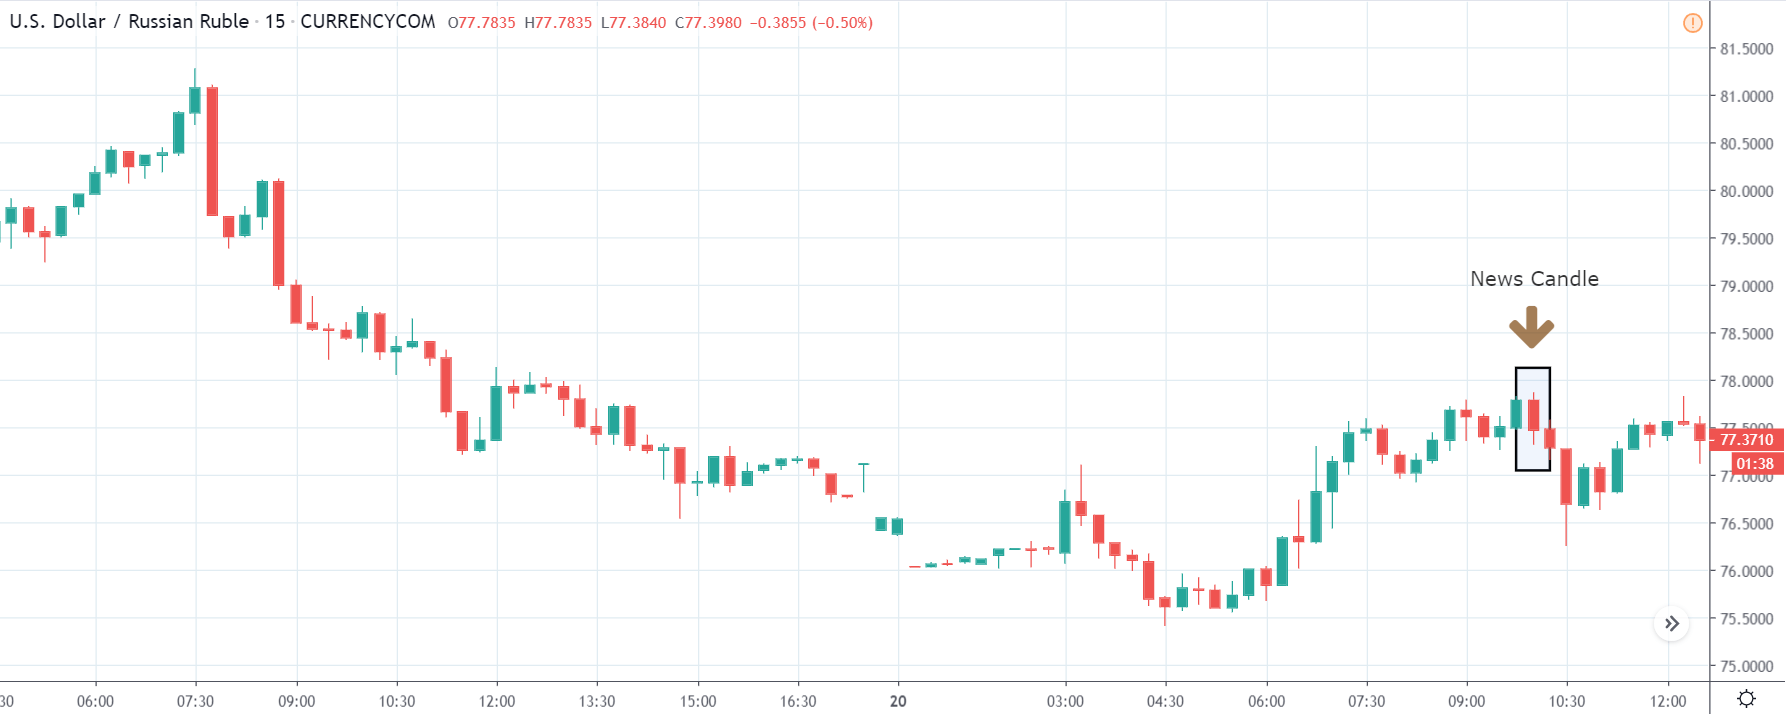
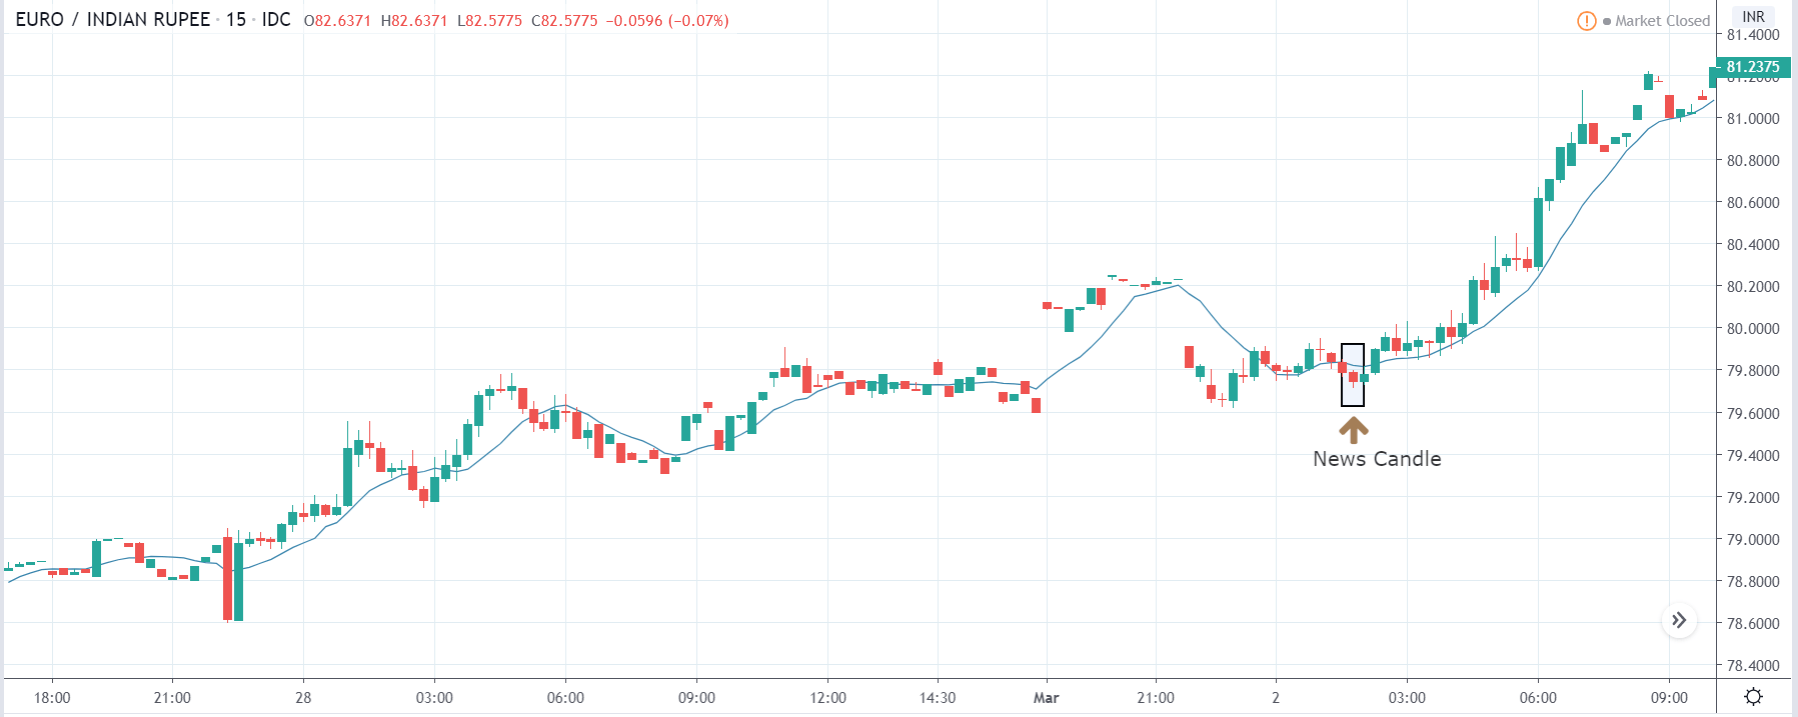
After the news announcement, we see that the price moves lower, resulting in further strengthening of the Japanese Yen. As the GDP data was very close to market expectations, traders comprehended this data to be positive for the economy and bought Japanese yen by selling the currency pair. In terms of positioning ourselves in the market, once should not go ‘short’ in the market soon after the news release as this would mean chasing the market, which is very risky.
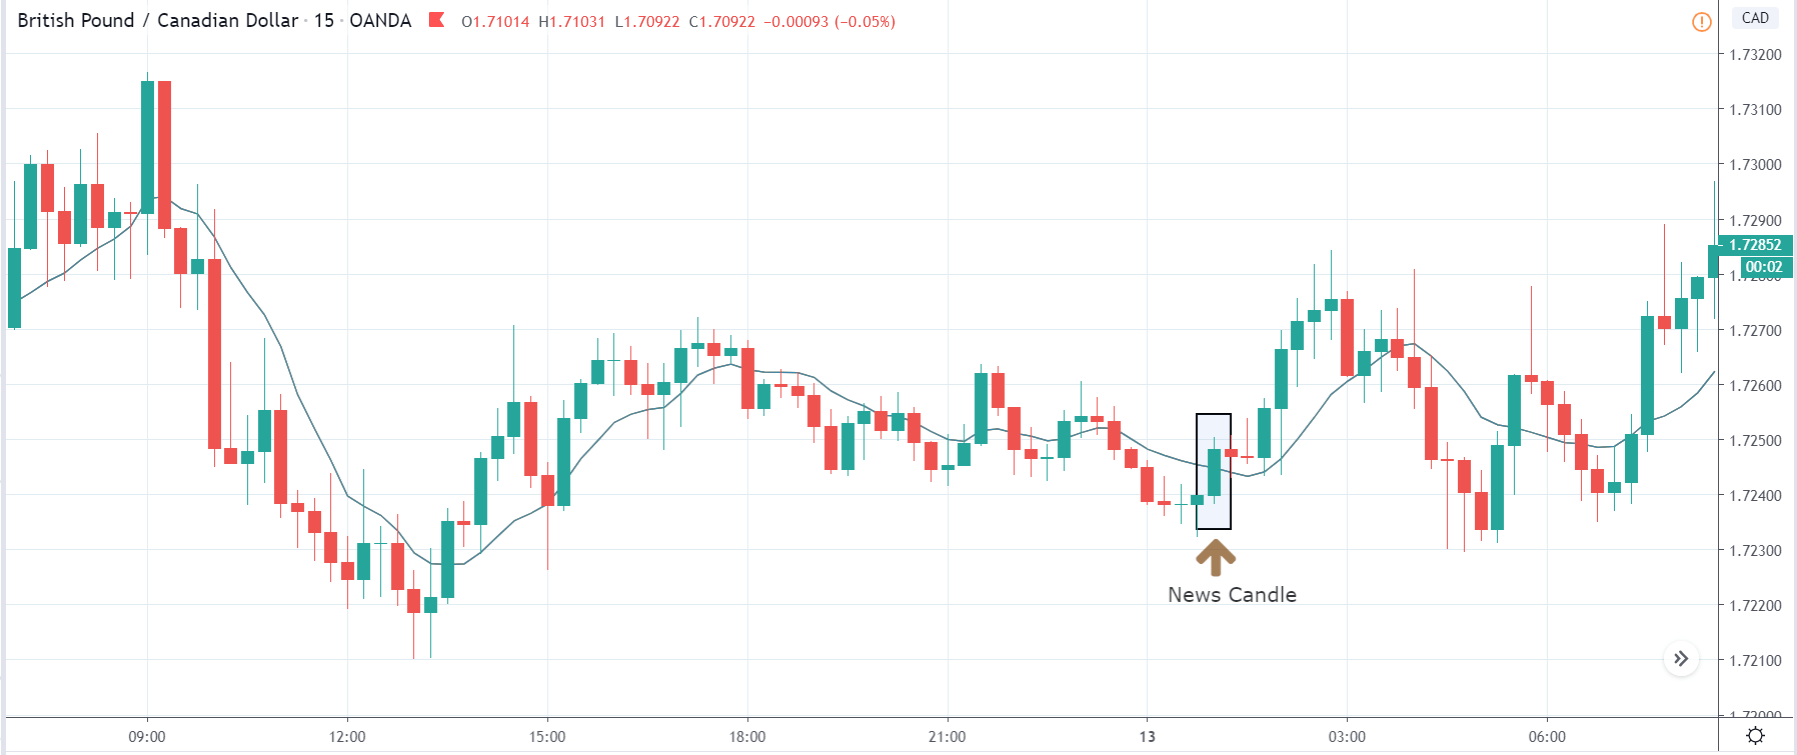
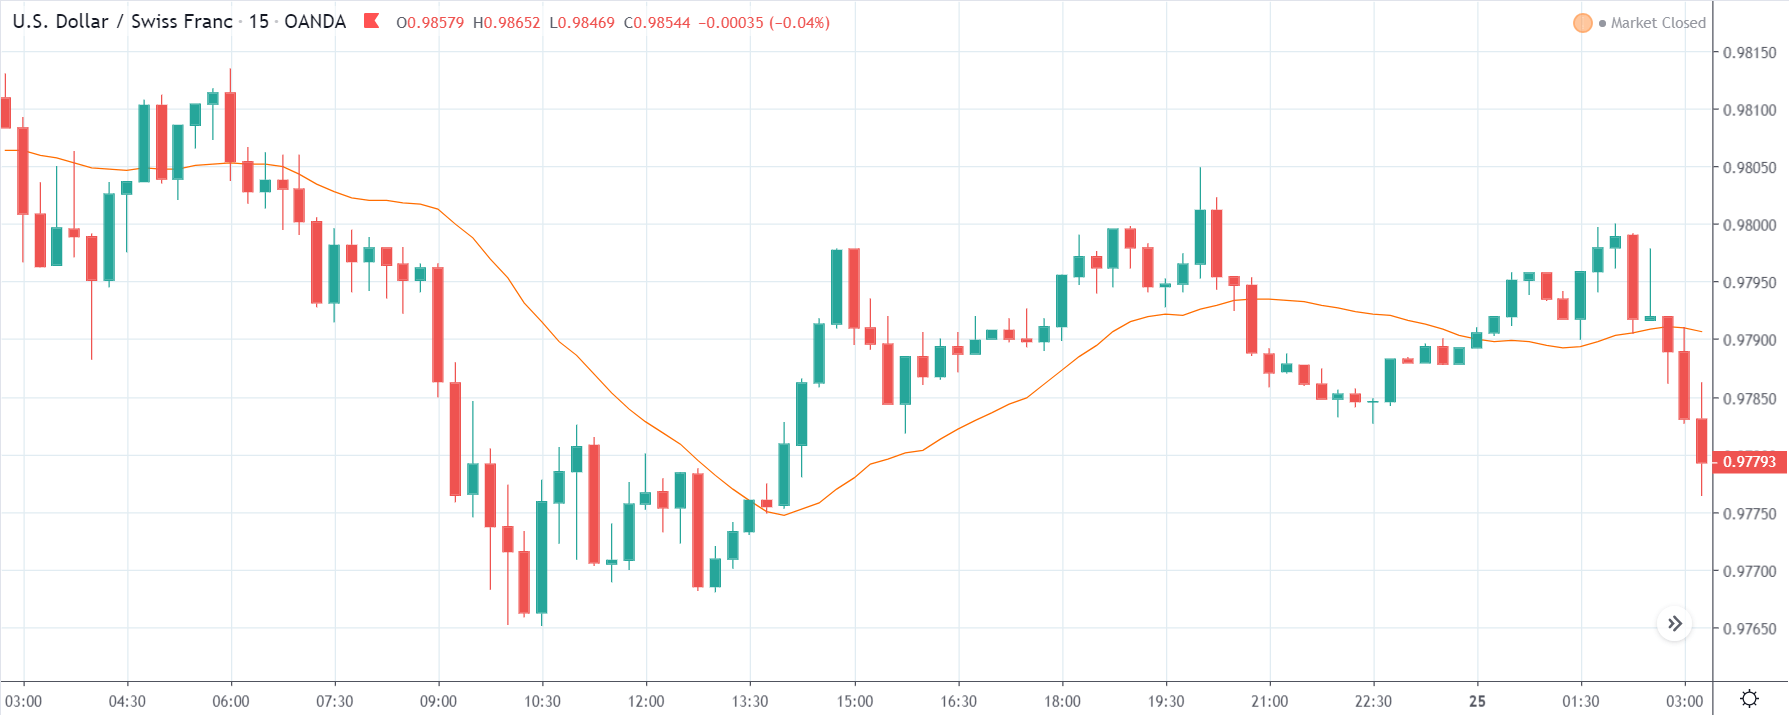
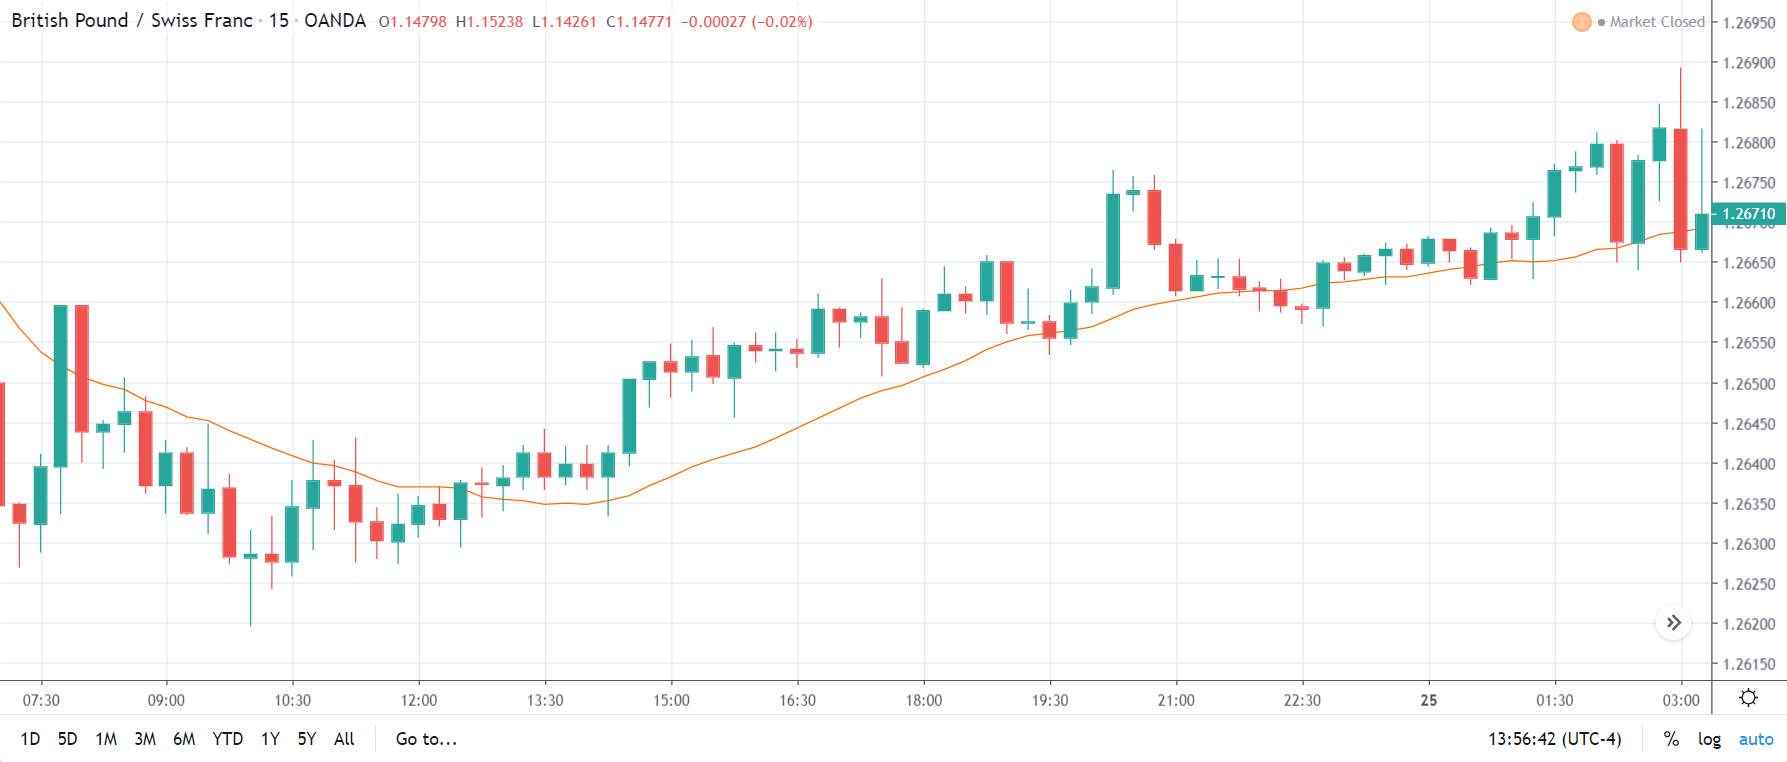
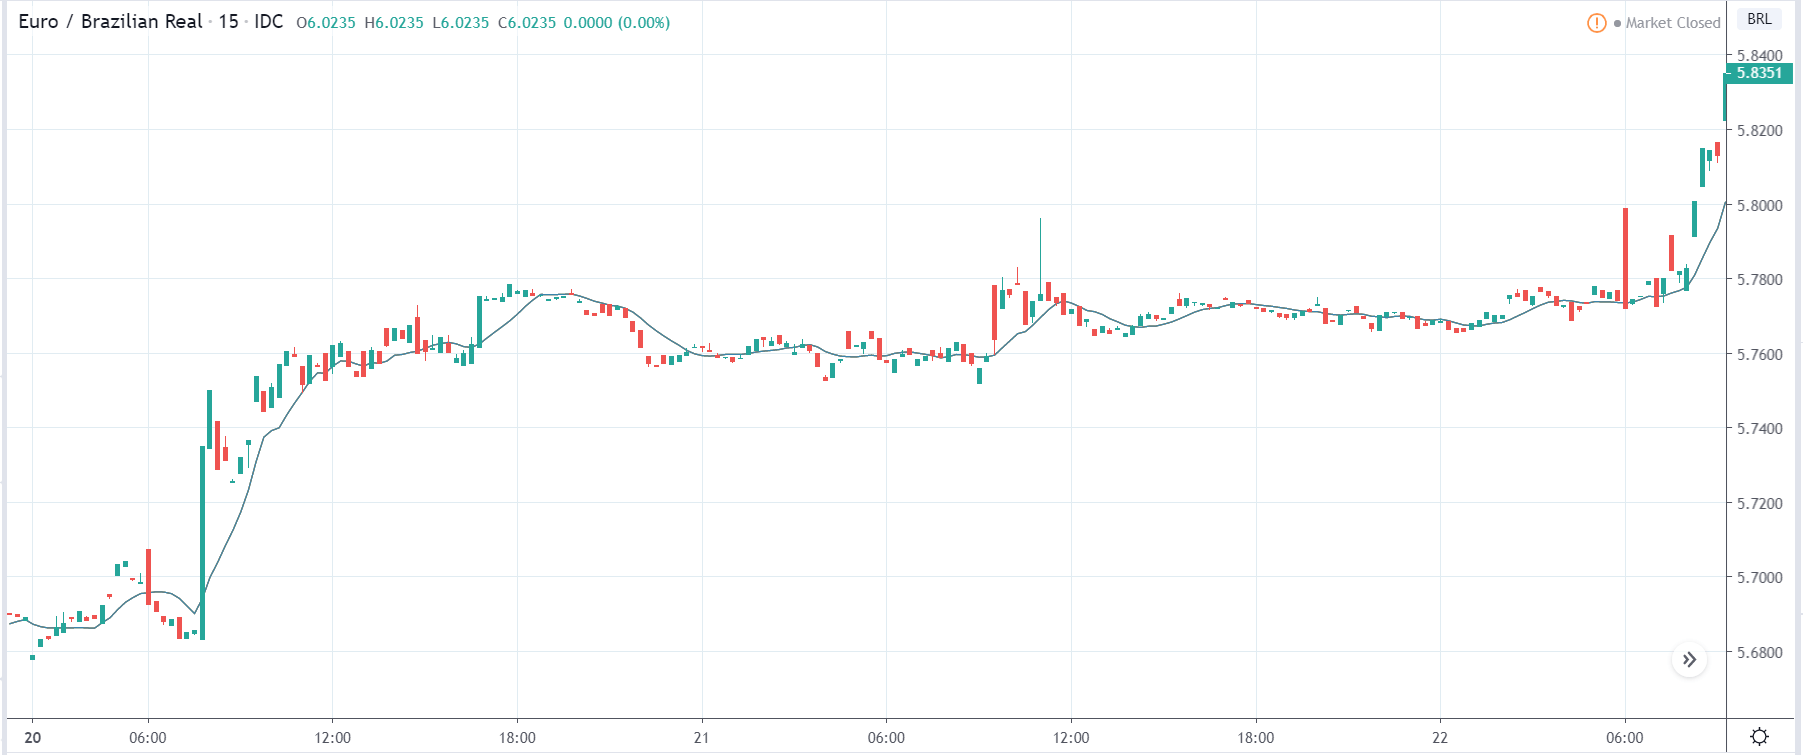
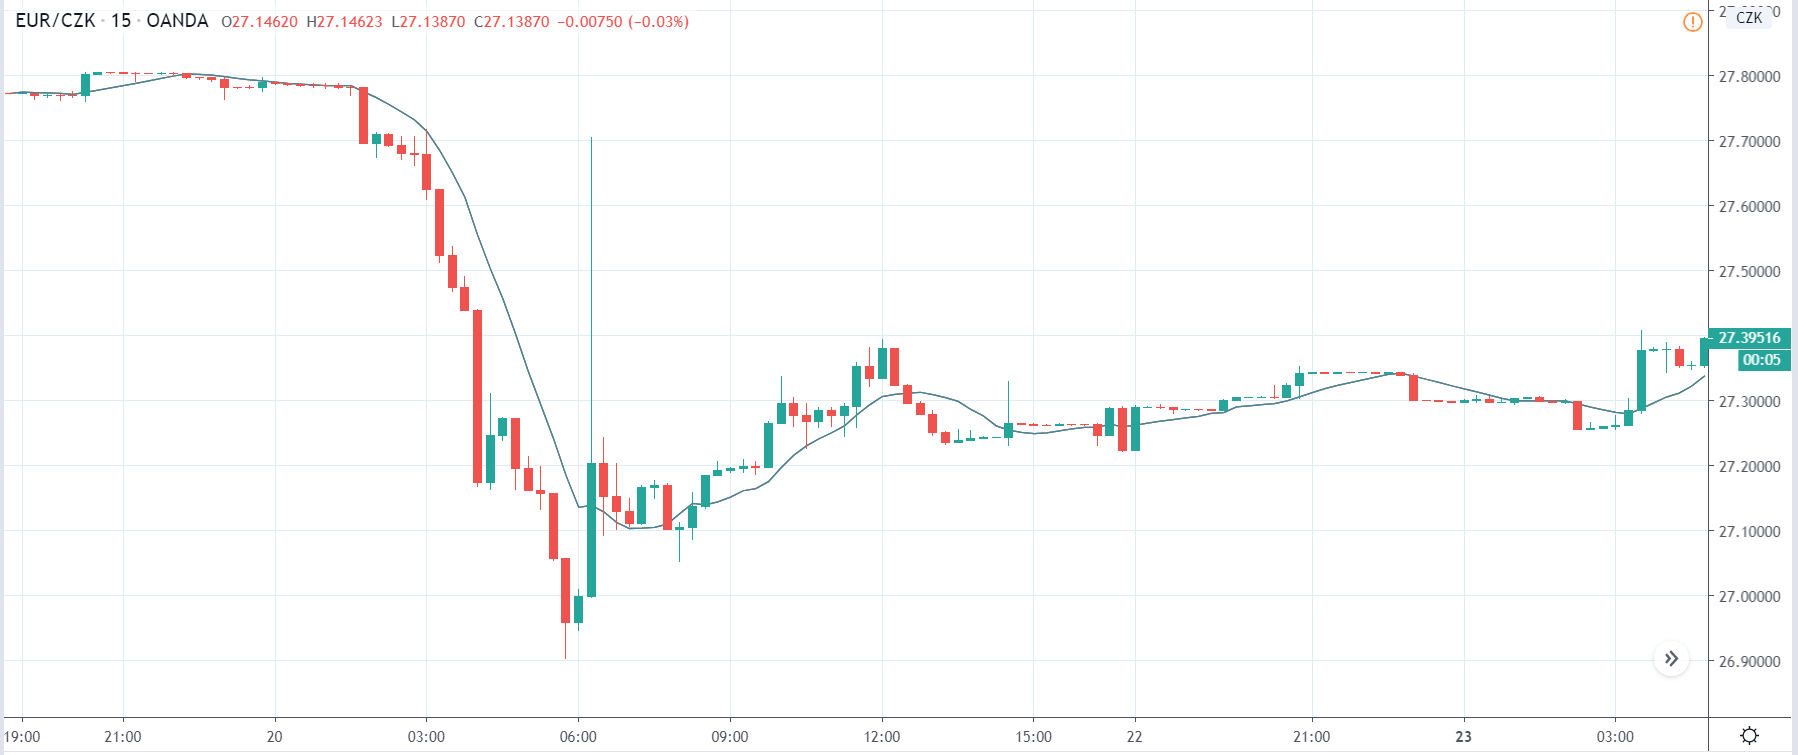
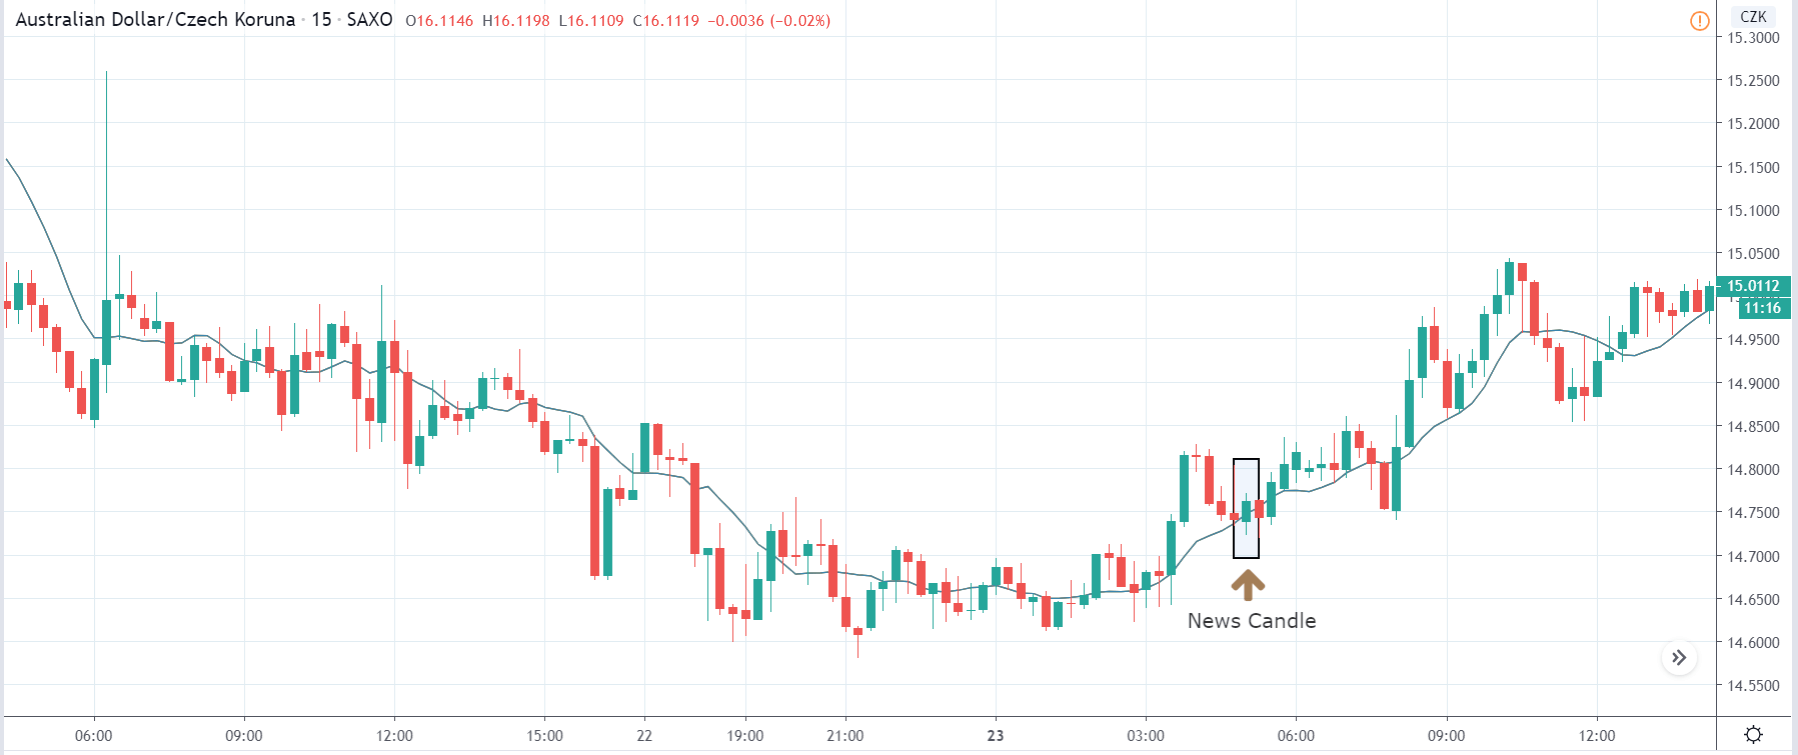
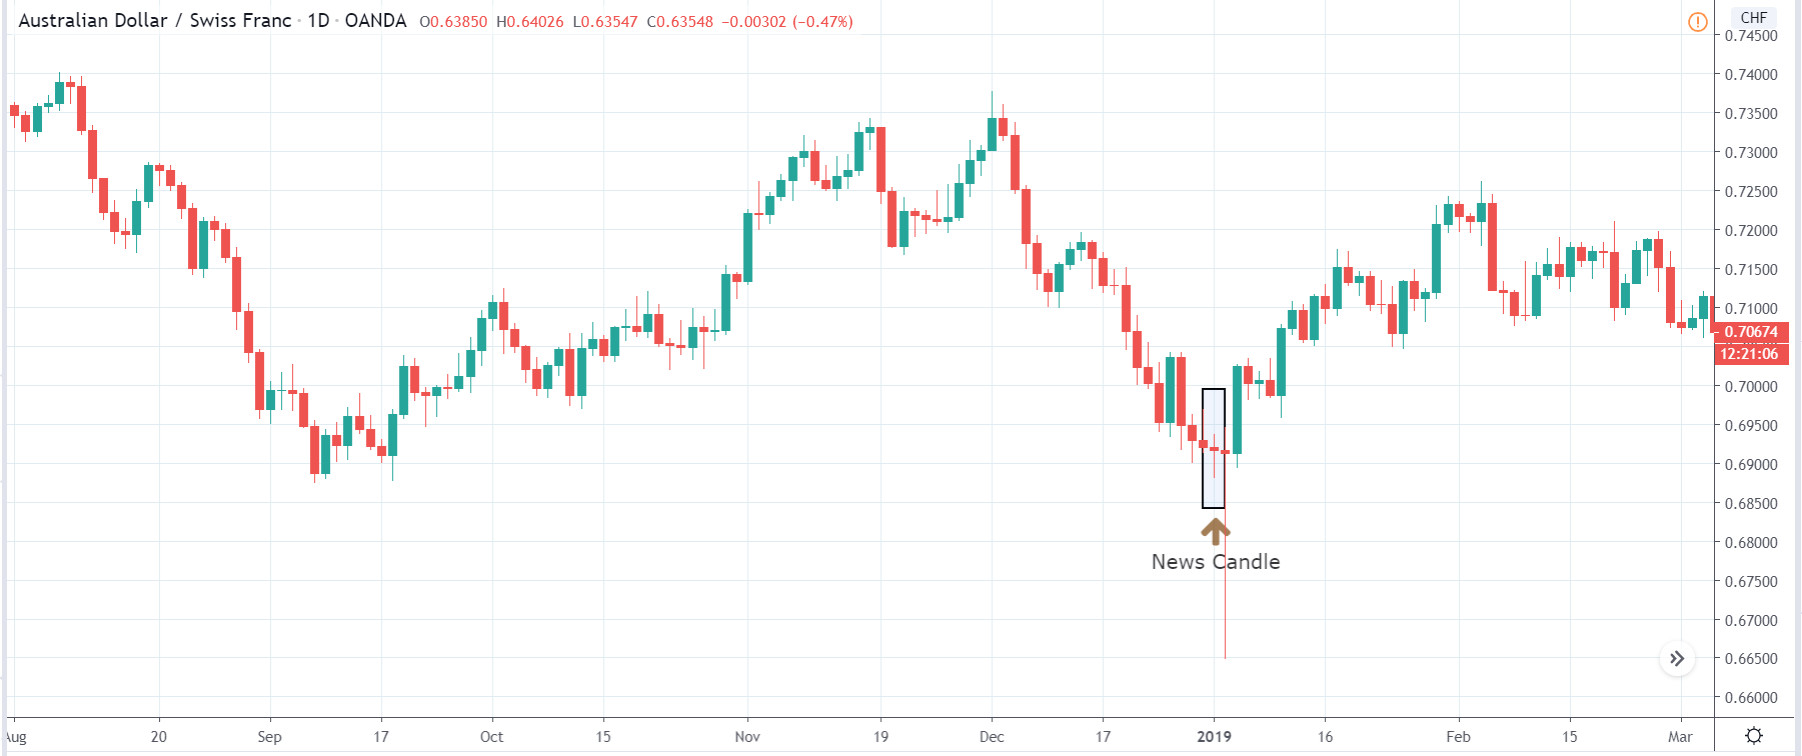
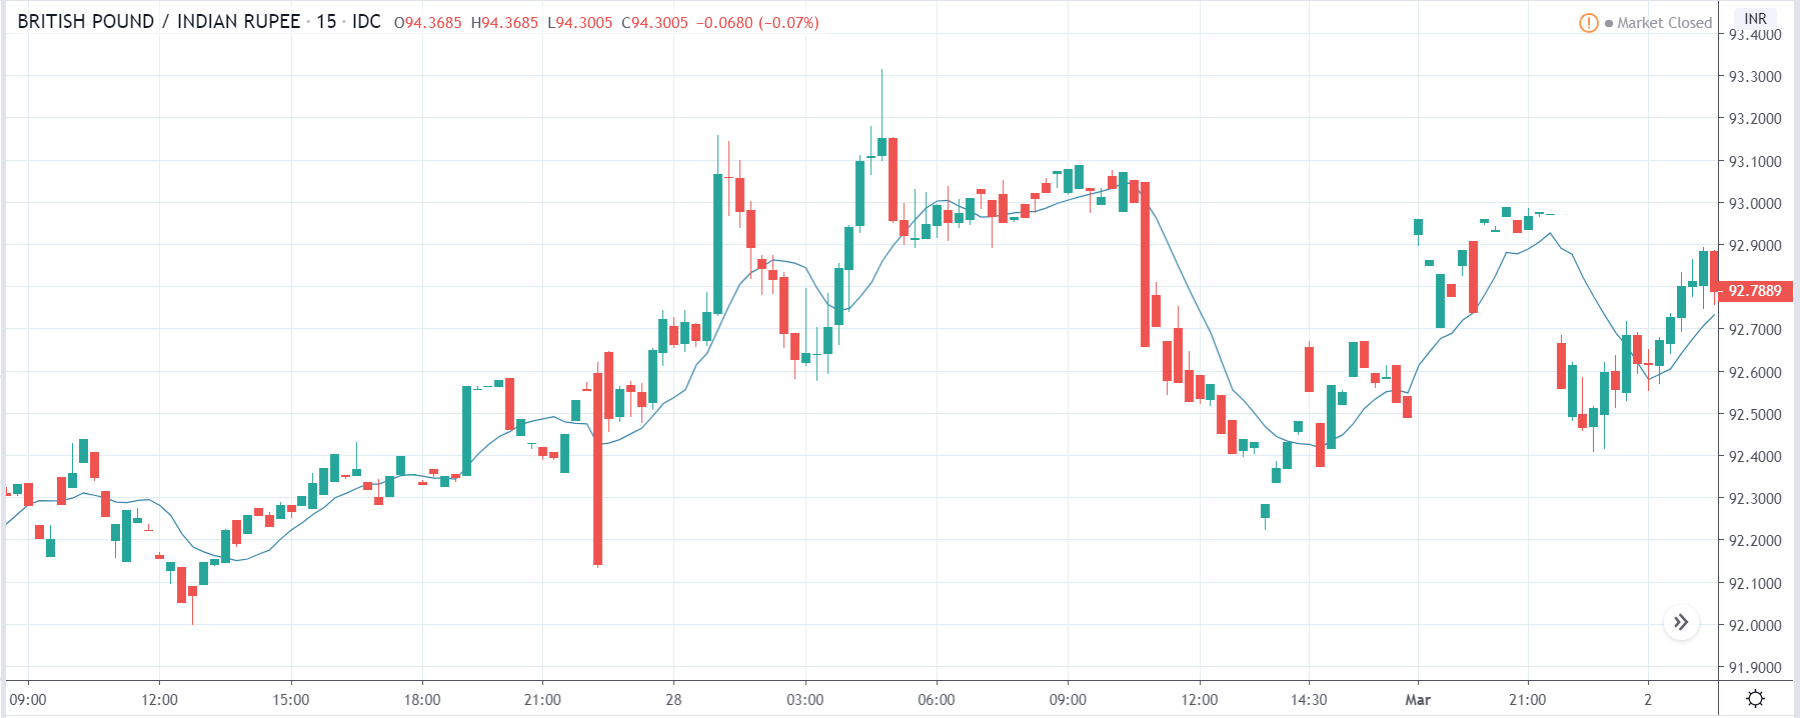
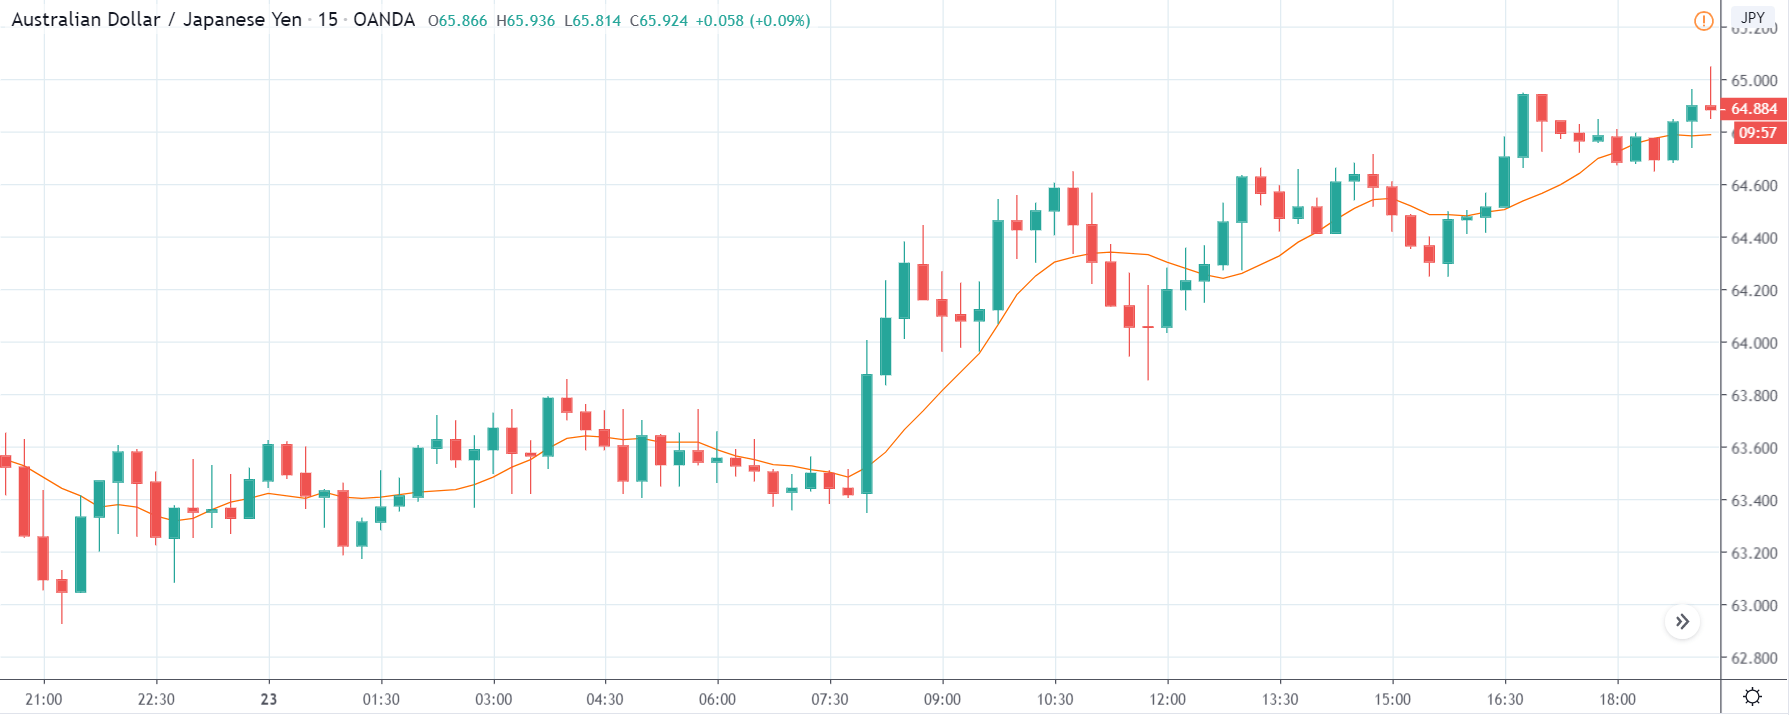
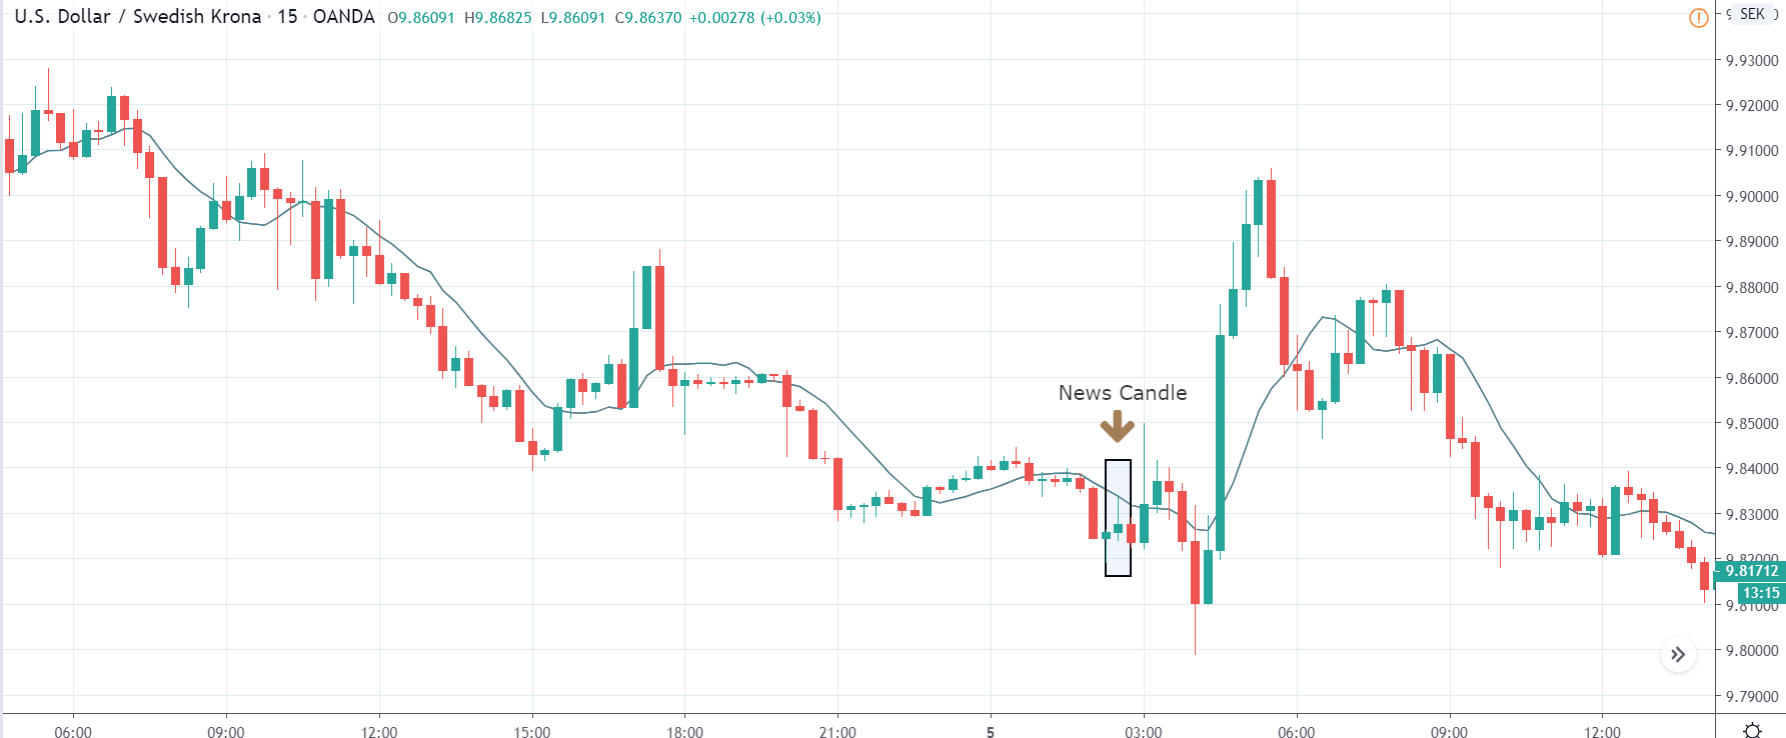
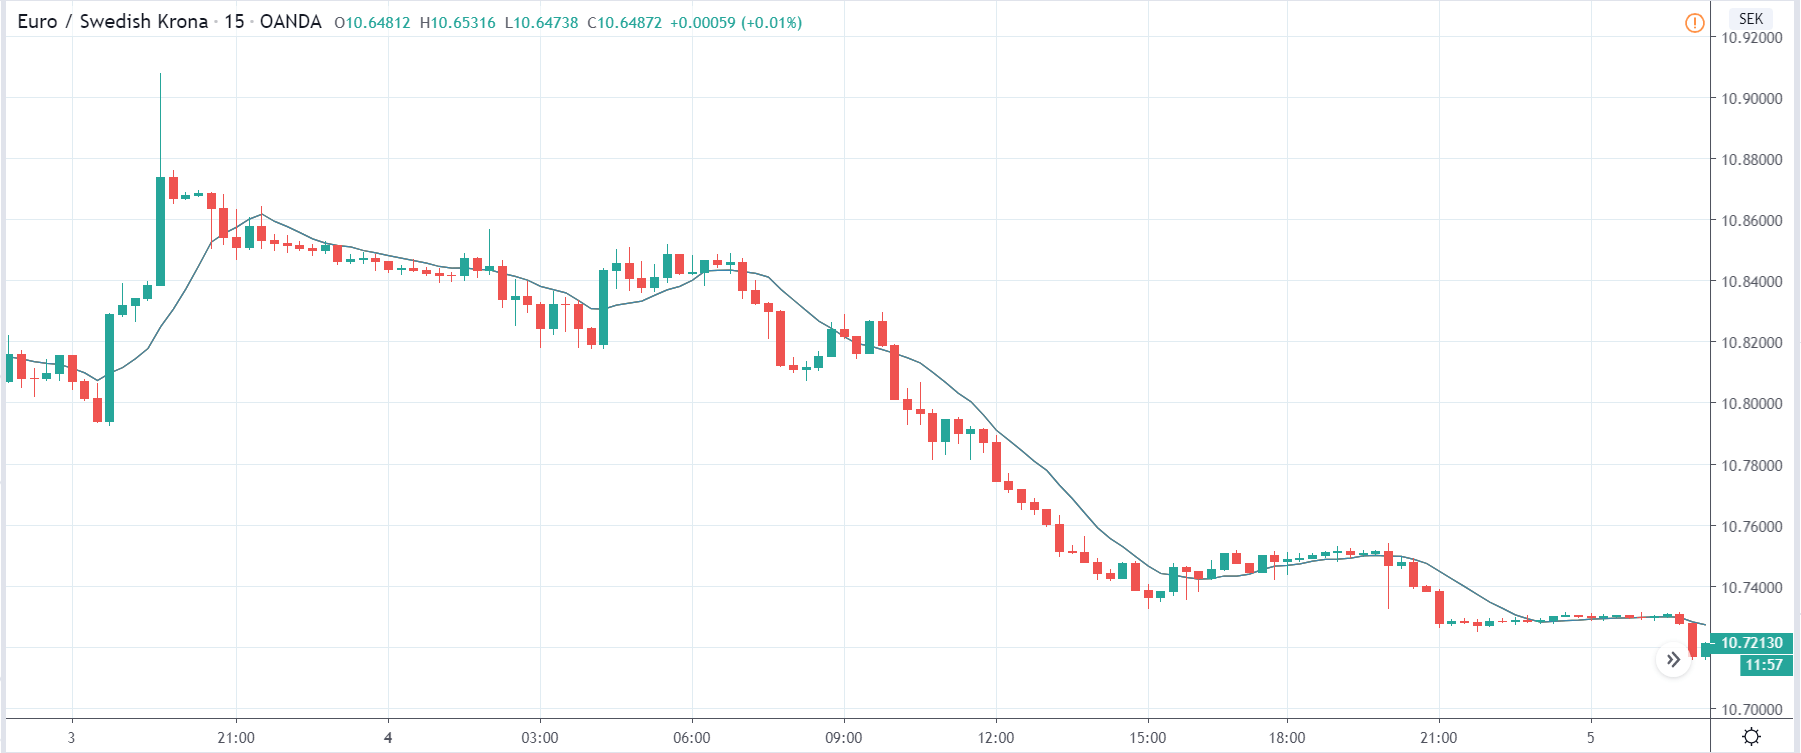
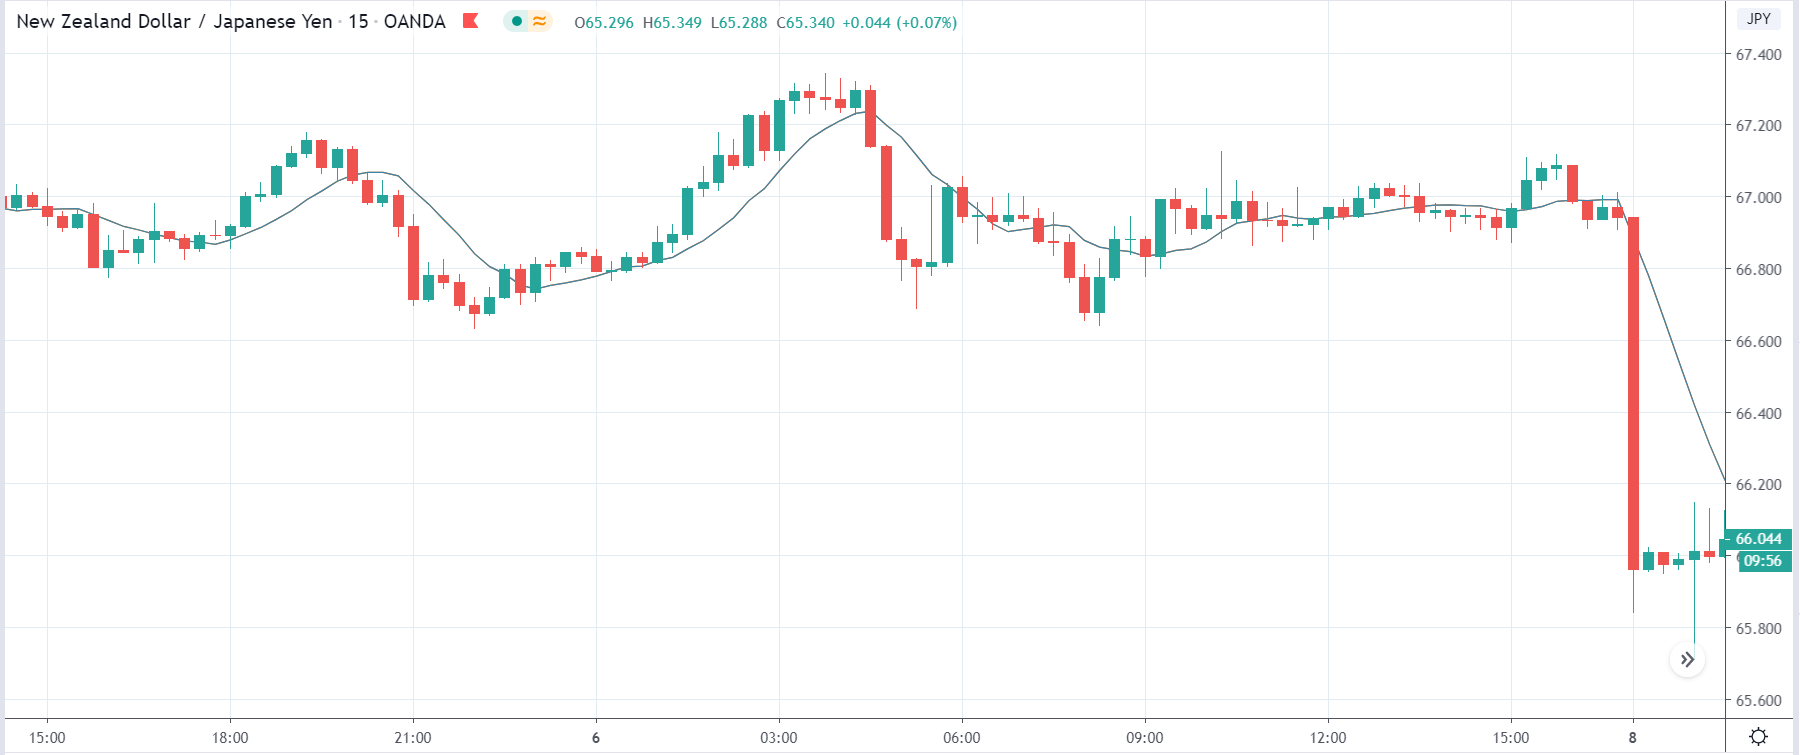
NZD/JPY | Before the announcement:
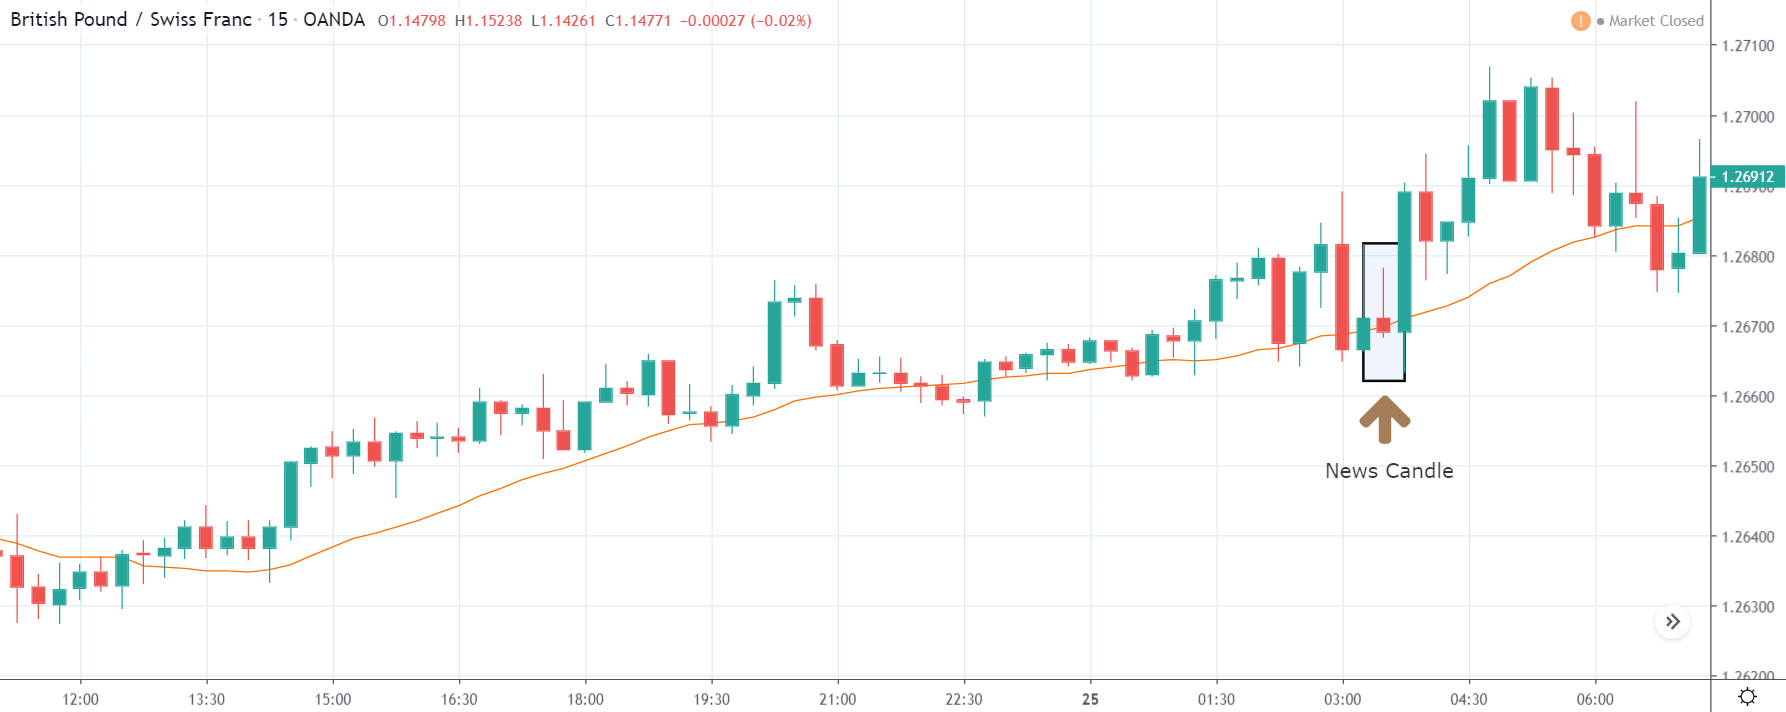
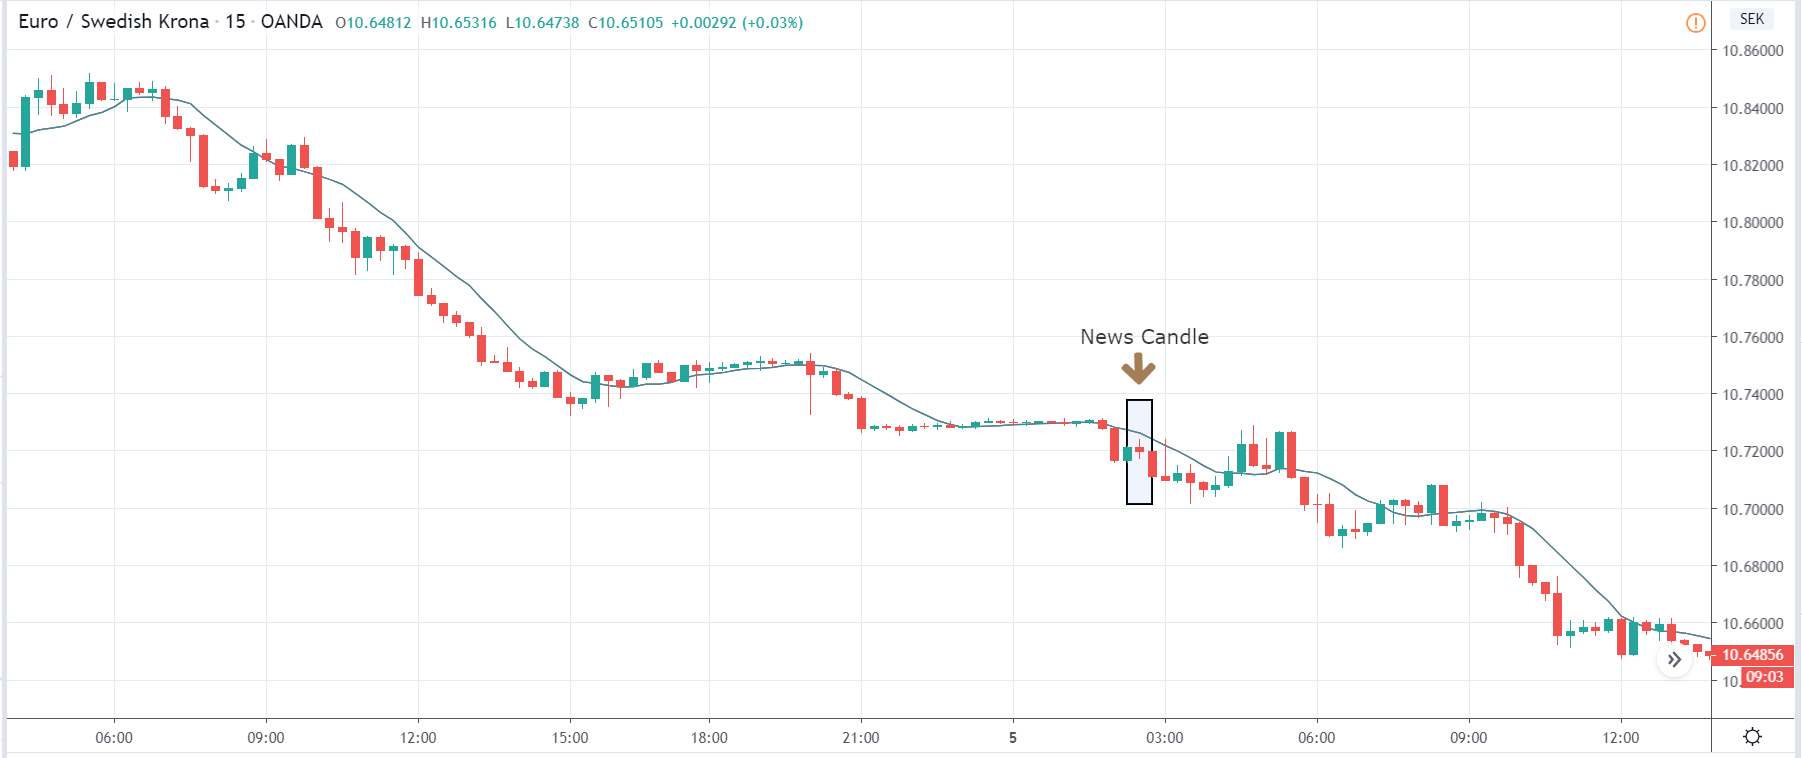
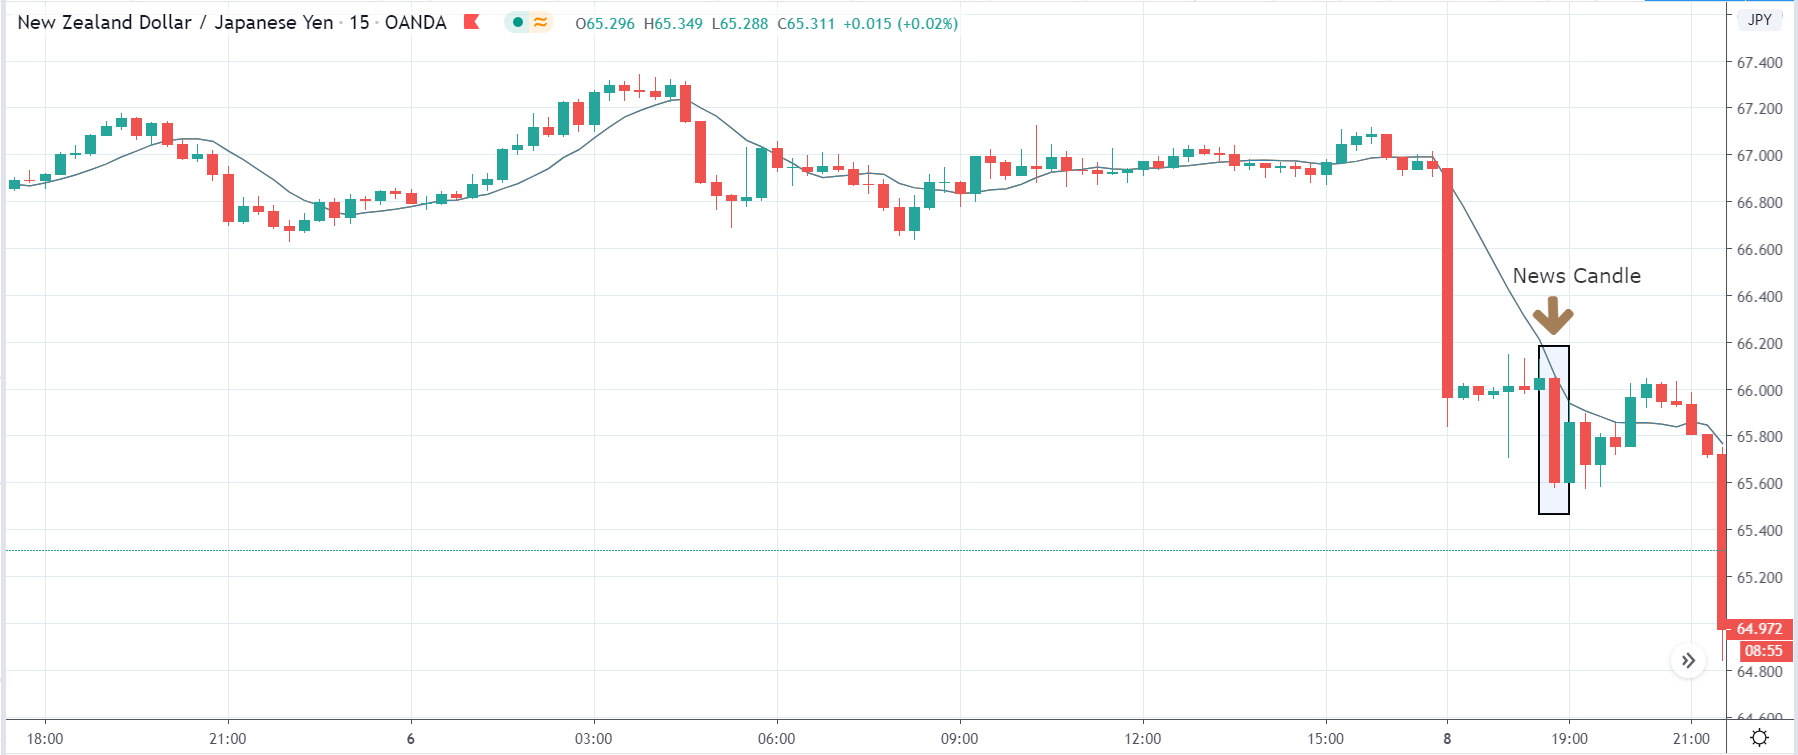
NZD/JPY | After the announcement:
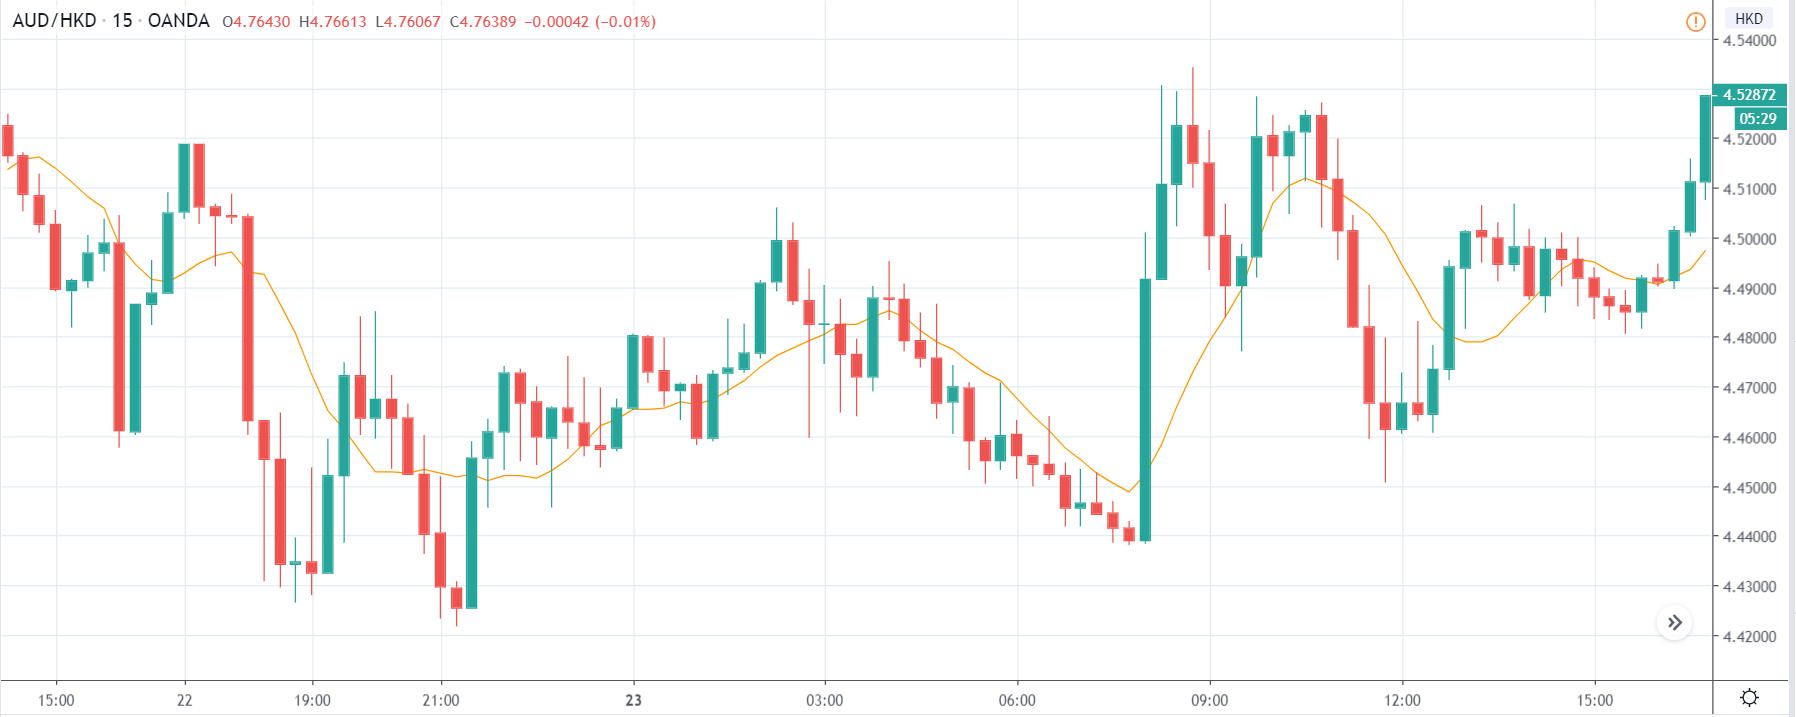
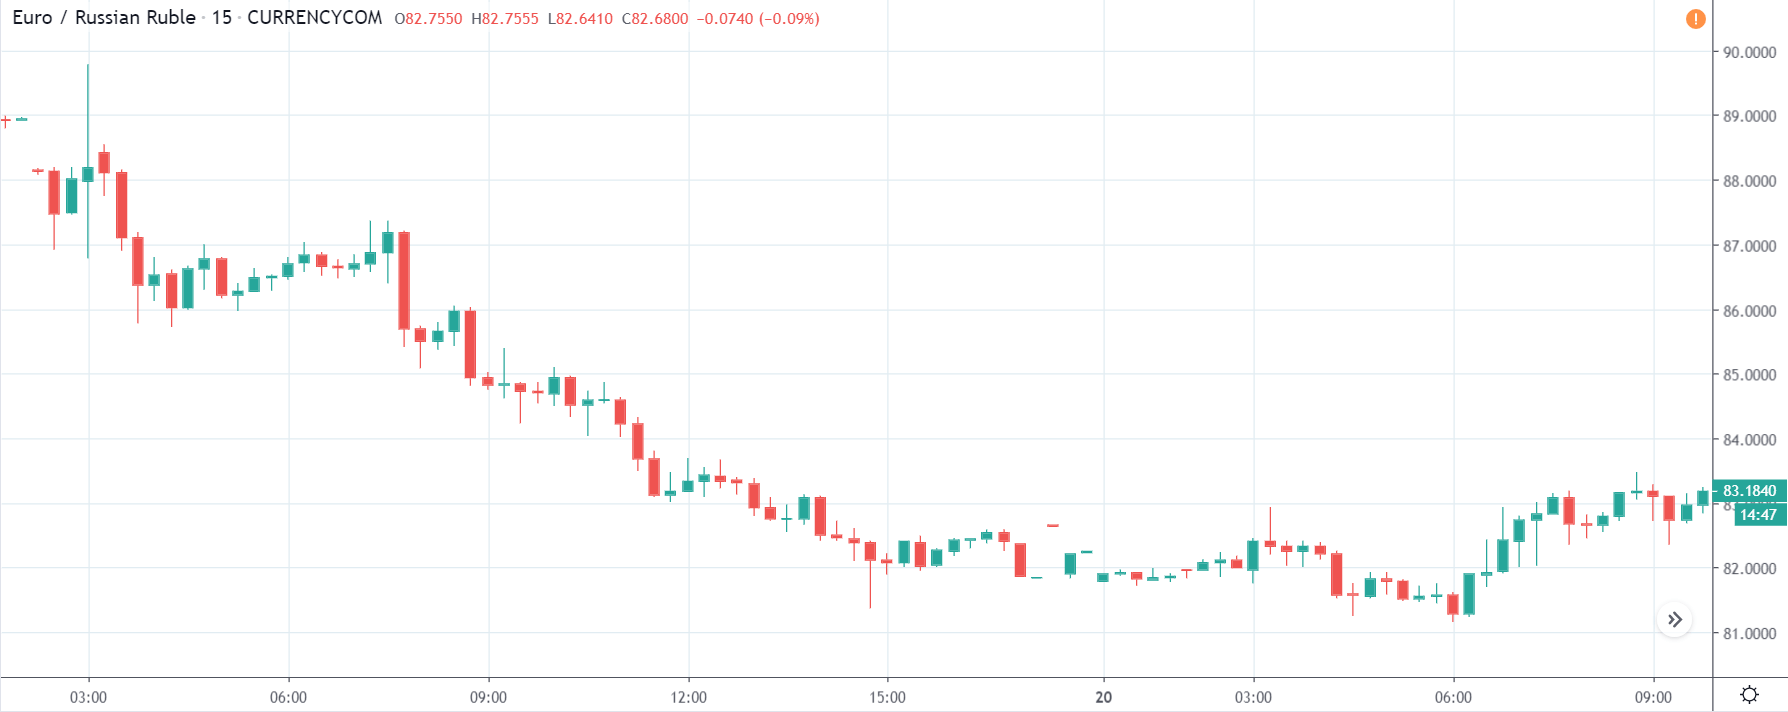
The above images represent the NZD/JPY currency pair, where we see that the market has crashed recently, and the price is at the same level since then. This means there is extreme optimism in the market concerning the Japanese Yen. As the price is meager, we need a pullback before we can take a ‘short’ trade in the currency pair. Until then, we will watch the impact of GDP on the currency.
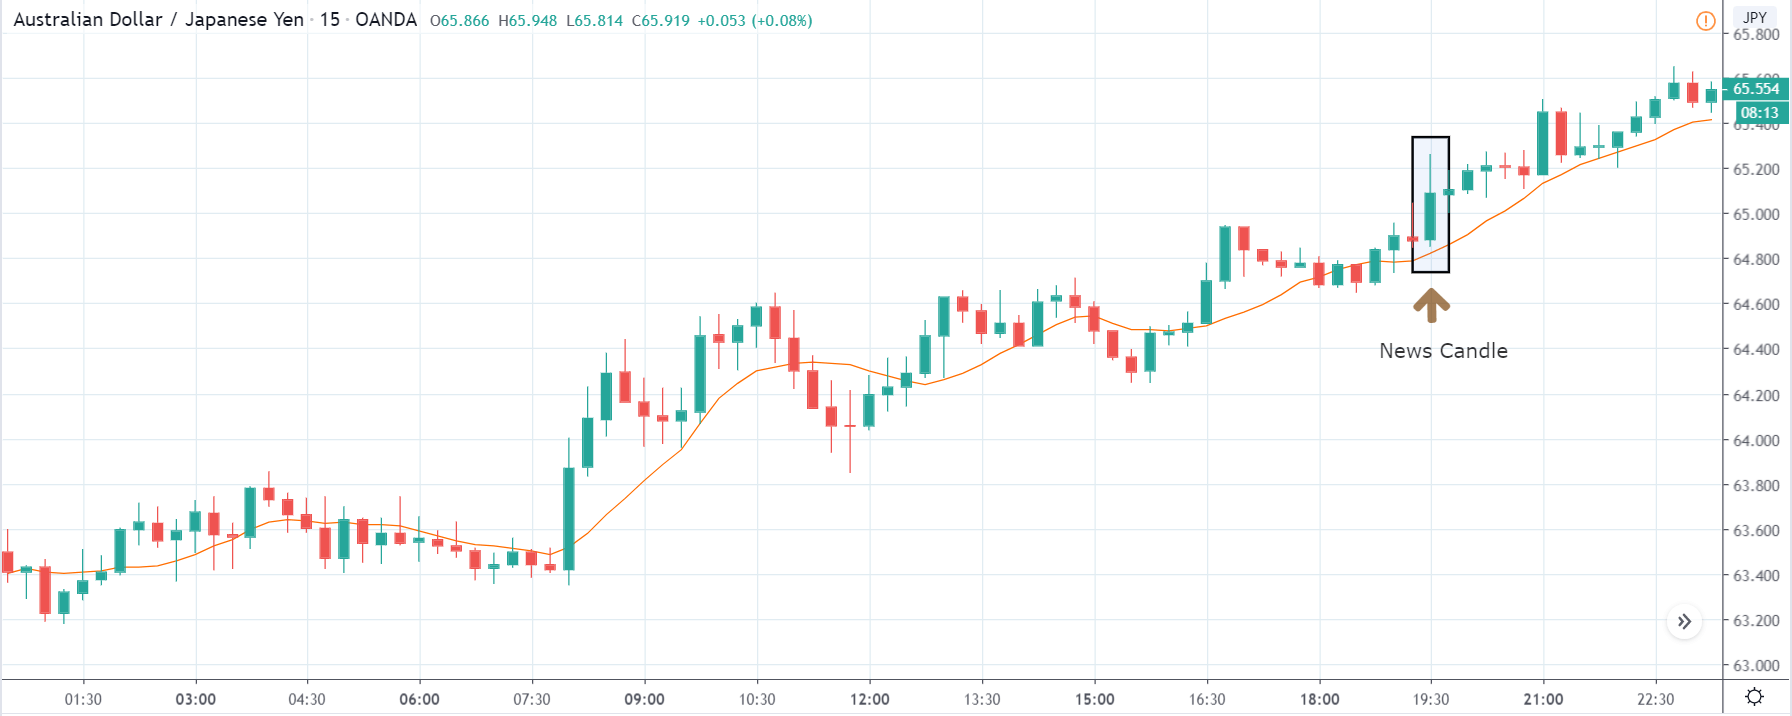
After the news announcement, the volatility expands on the downside, and the price sharply lower. The market reacted positively to the GDP data since it was measured to be nearly the same as before. This proved to be bullish for the Japanese Yen, where traders bought the currency and took the price lower.
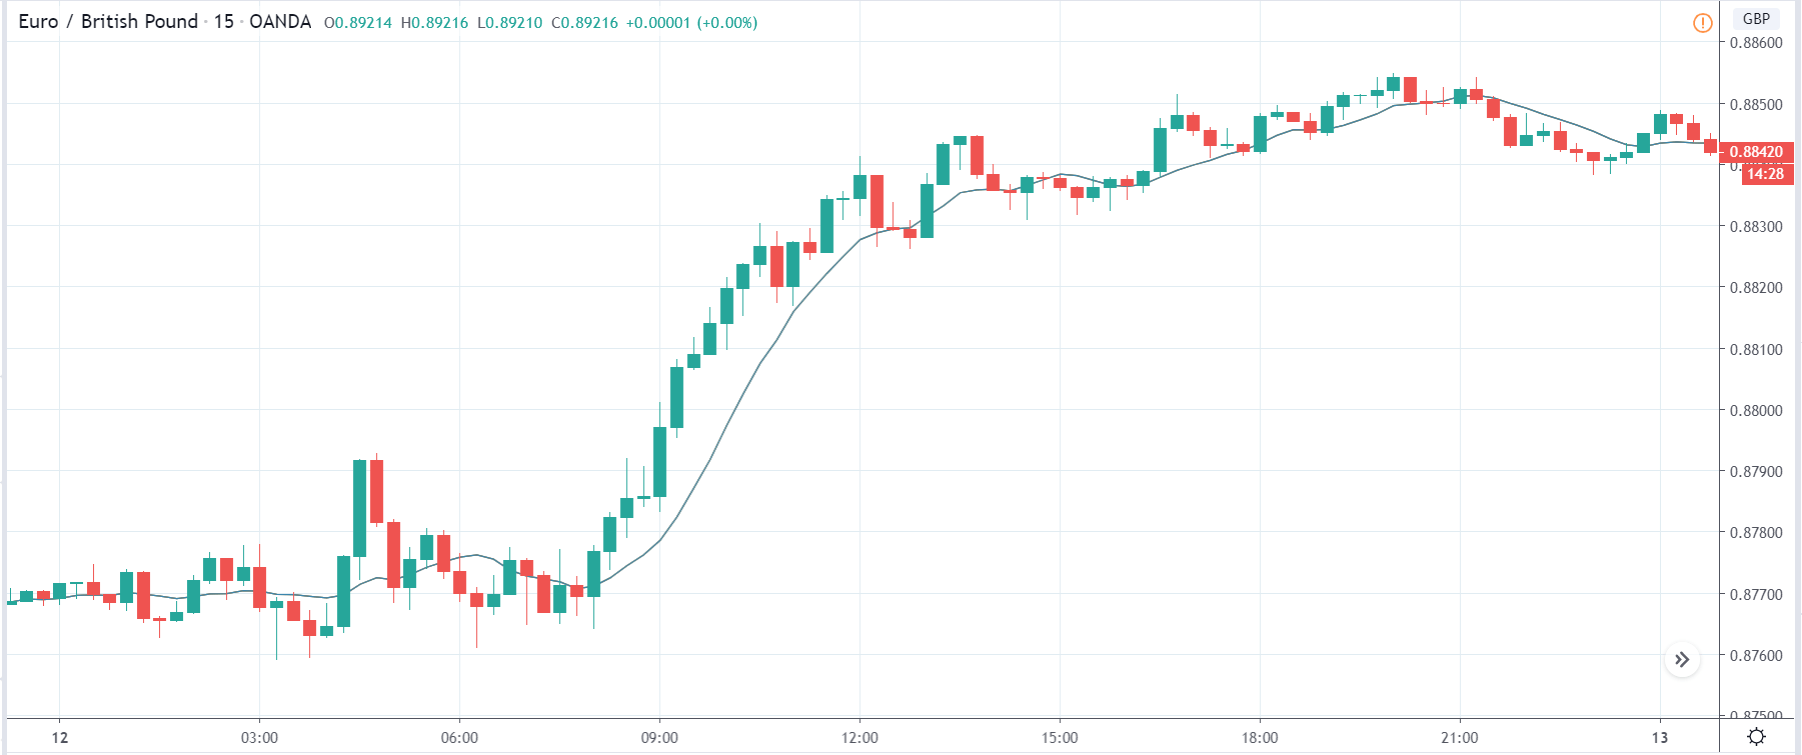
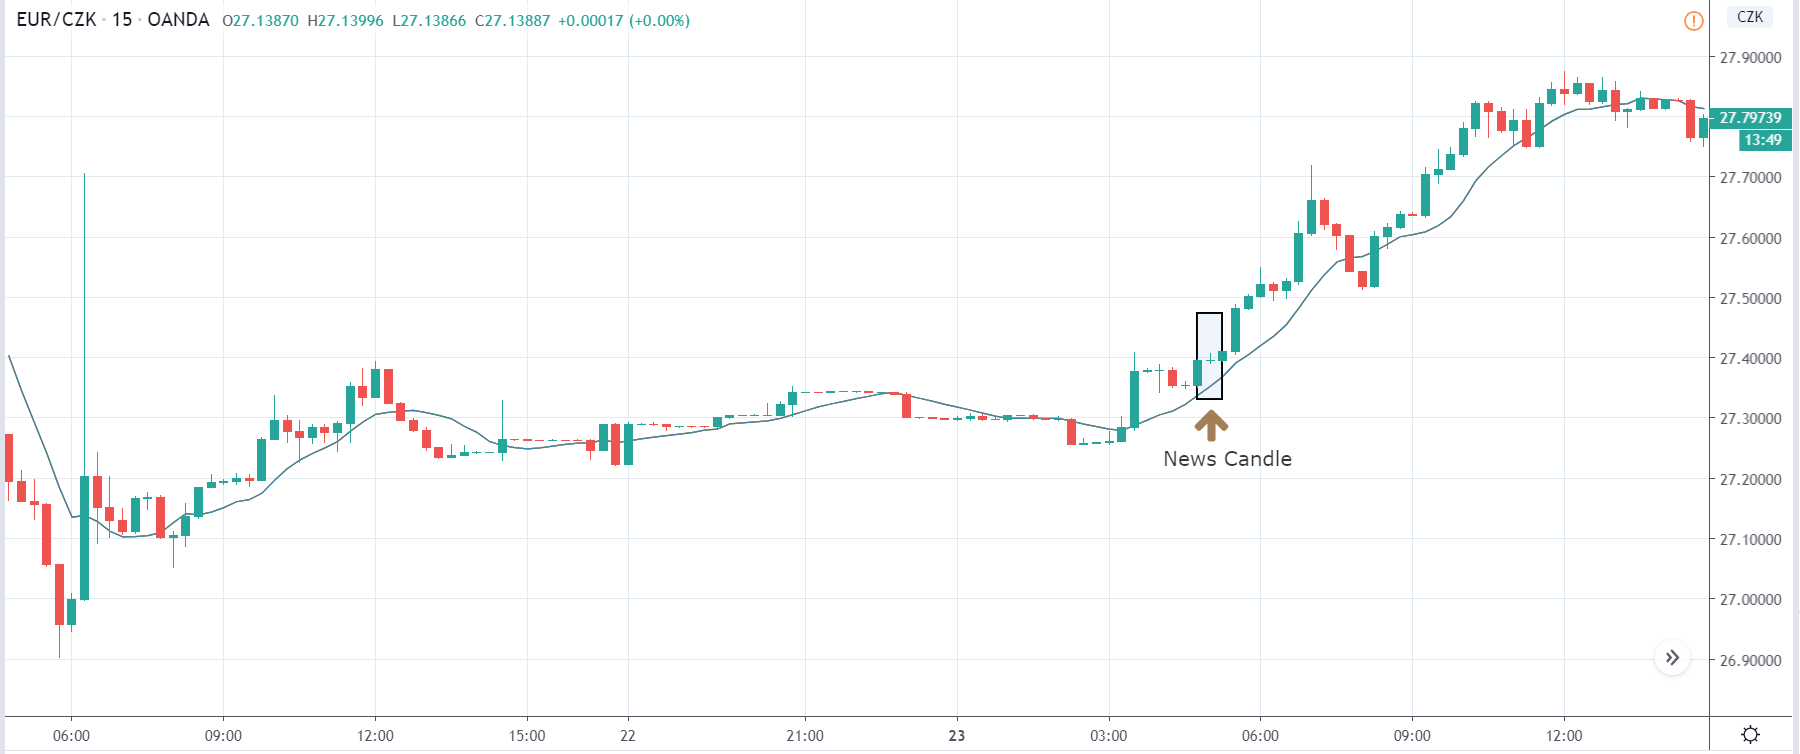
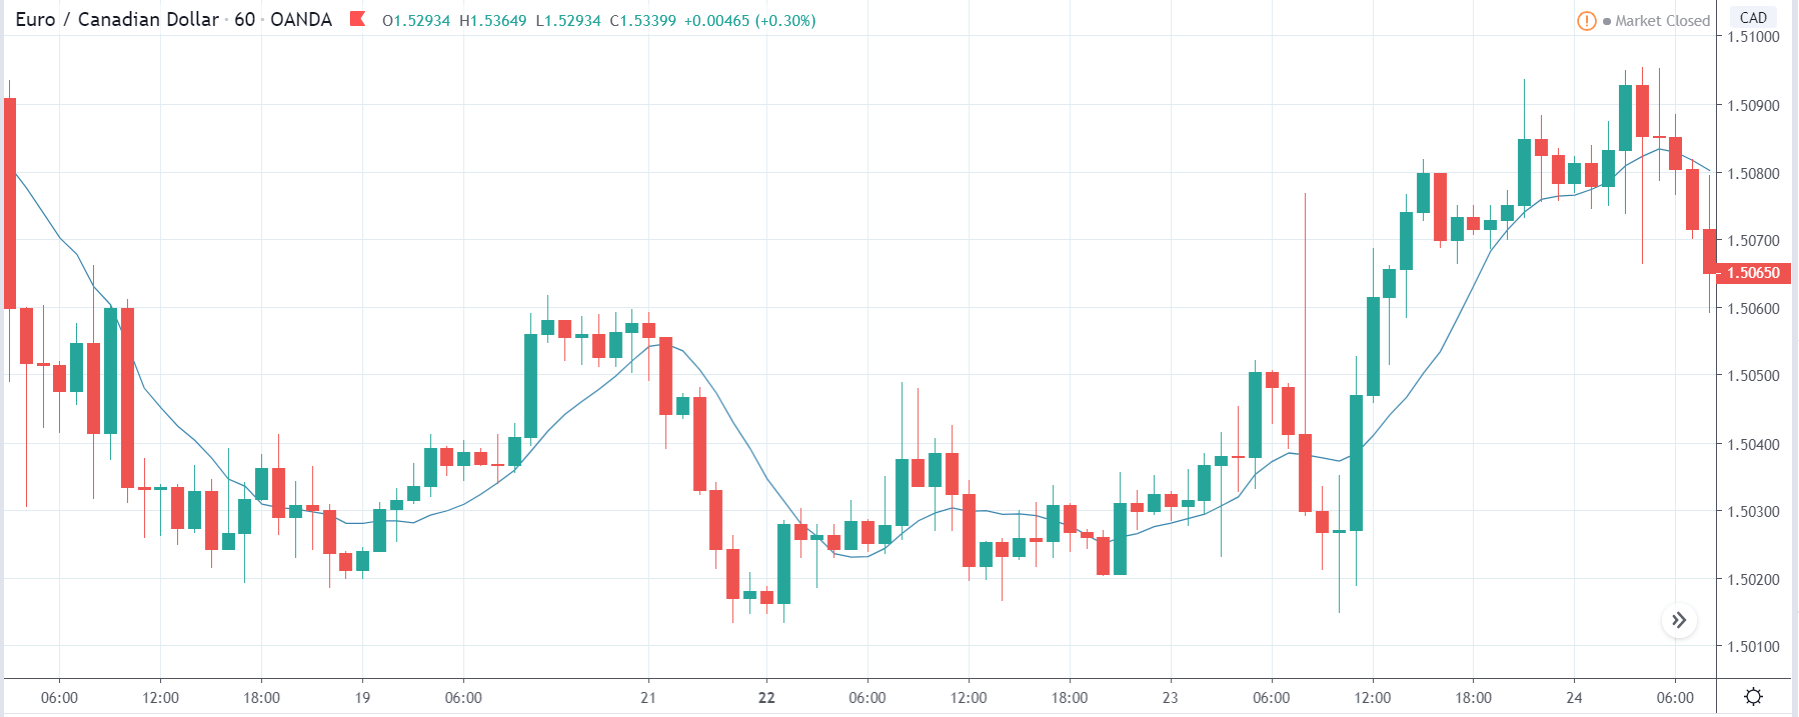
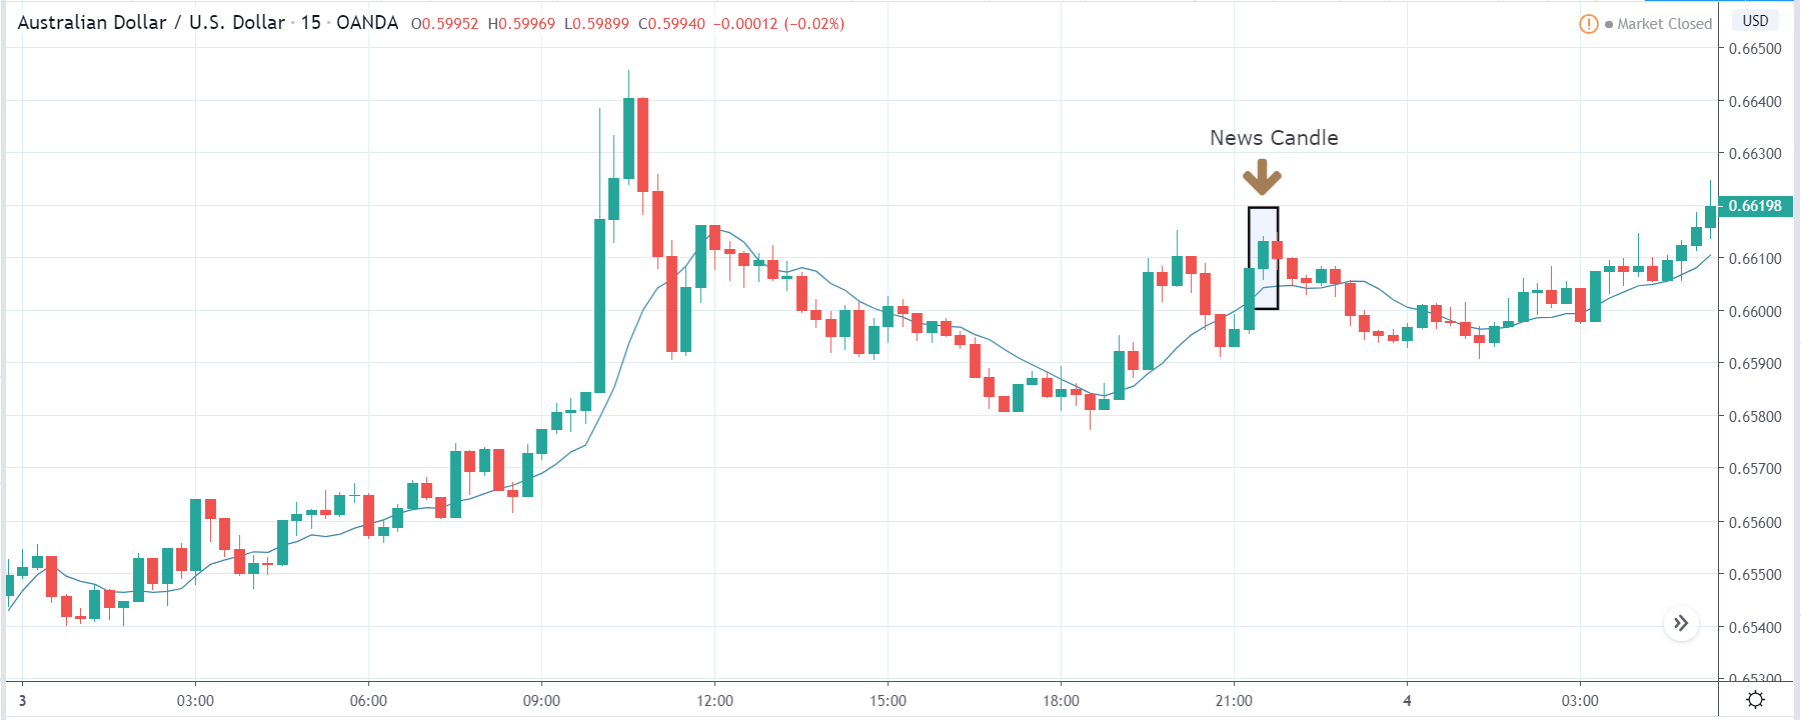
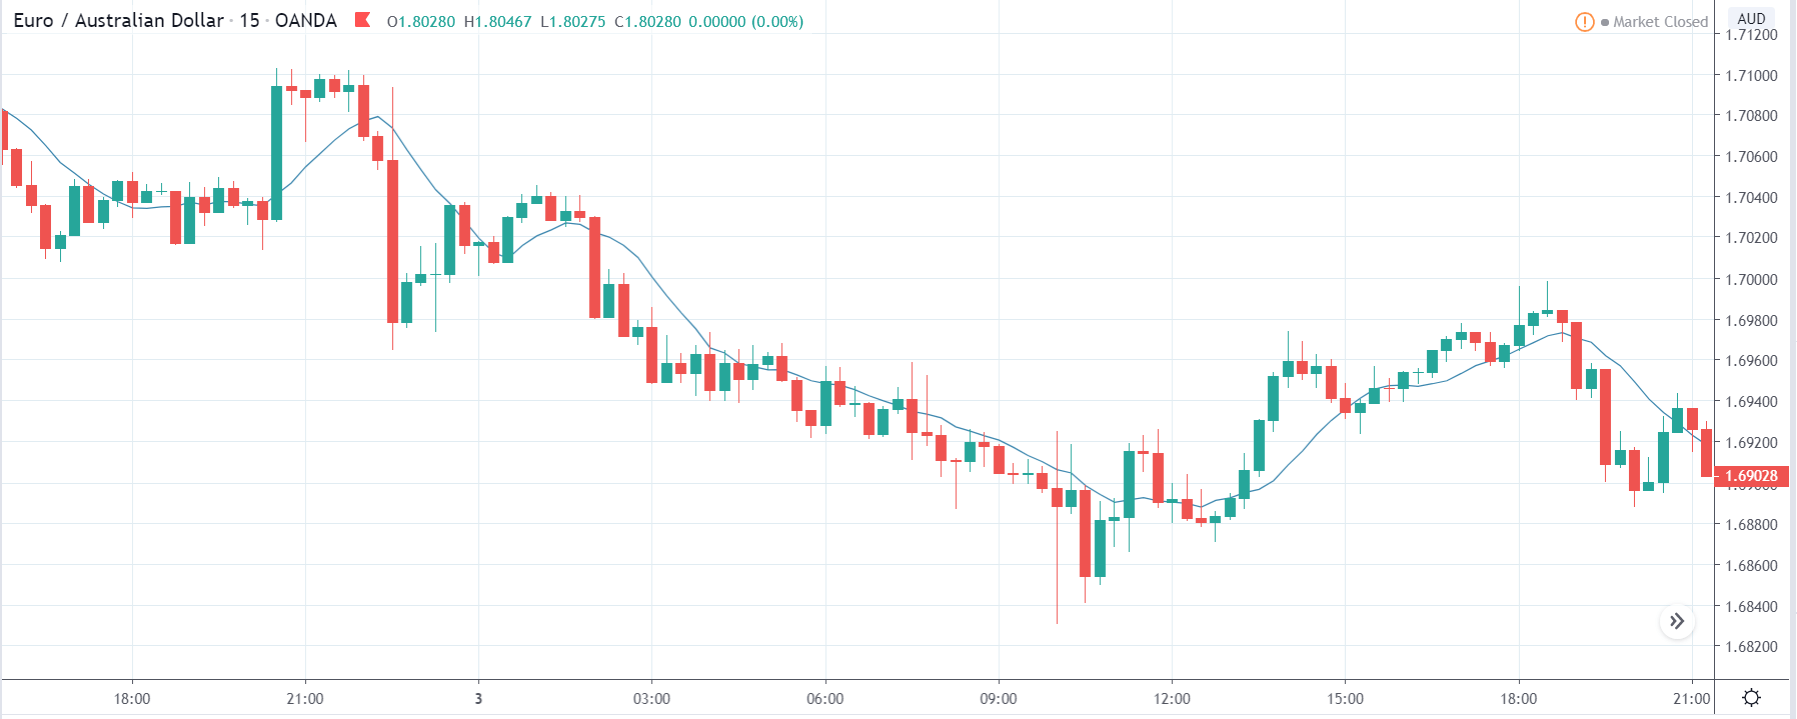
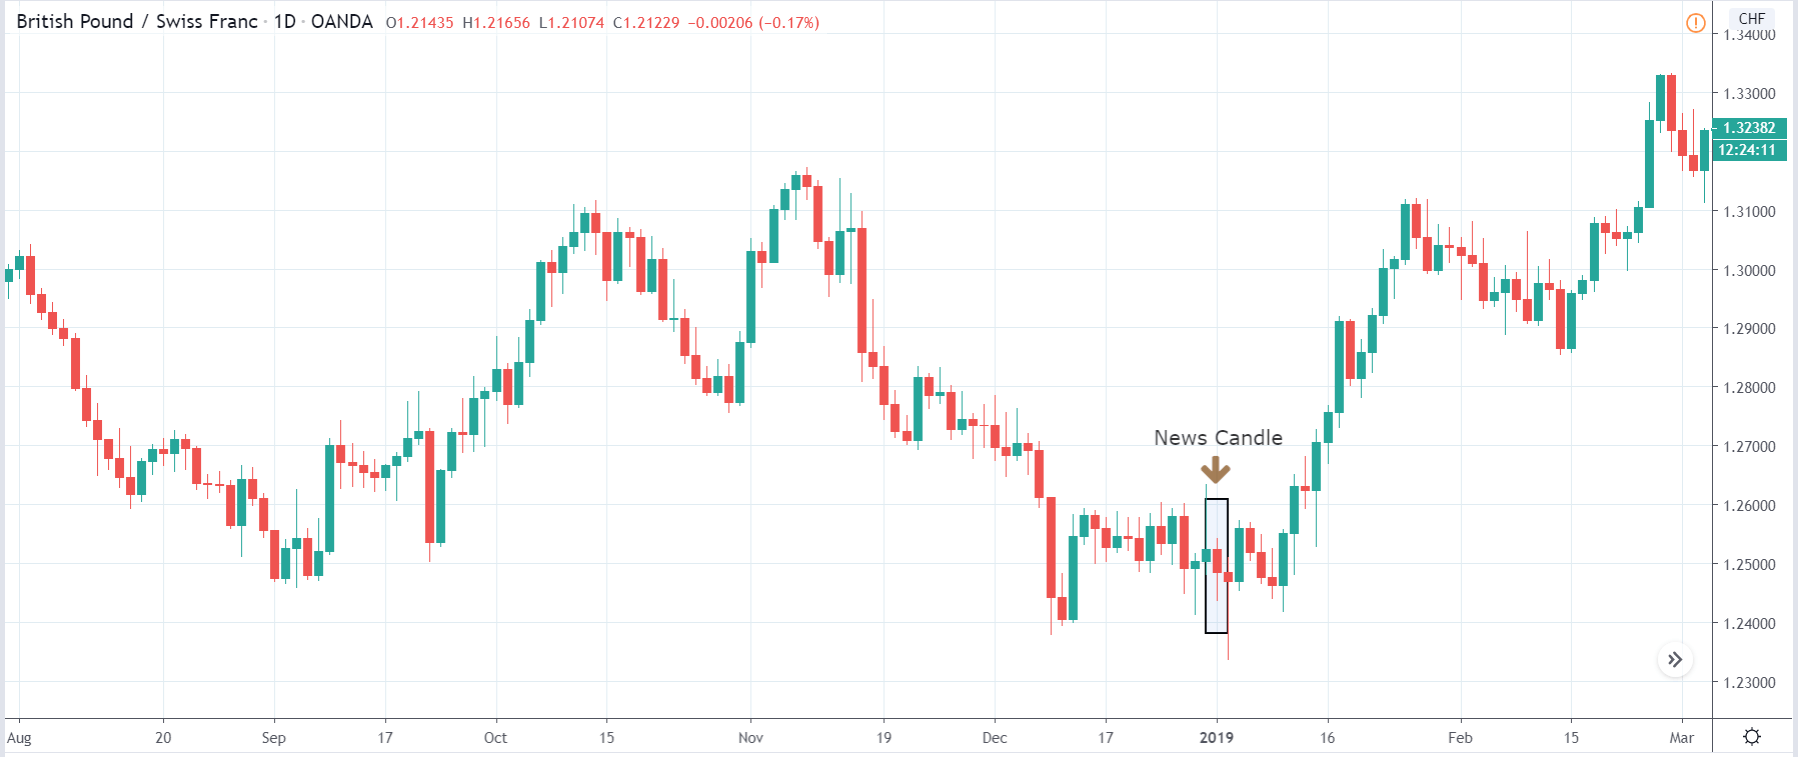
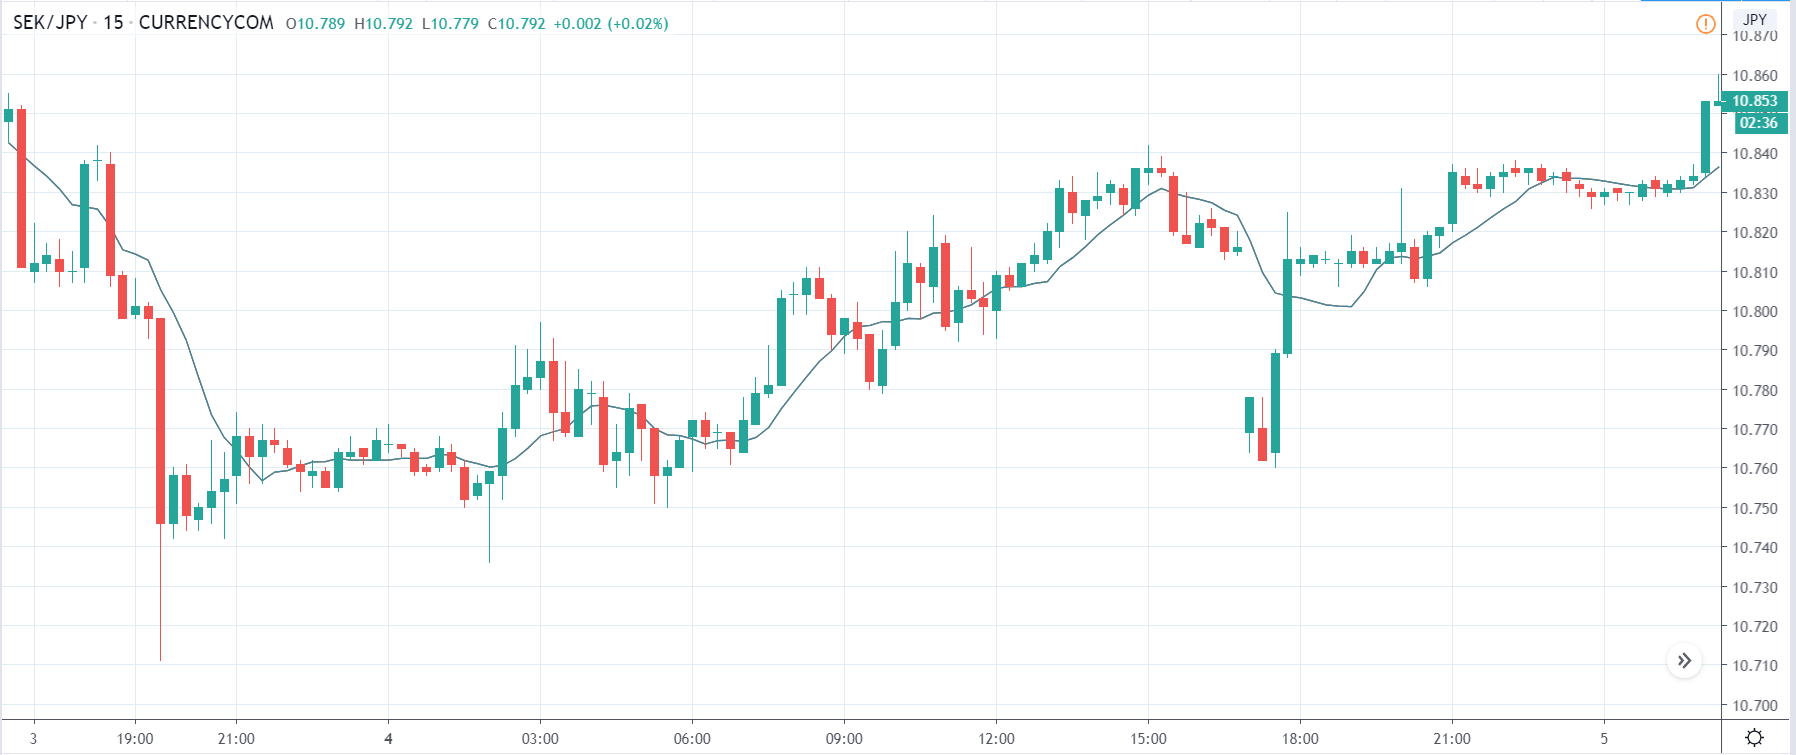
EUR/JPY | Before the announcement:

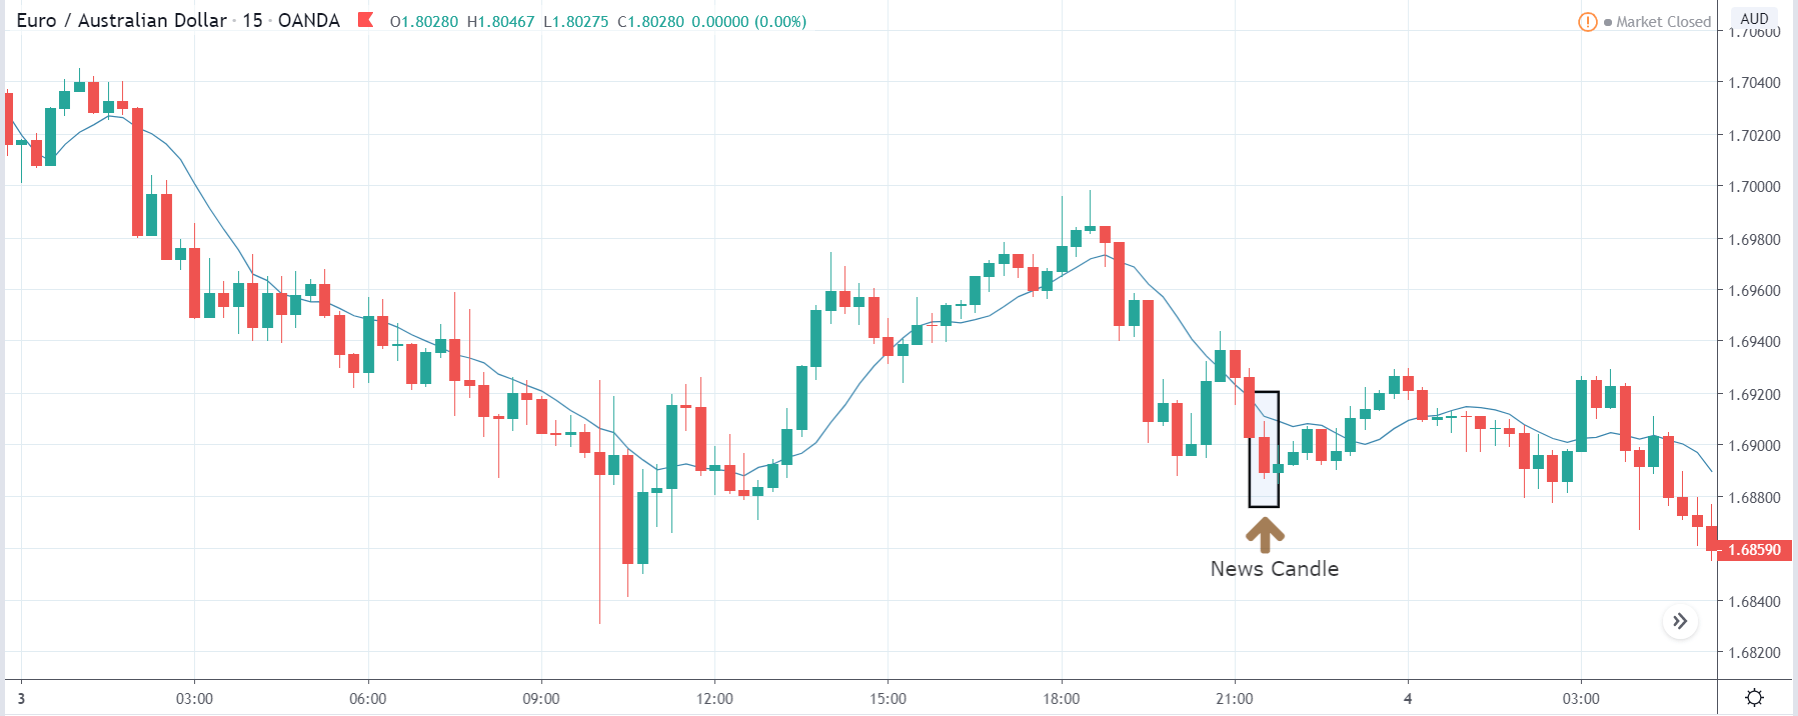
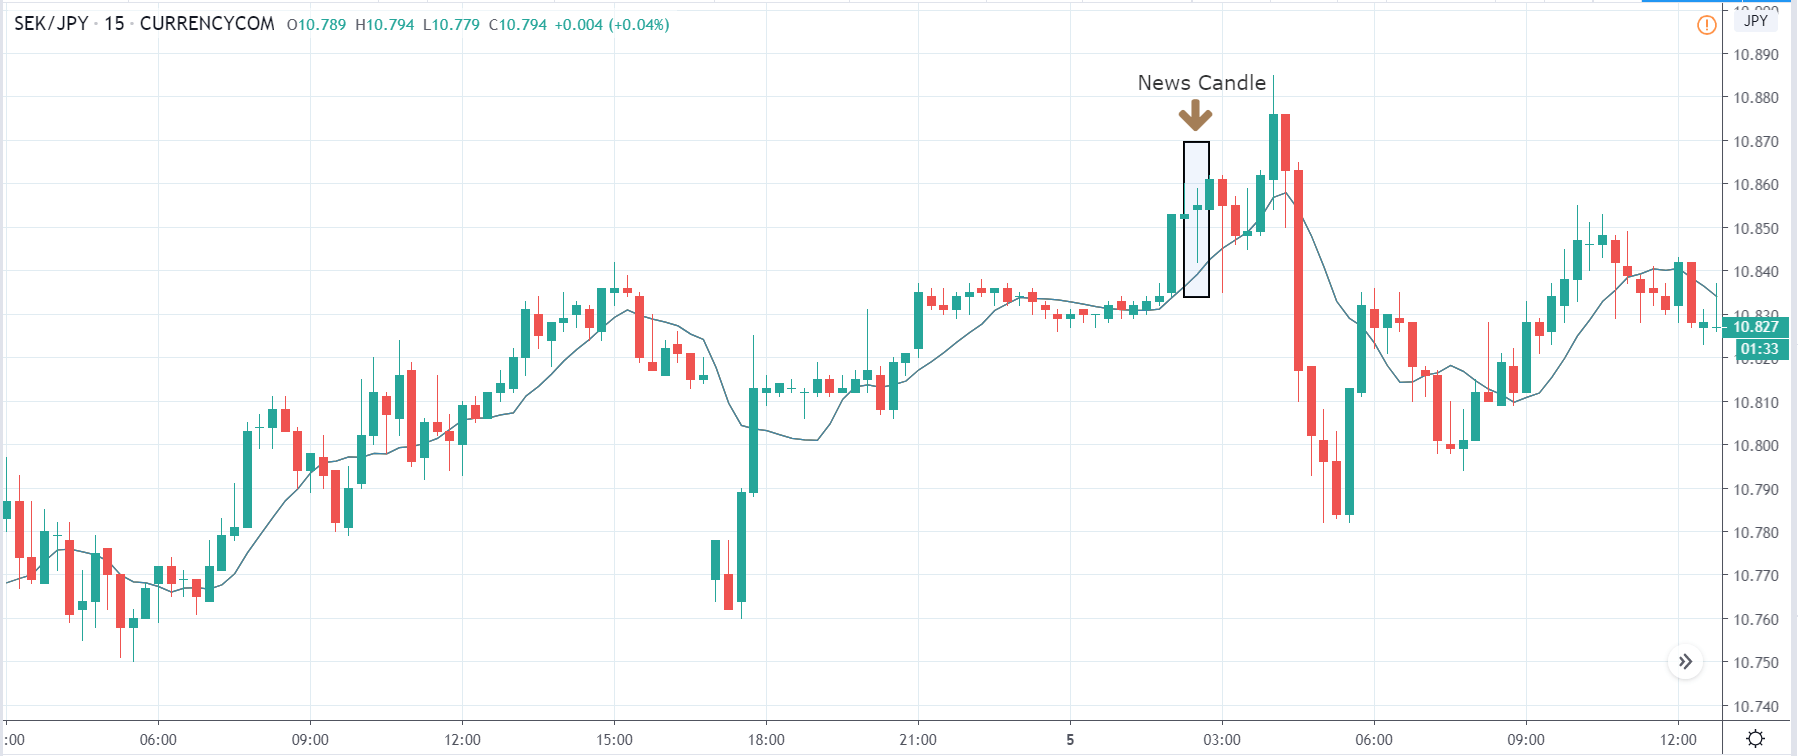
EUR/JPY | After the announcement:
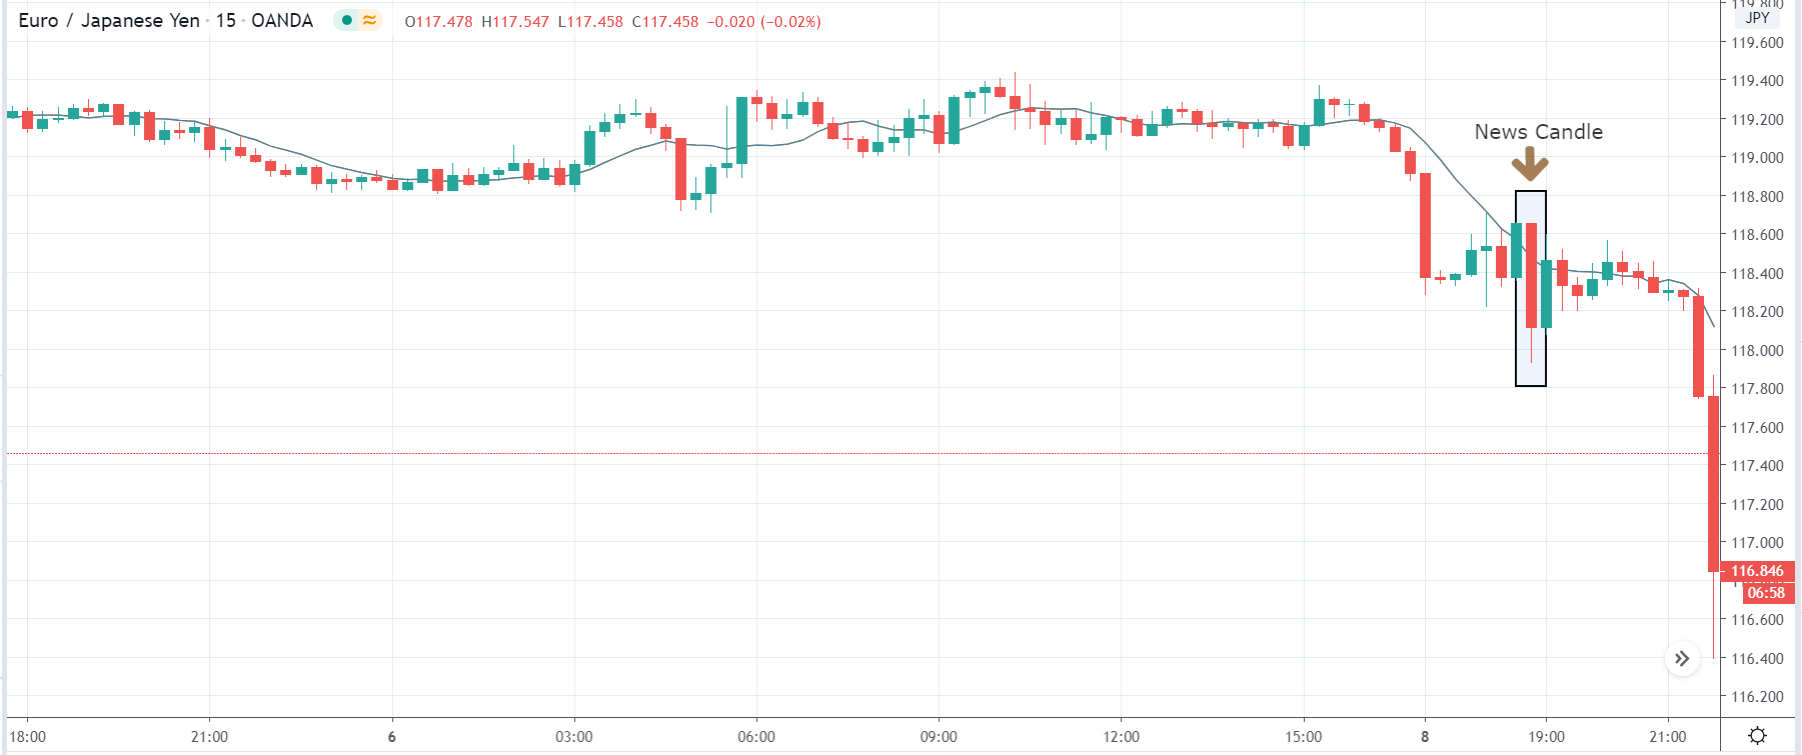
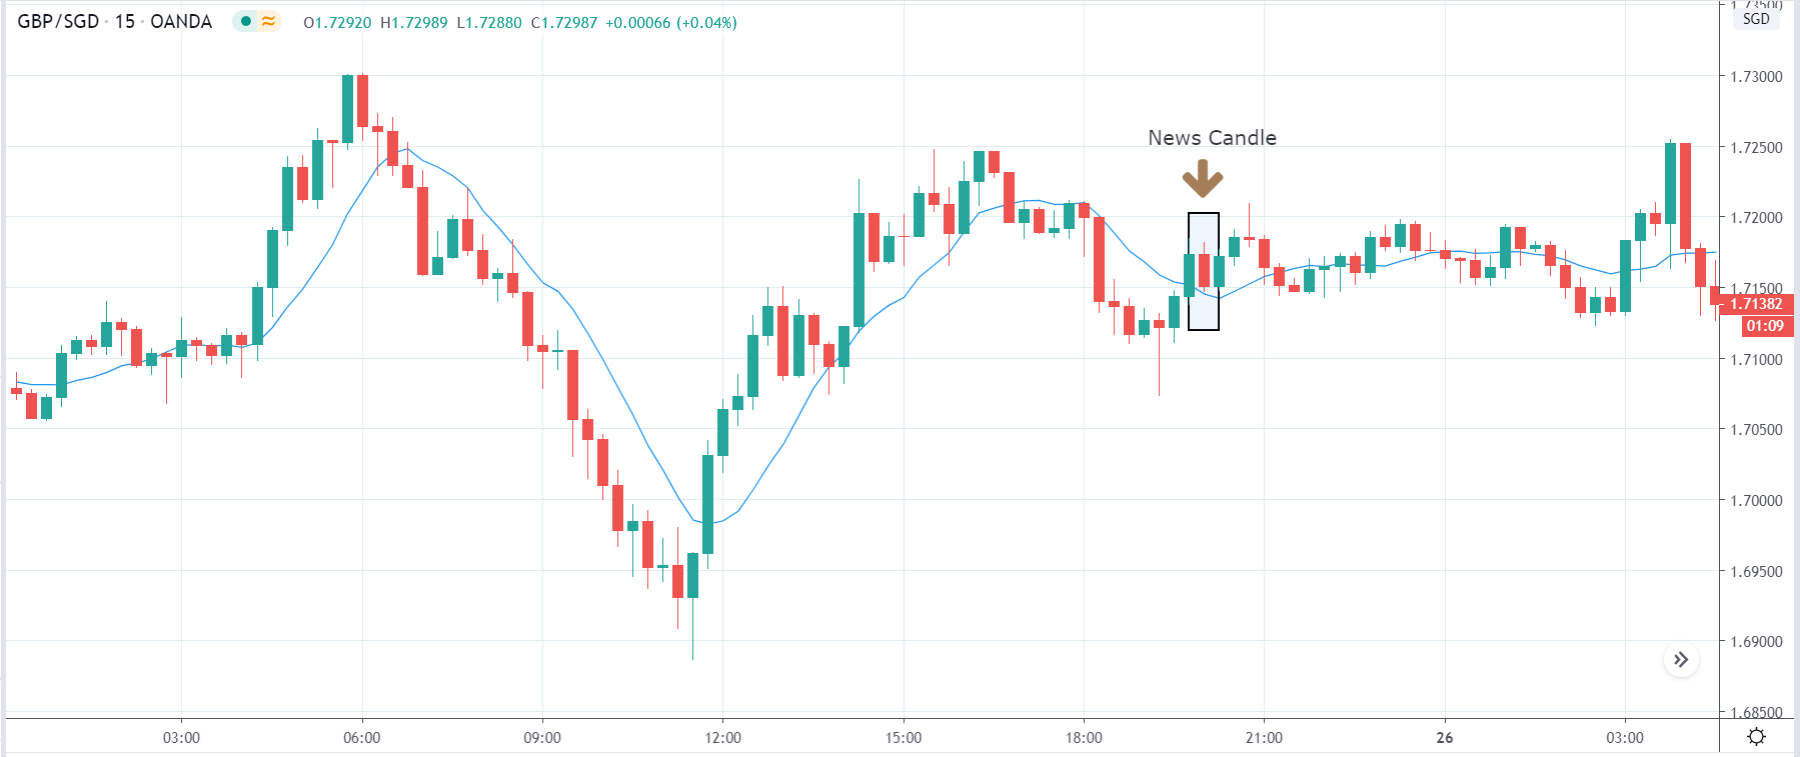
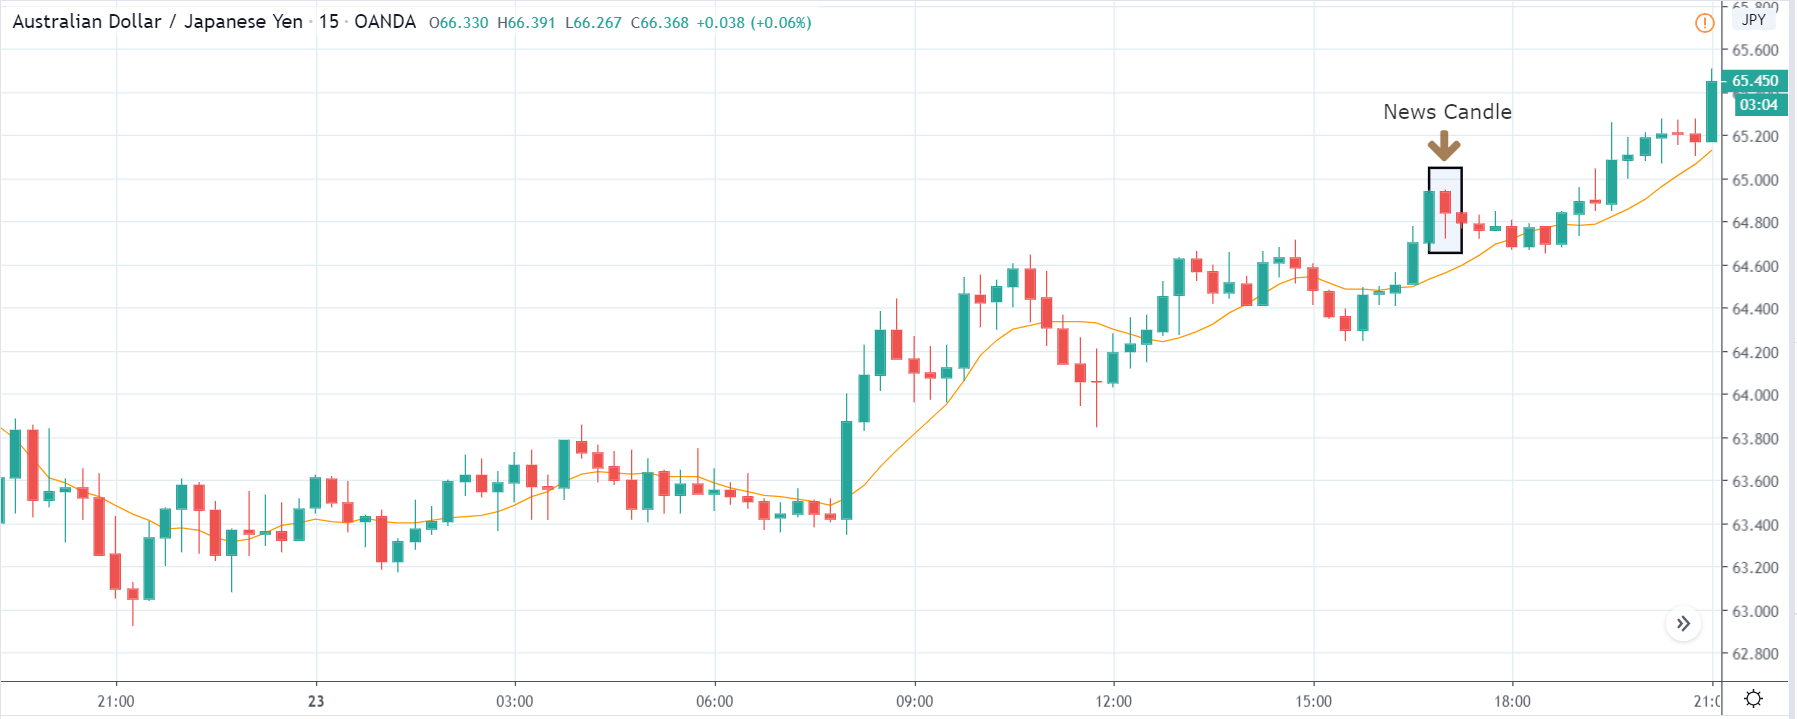
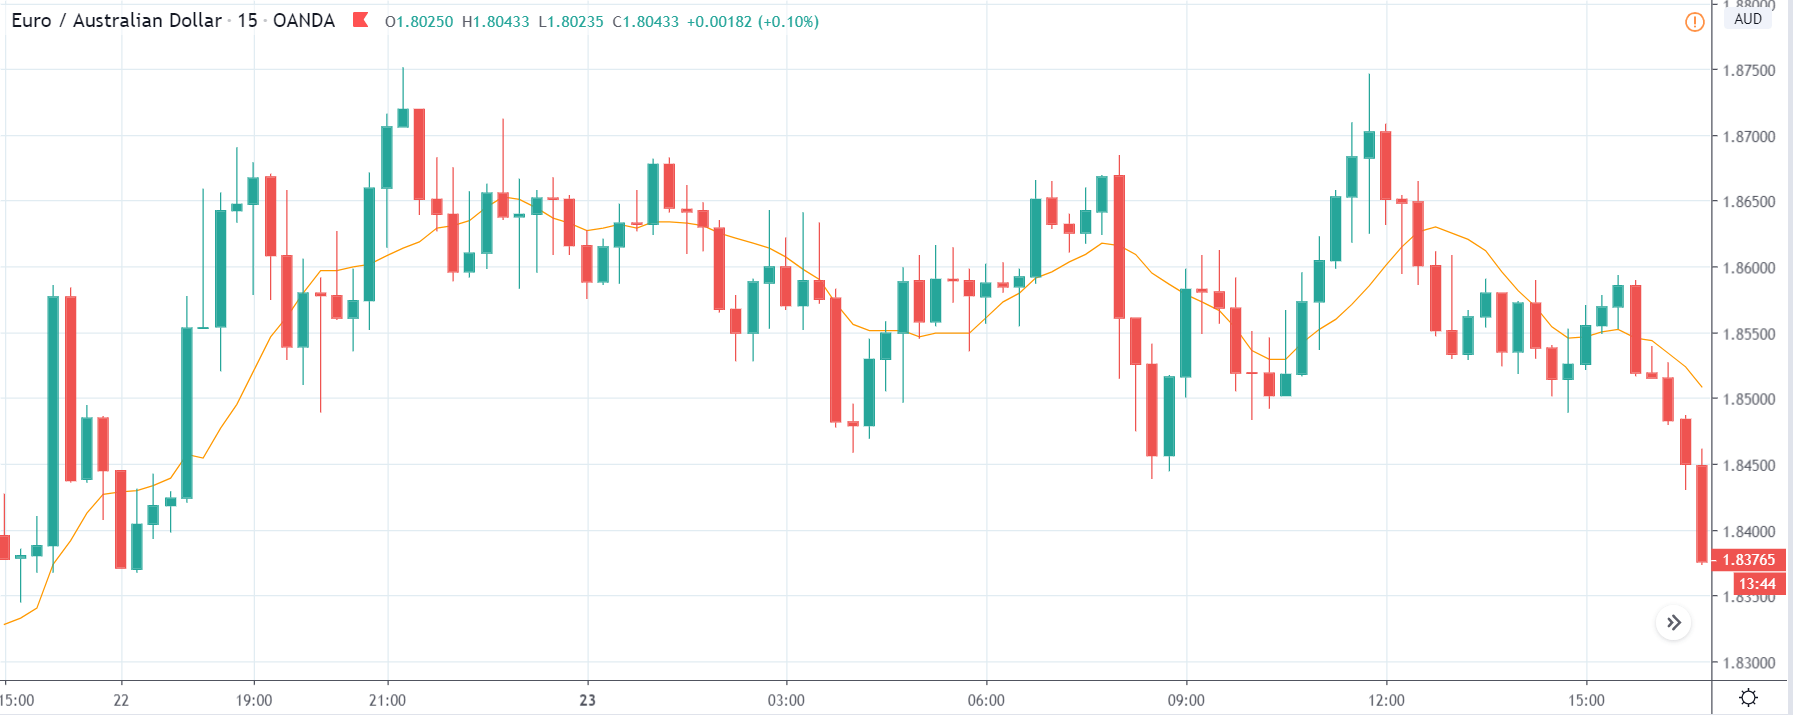
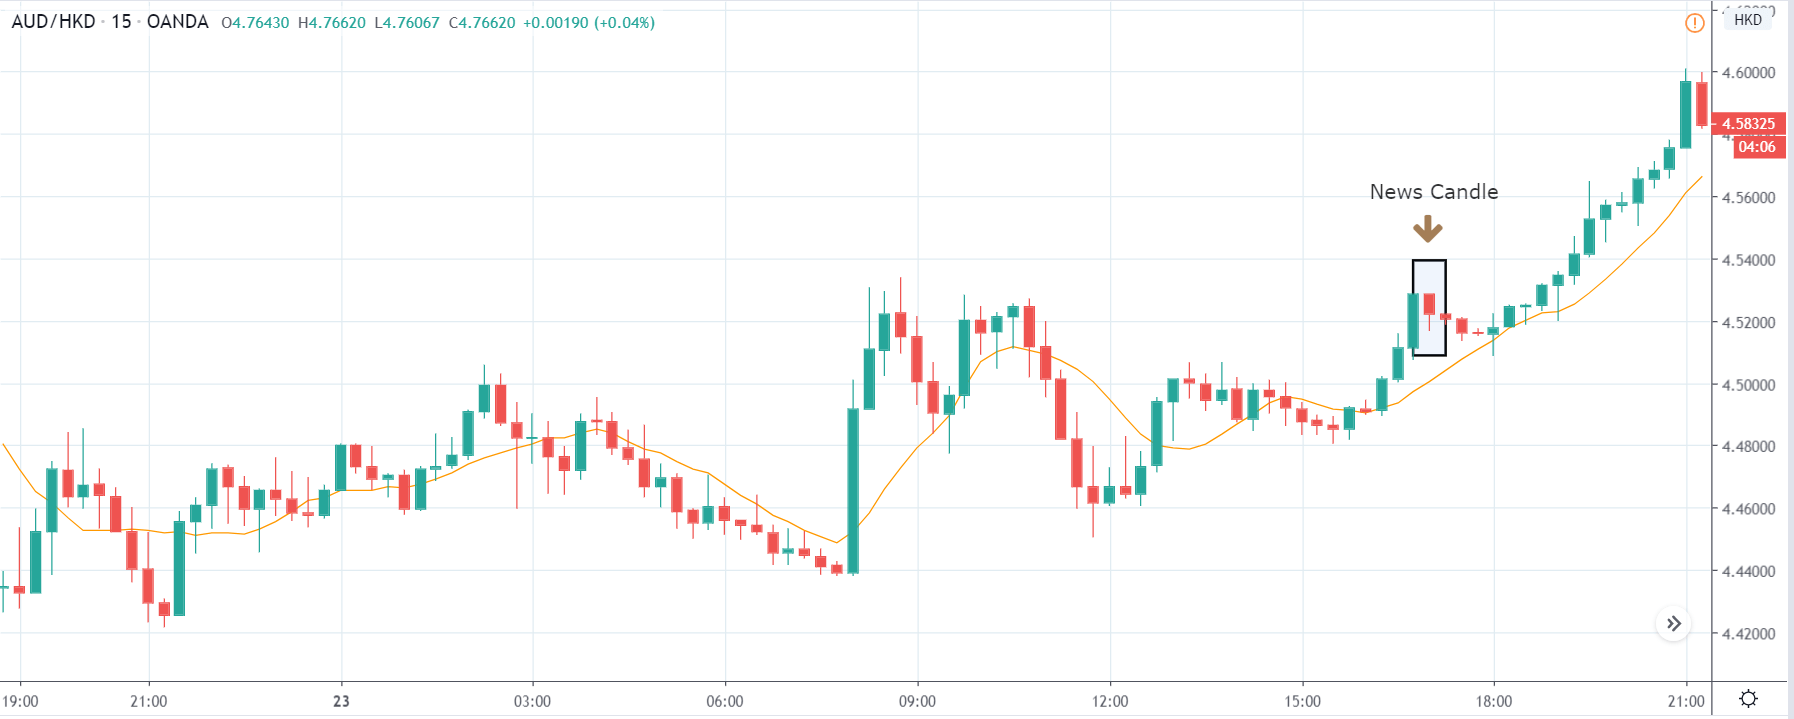
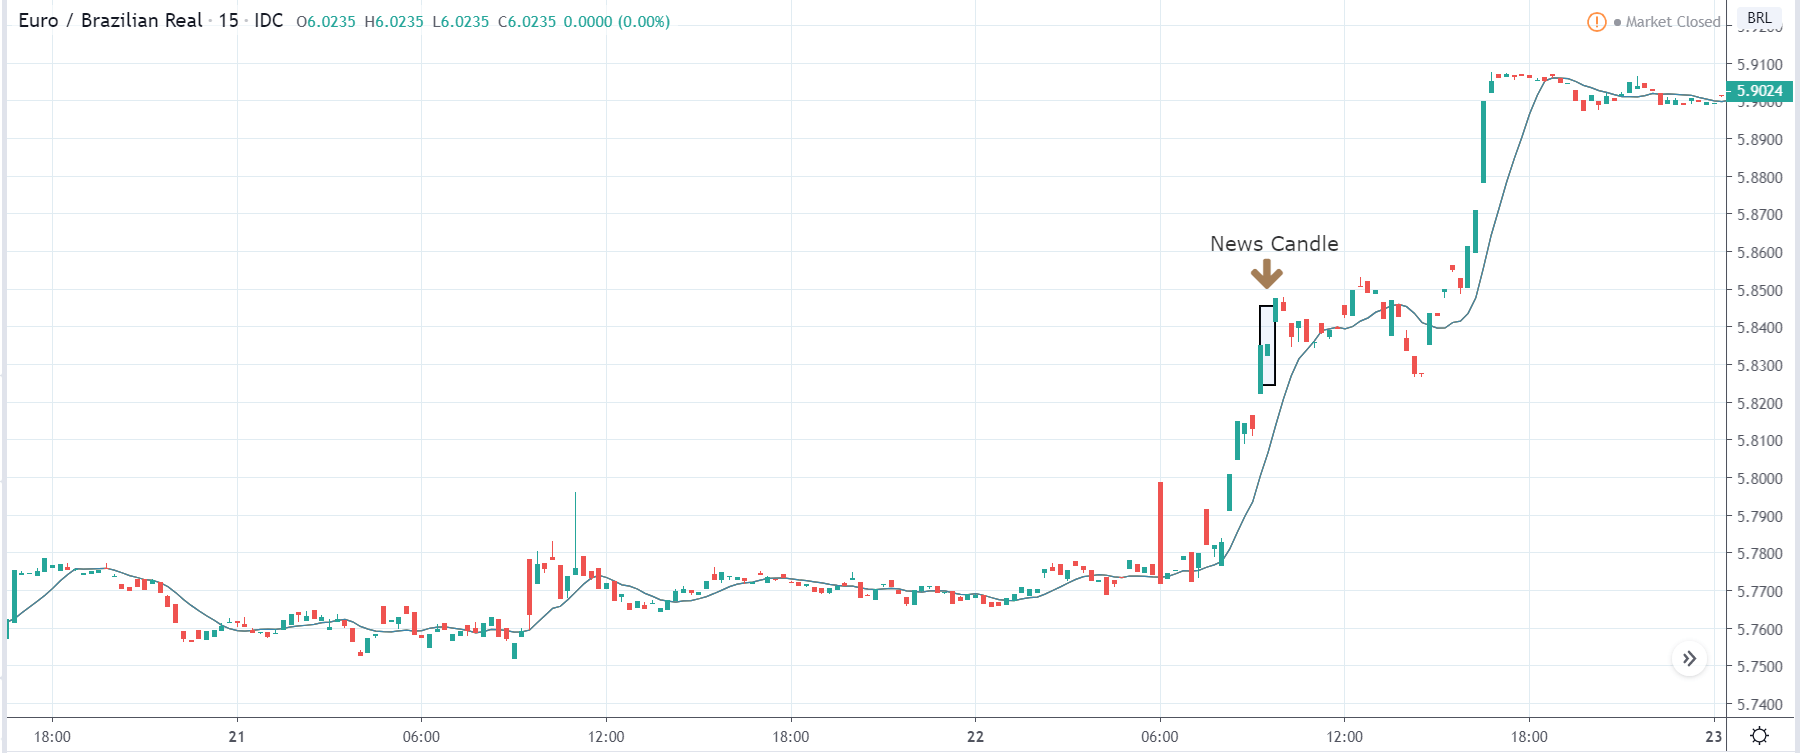
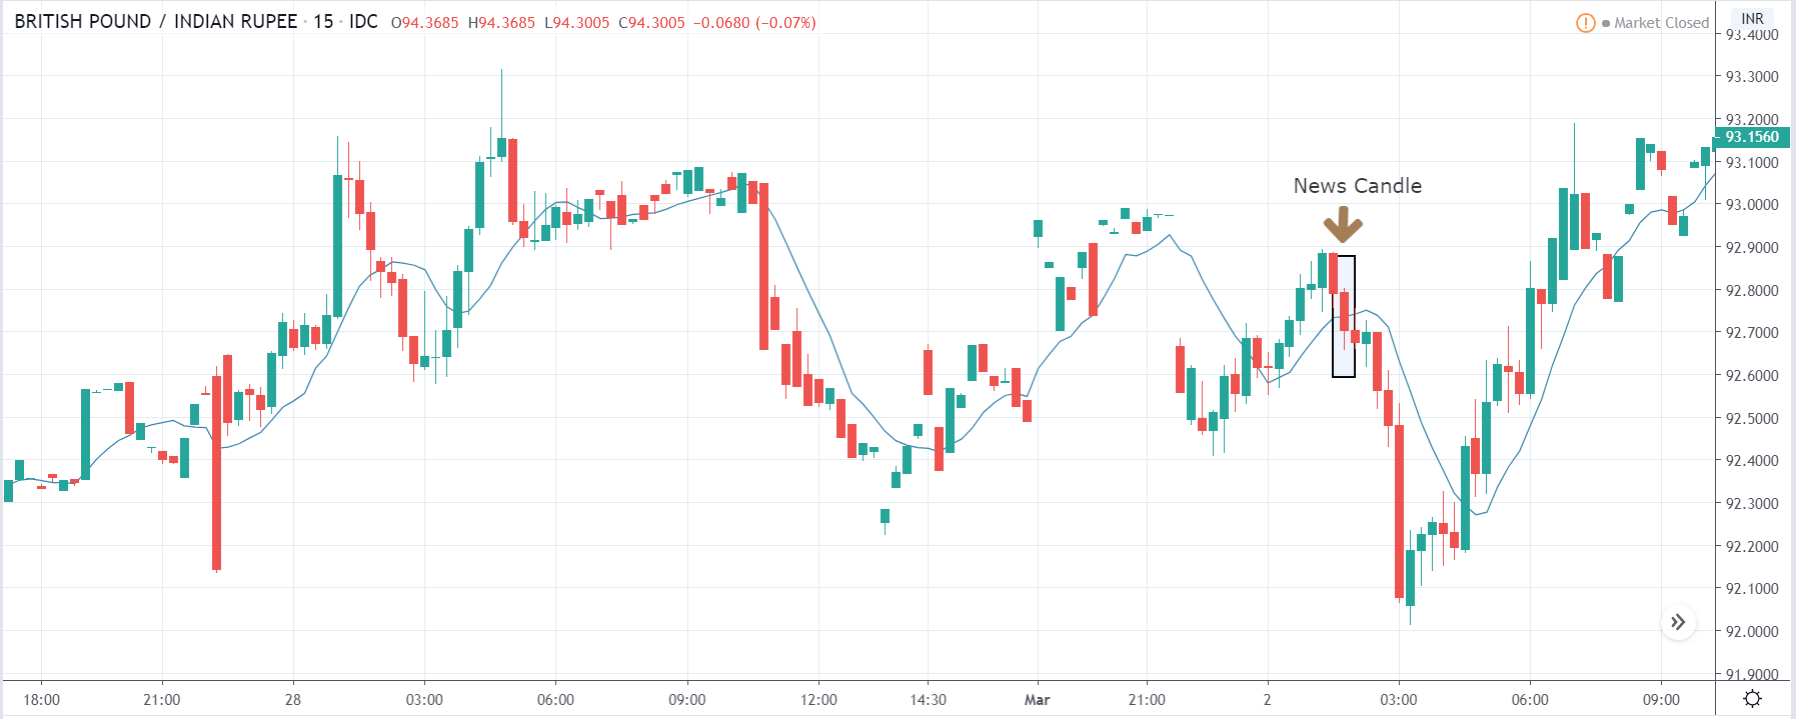
The above images are that of EUR/JPY currency pair where we see that again, the market is in a downtrend, but in this pair, we notice a strong bullish candle from the lowest point, which has taken the price higher. This means the Japanese Yen is not as bullish as it was in the above two pairs. Since the market is not expecting a fall in the GDP, aggressive traders can take a ‘short’ position with a strict stop loss.
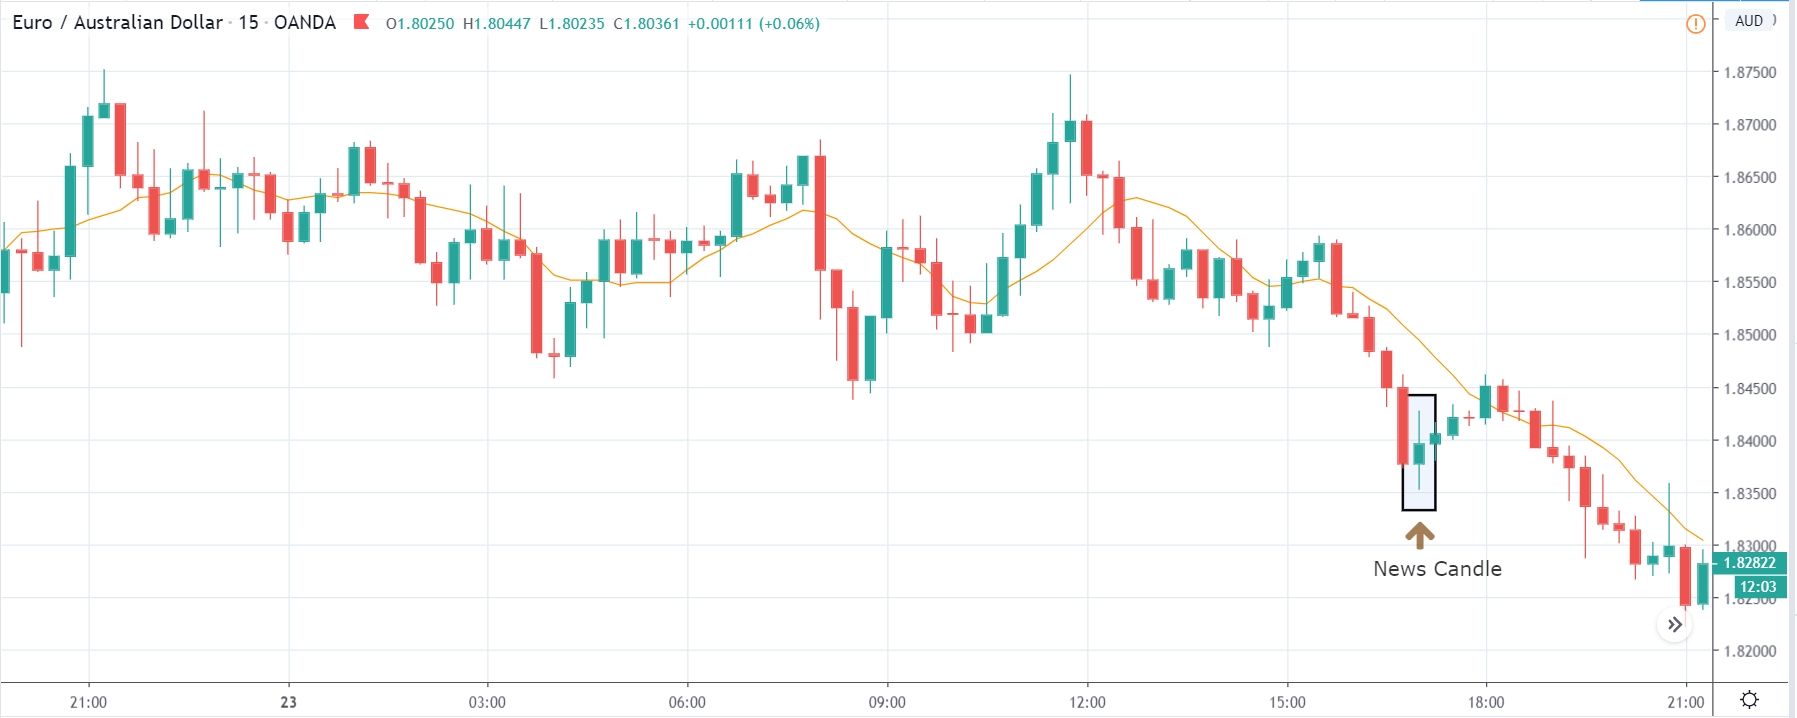
After the news announcement, the price moves lower and closes with a large bearish candle. This increases the volatility to the downside and strengthens the Japanese yen. Therefore, it clear that the GDP data had a hugely positive impact on all the currency pairs.
We hope you understood the concept of ‘GDP per Capita’ and how the Forex price charts get affected after its news release. All the best. Cheers!