Categories
Forex Fundamental Analysis

What Should You Know About ‘Job Vacancies’ as a Macro Economic Indicator

Introduction

Job vacancies are a fundamental macroeconomic indicator. This article defines in detail what job vacancies are and further shows how the job vacancies affect the economy of a given country, and consequently, its currency.

What are Job Vacancies

Job vacancies are the number of new gainful employment positions that are created within an economy at a given point in time. In order to establish the number of job vacancies, surveys are usually done on employers about their businesses, recruitment, and job openings.

Job vacancies are considered if: there is a specific open position with work available for it; the job could commence within 30 days of advertisement whether or not a suitable candidate is hired, and the employers are actively recruiting workers for that particular job.

Purpose of Job Vacancies Statistics

The job vacancies statistics are meant to provide information about the level and structure of labor demand. The job vacancies statistics indicate the unfulfilled demand for labor and the desirable skills that are sought by the employers within an economy. As such, the job vacancies statistics provide the central banks and governments with an opportunity to analyze the trends in the labor market. The statistics can also be used to assess the structural analysis of the economy in terms of business cycles.

Job Vacancies as an Economic Indicator

Employers within an economy are continually looking to hire new workers to fill positions in their organizations. As such, job vacancies are a leading macroeconomic indicator of unemployment and employment rates. Thus, the more the job vacancies are available, the more the number of people who stand a chance to be gainfully employed and thus, leading to a reduction in the unemployment rate.

Conversely, fewer job vacancies imply that fewer people seeking employment get to be gainfully employed hence low employment rate in the economy. Thus, higher job vacancies signify an expanding economy while a reduction in the job vacancies implies that the economy is contracting or heading for a full-employment level. In this case, higher job vacancies result in appreciating the strength of a country’s currency while lower than expected job vacancies result in a drop in the currency value.

The statistics on job vacancies can also be used in the analysis of business cycles. The number of job vacancies is expected to be on a constant increase during periods of expansion because businesses are hiring more workers due to increased economic activities. At peak periods, the number of job vacancies is marginally decreased and remain plateaued since most businesses have achieved optimal operations. During the periods of contraction, the number of job vacancies is expected to be on a constant decrease due to a rapid reduction in the economic activity within a country, hence lower GDP output.

Thus, the statistics on job vacancies can be accurately used to predict the periods of economic boom and recessions. During the global economic crisis, the number of job vacancies in the US decreased from 4.4 mn in the 1st quarter of 2008 to 2.45 million in the fourth quarter of 2019, a period of recession. In the recovery period, the number of job vacancies increased from 2.72 million in the first quarter of 2010 to 4.92 million in the fourth quarter of 2014.

How Job Vacancies Affect the Economy

By itself, job vacancies signify the level of economic activity within an economy. A higher and increasing number of job vacancies signify that the economic activities within a country are increasing hence the need for more workers. Similarly, a constant reduction in the number of job vacancies available implies that the economic activities in a country are cooling down, hence the need for fewer workers. More so, a reduction or plateauing in the number of job vacancies available could imply that the economy is heading for full employment.

Graph: 2019 January to December Scatter plot of US Job Vacancies and Real GDP.

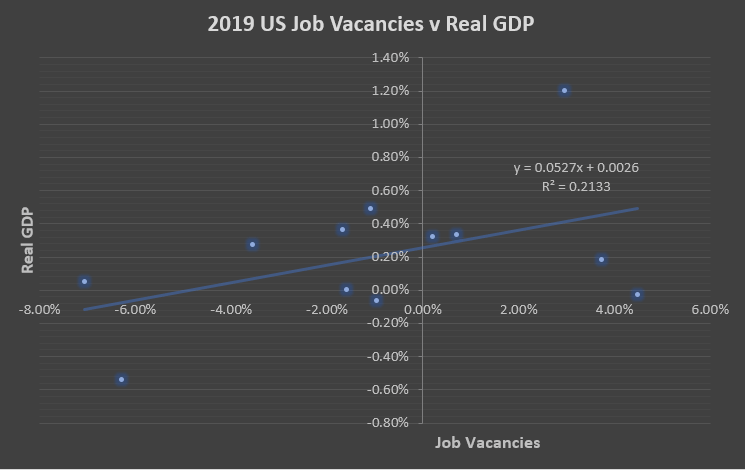
Source: OECD Statistics and US BEA

As seen from the above scatter plot, from January 2019 to December 2019, there was a direct positive correlation between the change in the job vacancies in the US and the change in real GDP.

Job Vacancies and Impact on the Currency

As already discussed, job vacancies serve as a leading indicator for employment and unemployment levels. An increasing number of job vacancies implies that unemployment levels are bound to fall drastically. A steep fall in the unemployment rate, which is accompanied by a full rate of employment will result in higher inflation. The higher inflation is because the employers are competing to hire workers hence pushing up the wages at a faster rate. Increased rates of inflation will trigger the government and central banks to employ contractionary monetary policies aimed at keeping the inflation rate in check.

When the central banks increase the interest rate, it is aimed at reducing the rate of inflation by making borrowing expensive while encouraging the culture of savings. Thus, for forex market traders, they can anticipate a hike in the interest rate levels when there is a consistent increase in the number of job vacancies. The higher interest rate has the effect of increasing a country’s currency valuation.

Conversely, a constant reduction in the number of job vacancies, which comes after a period of a sustained increase in the total number of job vacancies, implies that an overheated economy is cooling down. An overheated economy is characterized by a prolonged period of positive economic development and higher levels of inflation brought about by increased wealth generation.

Thus, after the government has employed contractionary policies following the overheating of an economy, it can consequently be expected that this period will be accompanied by asset bubbles and an increase in the prices of assets. Higher wages means that most employers may not be able to hire more workers and let go of some of the existing employees, resulting in a sustained period of lower job vacancies.

The economy can be said to have plateaued and headed for a recession. For forex traders, a falling number of job vacancies could signify an impending dovish monetary policy meant to stimulate the economy and prevent excessive deflation. The dovish policies have a negative effect on a country’s currency.

How Job Vacancies News Release Affects The Price Charts

Although considered a low impact indicator, forex traders need to understand how job vacancies release impacts the price action. In the US, the job vacancies report is published by the Bureau of Labor Statistics by conducting Job Openings and Labor Turnover Survey (JOLTS).

JOLTS gives data on job openings, hires, and separations. The JOLTS report is released monthly about 40 days after the month ends. The latest, expected, and all historical figures are published on the Forex Factory website. The most recent release one can be found here. Job vacancies are advertised positions yet to be filled by the final business day of the month. A more in-depth review of the JOLTS numbers can be found at the Bureau of Labor Statistics website.

Below is a screengrab of the Forex Factory website. On the right, we can see a legend that indicates the level of impact the Fundamental Indicator has on the corresponding currency.

The snapshot below shows the change in the JOLTS numbers. In the latest release, the number of job openings increased on a month on month between May and June 2020 from 5.37 million to 5.89 million. The increase was more than the 5.30 million forecasted by analysts.

Now, let’s understand how this news release impacted the Forex price charts.

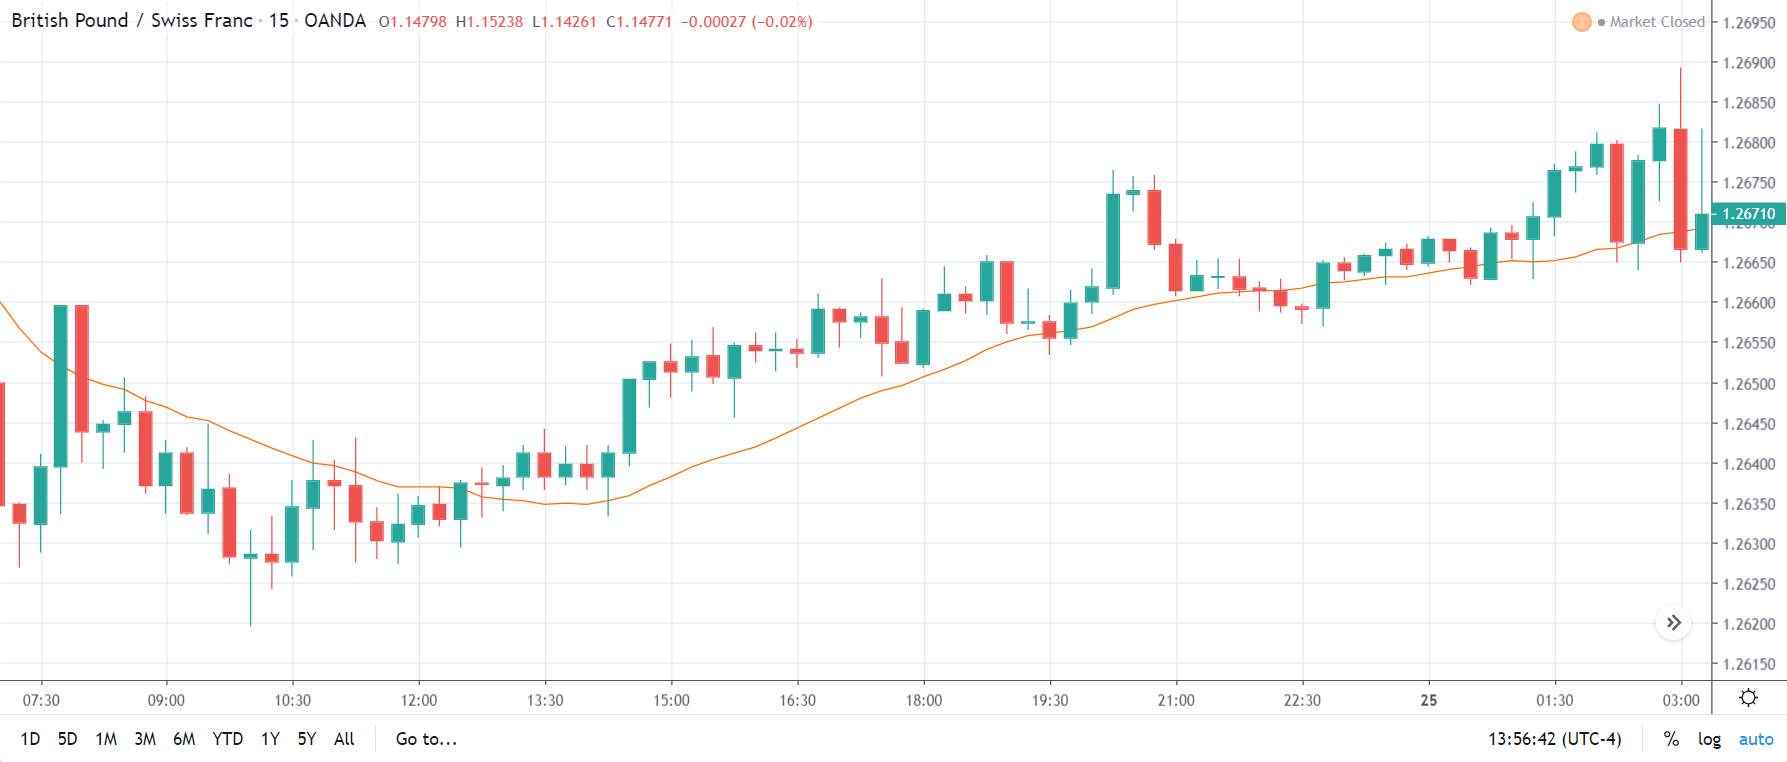
EUR/USD: Before JOLTS release August 10, 2020

As seen on the chart above, we have plotted a 20-period moving average on the EUR/USD chart, which shows that the pair is on a strong downtrend. The steady downtrend is also evident from the fact that the candlesticks are just below the Moving Average. On the 15 minute timeframe before the release, between 1100 and 1330 GMT, the market is on a constant uptrend. This uptrend can also be observed in AUD/USD and NZD/USD pairs, as shown by the charts below.

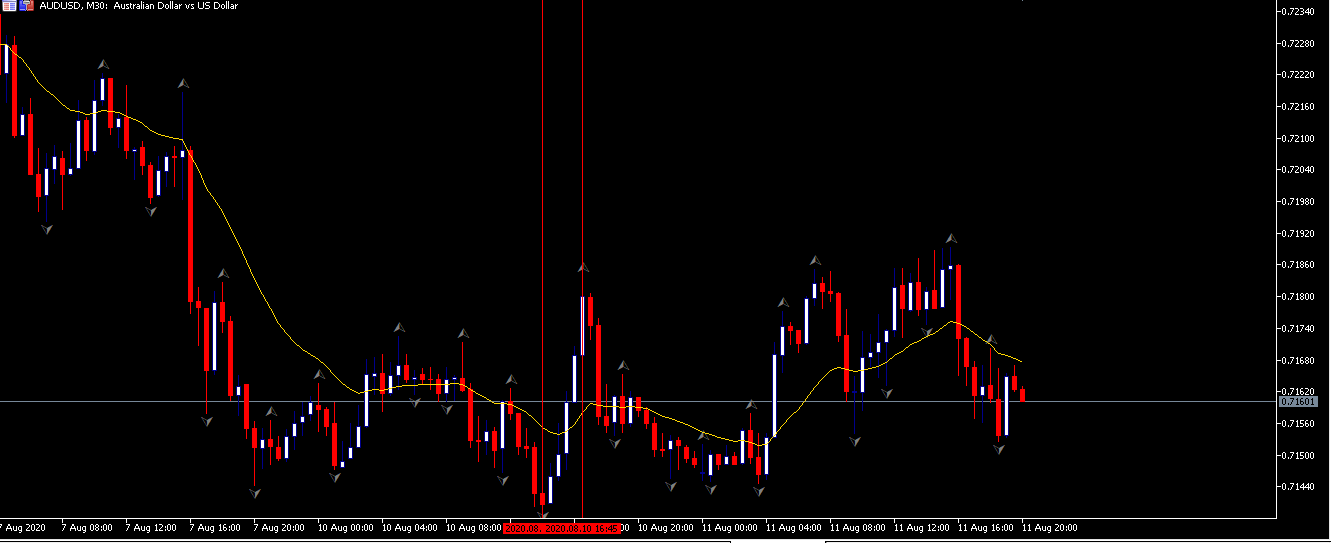
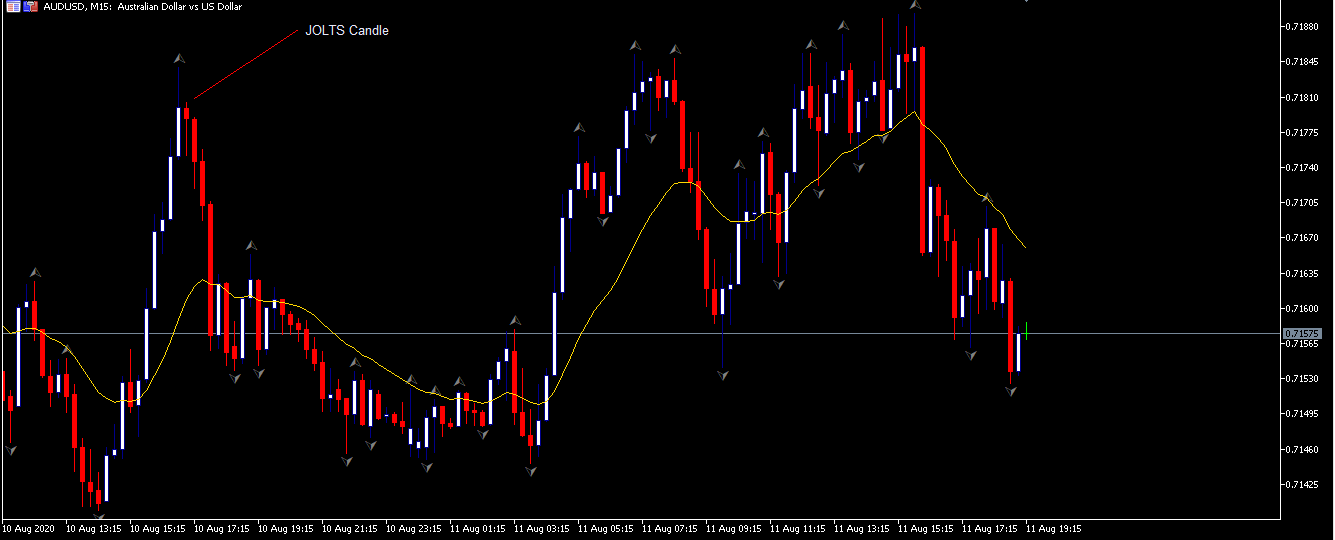
AUD/USD: Before JOLTS release August 10, 2020

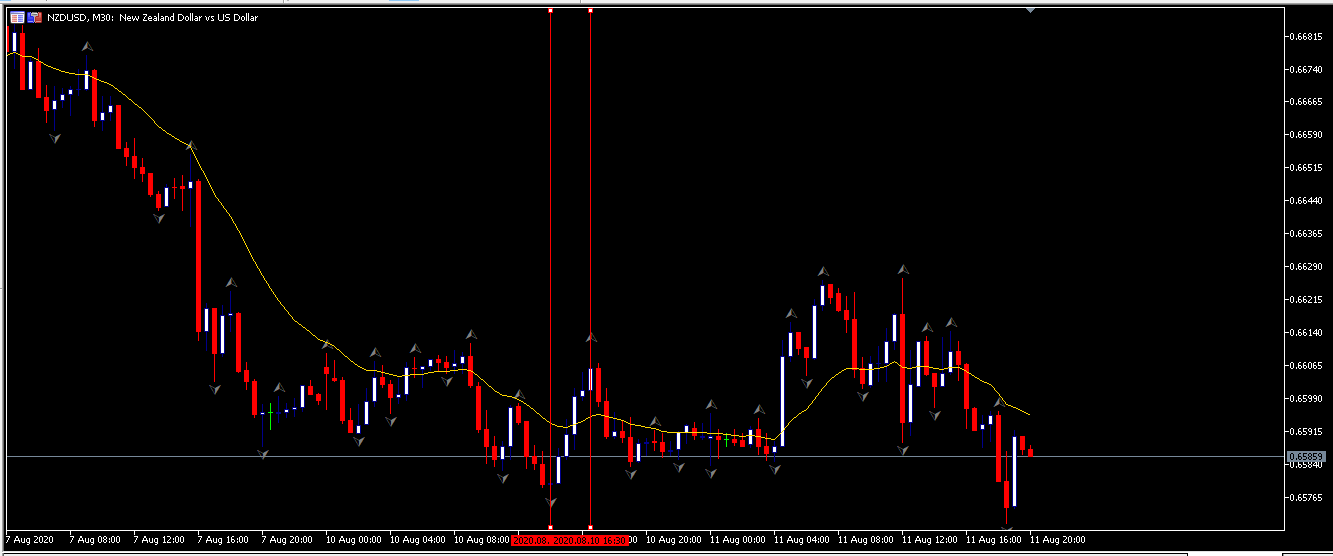
NZD/USD: Before JOLTS release August 10, 2020

It is evident that in such a period, going “long” in the market offers the best opportunity to take advantage of this short-term uptrend. However, since the general market trend is downward, we highly recommend following this trend.

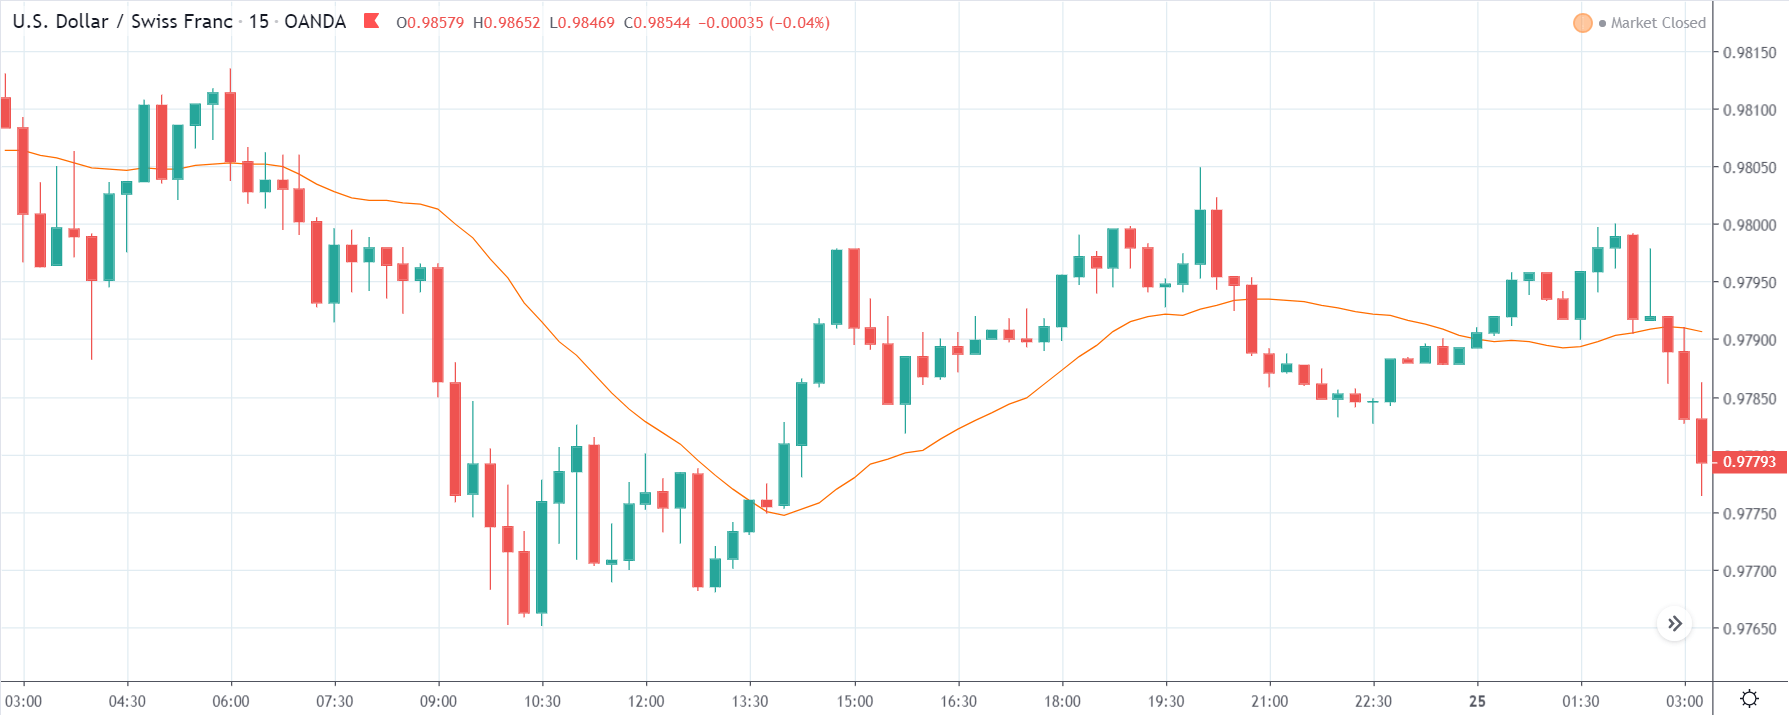
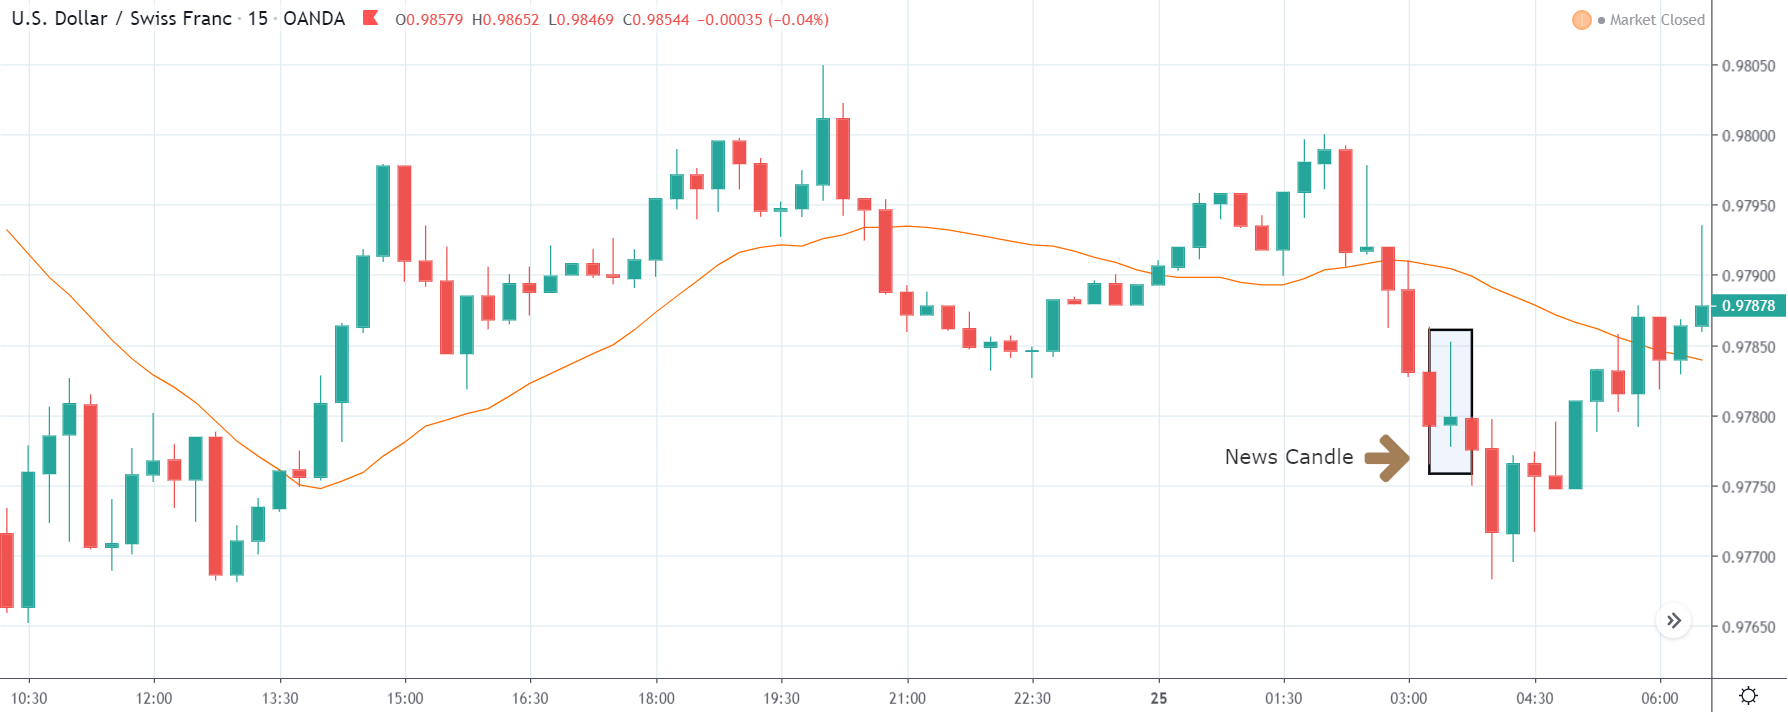
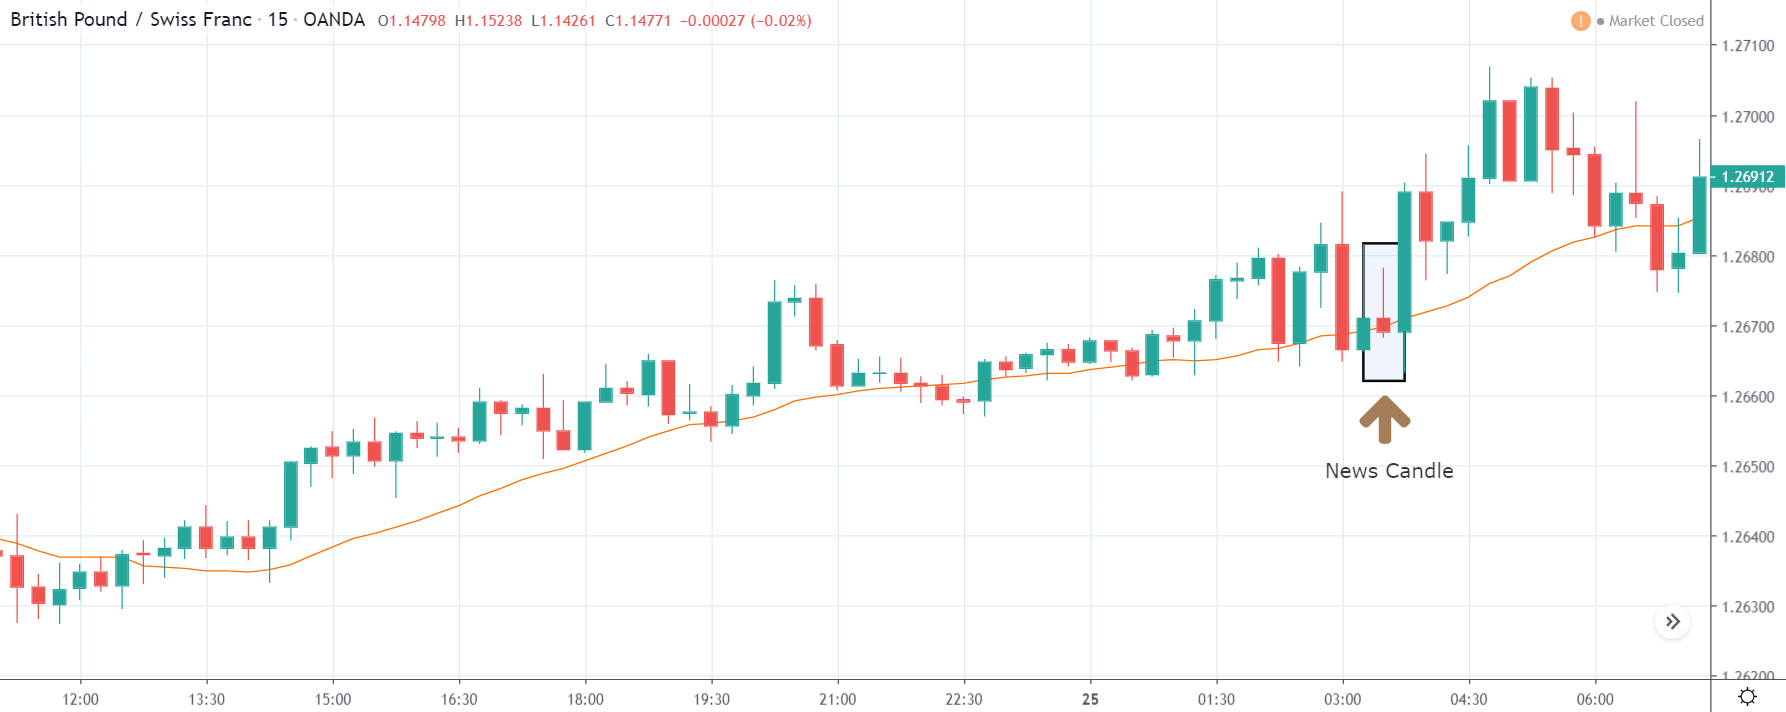
EUR/USD: After JOLTS release August 10, 2020, 1400 GMT

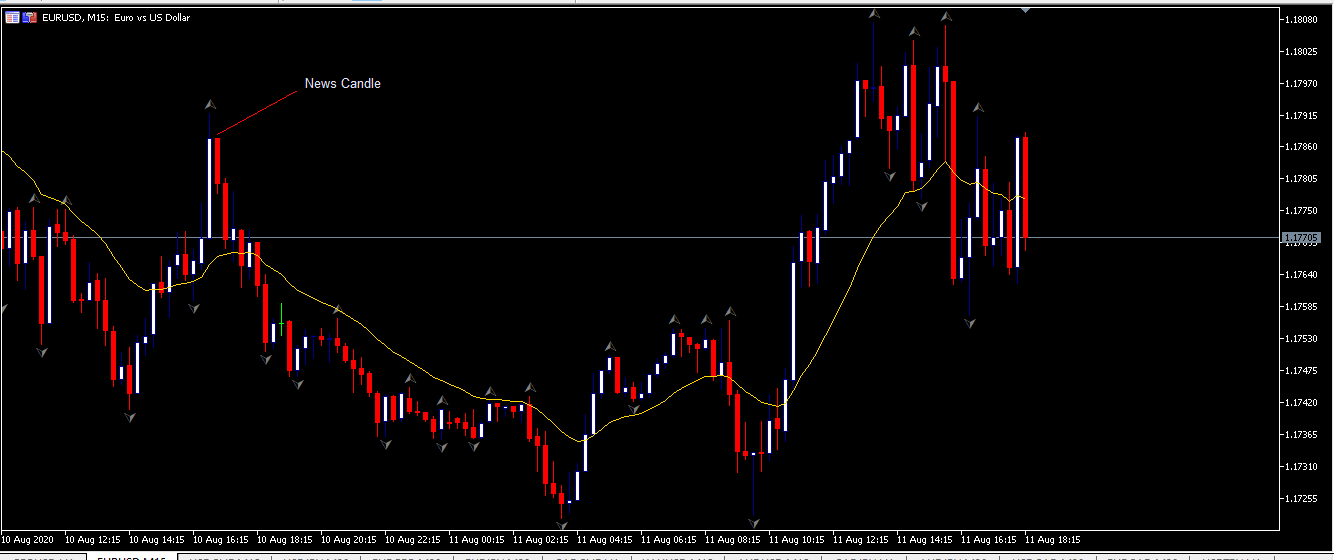
After the release of the better than expected JOLTS numbers, there is a consistent downtrend on the EUR/USD. The mere increase in the number of job openings triggered the USD strength against other currency pairs. It is worth noting that the release of the JOLTS numbers was strong enough to reverse the immediate uptrend seen immediately before the release.

The same reversal to a downtrend after news release can be observed for the AUD/USD and NZD/USD pairs as well. This trend is shown in the charts below.

AUD/USD: After JOLTS release August 10, 2020, 1400 GMT

NZD/USD: After JOLTS release August 10, 2020, 1400 GMT

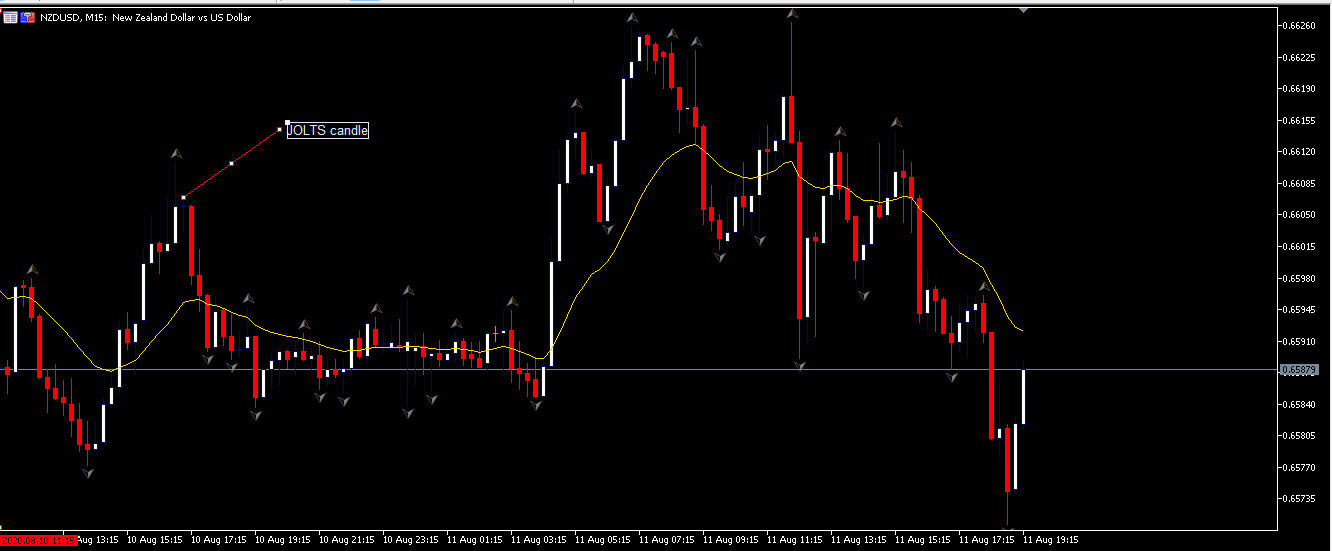
The positive job vacancies news had a significant impact on the strength of USD against other currencies. This strength is because the better than expected job openings signify that the US economy is on a recovery path following the effects of the Coronavirus pandemic.

Categories
Forex Fundamental Analysis

What Is ‘Employment Change’ & How Can This Data Be Used For Our Analysis?

Introduction

Employment statistics are closely watched by the market because of their direct effect on consumer spending. Consumer spending makes up over two-thirds of the country’s GDP for many countries. Hence, understanding Employment Change, its place in the reports, and its impact on market volatility are crucial for building reliable fundamental analysis.

What is Employment Change?

Employment

It is the state of having a paid job. A person is considered employed if it does any work for pay or profit. People who are eligible for employment are between the age of 15 and 64 and are called the working-age population.

Employment Change

Unlike most reports which are reported in percentage or ratios to understand the statistics better, the Employment Change reports the nominal change. Employment Change is the change in the number of jobs added or lost over the previous month.

For example, if there were 20,000 jobs in January, and, in February, the figure was 25,000 jobs, then the Employment change would be +5,000. If the total jobs in February were 10,000 only then the Employment Change would report -10,000. Hence, positive numbers indicate job growth or new jobs added to the economy. Conversely, negative numbers indicate jobs were removed from the economy.

It measures the estimated change in the number of employed people during the previous month, excluding the farming and government industry. Hence, it accounts for the non-farm payroll employees, that are widely used statistics to monitor employment levels.

How can the Employment Change numbers be used for analysis?

Employment is a politically and economically vital statistic in any country. High levels of unemployment threaten social structure, and the ruling party’s governance. There have been incidents in many examples, where high unemployment periods have led to an increased number of crime and suicide death rates. Hence, Central Authorities are politically committed to ensuring low levels of unemployment at all times.

High unemployment is terrible for the economy. As Consumer Spending makes more than 70% of the total Gross Domestic Product for many countries, it is no wonder employment statistics are one of the primary indicators in the currency markets. Employment has a direct effect on Consumer Spending. As more people are employed, more people have disposable cash to meet their needs and discretionary spending. Hence, high employment boosts Consumer Spending, which in turn propels the GDP higher.

High unemployment levels tend to have a ripple effect on the economy, as jobs removed from one sector also tends to induce the same effect on dependent industries, and on a smaller scale on indirectly dependent industries and the overall economy.

For instance, if a car manufacturing company has a slow down in business, and decides to lay off half of its staff, then the company supplying tires to this company will also see reduced demand, leading to the same lay off and reduction in business. Also, indirectly dependent industries like car paint and servicing shops, car perfume selling shops would similarly take a hit. Hence, we see how lay-offs in one sector tend to creep into other sectors as well.

Also, during this cascading effect, there is a definite impact on consumer sentiment as well. A drop in consumer confidence also discourages the spending habits of people, which further impacts consumer spending. Hence, people who are still employed are also affected by unemployment in one or the other way. People generally start saving for a rainy day when employment levels drop, thinking their turn is also around the corner. Generally, industries dealing with luxury and recreation tend to take the worst hit during economic slowdowns and recessions.

Employment Change is a nominal figure that is a little misleading and confusing to correctly analyze the severity of positive or negative numbers as it is a function of the population. A country showing -10,000 jobs lost over the previous month could be ignorable for a country like India or China where the population is vast, and critical for small countries where the population is just in a few million. Hence, people generally prefer the unemployment rate and other percentage metrics to analyze the severity of the country’s employment situation correctly.

Impact on Currency

Even though it is a nominal figure, this report’s earliness gives it an edge over other reports, as traders are always looking to be ahead of the game and beat the market trend before it sets in. Hence, seasoned traders look at the Employment Change reports and analyze them historically to make investment decisions before market trends are set in motion. Hence, there tends to be a lot of market volatility around Employment Change reports.

Employment Change is a coincident and high impact indicator that can generate enough market volatility during significant changes in the reports. It is always best to combine reports with initial jobless claims reports, non-farm payroll statistics to build a broader understanding in the long-term to correctly trade these short and long-term volatilities around the time of report’s releases.

Economic Reports

In the United States, the Bureau of Labor Statistics (BLS) publishes monthly, quarterly, semi-annually, and yearly reports of the Employment change seasonally adjusted figures on its website. The report classifies change in employment as per the major industry sectors.

ADP publishes Employment Change reports on its official website about two days after a month ends. Hence, it is a day or two earlier than other employment situation reports published by BLS. ADP Non-farm employment change is the closely watched statistic before BLS releases its Employment Situation Report later.

Image Credit: U.S. Bureau of Labor Statistics

Sources of Employment Change

We can find the earliest Employment Change report from the ADP employment report.

The United States Bureau of Labor Statistics publishes monthly Employment Change, employment, and unemployment reports on its official website.

We can also find the same indexes and many others with a comprehensive summary and statistics of various categories on the St. Louis FRED.

Consolidated reports of Employment Change of most countries can also be found in Trading Economics.

That’s about ‘Employment Change’ fundamental Forex driver. As mentioned above, the impact of this indicator’s new release on the Forex price charts is minimal. However, if we combine them with other credible employment data like initial jobless claims and non-farm payroll statistics, we can get a broader understanding, which is crucial. Cheers!

Categories
Forex Fundamental Analysis

‘Employed Persons’ – Impact Of This Fundamental Driver On The Forex Market

Introduction

The number of people who hold a legal job, or conversely, the percentage of unemployed people is a direct gauger for a country’s economic health. It is one of the most obvious and direct reflectors of a nation’s health. Common people often misinterpret the rate of employment or unemployment as we will see next, Due to which a good background understanding of what such numbers reflect is paramount for economic analysis.

What is Employment?

An individual who gets paid for a certain work he/she performs is said to be “Employed.” People work to earn a living and make ends meet at the most basic level and once these requirements are met people work to improve their standard of living through more work or better work or switching place of work etc.

There are a variety of modes through which an individual within a nation can find work. For example, an individual can be a freelancer or a regular employee in an organization or even run his or her own business and be called self-employed.

How is the Employed Persons’ Statistic calculated?

In this regard, The Bureau of Labor Statistics (BLS) has left no stone unturned. The range of data that is available with them regarding the employment situation is huge. BLS surveys and tracks monthly employment and unemployment situation within the country and classifies them based on geographical region, sex, race, industry, etc.

The technique employed by BLS is called the Current Population Survey (CPS). Since asking every individual in the country every month about his employment status and verifying those details is an impractical task Government employs CPS to survey the data.

CPS survey takes in about sixty thousand eligible households. The selected households, going to be surveyed, are representative of all geographical locations within the nation hence making it a miniature version of the country’s population. The authorities also take care of not repeating the same surveyed members in succession and make sure that no one household is survey consecutively more than four times.

Neither the surveyor nor the surveyed person does not directly ask or get to decide their employment status. The surveyors ask a specific set of questions which and the responses to these questions are decoded by computer algorithms to determine the status of the individual automatically. Once the data is collected and calculated, based on a wide variety of factors, like race, ethnicity, age, gender, and residing state, they are categorized.

Why is the Employment Situation important?

The Employment Situation report published by the Bureau of Labor Statistics in the United States goes as far back as the 1940s. Hence, there is good confidence in the data set due to its range and good accuracy in assessing and predicting economic activity within a nation.

The importance of employment rate, employment-to-population ratio, unemployment rate, or any other employment metric is understood when we understand the interaction of various economic factors on each other and how one coherently affects the other.

If the number of employed people within a country increases, it means the number of people who are getting paid is more, which means more money is in circulation in the economy;  This means that more people now have the purchasing power to procure produces and thereby increasing the overall consumption of goods and services within the nation. When the consumption is on the rise, it means the demand is on the rise, which makes the business flourish, which in turn can increase the need for more employment or give the industries a good push towards growth. Overall, either more people will be employed, and some of the currently employed sections of people may enjoy better pays over time due to flourishing business.

We understand here there is positive feedback within an economy where one section feedback into other sections of the society and growth compounds and macroeconomic metrics like Gross Domestic Products reflect these positively, giving further confidence to policymakers, investors, and foreign businesses.

Here we have seen above how such a simple statistic can imply such big macroeconomic conditions of a nation. No wonder why BLS has such a diverse set of employment survey statistics released every month, which receives such huge media attention. For instance, Every month, when the nonfarm payroll numbers also are released, it is closely watched by many analysts, people in business, investors, and traders all over to make critical decisions. Employment reports based on industrial sectors can also give investors a good idea of different sector’s performances and help them make informed investment decisions.

How can the Employed Persons’ Report be Used for Analysis?

As useful as the Employment reports that are released every month, they are equally tricky to understand. For example, below is a snapshot of “All Employees, Total Nonfarm (PAYEMS) ” from the St. Louis Federal Reserve Economic Data (FRED)

When we see the above graph, one might think that the nation’s economy has been continuously growing, but that is not the case as the employment graph here is simply a function of population. Certainly, the population has increased from 1940 to 2020; hence the graph may seem increasing, but it is not solely because of improvements in the economic conditions of the country. We should also pay attention as some of the statistics of employment are not seasonally adjusted values meaning that during certain months of the year employment is on the low, and conversely, there seems to be an increase in unemployment like in January and February where seasonal jobs like construction are on a slowdown. Hence low numbers during these periods do not signal an economic contraction or slowdown in the economy.

Unemployment rate statistics are also used by Policymakers to assess causes of unemployment and take the necessary action to rectify the same. Investors use to assess the performance of certain industrial sectors before deciding to invest within a particular sector of a country. Many people use different categories of employment and unemployment statistic to analyze which sectors are facing slowdowns, layoffs, and which sectors have possible employment opportunities.

Apart from all these media, institutions, economic analysts all use these statistics in its diverse forms for their specific purposes.

Sources of Employment Reports

The U.S. Bureau of Labor Statistics is responsible for releasing this data, and that data can be found here – Employment | Unemployment

You can also find the data related to Employed Persons on the St. Louis Fed website.

Impact of the ‘Bank Lending Rate’ news release on the price charts

Just as how the unemployment rate plays a major role in fundamental analysis and determines the state, the economy, employment level is an equally important fundamental indicator. The employment level measures the number of people employed during the previous quarter. It gives the number of jobs created in an economy during a quarter. We understood in the previous section of the article that Job Creation is directly related to consumer spending. Therefore, it is a high impactful event. Even though most countries release unemployment data on a monthly, there are few countries that announce the number of Employed Persons in a quarter.

In today’s article will be analyzing the 4th quarter employment data of Switzerland, which was released in the month of February. A forecasted data of Employment level is not available as investors rely more on the unemployment rate for making investment decisions. The Employment level of Switzerland is released by the ‘Federal Statistical Office.’ A higher than previous reading is taken to be positive for the currency, while lower than previous reading is considered to be negative.

EUR/CHF | Before the announcement:

We shall start with the EUR/CHF currency pair where, in the above chart, we see that before the news announcement, the market has shown signs of reversal and is getting ready for a major event. Technically, the chart is in a perfect spot for taking a ‘short’ trade as this is a perfect reversal pattern. Therefore, aggressive traders with large risk appetite can enter the market with bigger stop loss since there can be a sudden surge in volatility after the news release. However, conservative traders should wait for the announcement and then take a suitable position.

EUR/CHF | After the announcement:

As we can see in the above chart, the price quickly goes up until its most recent high but immediately gets sold. The reason behind this increase in volatility to the upside is a lower number of employed persons in the 4th quarter compared to the previous quarter. Since the data was weak, traders sold Swiss Franc and bought Euro.

But later we notice that the candle leaves a big wick on the top and closes near its opening price. This means the data was not hugely worse, and since it was close to the previous quarter’s reading, there is a shift in volatility to the downside. This wick is a confirmation sign of the reversal, and now we can enter the market with a lower risk.

USD/CHF | Before the announcement:

USD/CHF | After the announcement:

The above images represent the USD/CHF currency pair where before the news announcement, we see a ranging action of the market and presently approaching the support area. Since the market is already volatile here, a news release can essentially augment this volatility on either side. In such market situations, one should wait for the news release and then take a position based on the data. However, the ‘options’ market can offer an advantage of this volatility and hence can be traded by few.

After the news announcement, the currency moves similarly as in the above pair, where the volatility initially increases on the upside and later retraces back. An important thing we need to notice here is, we are very close to the support area, and hence going ‘short’ can be risky. This is how technical analysis can be useful.

GBP/CHF | Before the announcement:

GBP/CHF | After the announcement:

Before the news announcement, we see that the GBP/CHF currency pair is in an uptrend pointing towards the weakness of Swiss Franc. This chart seems to be behaving opposite to that of EUR/CHF, where the uptrend is very strong with no sign of reversal. One of the reasons for this trending nature could be due to the strength in British Pound with little influence of Swiss Franc.

After the news announcement, we observe that the Employment data has the least impact on this pair, and the price fails to fall below and remains above the moving average. Since we don’t witness a drastic change in volatility, the only way to trade this pair is by waiting for an appropriate retracement and using technical indicators to join the trend.

That’s about ‘Employed Persons’ and its impact on the Forex market after its news release. If you have any questions, please let us know in the comments below. Good luck!