
Introduction
The labor market plays play a crucial role in determining the strength of the economy. Perhaps one of the most closely watched fundamental economic indicator is the unemployment rate since it is one of the leading indicators of demand. The growth of any economy is entirely dependent on the forces of demand and supply. Entire industries have been built by surging demand and crippled by lack of it.
Understanding Job Cuts
Job cuts represent the number of corporate employees who have been laid off over a given period. The job cuts report shows the national number of people who were laid off. This number is further broken down by industry, ranking those with the most job cuts to the least. The job cuts are compared monthly, quarter-on-quarter, yearly, and year-to-date. The report goes further to include the hiring plans announced by the various sectors, thus showing the potential number of job vacancies.
Therefore, we notice that the job cuts report serves to show job losses and future openings. Thus, it is a powerful indicator in the labor market and the economy since it can be used to predict whether recessions are coming, the state of economic recovery, and show the sentiment about the economy from employers’ perspective.
Using Job Cuts Report for Analysis
As an indicator of economic health, job cuts can signal the following.
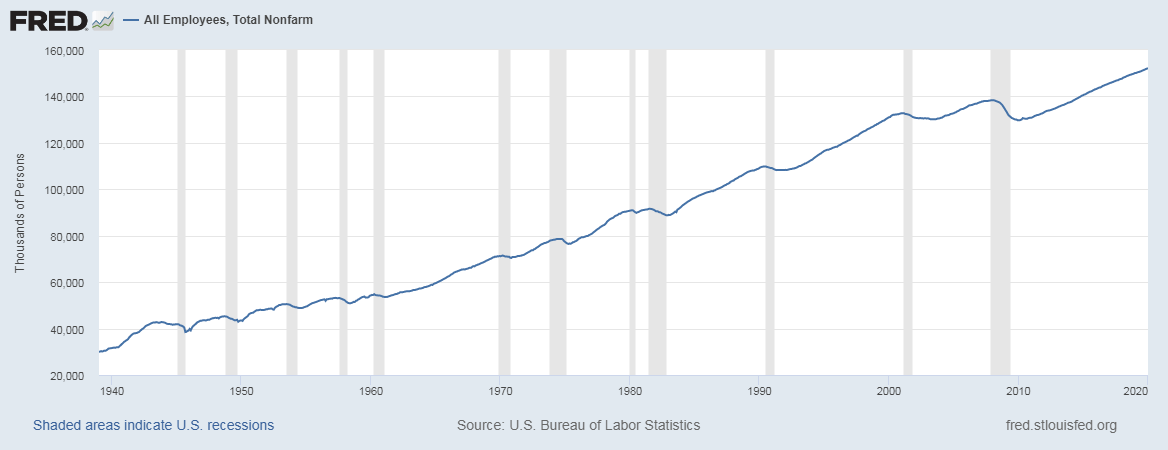
An increasing number of job cuts is a precursor to higher unemployment levels and signals a shrinking economy. It is considered a leading indicator of unemployment. With more and more people losing their jobs, households’ disposable income will be on a decline. Consequently, the aggregate demand in the economy will decline, and with it, the aggregate supply. These declines imply that producers are scaling down their operations, matching the lowering demand to avoid market price distortion.
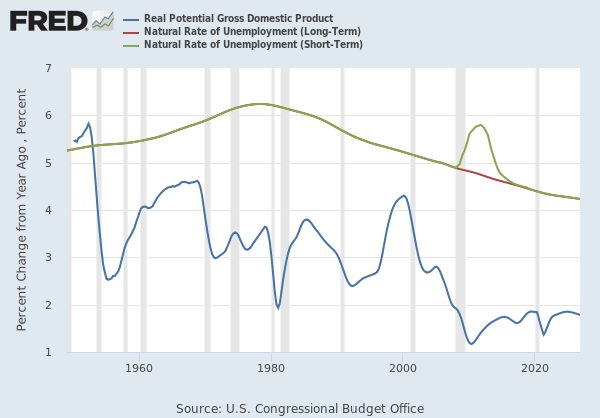
Source: St. Louis FRED
Since the job cuts report is categorized by industry, it serves to show which sectors of the economy are performing poorly. Job cuts are a result of the general challenging operating environment. It shows that companies are attempting to reduce operating costs as a result of a decline in demand. With this report, we can analyze which sectors are hard hit by tough economic times and which sectors are resilient. For investors, this analysis is instrumental in deciding which sector to invest in. the report can also be used to show which industries are worse affected by economic recessions.
It will be useful for policymakers to implement sector-specific policies to help cushion the labor market in the future. The job cuts report can be used to establish which economic sectors are susceptible to business cycles by analyzing which sectors have the most cuts in times of recessions. During a recession, the aggregate demand is falling, and when the economy is recovering, the aggregate demand increases. Thus, it is expected for job cuts to reduce in time of recovery and economic expansion.
Similarly, investors can use historical figures to help pinpoint the peak and trough levels of the business cycle. Typically, the economy has the most job cuts when the recession is at its worst. This point can be considered the trough – and it precedes a recovery. Here would be the optimal point of investing for investors who would want to capitalize on the effects of recovery. When the economic recovery is at its peak and unemployment levels are their lowest, it signifies that the economy might overheat.
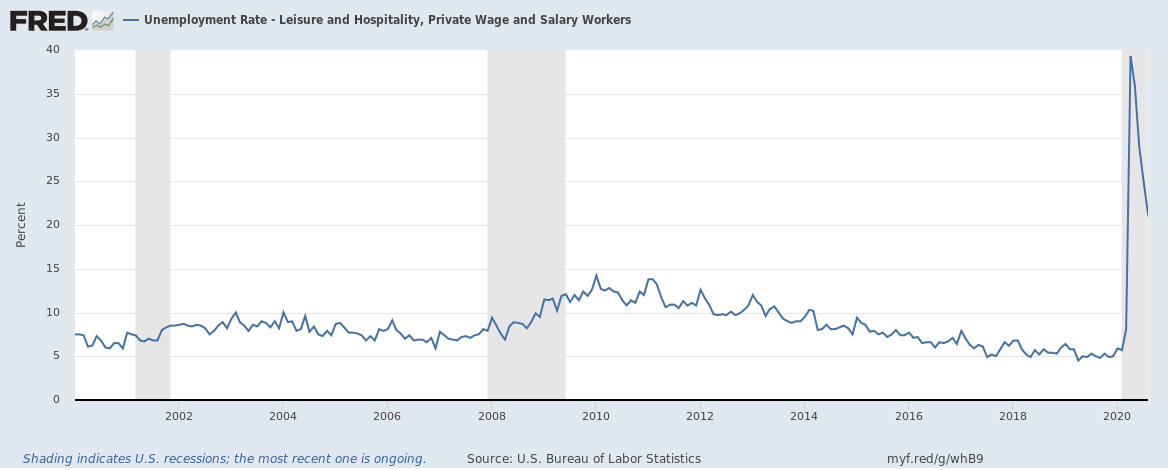
Source: St. Louis FRED
Together with the analysis of business cycles, the job cuts report can provide a clear picture of the number of temporary workers in the labor market. It goes to reason that in times of recovery, businesses tend to hire more workers. However, businesses most impacted by the economic cycles would opt to engage temporary labor instead. In times of recession, most of these jobs are lost. Therefore, the job cuts report can be used to identify which industries hire the most temporary workers.
Job cuts could also be a result of automation, not entirely because of a decrease in the aggregate demand. It is worth noting that the automation of business processes results in improved efficiency, higher output, and possibly higher quality of goods and services. While all these might be good for the businesses and possibly the economy, the effects of the jobs lost will still be reflected in the economy.
Impact on Currency
When analyzing the labor market, most forex traders concentrate their attention on the employment report. However, job cuts report is released ahead of the employment situation report; it can provide leading insights. Here are some of the ways job cuts can impact the forex market. The job cuts are used to forestall recessions and recoveries.
When the job cuts are increasing, it signals that the aggregate demand in the economy will decline. Businesses scaling down operations implies low investor confidence in the economy, which could mean there is a net outflow of capital. Increasing unemployment levels, a shrinking economy, and more households relying on the government social security programs signal a recession. Expansionary fiscal and monetary policies will be implemented. One such policy includes lowering interest rates, which make the currency depreciate relative to others.
A reduction in the job cuts signals economic recovery, making the currency increase in value relative to others. When job cuts are steadily reducing, businesses are retaining more of their employees as time goes by. This retention is a sign of improving economic fundamentals.
Sources of Data
Challenger, Gray & Christmas publishes the US job cuts data. Challenger, Gray & Christmas is a global outplacement and career transitioning firm. Comprehensive historical coverage of the US job cuts is accessed at Trading Economics.
How Job Cuts Data Release Affects Forex Price Charts?
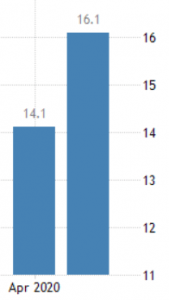
The most recent release of the US Challenger job cuts was on October 1, 2020, at 7.30 AM ET and accessed at Investing.com. The screengrab below is of the monthly Challenger job cuts.

Low volatility is to be expected when the job cuts report is released.
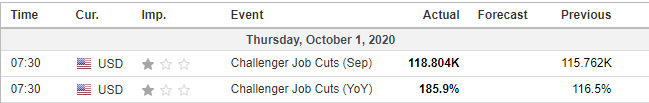
In September 2020, the number of US job cuts was 118.804K compared to 115.762K in August. In terms of the YoY change, the September job cuts represented a 185.9% change compared to a 116.5% change in August.
Now, let’s see how this release made an impact on the Forex price charts.
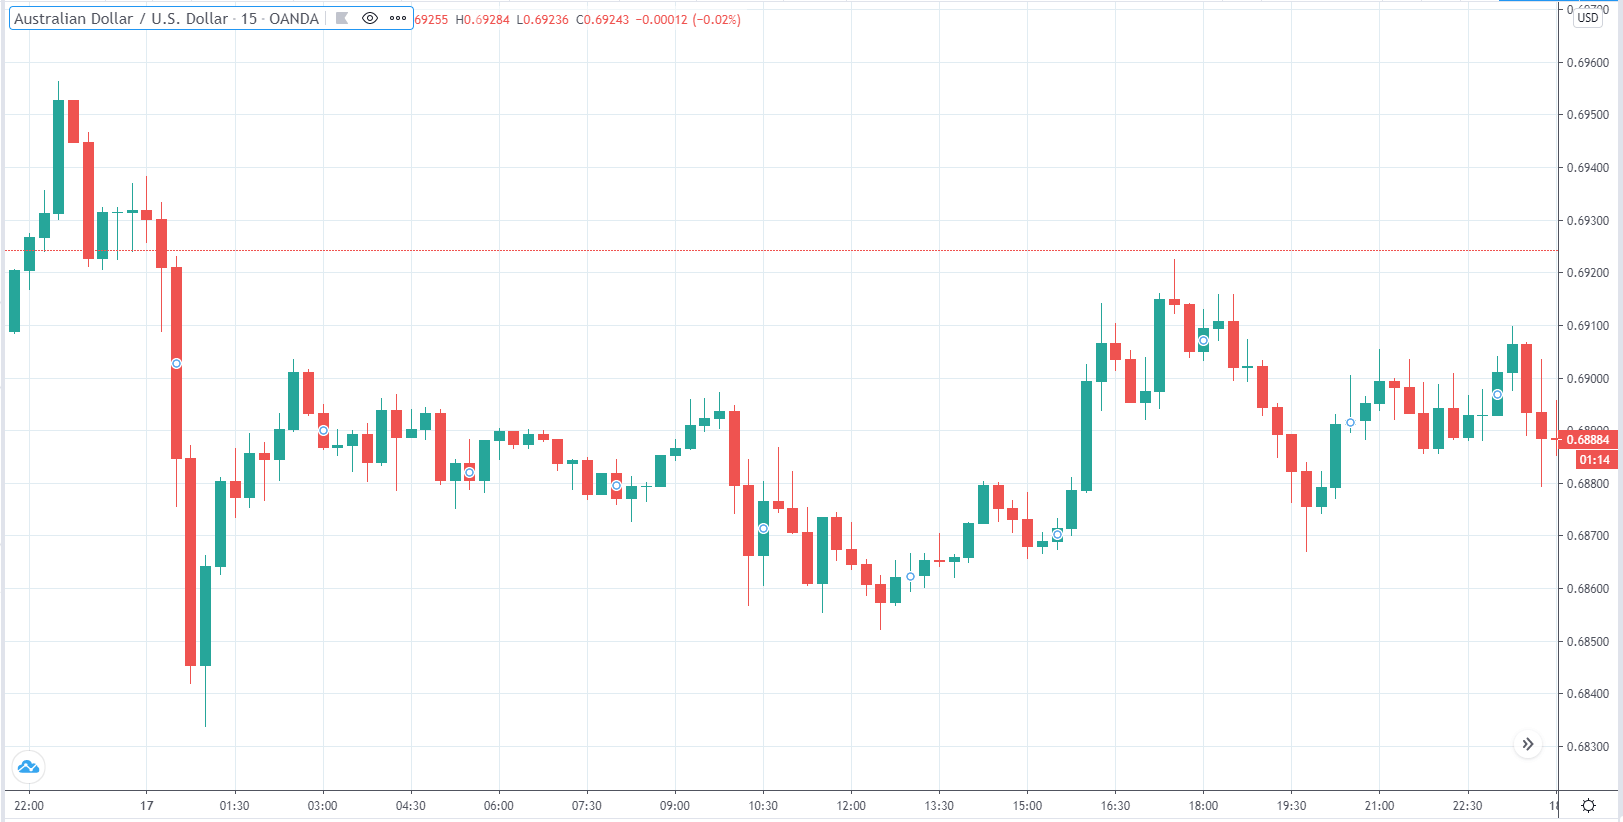
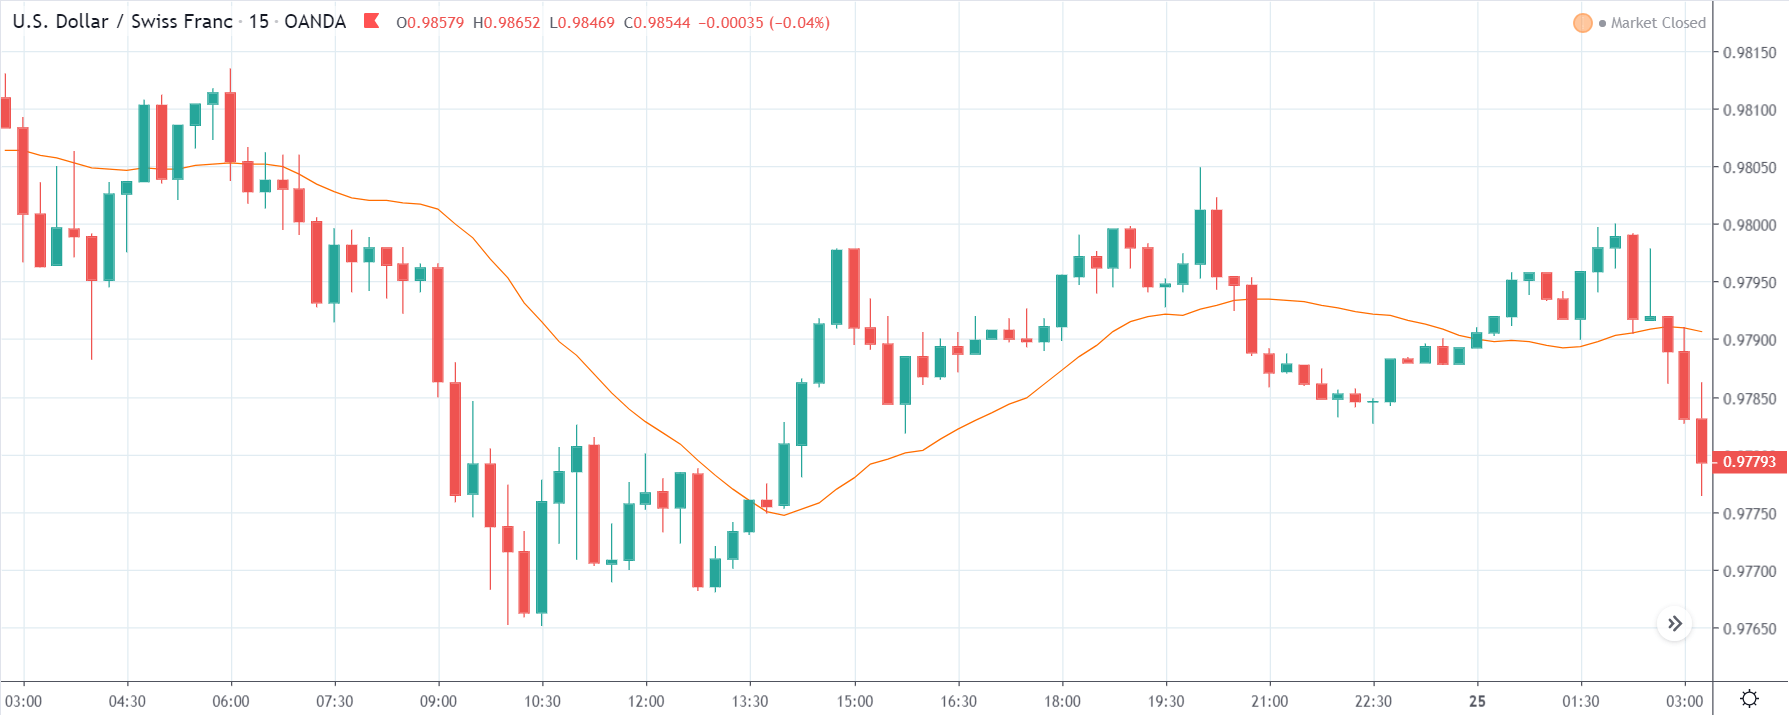
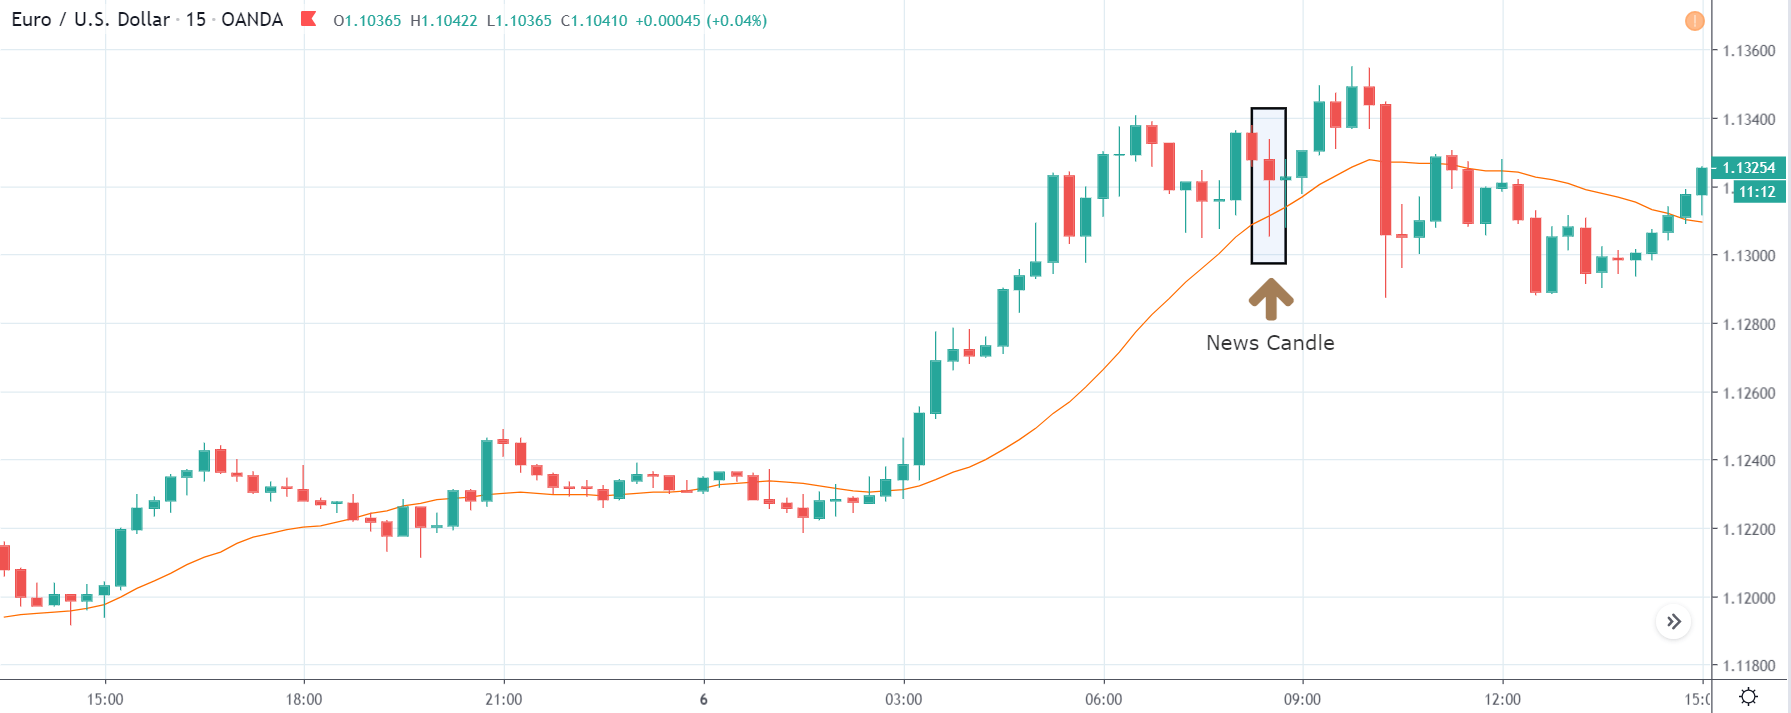
EUR/USD: Before the Challenger Job Cuts Release on October 1, 2020,
Just Before 7.30 AM ET
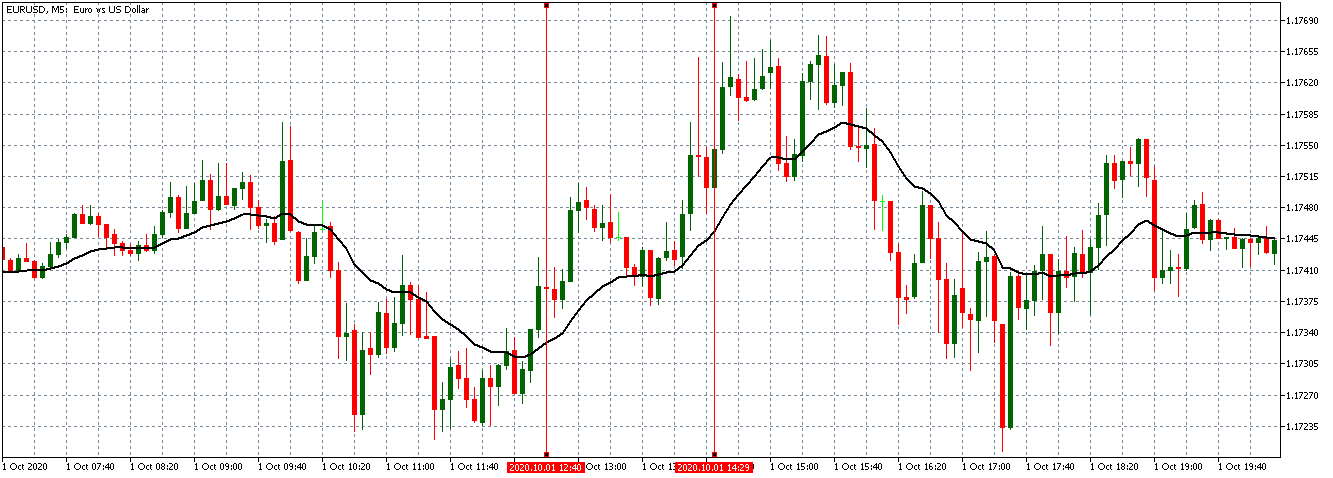
Before the new release, the EUR/USD pair was trading in a general uptrend. As shown in the above 5-minute chart, the candles were forming above a rising 20-period MA.
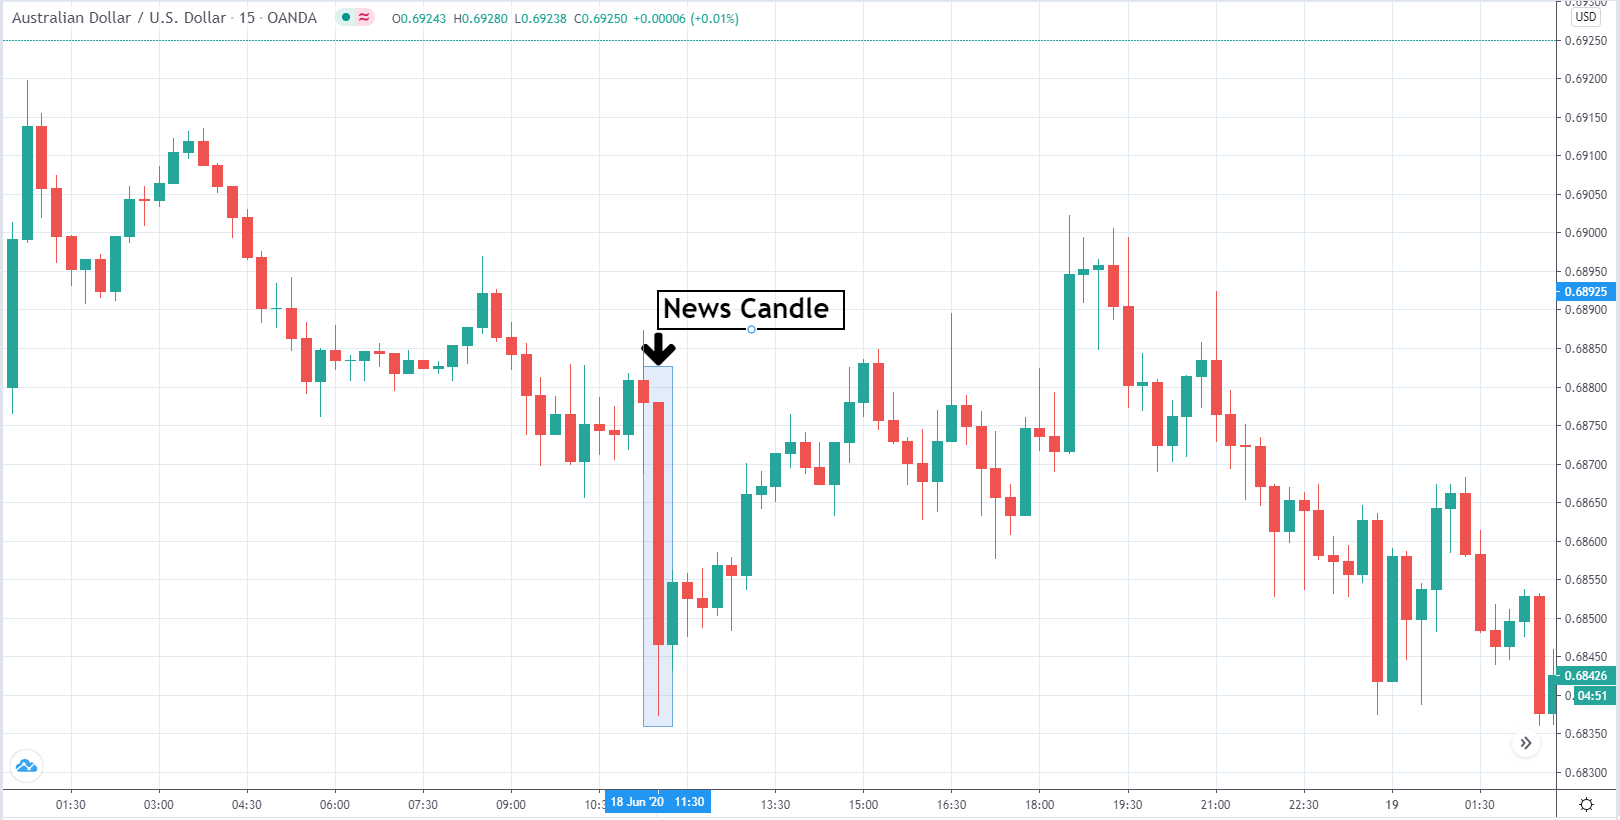
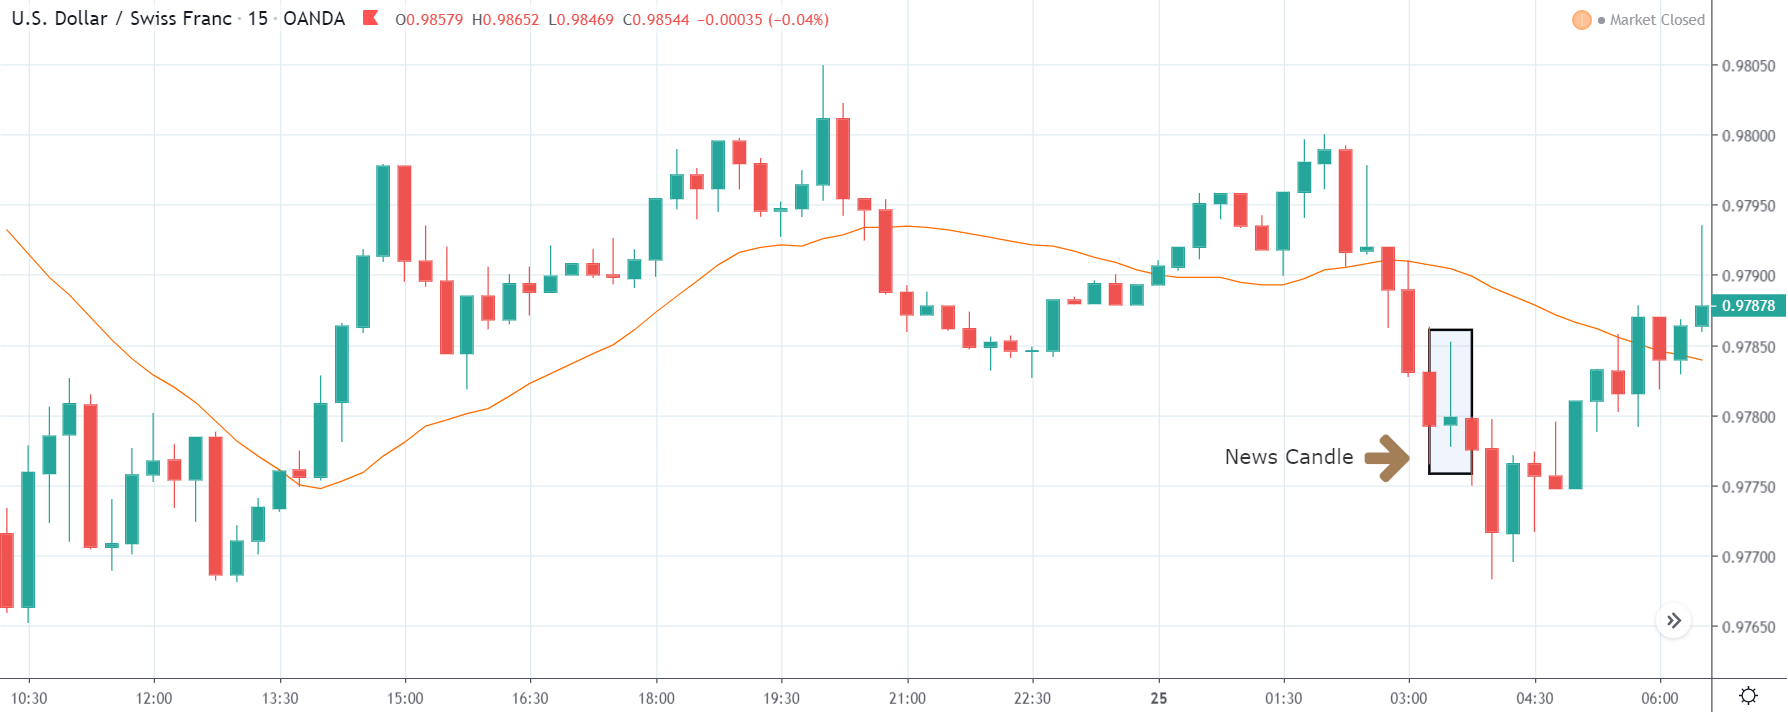
EUR/USD: After the Challenger Job Cuts Release on October 1, 2020,
at 7.30 AM ET
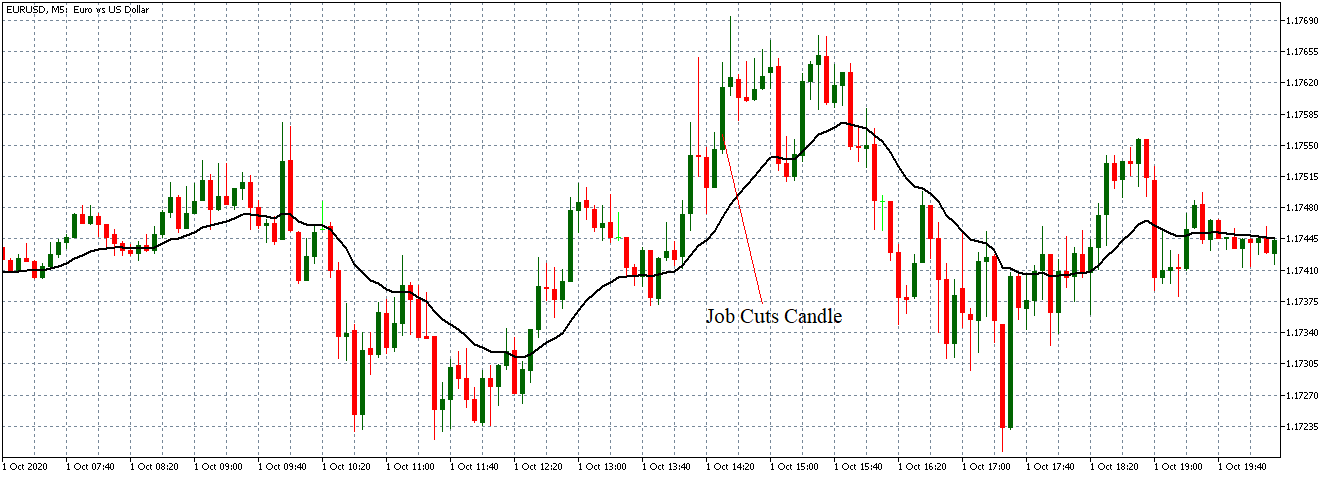
After the US job cuts report release, the pair formed a bullish 5-minute candle as expected, due to the weakening of the USD. Subsequently, the pair continued trading in a subdued uptrend with the 20-period MA flattening.
Bottom Line
The job cuts report plays a vital role in the economy, especially now, by showing the state of economic recovery from the coronavirus-induced recession. However, in the forex market, the job cuts report is a low-impact indicator since most traders and analysts pay the most attention to the employment situation report. The low impact nature can be seen as the release of the Challenger job cuts report failed to advance the bullish momentum of the EUR/USD pair.


