
Introduction
The number of people who hold a legal job, or conversely, the percentage of unemployed people is a direct gauger for a country’s economic health. It is one of the most obvious and direct reflectors of a nation’s health. Common people often misinterpret the rate of employment or unemployment as we will see next, Due to which a good background understanding of what such numbers reflect is paramount for economic analysis.

What is Employment?
An individual who gets paid for a certain work he/she performs is said to be “Employed.” People work to earn a living and make ends meet at the most basic level and once these requirements are met people work to improve their standard of living through more work or better work or switching place of work etc.
There are a variety of modes through which an individual within a nation can find work. For example, an individual can be a freelancer or a regular employee in an organization or even run his or her own business and be called self-employed.
How is the Employed Persons’ Statistic calculated?
In this regard, The Bureau of Labor Statistics (BLS) has left no stone unturned. The range of data that is available with them regarding the employment situation is huge. BLS surveys and tracks monthly employment and unemployment situation within the country and classifies them based on geographical region, sex, race, industry, etc.
The technique employed by BLS is called the Current Population Survey (CPS). Since asking every individual in the country every month about his employment status and verifying those details is an impractical task Government employs CPS to survey the data.
CPS survey takes in about sixty thousand eligible households. The selected households, going to be surveyed, are representative of all geographical locations within the nation hence making it a miniature version of the country’s population. The authorities also take care of not repeating the same surveyed members in succession and make sure that no one household is survey consecutively more than four times.
Neither the surveyor nor the surveyed person does not directly ask or get to decide their employment status. The surveyors ask a specific set of questions which and the responses to these questions are decoded by computer algorithms to determine the status of the individual automatically. Once the data is collected and calculated, based on a wide variety of factors, like race, ethnicity, age, gender, and residing state, they are categorized.
Why is the Employment Situation important?
The Employment Situation report published by the Bureau of Labor Statistics in the United States goes as far back as the 1940s. Hence, there is good confidence in the data set due to its range and good accuracy in assessing and predicting economic activity within a nation.
The importance of employment rate, employment-to-population ratio, unemployment rate, or any other employment metric is understood when we understand the interaction of various economic factors on each other and how one coherently affects the other.
If the number of employed people within a country increases, it means the number of people who are getting paid is more, which means more money is in circulation in the economy; This means that more people now have the purchasing power to procure produces and thereby increasing the overall consumption of goods and services within the nation. When the consumption is on the rise, it means the demand is on the rise, which makes the business flourish, which in turn can increase the need for more employment or give the industries a good push towards growth. Overall, either more people will be employed, and some of the currently employed sections of people may enjoy better pays over time due to flourishing business.
We understand here there is positive feedback within an economy where one section feedback into other sections of the society and growth compounds and macroeconomic metrics like Gross Domestic Products reflect these positively, giving further confidence to policymakers, investors, and foreign businesses.
Here we have seen above how such a simple statistic can imply such big macroeconomic conditions of a nation. No wonder why BLS has such a diverse set of employment survey statistics released every month, which receives such huge media attention. For instance, Every month, when the nonfarm payroll numbers also are released, it is closely watched by many analysts, people in business, investors, and traders all over to make critical decisions. Employment reports based on industrial sectors can also give investors a good idea of different sector’s performances and help them make informed investment decisions.
How can the Employed Persons’ Report be Used for Analysis?
As useful as the Employment reports that are released every month, they are equally tricky to understand. For example, below is a snapshot of “All Employees, Total Nonfarm (PAYEMS) ” from the St. Louis Federal Reserve Economic Data (FRED)
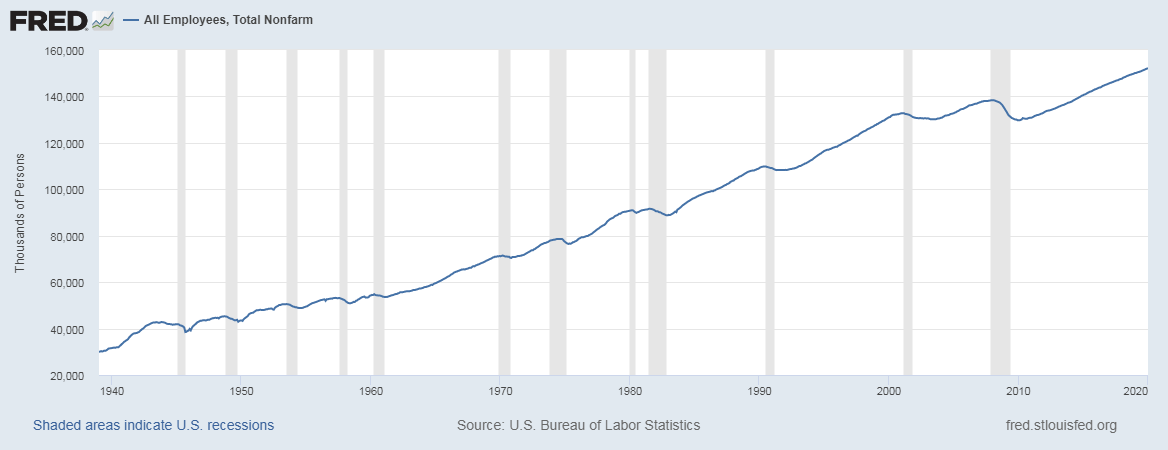
When we see the above graph, one might think that the nation’s economy has been continuously growing, but that is not the case as the employment graph here is simply a function of population. Certainly, the population has increased from 1940 to 2020; hence the graph may seem increasing, but it is not solely because of improvements in the economic conditions of the country. We should also pay attention as some of the statistics of employment are not seasonally adjusted values meaning that during certain months of the year employment is on the low, and conversely, there seems to be an increase in unemployment like in January and February where seasonal jobs like construction are on a slowdown. Hence low numbers during these periods do not signal an economic contraction or slowdown in the economy.
Unemployment rate statistics are also used by Policymakers to assess causes of unemployment and take the necessary action to rectify the same. Investors use to assess the performance of certain industrial sectors before deciding to invest within a particular sector of a country. Many people use different categories of employment and unemployment statistic to analyze which sectors are facing slowdowns, layoffs, and which sectors have possible employment opportunities.
Apart from all these media, institutions, economic analysts all use these statistics in its diverse forms for their specific purposes.
Sources of Employment Reports
The U.S. Bureau of Labor Statistics is responsible for releasing this data, and that data can be found here – Employment | Unemployment
You can also find the data related to Employed Persons on the St. Louis Fed website.
Impact of the ‘Bank Lending Rate’ news release on the price charts
Just as how the unemployment rate plays a major role in fundamental analysis and determines the state, the economy, employment level is an equally important fundamental indicator. The employment level measures the number of people employed during the previous quarter. It gives the number of jobs created in an economy during a quarter. We understood in the previous section of the article that Job Creation is directly related to consumer spending. Therefore, it is a high impactful event. Even though most countries release unemployment data on a monthly, there are few countries that announce the number of Employed Persons in a quarter.

In today’s article will be analyzing the 4th quarter employment data of Switzerland, which was released in the month of February. A forecasted data of Employment level is not available as investors rely more on the unemployment rate for making investment decisions. The Employment level of Switzerland is released by the ‘Federal Statistical Office.’ A higher than previous reading is taken to be positive for the currency, while lower than previous reading is considered to be negative.

EUR/CHF | Before the announcement:

We shall start with the EUR/CHF currency pair where, in the above chart, we see that before the news announcement, the market has shown signs of reversal and is getting ready for a major event. Technically, the chart is in a perfect spot for taking a ‘short’ trade as this is a perfect reversal pattern. Therefore, aggressive traders with large risk appetite can enter the market with bigger stop loss since there can be a sudden surge in volatility after the news release. However, conservative traders should wait for the announcement and then take a suitable position.
EUR/CHF | After the announcement:

As we can see in the above chart, the price quickly goes up until its most recent high but immediately gets sold. The reason behind this increase in volatility to the upside is a lower number of employed persons in the 4th quarter compared to the previous quarter. Since the data was weak, traders sold Swiss Franc and bought Euro.
But later we notice that the candle leaves a big wick on the top and closes near its opening price. This means the data was not hugely worse, and since it was close to the previous quarter’s reading, there is a shift in volatility to the downside. This wick is a confirmation sign of the reversal, and now we can enter the market with a lower risk.
USD/CHF | Before the announcement:
USD/CHF | After the announcement:
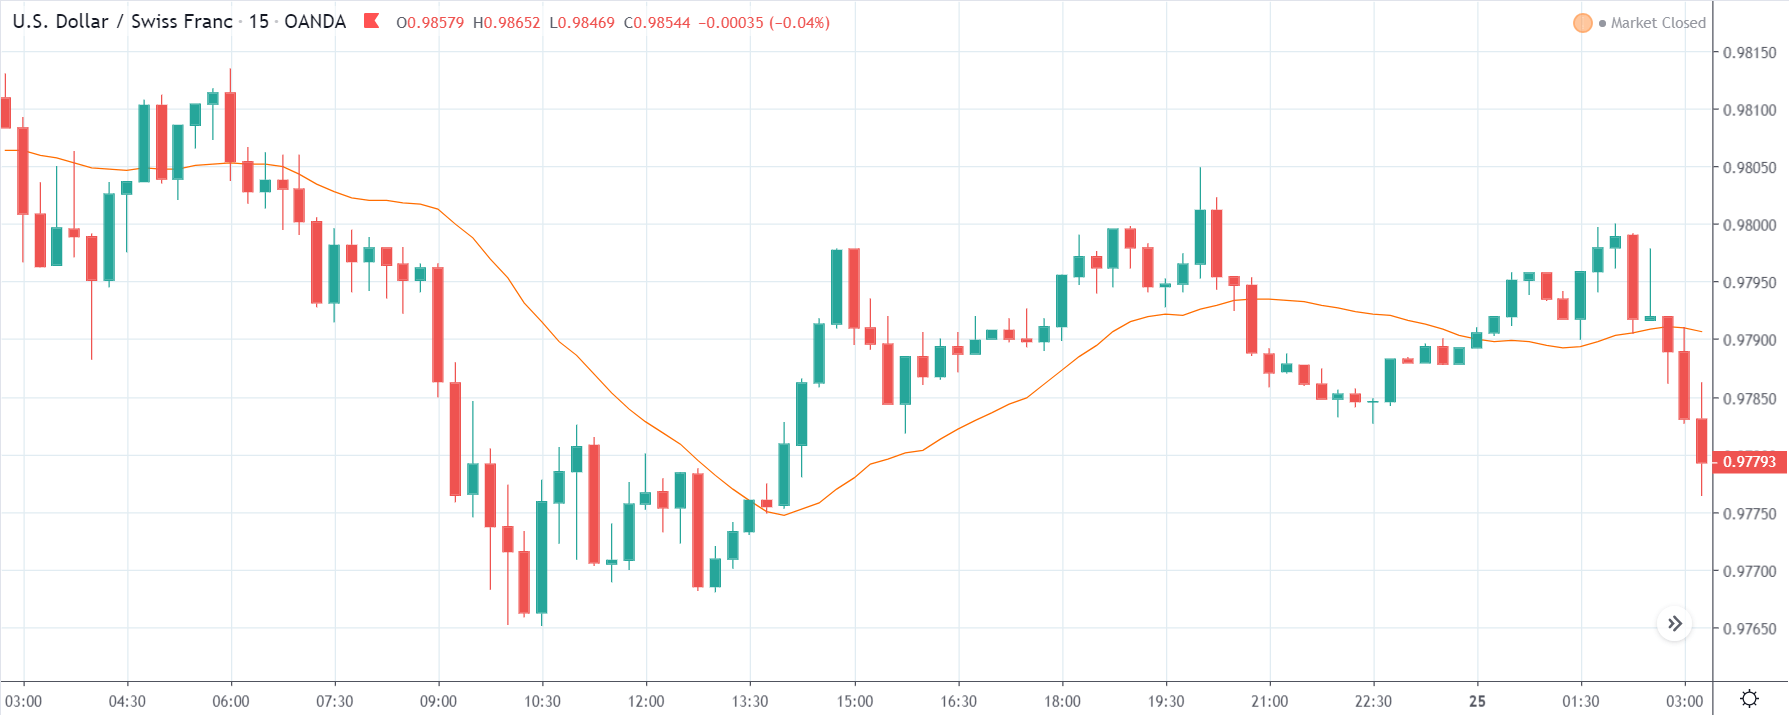
The above images represent the USD/CHF currency pair where before the news announcement, we see a ranging action of the market and presently approaching the support area. Since the market is already volatile here, a news release can essentially augment this volatility on either side. In such market situations, one should wait for the news release and then take a position based on the data. However, the ‘options’ market can offer an advantage of this volatility and hence can be traded by few.
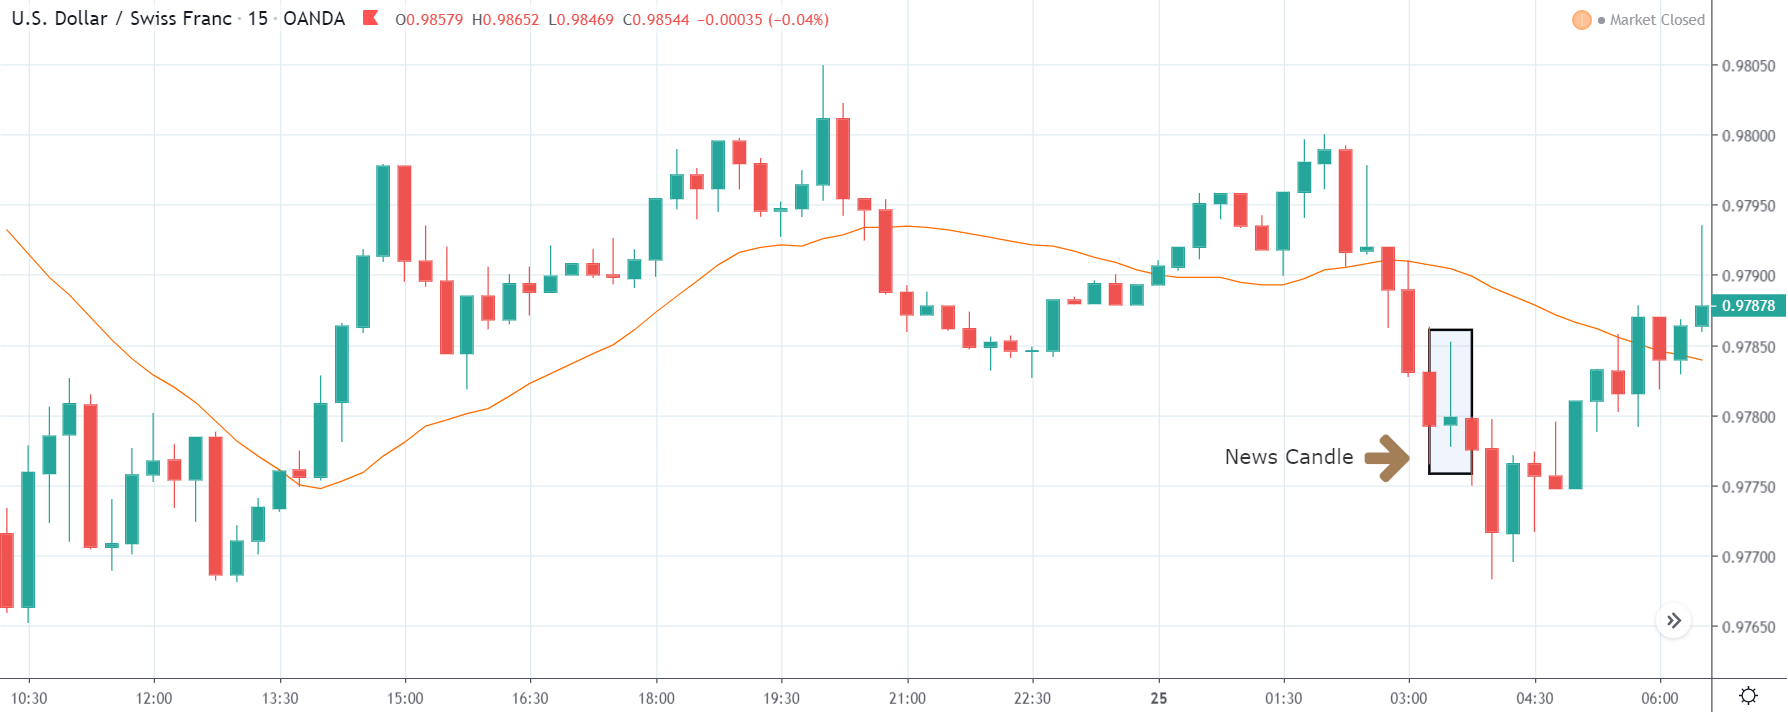
After the news announcement, the currency moves similarly as in the above pair, where the volatility initially increases on the upside and later retraces back. An important thing we need to notice here is, we are very close to the support area, and hence going ‘short’ can be risky. This is how technical analysis can be useful.
GBP/CHF | Before the announcement:
GBP/CHF | After the announcement:
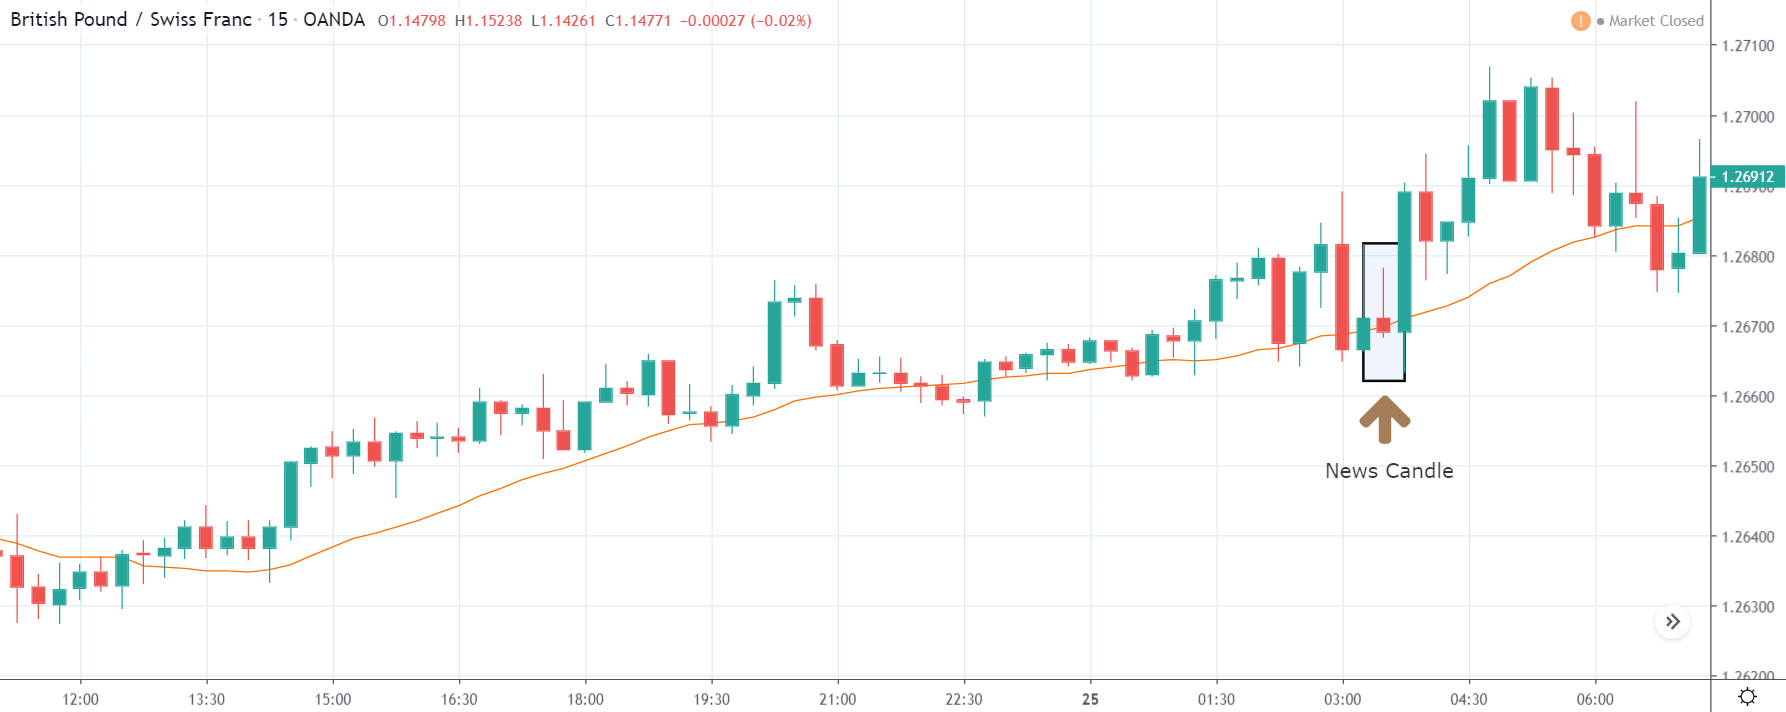
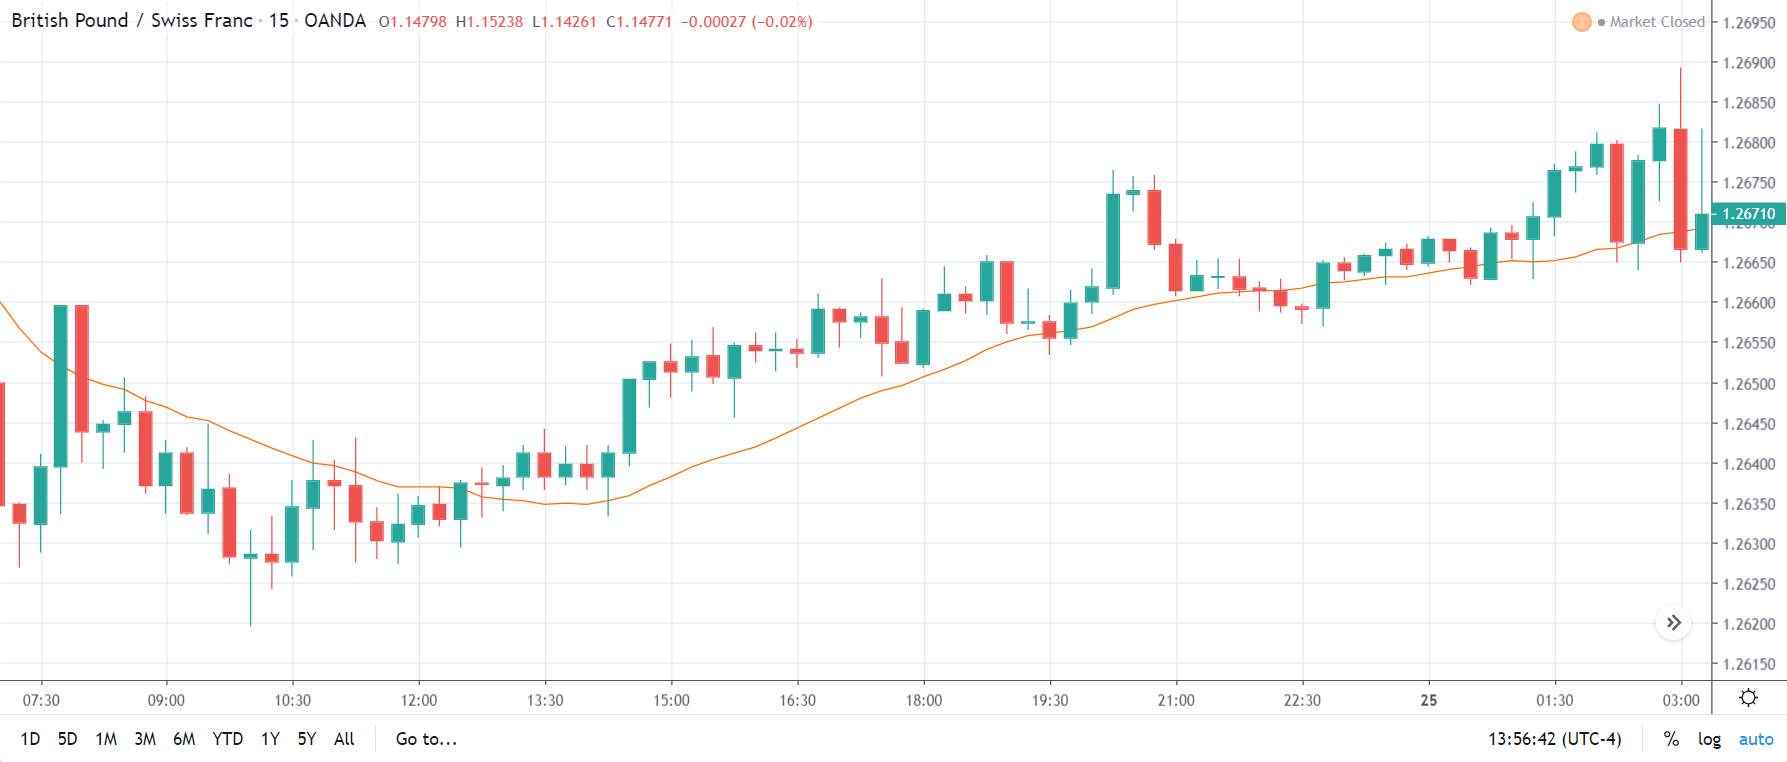
Before the news announcement, we see that the GBP/CHF currency pair is in an uptrend pointing towards the weakness of Swiss Franc. This chart seems to be behaving opposite to that of EUR/CHF, where the uptrend is very strong with no sign of reversal. One of the reasons for this trending nature could be due to the strength in British Pound with little influence of Swiss Franc.
After the news announcement, we observe that the Employment data has the least impact on this pair, and the price fails to fall below and remains above the moving average. Since we don’t witness a drastic change in volatility, the only way to trade this pair is by waiting for an appropriate retracement and using technical indicators to join the trend.
That’s about ‘Employed Persons’ and its impact on the Forex market after its news release. If you have any questions, please let us know in the comments below. Good luck!