
Introduction
Manufacturing Production statistics are a direct measure of current economic activity. It is instrumental for investors to get a correct estimate of current industrial activity. The Manufacturing Production Index also provides the capacity at which the industries are operating at which is useful for Government officials and business owners for planning and optimizing the performance of these industries. For economists, it helps to cut through media propaganda easily as the numbers reveal the real present situations of these industries and help analyze economic performance better.
What is Manufacturing Production?
Manufacturing Production, also called Industrial Production (IP) Index, measures the real or genuine output of the mining, manufacturing, and electric and gas utility industries. Hence, it covers some of the most important industrial sectors that play a significant role in economic growth and society’s sustenance.
Manufacturing Production Index is a measure of current industrial output. The Index’s reference period is 2012, which means that for the year 2012, the IP Index score is 100. All the scores that are published thereafter are in reference to this period. Hence, it is in a way it is a report card for the industrial sector’s final production output. The report also includes capacity utilization statistics that tell us at what percent of maximum capacity are different industrial sectors are operating at.
In the United States, the Manufacturing Production figures are taken from production data of all industries included in the North American Industry Classification System (NAICS) and industries like logging, newspaper, periodical, book, and directory publishing that have been traditionally considered to be Manufacturing.
The individual indices of Industrial Production (IP) are constructed through two sources:
- Output measured in physical units.
- The output is inferred from the data on inputs to the production process.
The IP index measures the output of individual industries taking their weightage derived from the proportional contribution of that industry to the combined output of all industries.
How can the Manufacturing Production numbers be used for analysis?
If we are to be very strict with our analysis, then Manufacturing Production figures are coincident or current indicators when compared against New Orders Figures of the Institute of Supply Management’s Purchasing Manager’s Index. It is more indicative of the current trend rather than a future trend. A decrease in New Orders is more indicative of future Production while Industrial Production (IP) Index is more current.
Although, since it is a monthly report, some use it as a leading indicator to oncoming economic turns as generally, these indices are indicative of ripple effects through employment, wages, and business activity.
Hence, it is more appropriate to take IP numbers as current economic indicators and use it to verify the fundamental trends that have been predicted by other leading indicators. We can use IP figures to identify whether our predicted trends have started to play out or not.
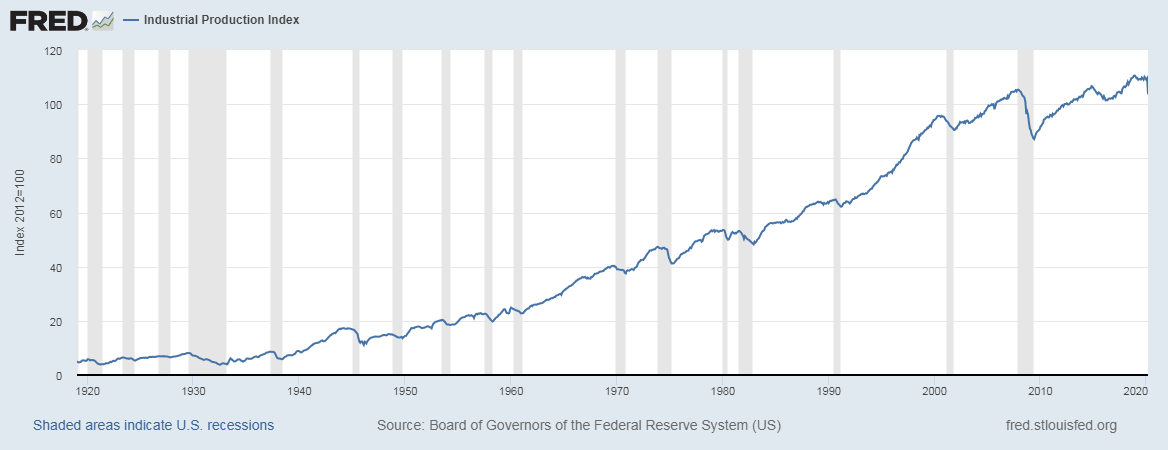
The data set for the IP index goes back to 1920, and hence it is a very reliable measure of economic activity, as shown above.
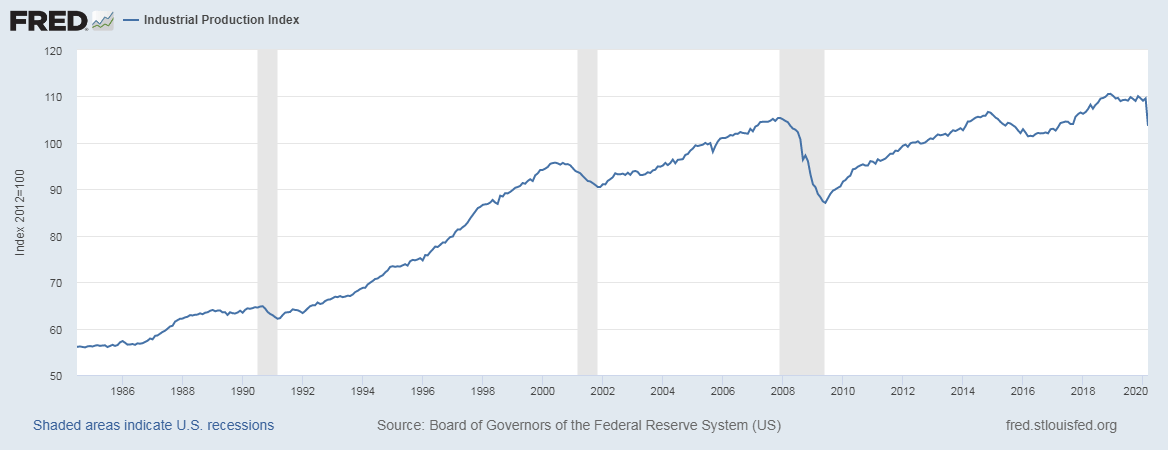
Below is the zoomed-in period of IP index, where we can see during the recession the IP index accurately depicts the economic conditions for that period. Through this, we can understand that the IP index is a double check for us to understand the current economic situation correctly. It is a one-for-one measure of economic activity.
Impact on Currency
The Manufacturing Production Index has a mild impact on the currency market as the ongoing trend in the economy would have been already depicted by other macroeconomic leading indicators.
On the other hand, it does influence investor’s confidence in the different manufacturing sectors that can affect the stock market and correspondingly, resulting in a mild impact on the currency too.
It is essential to keep in mind that the mild impact is because the United States is a mature and developed economy and has a diverse portfolio of exports and imports. It may not be the same case for all countries where individual developing or commodity-dependent economies may heavily depend on the performance of their manufacturing sector. It all comes down to what percentage of GDP does the Industrial Production Index industries make up. The higher the percentage, the higher the impact.
For the United States, the Manufacturing Sector makes up 20% of GDP while the Services Sector drives 80%. The Manufacturing Production Index is a proportional and coincident indicator. Higher production figures lead to increased economic activity and lead to currency appreciation and vice-versa.
Sources of Manufacturing Production
The monthly Manufacturing Production statistics are available on the Federal Reserve’s official website here. The St. Louis website offers a comprehensive list of Manufacturing Production reports, and they can be found here. We can also find global Manufacturing Production figures for various countries in statistical formats here.
Impact of the ‘Manufacturing Production’ news release on the price charts
After getting an understanding of the Industrial Production economic indicator, we will now find out the impact of the news announcement on different pairs and witness the change in volatility due to the release. The development of Industrial Production and machinery output are the main drivers of economic growth.
Economists believe that country’s development and enhanced standards of living are positively correlated with the nation’s industrial activity. The GDP is directly proportional to growth in the economy’s manufacturing sector. Although it is an important determinant of the economy, when it comes to the movement of the currency, traders do not make drastic changes to their positions in the currency based on the data.
![]()
The below image shows the latest Industrial Production data of the U.S., where we see that there has been a decrease in production by a whopping 6.2% as compared to the previous month. A higher than expected value is considered as positive for the currency, while a lower than expected is considered negative. Let us look at the reaction of the market to this data.

USD/JPY | Before the announcement:
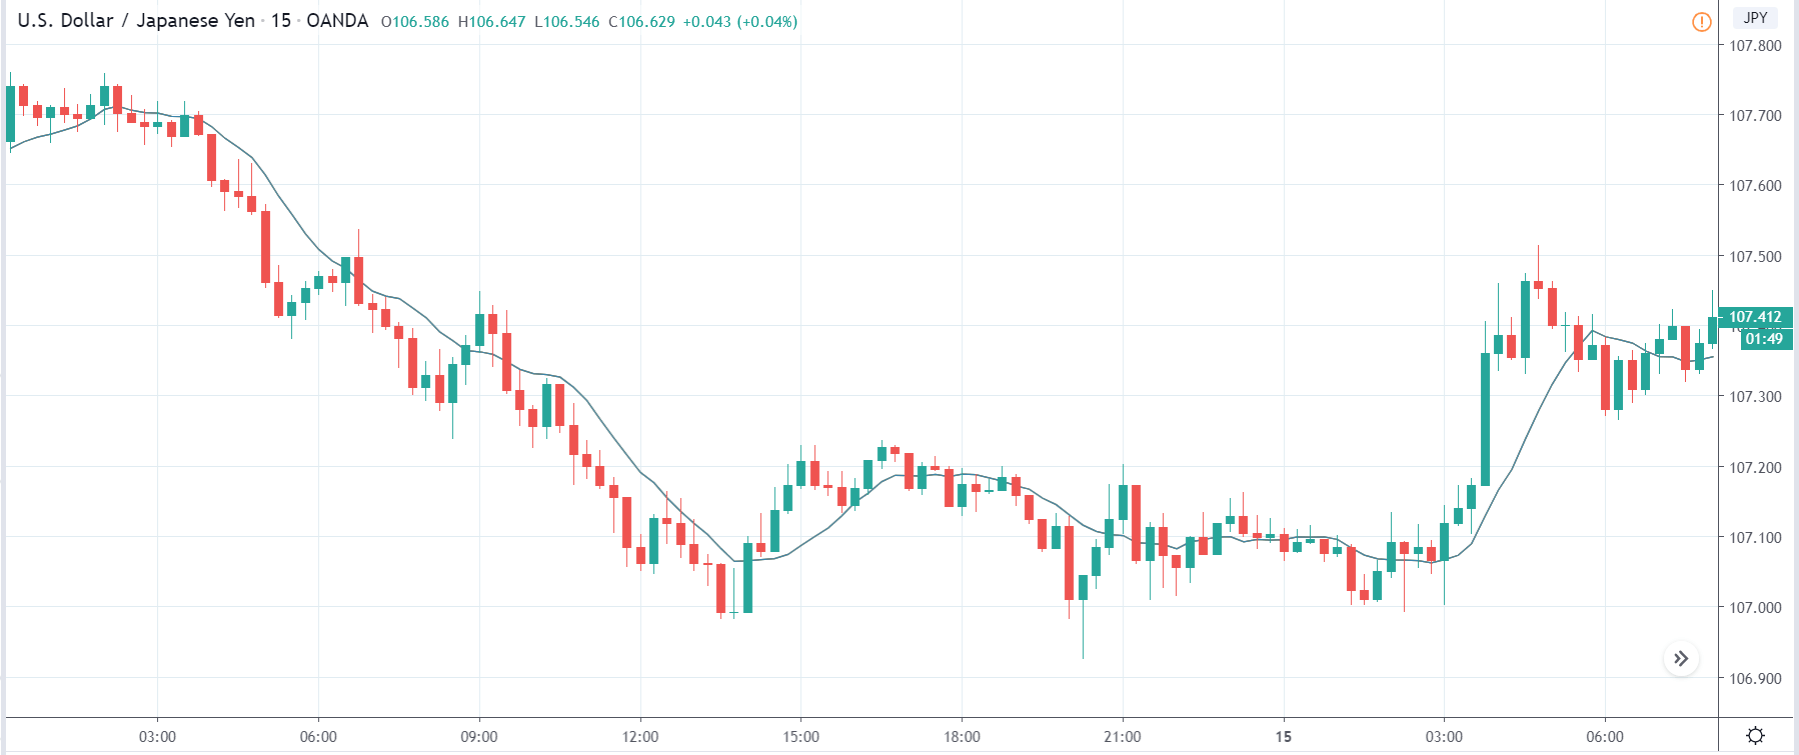
We will first look at the USD/JPY currency pair and analyze the impact of the Industrial Production data on this pair. In the above image, we see that the market was in a downtrend, and very recently, the price has shown a sign of reversal to the upside. The price action suggests that the market might move higher from here before going down. Since the economists have predicted a lower Industrial Production data, it is advised not to take any ‘short’ positions.
USD/JPY | After the announcement:
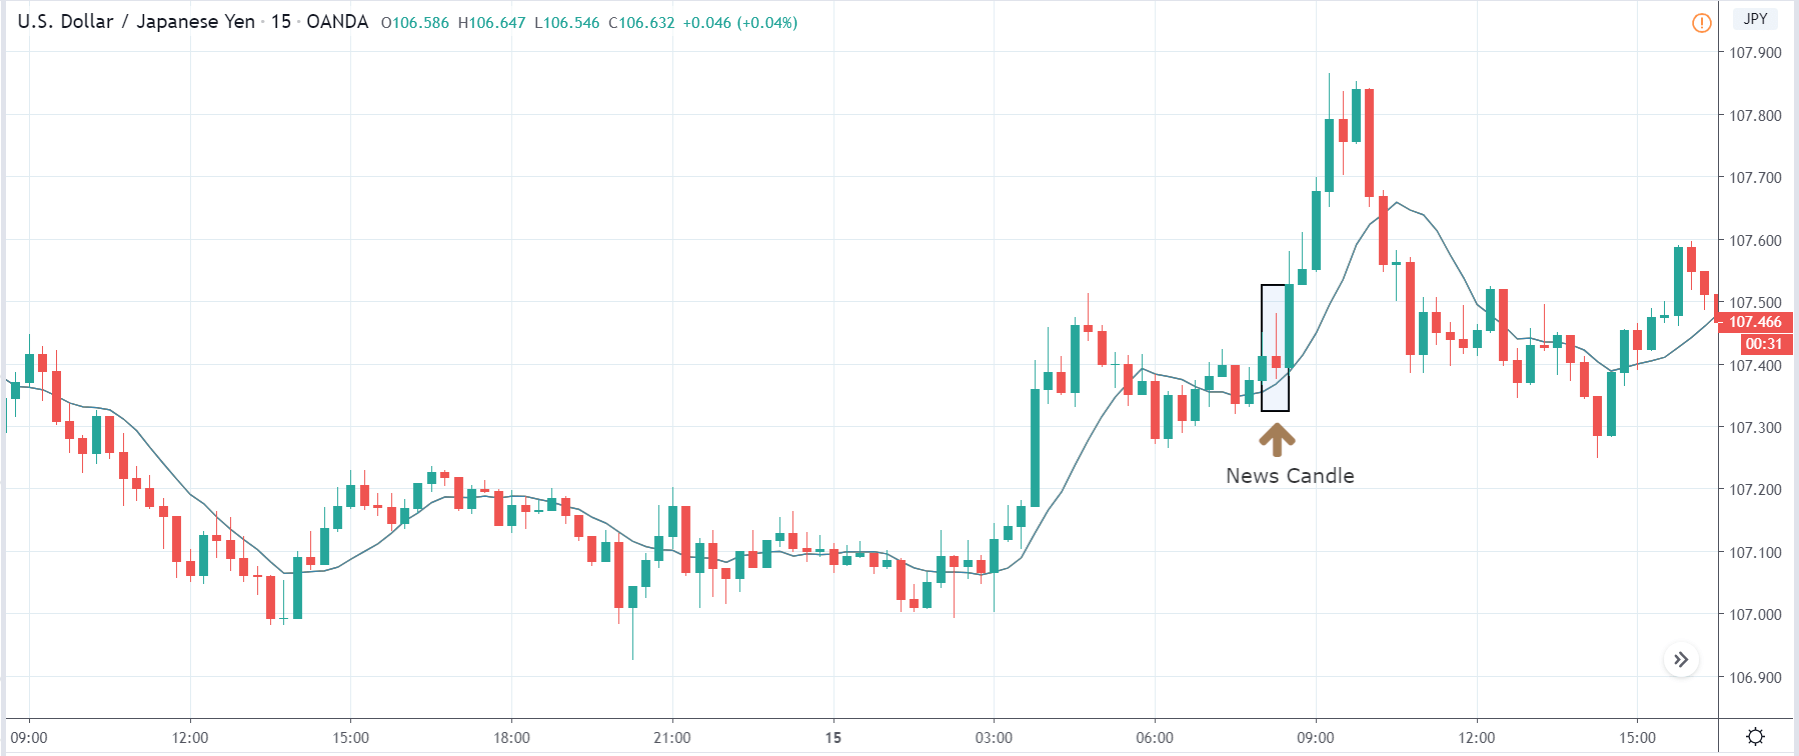
After the news announcement, the price initially moves higher due to increased volatility but later loses all the gains and closes in the red. Even though the Industrial Production data was very bad for the economy, the price did not react that bad as expected. We see a neutral response from the market where the ‘news candle’ closes near its opening price. Therefore, we can say that the impact of the news outcome was not great on the currency pair, and the volatility was average.
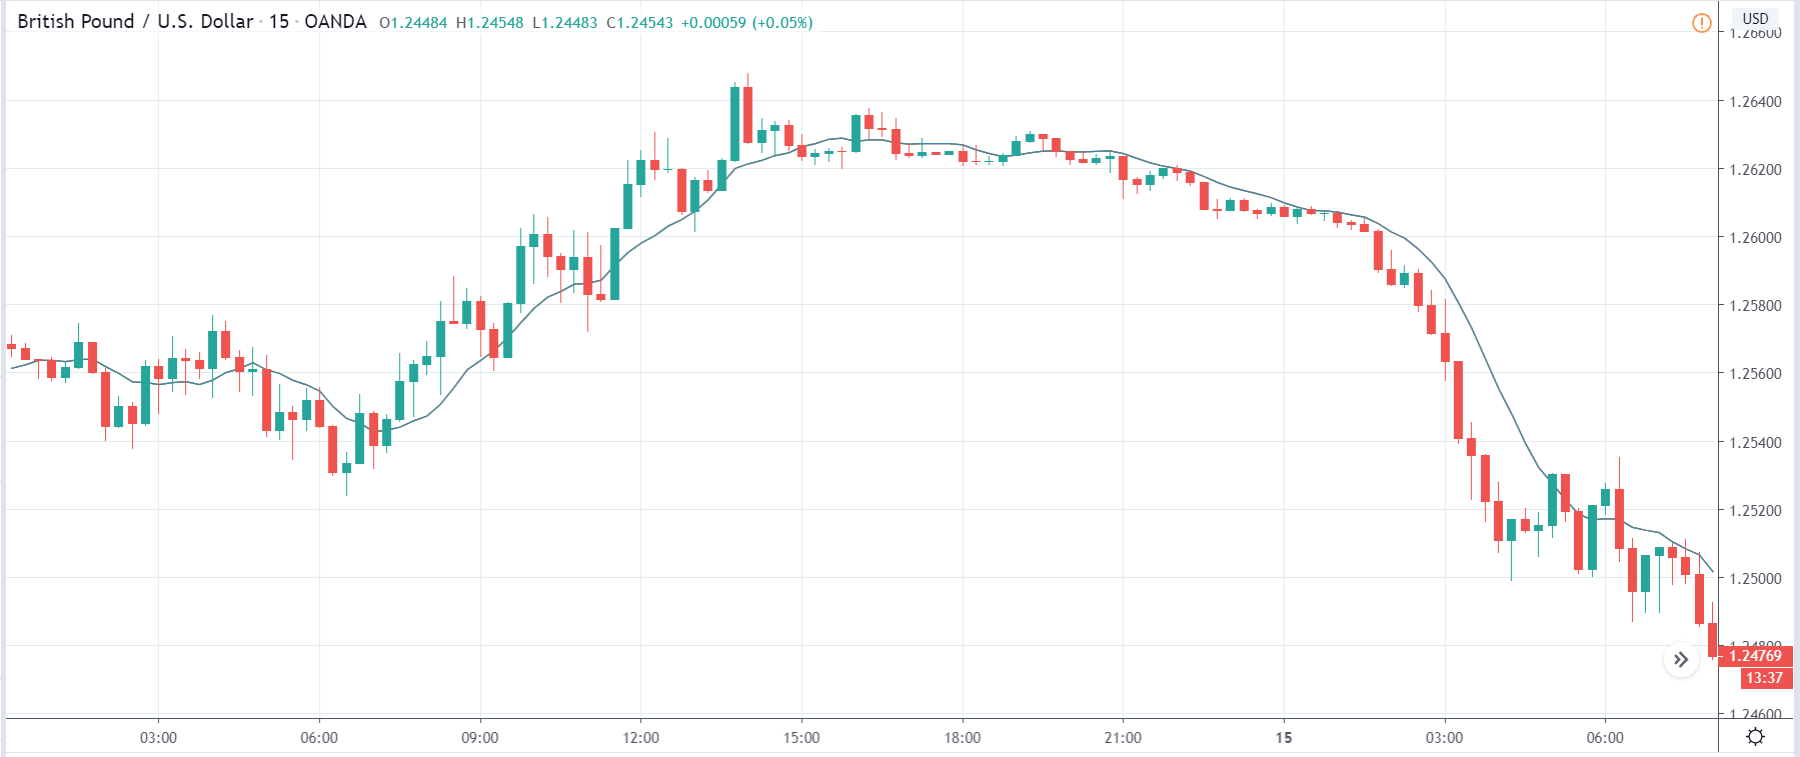
GBP/USD | Before the announcement:
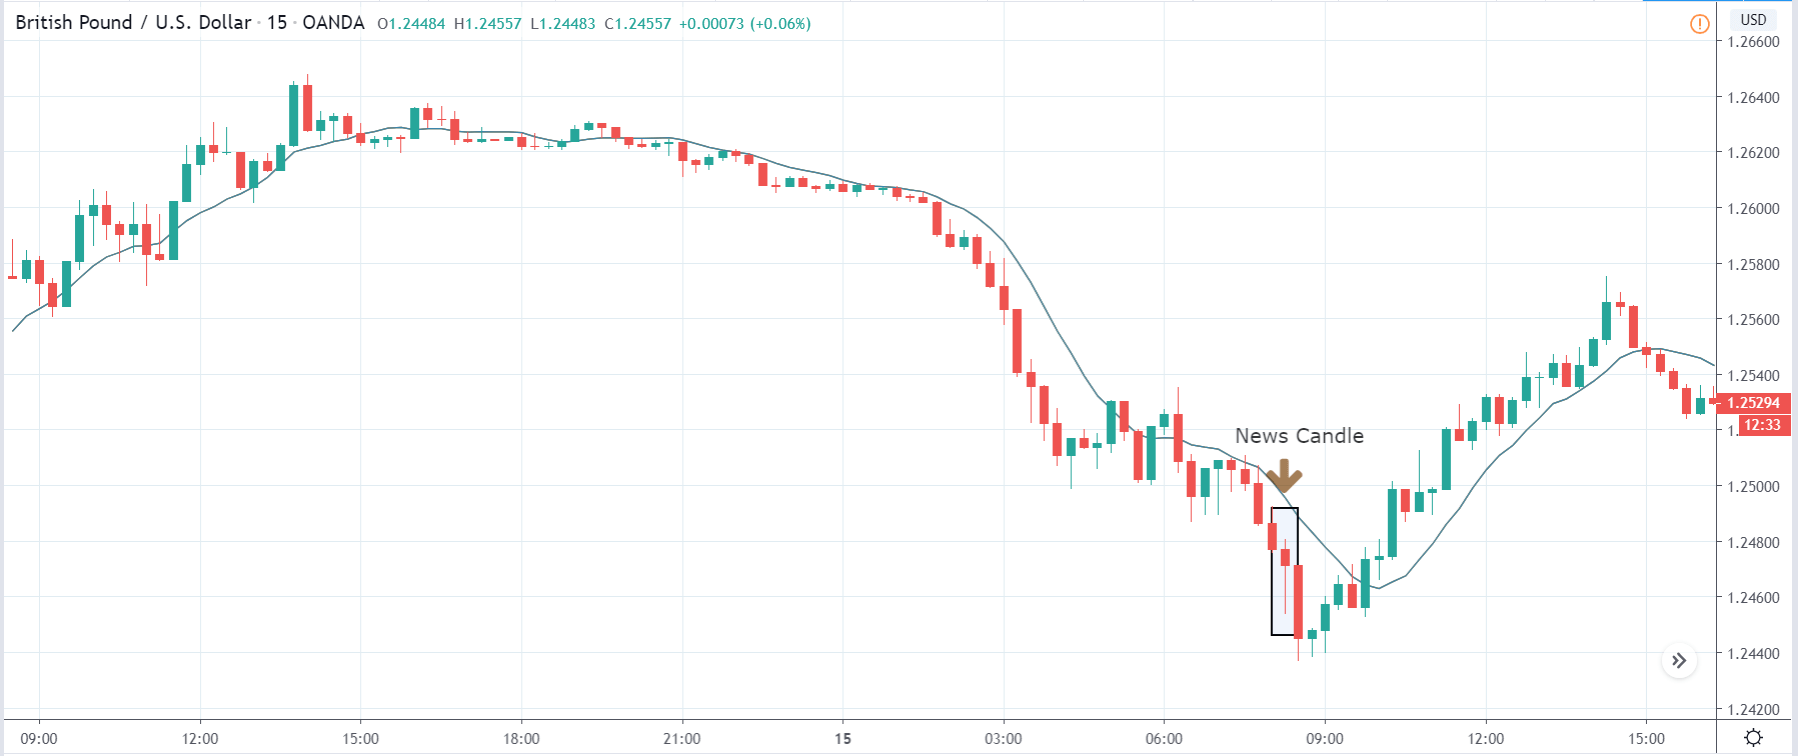
GBP/USD | After the announcement:
The above images represent the GBP/USD currency pair, where we see that the market is violently going down before the news announcement. Currently, the price is its lowest point, and there has been no price retracement of any kind. As per the technical analysis, we cannot take any position at this moment, as this would mean chasing the market and, this carries a huge risk.
After the news announcement, we see that that the price goes lower in the beginning, but later buying pressure takes the price higher, and the candle closes with a wick on the bottom. Overall, the volatility increases to the downside after the news release but does not sustain for long. The price continues to move higher one candle after the ‘news candle,’ which implies that Industrial Production does not have a long-lasting effect on the currency.
USD/CAD | Before the announcement:

USD/CAD | After the announcement:
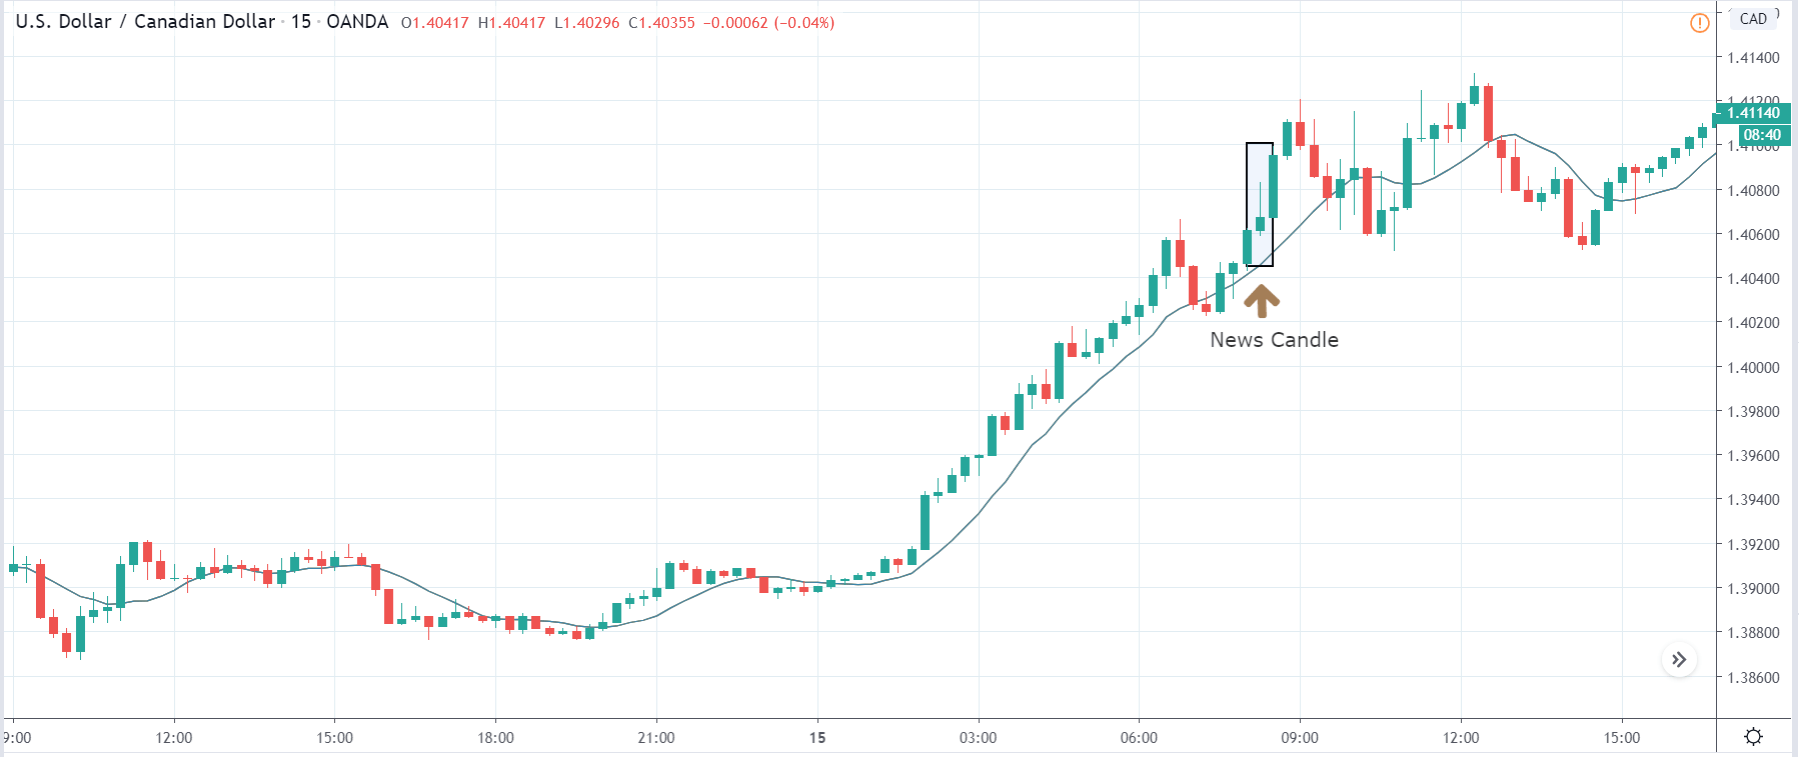
The above images are that of the USD/CAD currency pair where we see that before the news announcement, the market is in a strong uptrend, and here too, there is no price retracement of any sort. This shows that the U.S. dollar is extremely strong. At this point, we cannot take any position in the market as this is against the rules of risk management.
After the news announcement, volatility increases to the upside resulting in further strengthening of the U.S dollar. Despite the fact that the Industrial Production data was really weak, the market does not react negatively to the news data, but rather we see an increase in the price. This might be due to the fact that the news data is of least importance to traders.
That’s about ‘Manufacturing Production’ and its impact on the Forex market after its news release. If you have any questions, please let us know in the comments below. Good luck