
Introduction
Disposable Personal Income, also called DPI, is an economic indicator that can help investors understand the spending and saving patterns of the general population. It is from this data other forms of expenditures and savings are derived. Hence, understanding the changes in the relative disposable income numbers from time to time can help us understand the economic conditions better as part of our fundamental analysis.
What is Disposable Personal Income?
Disposable Personal Income, also called After-Tax Income, is what’s left of an individual’s income after all federal tax write-offs. Consequently, It is the amount people can spend, save, or invest. For example, An employee making 100,000 dollars a year, paying 25% of his income as tax would have to pay 25,000 dollars as tax payment, which leaves him with 75,000 dollars for that year. This 75,000 dollars would be his DPI, or more aptly the After-Tax Income.
Hence, the calculation of DPI is simple; it is just the difference between personal income and income taxes.
Note: The federal government may use the disposable income for further mandatory deductions like defaulted student loans, delinquent child support, or payment of back taxes. Hence, in the broader sense, the DPI would be the amount that is left after tax and other mandatory payments.
DPI is often confused with Discretionary Income, which is the amount that is left when the living expenses are deducted from the DPI. Living expenses are all the necessary expenditures incurred to conduct one’s lifestyle and would typically include rent, water bill, electricity bill, transportation costs, and groceries, etc.
For Example, A video gamer’s discretionary income would go to typically spending on purchasing new games, whereas a music-loving person would spend his discretionary income attending concerts perhaps. During times of recession or high deflationary conditions, the discretionary income takes the hit as it is miscellaneous spending and does not precede importance over taxes and necessary expenditures. Businesses that sell discretionary goods and services take the worst hit and hence are closely watched by investors for signs of recession and recovery.
Economic Reports
The U.S. Department of Commerce: Bureau of Economic Analysis (BEA) releases the DPI numbers every month in the last week for the previous month titled “Personal Income and Outlays” release. The month-on-month numbers are expressed in percentage changes with respect to last month’s figures.
The BEA also releases the other derived metrics from the DPI, like the REAL DPI, which takes inflation into account, and hence it is the inflation-adjusted version of DPI, PCE (Personal Consumption Expenditure) and REAL PCE reports.
How can the Disposable Personal Income numbers be used for analysis?
The DPI data set goes back to as far as 1929. With such a long-range, the confidence in the numbers is high amongst economists with regards to its reliability. When compared against GDP growth, there is a good correlation between both.
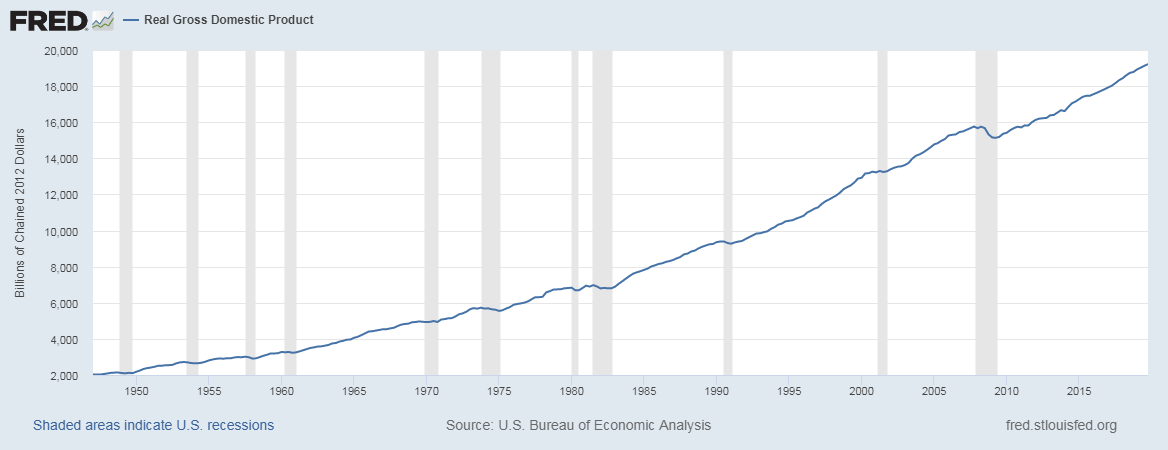
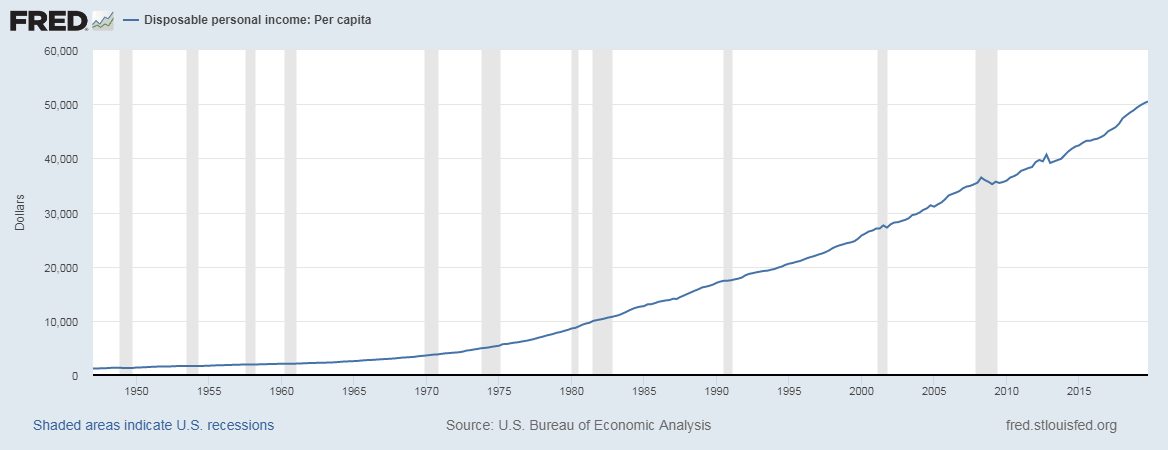
As we can see below, the graphs have a similar trend, the first one is the Real GDP, and the second graph corresponds to the DPI, which are taken from the St. Louis FRED website for reference and illustration here. The shaded region indicates periods of recessions.
We can also see that during recessions, the GDP and DPI flat out from their usual trend and trend sideways or downwards (during more extended recessionary periods).
As DPI shows what the amount left with the individual after deductions are, the numbers can be used to derive other metrics. Economic indicators like Discretionary income, savings rates, Marginal Propensity to Consume (MPC), and Marginal Propensity to Save (MPS).
All these indicators are useful in speculating the direction of money flow, whether it ends up in banks in the form of savings or other people’s hands as part of the expenditure.
A healthy and growing economy would be reflected in the DPI numbers as the people make up the economy. It is important to remember that DPI is a reflection of the present financial situations of employees and hence only shows what the current economic status of the nation is. It is a coincident indicator in this sense and is dependent on macroeconomic factors like the government’s policies, Quantitative Easing, inflation, etc. which direct the money flow. Hence, it is the effect in the cause-and-effect equation. It reflects the results of an action rather than the act itself.
Impact on Currency
A steady increase in the DPI is always good for the economy and, therefore, the currency. It is a proportional indicator. Low numbers are depreciating, and high numbers are appreciating for the currency.
A strong economy or most developed nation’s populations are expected to have higher DPI numbers relative to other economies, thereby enjoying a higher standard of living as they can spend on goods and services, beyond meeting their necessities.
An oncoming recessionary period would result in stagnant or dip in DPI numbers as people tend to save more when they are uncertain of their financial future.
Sources of Disposable Personal Income Reports
The monthly DPI numbers releases can be found on the official website of the Bureau of Economic Analysis as given below for reference:
We can find historical and graphical analysis of the same numbers in the St. Louis FRED website as given below for reference:
Disposable Personal Income – Seasonally Adjusted Quarterly
For a more detailed analysis of the same, you can browse through the below relevant categories:
You can also find out the pure DPI numbers (not percentages) of other countries here:
Impact of the ‘Disposable Personal Income’ news release on the price charts
By now, we have understood the definition and significance of the Disposable Personal Income economic indicator. In this section, let’s analyze the impact of this economic indicator on currency and observe the change in volatility.
Personal Income, Disposable Personal Income, and Personal Consumption are announced together, and data of each of them is released along with the Personal Income. This is why we have collected the date and time of the announcement of Personal Income. As we can see below (yellow mark), traders do not give a lot of importance to the Personal Income data, and therefore one should expect moderate to less volatility during the announcement.
![]()
For illustrating the impact, we have used the latest Disposable Personal Income data of the United States. It is published by the Bureau of Economic Analysis of the U.S. The release said that Personal Income was increased by $106.8 billion in February, and the Disposable Personal Income (DPI) was increased by $88.7 billion which was 0.5% higher from the previous month. Let us look at the impact of this data on currency pairs.
EUR/USD | Before the announcement:
The above image shows the state of the chart before the DPI data is announced, and we can see that the market is in a downtrend, and recently it has given a retracement. Technically, this is the ideal condition for going ‘short’ in the market, but as the volatility is high, it is better to wait for the actual data rather than trading based on the market expectations. Taking a ‘buy’ in this pair can be risky even if the DPI data is positive for the U.S. economy as the down move is quite strong, and the reversal will not last (DPI is not a high impact event).
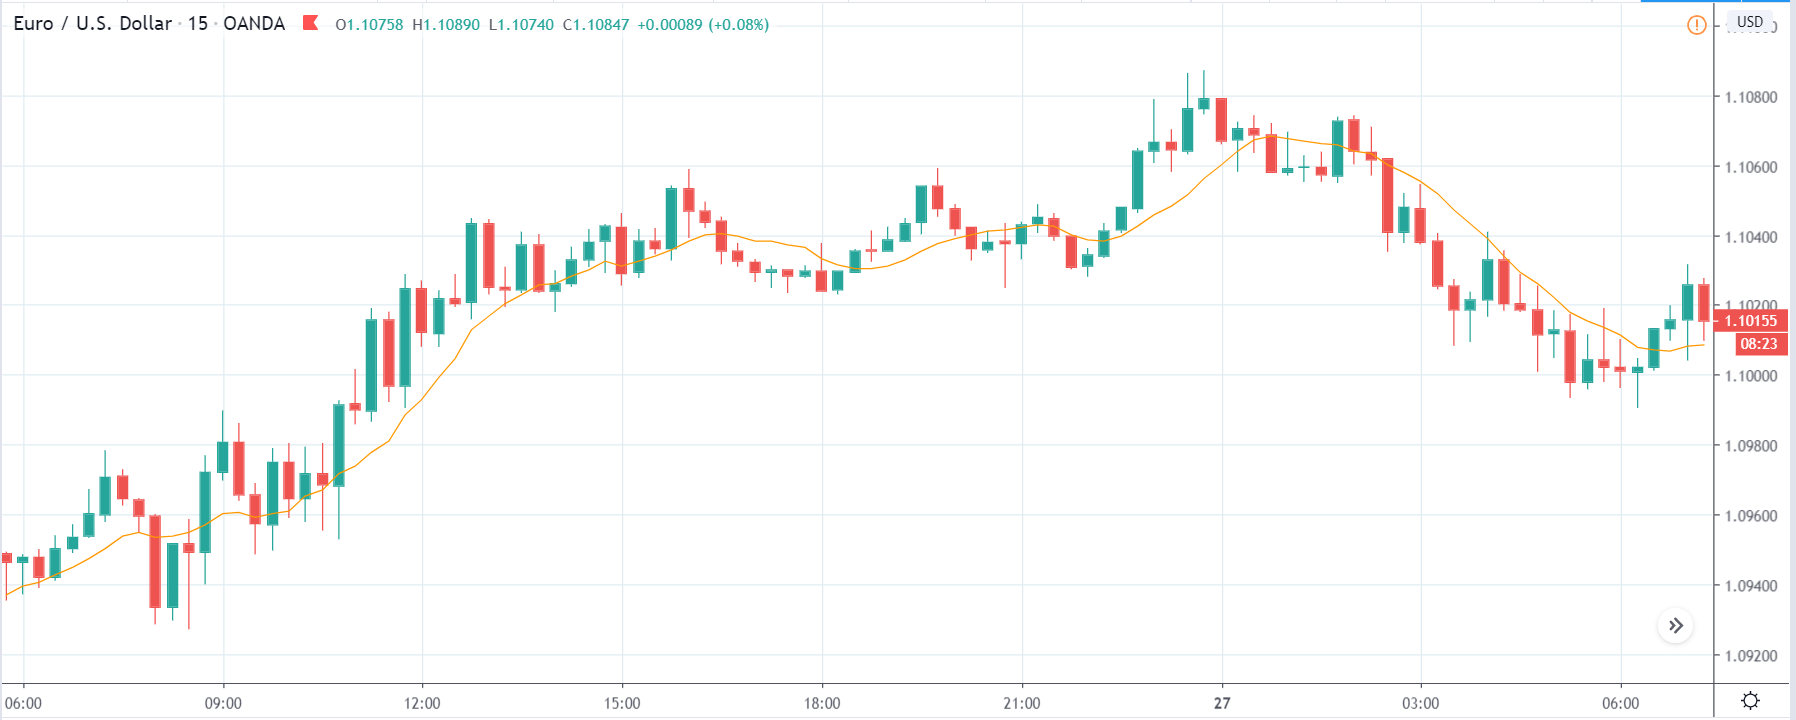
EUR/USD | After the announcement:

The DPI announcement induced a fair amount of volatility in the pair, and the ‘news candle’ leaves a long wick on the top indicating high selling pressure. From the reaction, we can conclude that the DPI for the month of February was very positive for the U.S. economy, which made traders buy more U.S. dollars. This sudden increase in volatility to the downside is a confirmation sign that the market will go much lower. Thus, as the price goes below the 20-period moving average, one can take a ‘short’ trade with a stop-loss just above the news candle.
USD/JPY | Before the announcement:
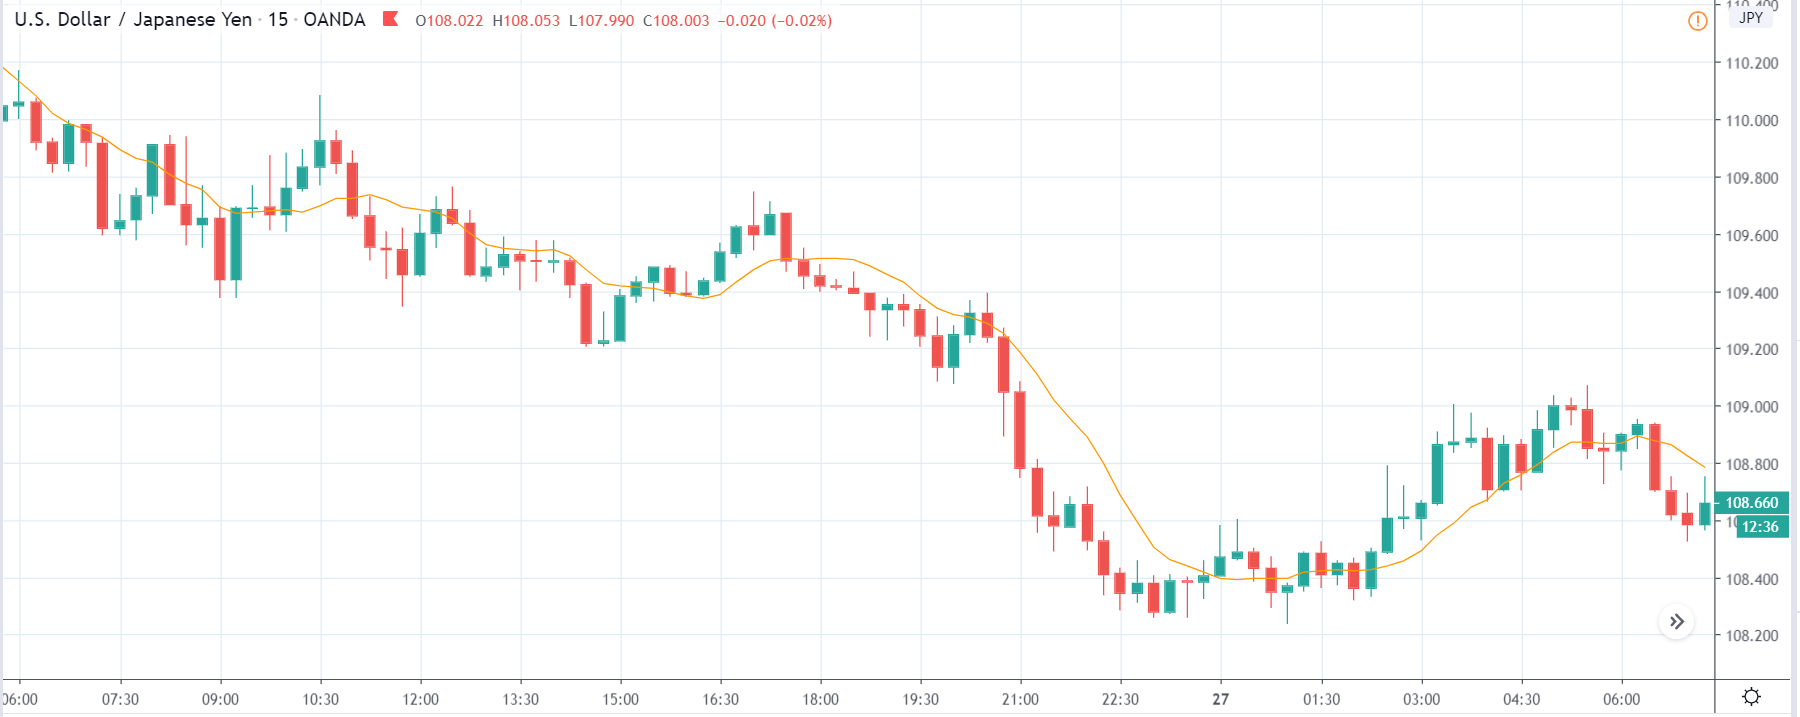
USD/JPY | After the announcement:
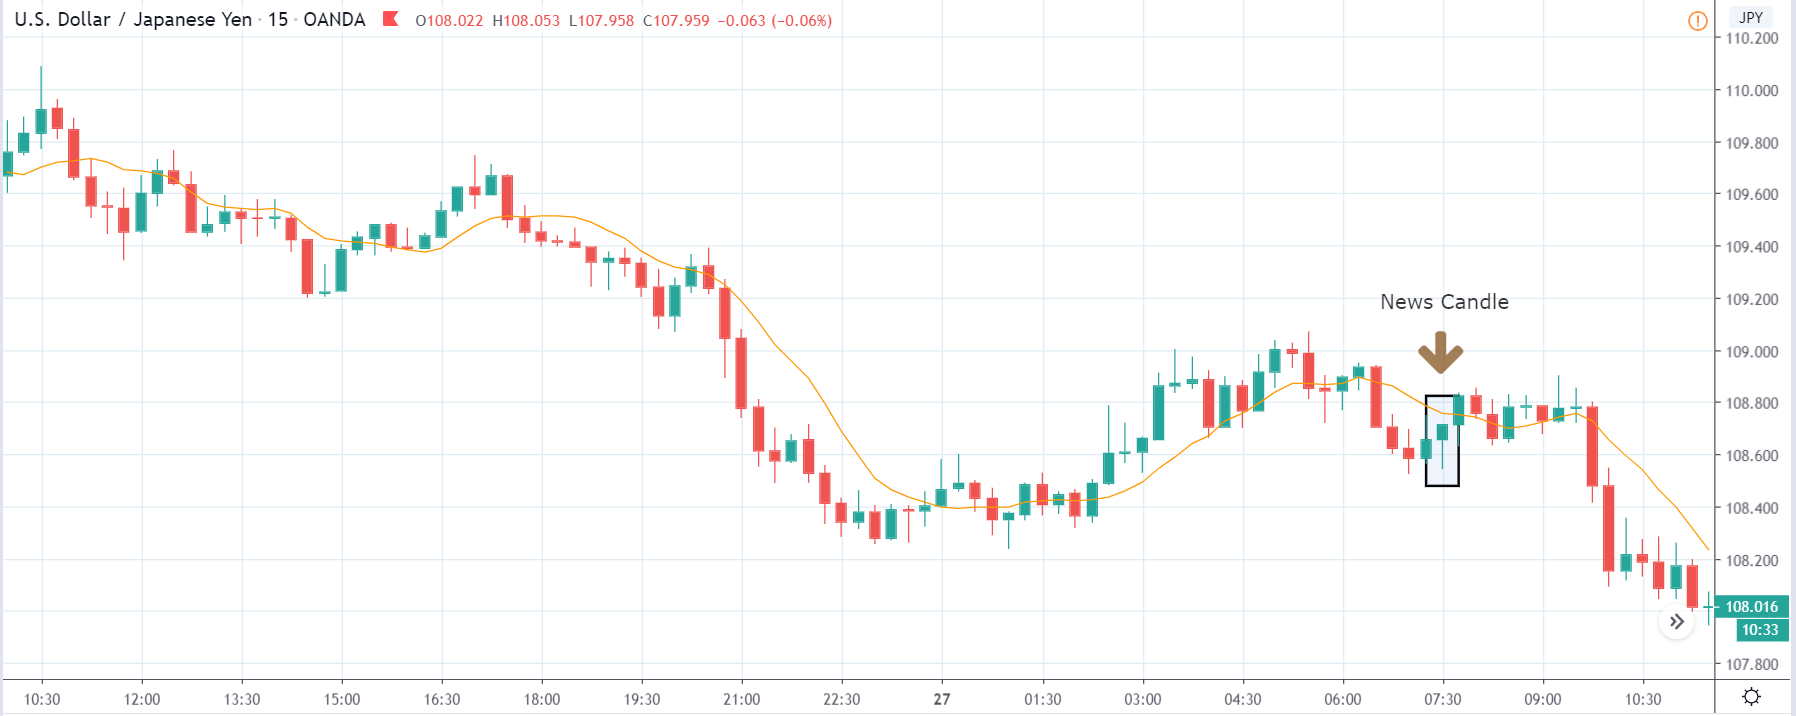
Next, we discuss the USD/JPY currency pair, where the behavior of the chart is different from the EUR/USD pair. Even though the chart is in a downtrend, the U.S. dollar is on the left-hand side. Hence, a downtrend indicates weakness in the currency. Just before the announcement, price is at the lowest point from where the market had retraced earlier. This means, irrespective of the news announcement, we can expect some buying strength from here. We cannot position ourselves on any side of the market at this point as technically, there is no supporting reason.
After the DPI data is announced, the market moves higher as a result of good DPI numbers, and the price makes a ‘bullish hammer’ candlestick pattern. But the data was not very upbeat to increase the volatility too much on the upside. As the market does not give clear signs of reversal, we cannot go ‘long’ in the market based on the data.
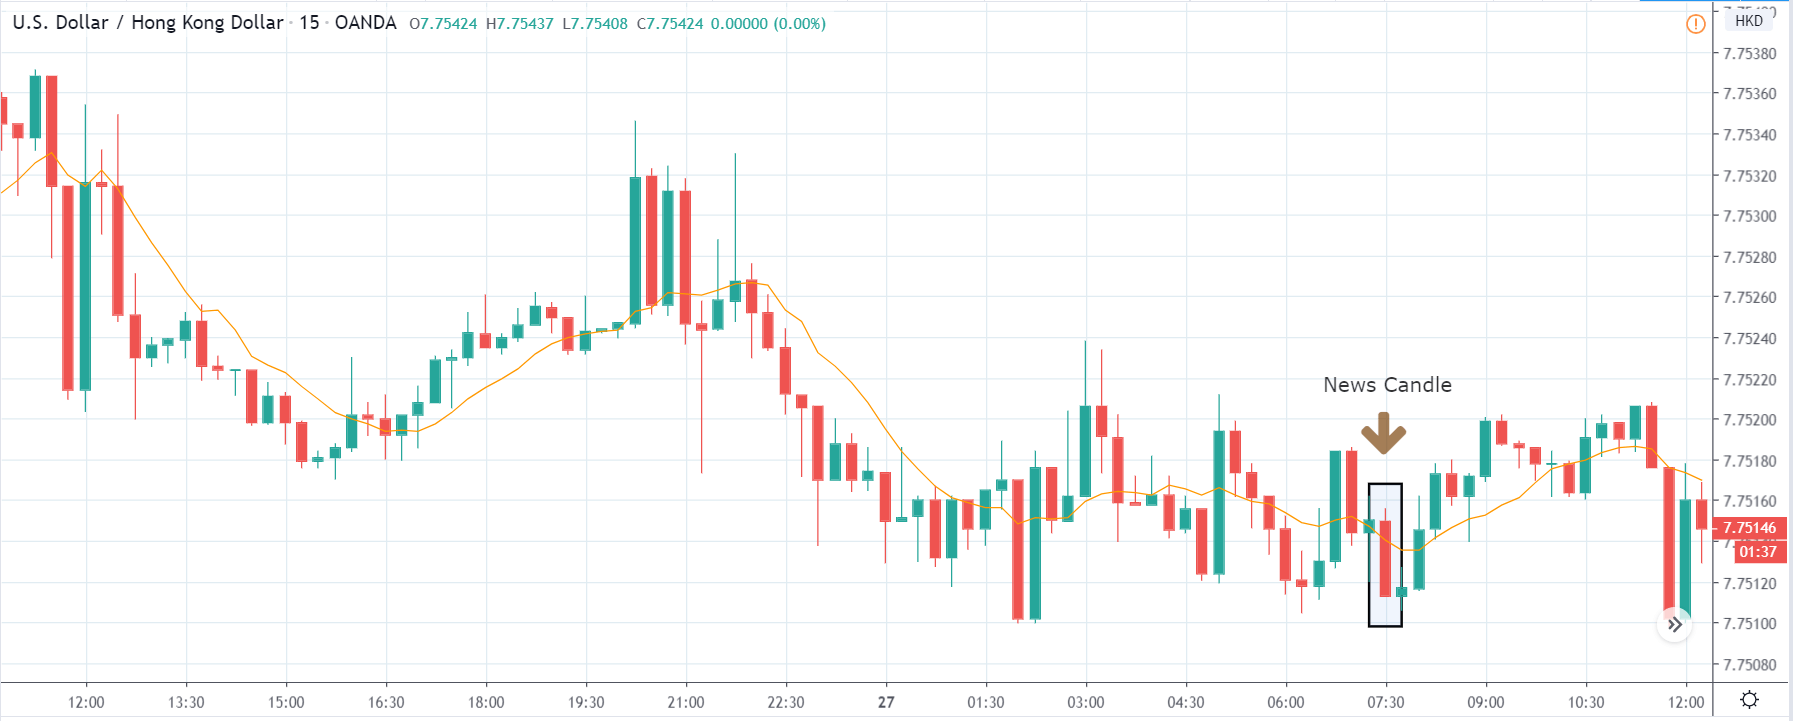
USD/HKD | Before the announcement:
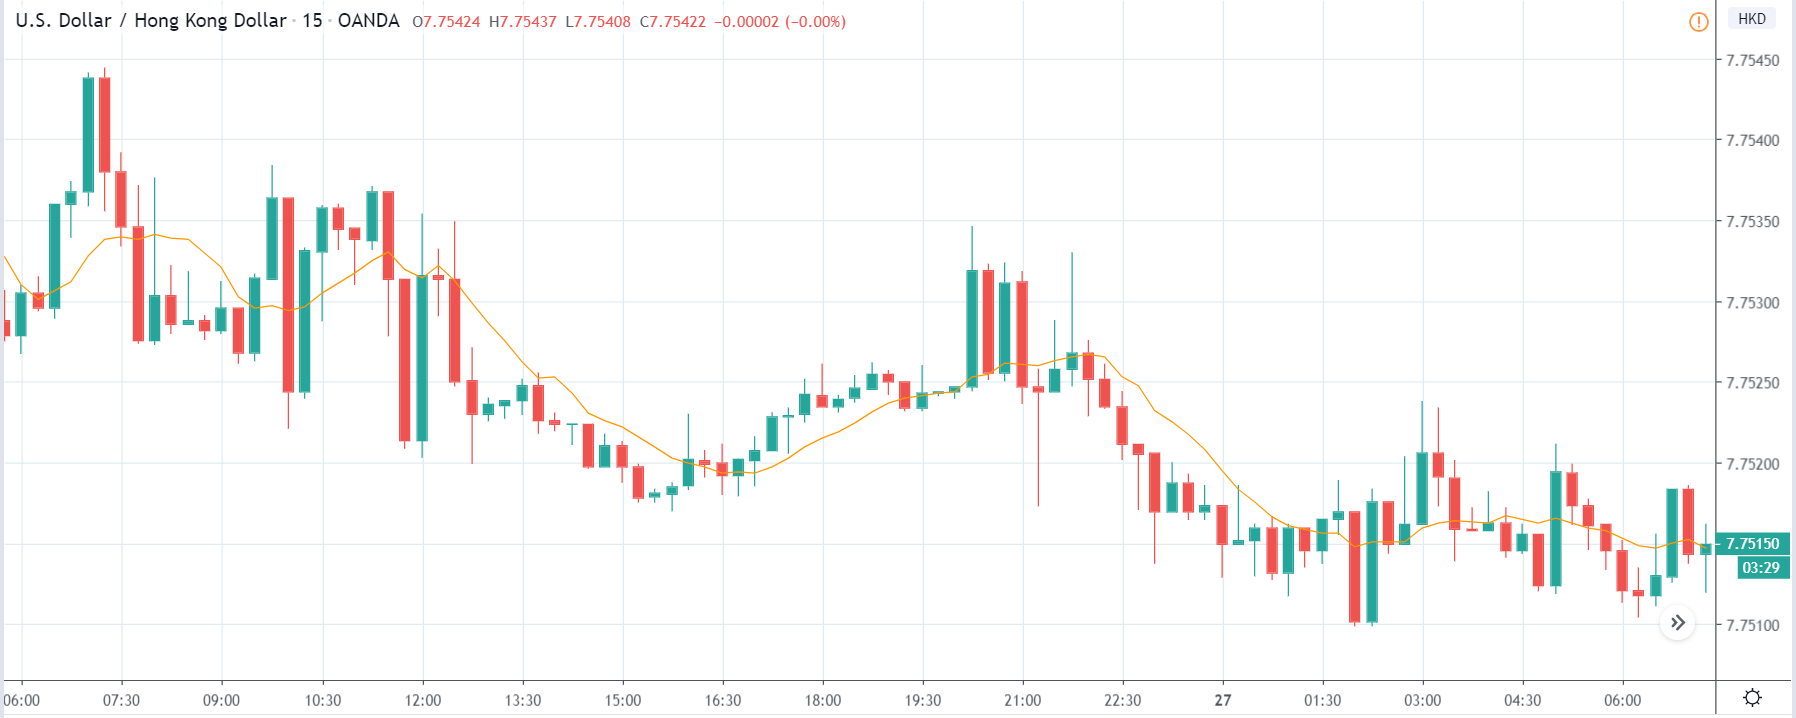
USD/HKD | After the announcement:
The above images represent the USD/HKD currency pair where the price appears to be moving in a range, and predominantly the trend is down. Just before the announcement, the price is in the middle of the range, and we cannot predict at this point as to where the price will go. We need to wait to see the shift in volatility due to the news release and then have a view on the market.
After the DPI numbers are out, price falls to the bottom of the range, and we see a strong bearish candle. The DPI data proved to be positive for the currency in the above two pairs, but here the market reacted negatively. This could be due to the strength in the Hong Kong dollar or extreme weakness in the U.S. dollar. As the impact of DPI on currency is less, one can ‘buy’ USD/HKD near the ‘support’ with a target near to the ‘resistance.’
That’s about ‘Disposable Personal Income’ and its impact on the Forex market after its news release. If you have any queries, let us know in the comments below. Cheers!