Introduction
EURAUD is a minor/cross currency pair traded in the forex market. EURAUD is the abbreviation for the euro area’s euro and the Australian dollar. The left currency, EUR is the base currency and the one on the right, AUD is the quote currency. The price of EURAUD basically tells the value of the Australian dollar.
Understanding EUR/AUD
The exchange rate of EURAUD shows the Australian dollars required to purchase one euro. It is quoted as 1EUR per X AUD. For example, if the value of EURAUD is 1.5995, it means that these many units of AUD are to be possessed by the trader to buy one unit of EUR.
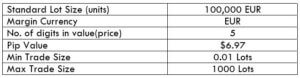
EUR/AUD Specification
Spread
Spread is the way through which brokers make money. It is merely the difference between the bid price and the ask price set by the broker. These prices are often different from broker to broker. The spread differs based on the volatility of the market as well. The approximate spread on an ECN account and an STP account is given below.
ECN: 0.9 | STP: 1.7
Fees
For every trade a trader takes, there is some fee associated with it. And this fee is charged only by ECN type brokers. Typically, there is no fee on STP type brokers. The fee range is usually between 6 pips and 10 pips.
Slippage
A trader can place trades using either market order or using a limit order. In the case of market orders, the trader doesn’t get the exact price at which he executed the trade. The real price he received is different. This difference in the price is referred to as slippage.
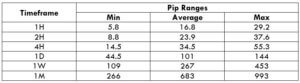
Trading Range in EUR/AUD
As a professional trader, it is vital to know how many pips the currency pair moves in each timeframe. It gives the trader an idea of how long he must wait for his trade to perform. Traders can also assess their profit/loss in a given time frame. For example, if a trader takes a trade by analyzing the 1H timeframe, and the min market volatility is three pips, then he can expect to win or lose at least $20.91 (3 pips x $6.97 value per pip).
Procedure to assess Pip Ranges
- Add the ATR indicator to your chart
- Set the period to 1
- Add a 200-period SMA to this indicator
- Shrink the chart so you can assess a large time period
- Select your desired timeframe
- Measure the floor level and set this value as the min
- Measure the level of the 200-period SMA and set this as the average
- Measure the peak levels and set this as Max.
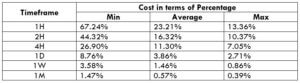
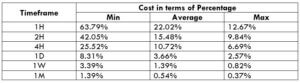
EUR/AUD Cost as a Percent of the Trading Range
Apart from knowing the potential profit/loss from the volatility of the market in different timeframes, one can also determine the cost variation by considering the volatility and the timeframe. For this, the ratio between total cost and volatility is taken into account. It is then expressed in terms of percentage. The magnitude of the percentage determines the cost of each trade.
ECN Model Account
Spread = 0.9 | Slippage = 2 | Trading fee = 1
Total cost = Slippage + Spread + Trading Fee = 2 + 0.9 + 1 = 3.9
STP Model Account
Spread = 1.6 | Slippage = 2 | Trading fee = 0
Total cost = Slippage + Spread + Trading Fee = 2 + 1.7 + 0 = 3.7
The Ideal way to trade the EUR/AUD
Now that we’ve got the values from the above table, here is our ideal way to trade the EUR/AUD.
The higher the magnitude of the percentages, the higher is the cost of the trade on that particular timeframe. Comprehending this to the above table, it is seen that the percentages are highest and lowest on the min and max columns, respectively. This, in turn, implies that the costs are high when the volatility of the market is feeble. And the costs are low when the volatility is high. So, it is ideal to trade on any timeframe, given the volatility of the market is above average volatility. This will ensure the fairly high volatility with affordable costs.
Furthermore, the costs can be made much lower by placing limit orders instead of market orders because this will reduce the slippage on the trade to zero. As an example, the cost percentage table is given by ignoring the slippage value.
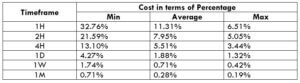
Thus, comparing the two tables, it is evident that the costs have reduced by 50%.