Categories
Forex Elliott Wave Forex Market Analysis

EURAUD Under Bearish Pressure, What’s ahead?

The EURAUD cross is advancing in its incomplete third wave from a mid-term downward sequence that remains in play. Follow with us on what the Elliott wave theory tells about its next movement.

Technical Overview 

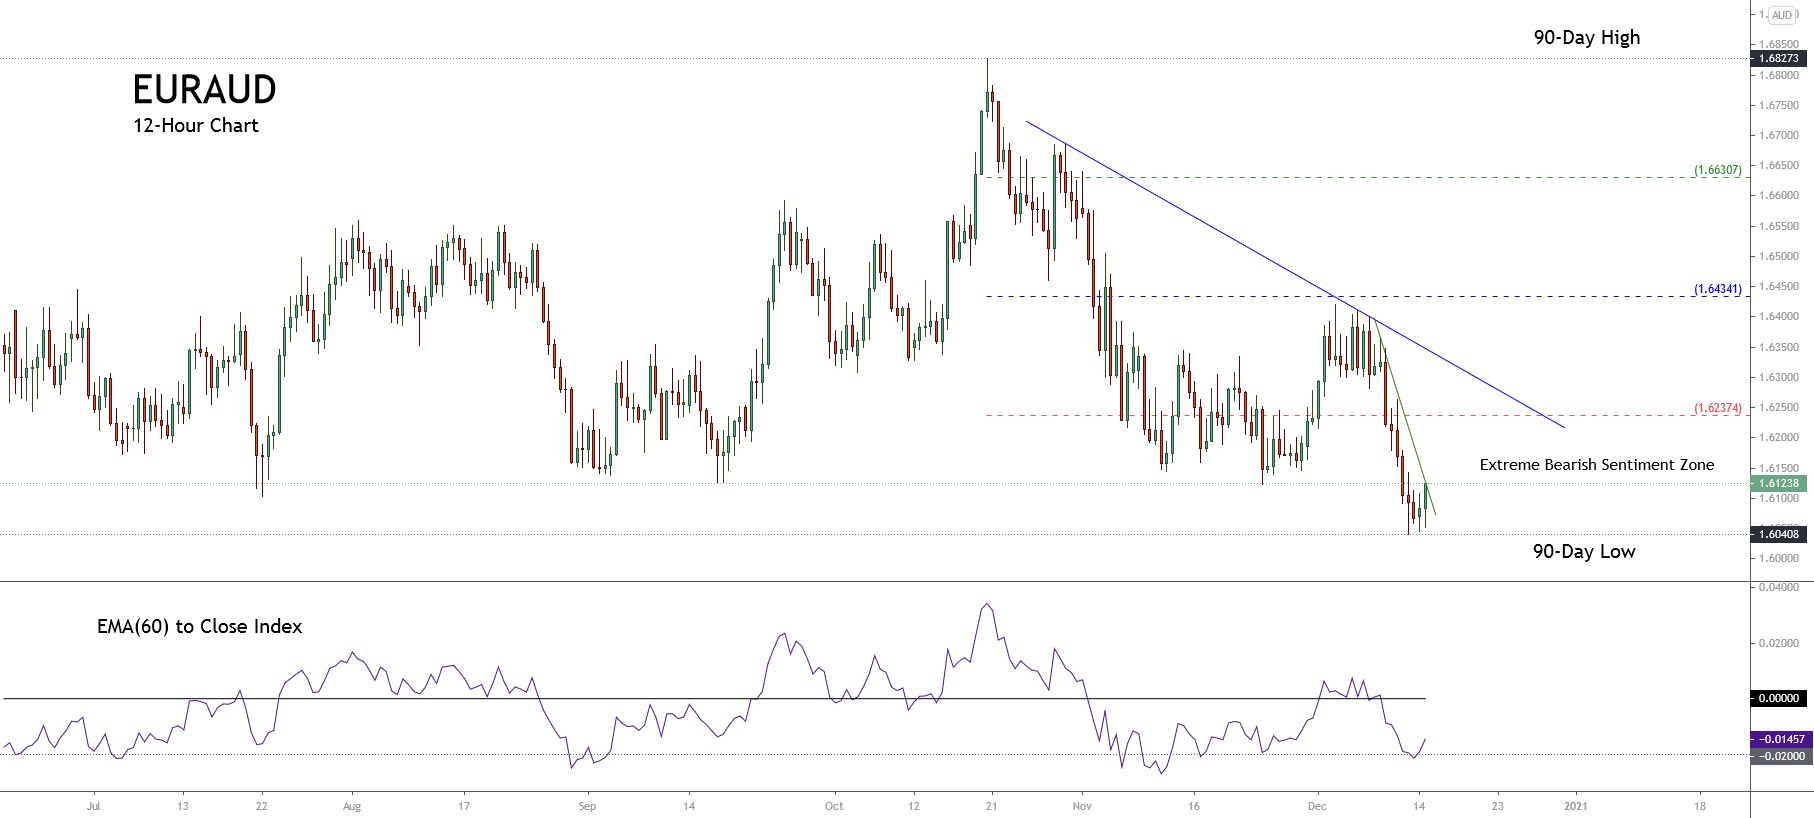
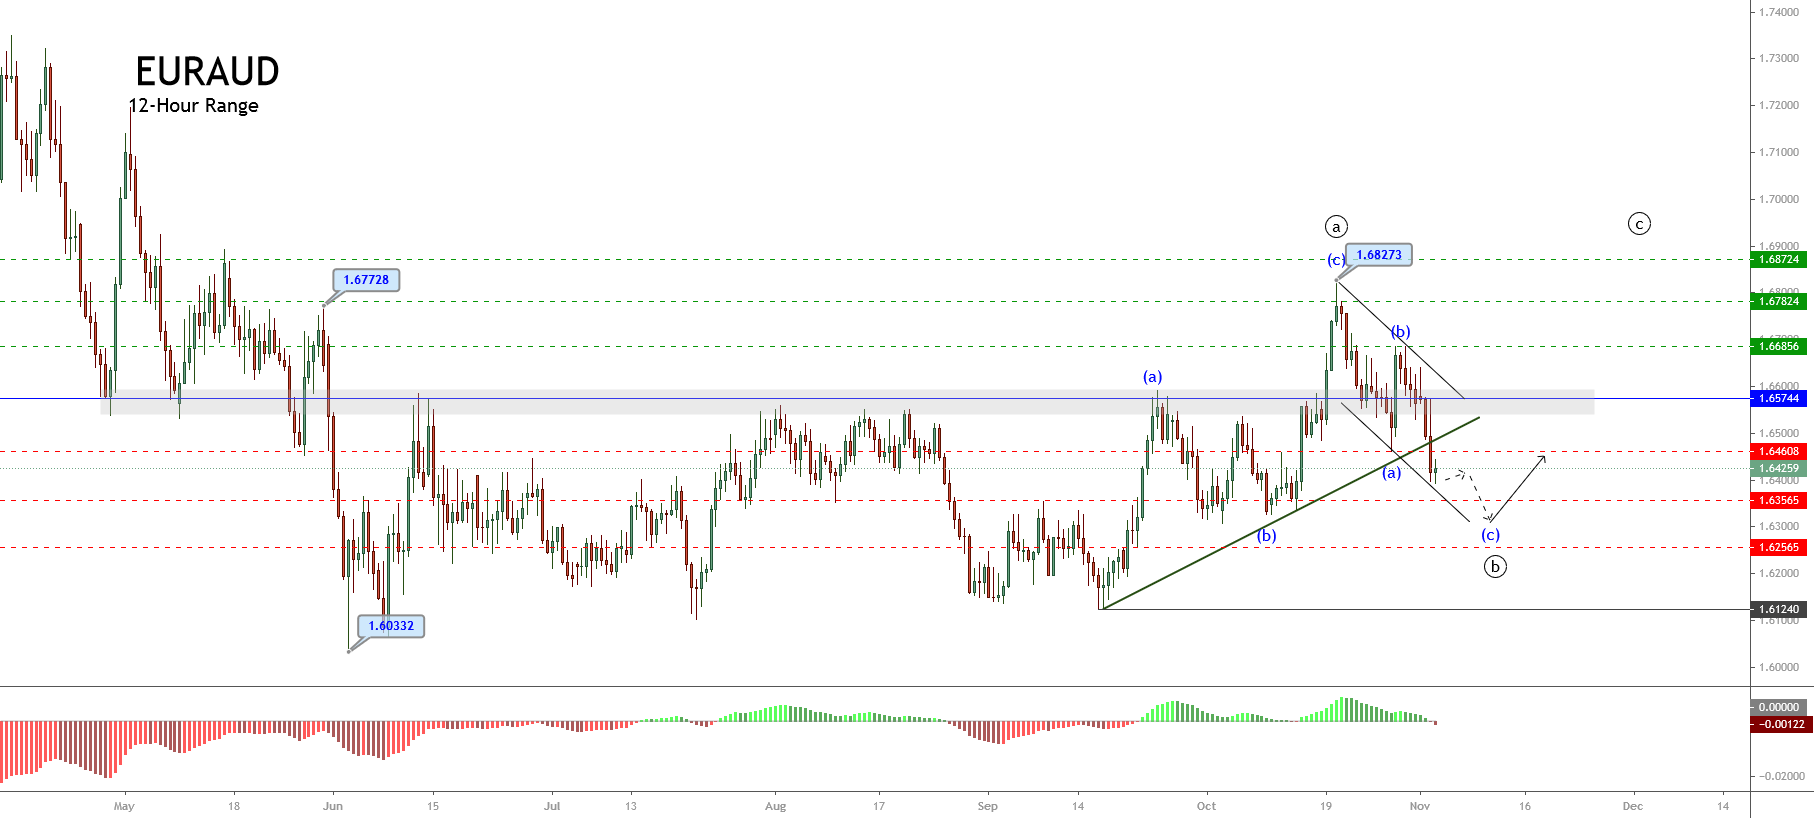
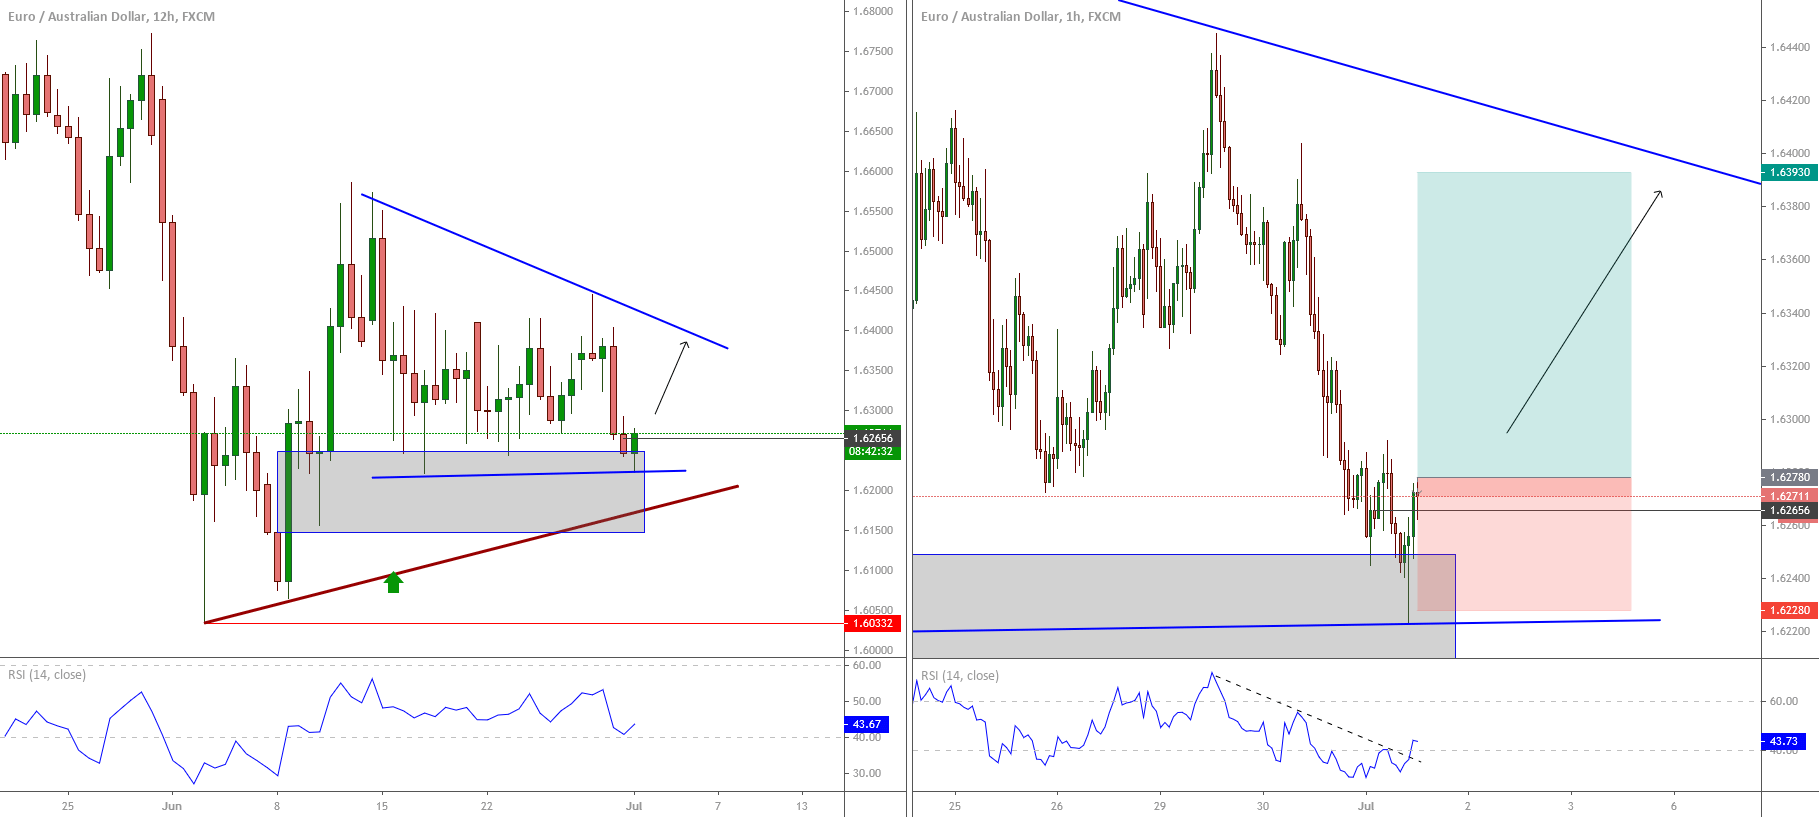
The big picture of the EURAUD cross unveiled in the following 12-hour chart exposes the price action moving in the extreme bearish sentiment zone during the second week of the year. However, both the acceleration and oversold could suggest the exhaustion of the bear market.

The following 12-hour chart exposes the market participants’ sentiment, unfolded by the 90-day high and low range. The figure reveals the institutional activity pushing the cross in the extreme bearish zone and consolidating under the yearly opening price at 1.58763.

On the other hand, the EMA(60) to Close Index recently pierced the -0.0300 level. This reading suggests both the oversold and the exhaustion of its accelerated downtrend identified with the black trend-line.

In this context, the accelerated downward trend-line breakout and the close above yearly opening price should warn about potential recoveries in the EURAUD cross.

Technical Outlook

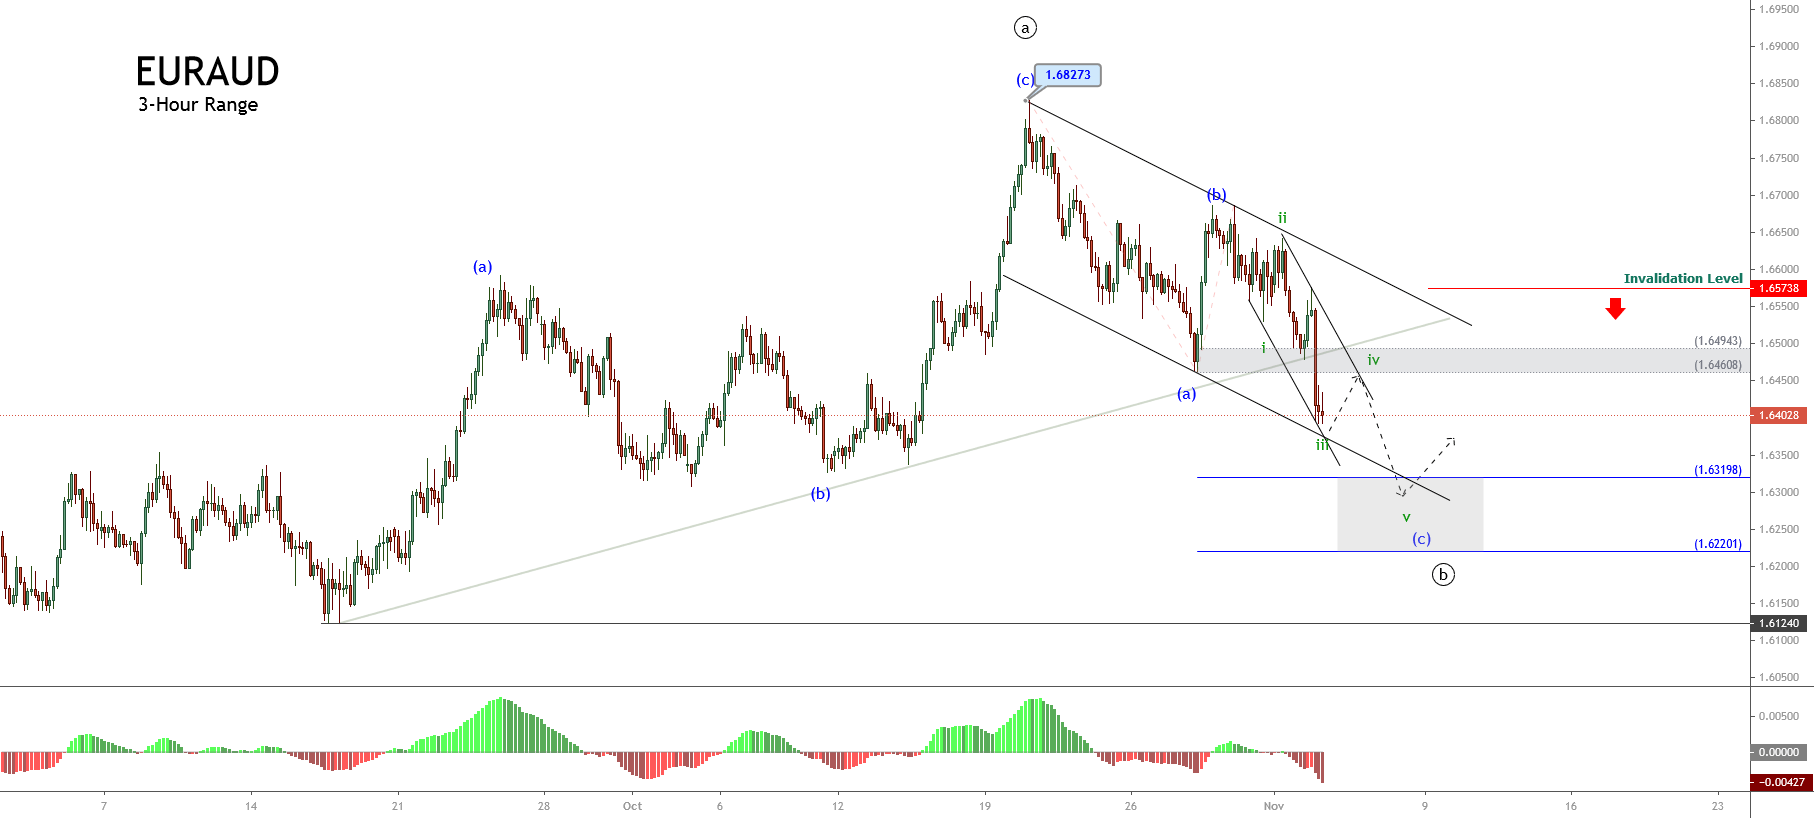
The short-term Elliott wave outlook for the EURAUD cross unfolded in the 8-hour chart reveals the progress of an incomplete bearish impulsive wave of Minuette degree labeled in blue, suggesting further drops.

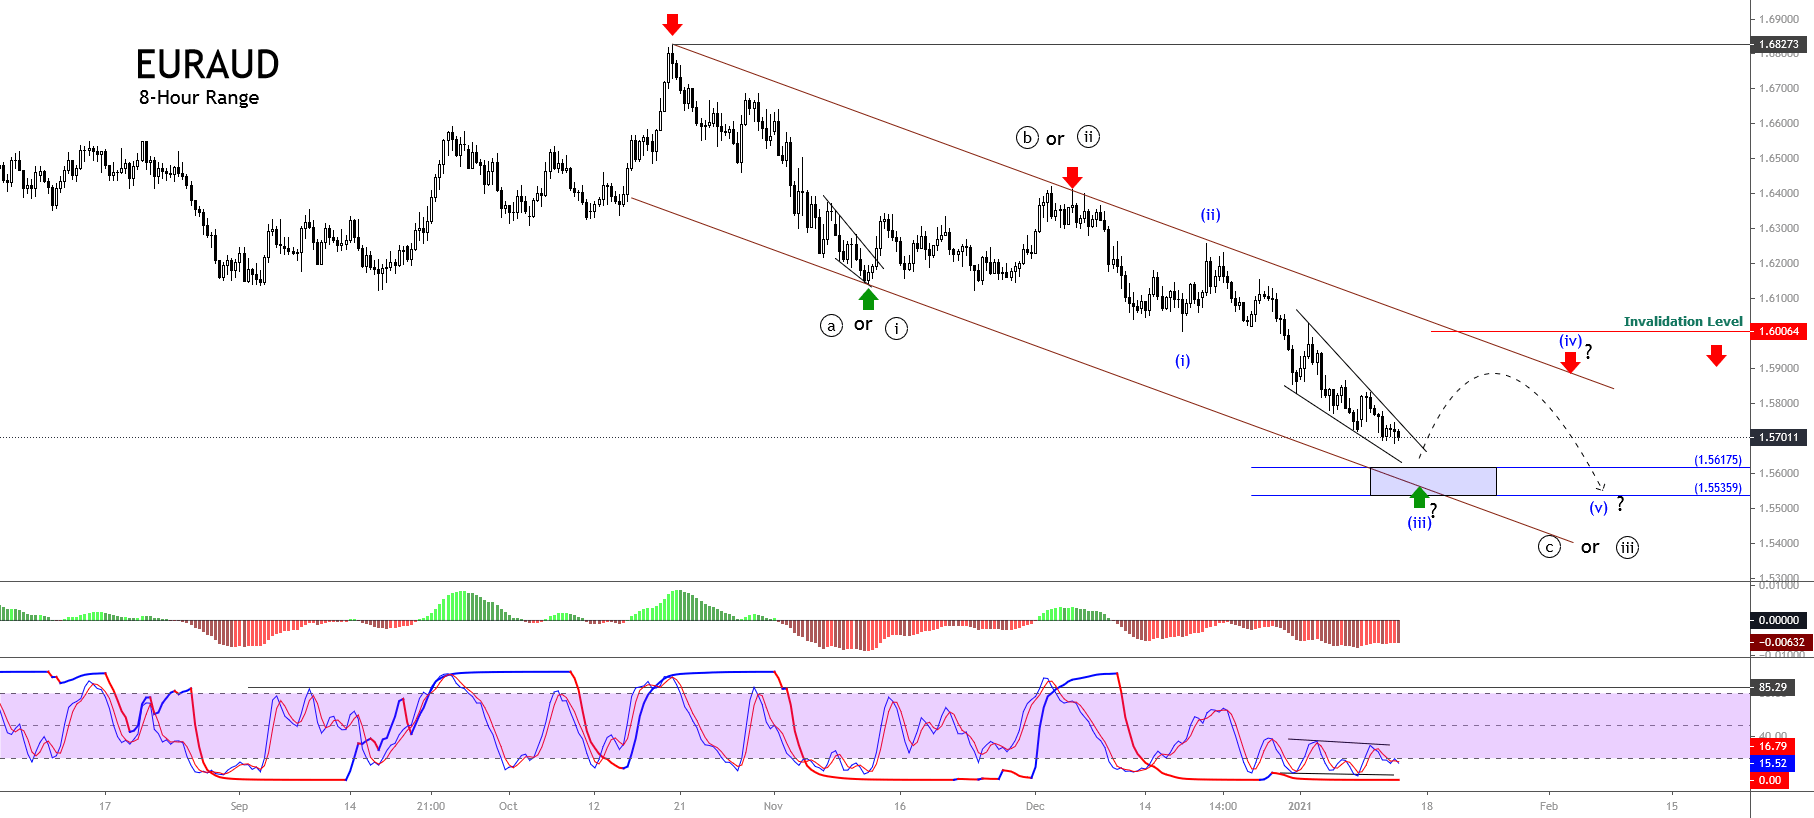
The previous chart illustrates the downward sequence that began on October 20th when the cross found fresh sellers at 1.68273 and started a bearish structural series of Minute degree labeled in black, which currently could be in its wave ((c)) or ((iii)). The internal structure seems developing its wave (iii) of Minuette degree identified in blue. 

The wave (iii) potential bearish target can be found between 1.56175 and 1.55359, which coincides with the descending channel’s base-line. Once the price tests the possible target area, the market participants could carry up the EURAUD cross toward the short-term descending channel’s upper line.

Regarding the wave (iv) in blue, considering the alternation principle, as wave (ii) is a simple corrective formation in price and time, wave (iv) should be complex and should last longer than wave (ii).

On the other hand, both the trend indicator and the timing plus momentum oscillator remain, supporting the bearish bias. Each rally could represent an opportunity to add positions to the bearish side.

In summary, the EURAUD cross continues in the extreme bearish sentiment zone advancing in an incomplete downward sequence, which could find support in the potential target zone between 1.56175 and 1.55539. Once the price finds support, the cross could start to bounce toward the upper line of its short-term descending channel. Finally, the bearish scenario analyzed will be invalid if the price soars above 1.60416, corresponding to the end of wave (i) in blue.

Categories
Forex Elliott Wave Forex Market Analysis

EURAUD Advances Supported by the RBA Minutes

Technical Overview

The EURAUD cross advanced on the overnight trading session, expecting the minutes from the last Reserve Australia Bank (RBA) interest rate decision meeting, where policymakers decided to keep unchanged the rate at 0.1% for the second month in a row.

Source: TradingEconomics.com

On the technical side, the following 12-hour chart shows the short-term market sentiment unfolded by the 90-day high and low range, which illustrates the cross consolidating in the extreme bearish sentiment zone

The bullish candlestick formation developed during the recent trading sessions carries to suspect the possibility of a short-term bounce. This bounce could find strike the level 1.62374 that corresponds to the resistance of the extreme bearish zone.

On the other hand, the short-term primary trend plotted in blue shows the bearish bias that remains in progress. The secondary trend also shows the intraday downward acceleration, which dragged the price until 1.60408, where the cross found support. Likewise, the bounce observed on the EMA(60) to Close Index carries to support the possibility of a limited recovery.

Technical Outlook

The short-term Elliott wave view for the EURAUD cross shows the downward progress of the incomplete five-wave sequence of Minute degree labeled in black, suggesting a limited recovery in the following trading sessions.

The next 4-hour chart shows the bearish movement subdivided into a five-wave sequence of Minute degree identified in black. It began on October 20th at 1.68273 and found its temporary bottom at 1.60408 on December 11th.

The previous figure illustrates the price looks advancing in its fifth wave in black, which after the bottom reached on the last Friday 11 session completed its wave (iii) of Minuette degree labeled in blue. In this context, according to the Elliott wave theory, the price action should start to develop a corrective formation, which could find resistance in the supply zone between 1.61786 and 1.62271.

On the other hand, considering that the wave ((iii)) in black looks like the extended wave, the fifth wave could have a limited extension. In this context, the lesser degree structure of the wave ((v)) could pierce slightly below the end of wave (iii) in blue.

In conclusion, the EURAUD cross shows the possibility of a limited recovery, which could strike the supply zone between 1.61786 and 1.62271, where the price could start to consolidate in a sideways range with support at the end of wave (iii) at 1.60408. On the other hand, if the cross surpasses the supply zone, it would indicate further recoveries, and the price could start a bullish rally. Finally, the invalidation level of the current bearish scenario locates at 1.62872.

Categories
Forex Signals Uncategorised

EUR/AUD: The Bear Making a Run Again

EUR/AUD has been bearish for the last two days. The pair made a bullish correction on the 15M chart to start its trading day. Then, it made a breakout at yesterday’s lowest low at 1.60920 and had a bounce at 1.60600. The price then consolidated within these two levels. Upon producing a doji candle followed by a bearish engulfing candle the pair made a breakout at the level of 1.60600. An entry has been triggered right after the breakout candle’s closing at 1.60472. The price may make a bearish move up to the level of 1.60472. However, it may find its next support around 1.60080. We may consider taking a partial profit at that level depending on its bearish momentum.

Trade Summary:

Entry: 1.60472

Stop Loss: 1.60872

Take Profit: 1.59372

The risk for the trade per standard lot is $ 300.14, Mini lot $ 30.01 and Micro lot $ 3.00. The risk-reward is 1:2.75. Thus, the reward for the per standard lot is $825.38, Mini lot $ 82.53 and Micro lot $ 8.25.

Categories
Forex Signals

EURAUD Could Continue its Last Bullish Breakout

Description

The EURAUD cross in its hourly chart exposes the corrective movement after the intraday descending wedge pattern breakout occurred during the past week. In this context, the upward move looks like a bullish impulsive move, which retraced until the demand zone is located between 1.62435 and 1.62232.

According to the classic technical analysis, a descending wedge’s bullish breakout tends to imply a bullish reversal move.

In this context, the bullish scenario foresees the bullish continuation, at least at the top of the previous impulsive move located at 1.63364. Nevertheless, the price could extend its gains to the next supply zone, situated between 1.63533 until 1.63853.

The invalidation level of the bearish scenario locates at 1.62014. In this regard, if the price extends its drops below 1.62014, it could be indicative of further declines, which could visit the level 1.60.

Chart

Trading Plan Summary


Check out the latest trading signals on the Forex Academy App for your mobile phone from the Android and iOS App Store.

Categories
Forex Signals

EURAUD Reversal Breakout on Top of Regression Channel

The EURAUD cross has experienced a strong upward movement that brought its value beyond the top of a descending regression channel.  After topping the upper line, which, as we know, is 2 sigmas above the mean line, the price has made a consolidation on the line, making a series of lower highs.

Currently, the current 1H bar is making an engulfing pattern and managing to break the recent lows, which acted as supports for the action.

If that happens, the pair may experience a corrective run to the mid of the channel. This setup has a 2.28 reward-to-risk ratio, therefore, suitable for a controlled trade on the short side, using a sell-stop order that triggers below the recent lows.

Trade Setup:

Entry: Sell-Stop at 1.6295

Stop-Loss: 1.6345

Take-Profit:1.6185

Risk and Reward

This trade setup has a risk of 52 pips and a 118 pip reward. Then, the dollar risk is 377 USD on one lot, 37.7 USD on a mini-lot, and 3.77 USD on a micro-lot. The reward is 855 USD on a lot, 85.5 USD on a mini-lot, and 8.55 USD on a micro-lot.

Categories
Forex Signals

EURAUD Bounces in a Demand Zone

Description

The EURAUD price reacted, developing an upward wide range candle during the overnight trading session when the price tested the bullish cycle’s demand zone. The cross began on September 16th when the price found fresh buyers at 1.61240 finished on October 20th when the cross found resistance at 1.68273.

Once the price found resistance, the cross started a bearish sequence as a corrective structure subdivided into a three-wave structural series, which looks in an exhaustion stage.

On the other hand, we recognize a consolidation formation between 1.61934 and 1.62494, corresponding to mid-September, where the cross found support during the Friday 06th overnight trading session.

In summary, the EURAUD cross could find fresh buyers in the zone between 1.62494 and 1.61934 from where the price could test the previous swing high located between 1.63533 and 1.63853.

Chart

Trading Plan Summary

Check out the latest trading signals on the Forex Academy App for your mobile phone from the Android and iOS App Store.

Categories
Forex Forex Market Analysis

EURAUD: Can we Profit from the Bear Side?

Overview

The EURAUD cross moves mostly bearish in a downward sequence that began in early October. The price action suggests that the cross could develop a new low before complete the bearish sequence still in progress.

Technical Big Picture

The EURAUD cross penetrated the sideways trading zone developing the second bearish leg of its three-wave movement that looks incomplete. Likewise, once the current bearish wave ended, the cross could start a new rally subdivided into a five-wave sequence.

The following chart represents the EURAUD cross in its 12-hour range, in which the sideways trading range goes between 1.60332 and 1.65744. This consolidation formation found its bottom on June 02nd, and its top corresponds to a pivot level that turned into a long-term key level.

Consequently, as long as the price keeps moving below this level, the short-term bias will continue being bearish. However, the May 29th breakout of the 1.67728 level, when the cross rallied topped at 1.68273, suggests the possibility of a new upward sequence.

Concerning its Elliott wave analysis, the current bearish sequence corresponds to an incomplete wave ((b)) of Minute degree labeled in black, which began when the price found fresh sellers at 1.68273.

Currently, the EURAUD cross advances in its internal wave (c) of Minuette degree identified in blue. Its completion could suggest a new rally that could drive the price toward the October high zone.

The short-term key supports and resistance levels are as follows:
• Resistance 1: 1.66856
• Resistance 2: 1.67824
• Resistance 3: 1.68724
Pivot Level: 1.65744
• Support 1: 1.64608
• Support 2: 1.63565
• Support 3: 1.62565

Technical Analysis Outlook

The short-term outlook for the EURAUD cross and under the Elliott Wave perspective exposes the bearish advance in the third wave of Subminuette degree identified in green, which belongs to the wave (c) of Minuette degree labeled in blue.

The following 3-hour chart shows the intraday consolidation activity that suggests the equilibrium between bull and bear traders. In terms of the wave theory, the consolidation structure should correspond to wave iv of Subminuette degree.

The Elliott wave structure suggests the possibility of a limited upside until 1.6460 and 1.6494, where the price could find fresh sellers expecting to join their limited positions with a potential target in the area between 1.63198 and 1.62201. This decline should complete the fifth wave that belongs to wave (c) identified in blue.

Finally, the invalidation level of the bearish scenario locates at 1.6573.

Categories
Forex Signals

EURAUD Breakout Retest BUY

Categories
Forex Signals

EURAUD Breakout Retest BUY

Categories
Forex Signals

EURAUD Breakout Anticipation BUY

Categories
Forex Signals

EURAUD Breakout Retest Buy

Flow Assessment

Overall buy flow, sellers are reacting off this area, but buys are holding.

Location Assessment

Price is at a buyers area and is being defended.

Momentum Assessment

There was a buildup of buyer positions and now price seems like it is retesting the area

Entry Price – Buy 1.68645

Stop Loss – 1.64283

Take Profit – 1.65866

Risk to Reward – 1:1.82

Profit & Loss Per Standard Lot = -$406/ +$738

Profit & Loss Per Micro Lot = -$40.6/ +$73.8

Fellas, now you can check out forex trading signals via Forex Academy mobile app. Follow the links below.

iPhone Users: https://apps.apple.com/es/app/fasignals/id1521281368

Andriod Users: https://play.google.com/store/apps/details?id=academy.forex.thesignal&hl=en_US

Categories
Forex Signals

EURAUD Breakout Retest Buy

Flow Assessment

Overall buy flow, sellers are reacting off this area, but buys are holding.

Location Assessment

Price is at a buyers area and is being defended.

Momentum Assessment

This is the 1st test of the buyers area

Entry Price – Buy 1.64844

Stop Loss – 1.64286

Take Profit – 1.65860

Risk to Reward – 1:1.82

Profit & Loss Per Standard Lot = -$406/ +$738

Profit & Loss Per Micro Lot = -$40.6/ +$73.8

Fellas, now you can check out forex trading signals via Forex Academy mobile app. Follow the links below.

iPhone Users: https://apps.apple.com/es/app/fasignals/id1521281368

Andriod Users: https://play.google.com/store/apps/details?id=academy.forex.thesignal&hl=en_US


Categories
Forex Signals

EURAUD Breakout Retest Buy

Flow Assessment

  • The daily is in a range, but recently there has been a strong move up by buyers that have built up positions. These buyers achieved something by penetrating old highs.
  • On the H4, seller moves are slowing down near the key reaction area.
  • On the H1, recent sellers failed to show defence of the key level


Location Assessment

  • Price is at a key reaction area on the daily, thus giving us reason to look at a lower timeframe for proof of genuine reaction structure
  • Price made a swing failure on the H4, taking out possible sell stops. This gives us more confidence in the trade as some people have gotten caught trading the wrong way
  • On the H1, we wait for the price to reach the last recent seller area and look for failure in defending that zone

Momentum Assessment

  • On the H4, the sell moves were slowing down and buyers were holding the level
  • The H1 shows a stop hunt below recent lows. Sellers failed to make a lower low here.
  • At the recent seller area on the H1, there were signs of sellers not defending that level, thus indicating to us that the buys are in.
Categories
Forex Signals

EURAUD Shows Bullish Continuation Signals

Description

The EURAUD cross develops an intraday bullish movement in the first trading session of the week after revealing a false bearish breakdown exposed in the sideways range that the cross sets since Friday, September 18th.

EURAUD, in its hourly chart, illustrates a short-term bullish sequence, which began on September 17th when the price reacted mainly bullish once it touched for the second time the zone of 1.61252 from where it started to advance, developing a sequence of higher highs and lower highs.

On the other hand, the MACD oscillator shows a short-term bullish bias, which supports the possibility of further advances in the EURAUD price. Likewise, although the price remains within a sideways intraday range, the channel’s upper zone’s re-test leads us to expect a bullish breakout, which increases since the price made a false break in the current trading session.

Our bullish scenario foresees an advance from the zone of 1.6248, from where we expect an advance until 1.6348, coinciding with the September 8th high. The invalidation level is located at 1.6198, which coincides with the base of the sideways channel.

Chart

Trading Plan Summary


Check out the latest trading signals on the Forex Academy App for your mobile phone from the Android and iOS App Store.

Categories
Forex Signals

EURAUD – Consolidation Suggests More Upsides

Description

The EURAUD cross, in its 4-hour chart, shows sideways sequence, which found a bottom at 1.6033 on last early June from where the price started to bounce, finding resistance in the psychological barrier at 1.6500 level.

On July 22nd, once the price found fresh buyers at 1.6102, the cross started to advance in an upward sequence that looks like an impulsive structure that remains in progress. This bullish movement found resistance at 1.6558 in early August, where the price started to develop a consolidation formation as an expanding triangle pattern, which remains testing the psychological barrier of 1.65. This movement leads us to foresee more upsides in the following trading sessions.

On the other hand, the RSI oscillator moves above level 60. This context leads us to support the upward bias. A bullish position will trigger at 1.6503 with a potential profit target at 1.6638.

The invalidation level of the bullish scenario locates at 1.6438 that coincides with the recent August 12th low.

Chart

Trading Plan Summary

  • Entry Level: 1.65032
  • Protective Stop: 1.64382
  • Profit Target: 1.66482
  • Risk/Reward Ratio: 2.23
  • Position Size: 0.01 lot per $1,000 in trading account.

Check out the latest trading signals on the Forex Academy App for your mobile phone from the Android and iOS App Store.

Categories
Forex Signals

EURAUD Tests the Mid-Term Bullish Trendline

Description

The EURAUD cross in its hourly chart illustrates the bounce developed by the price after the breakout of the previous intraday resistance at 1.6223. This upward movement makes us expect more raises in the following trading sessions.

The short-term picture exposes the price action developed by the cross, which reacted mostly bullish from the ascending mid-term trendline surpassing the high of the July 05th session at 1.6223. This bullish movement leads us to observe strength signals which could support the price until the upper line of the mid-term descending trendline.

The reflecting candle left by the EURAUD cross over the pivot level at 1.6223 confirms the possibility of upsides on the current trading session. In this context, a potential rally could drive the price action until the 1.6332 level, which coincides with the June 30th intraday support.

The invalidation level of our bullish outlook locates at 1.6172, which corresponds to the lowest level of the trading session.

Chart

Trading Plan Summary

Categories
Forex Signals

EURAUD Shows Intraday Recovery Signals

Description

The EURAUD cross reveals intraday recovery signals on Wednesday, suggesting the possibility of bullish movements in the following trading sessions.

The EURAUD big picture exposed in the 12-hour chart (left side) illustrates an upward sequence that began on June 02nd when the price found fresh buyers at 1.6033. 

Currently, the price moves sideways, developing a triangle pattern, where the price action tests the base-line of the chart structure. On the other hand, the EURAUD cross reveals the formation of a reflecting candle suggesting the exhaustion of the short-term bearish sequence.

The right side chart corresponds to the EURAUD hourly chart. We observe the intraday bullish reaction as a bearish trap, suggesting the possibility of further upsides in the following trading sessions.

Our outlook for the EURAUD in the coming sessions foresees an upward move from the current area towards the upper line of the triangle pattern in progress with a potential profit target at 1.6393.

Chart

Trading Plan Summary

  • Entry Level: 1.6278
  • Protective Stop: 1.6228
  • Profit Target: 1.6393
  • Risk/Reward Ratio: 2.3
  • Position Size: 0.01 lot per $1,000 in trading account.
Categories
Forex Signals

EURAUD Advances in a Potential Inverted H&S Pattern

Description

The EURAUD cross in its hourly timeframe illustrates an advance in a corrective structure that looks like a potential inverted H&S pattern.

The price action reveals sideways bias, bounded in the lower side by the June 03rd low at 1.6033, in where the cross found buyers at 1.6033. On the upper side, the price topped at 1.6586 on June 12th, from where the price started to develop a downward sequence. 

From the EURAUD hourly chart, we observe that the corrective move retraced to the zone of 1.6221, which coincides with the previous swing of June 10th. This movement warns us about a potential institutional activity of buy-side incorporations.

On the other hand, the price action reveals the advance in a formation that looks like an inverted head & shoulder pattern, which suggests the likely scenario of an upward movement. This pattern will activate if the cross jumps over level 1.6401, which coincides with the neckline. The technical target of this chartist pattern locates at 1.6616. Our invalidation level is placed below the low of the right shoulder at 1.6299. 

Chart

Trading Plan Summary

Categories
Forex Forex Indicators Forex Market Analysis Forex Price Action Forex Signals

EURAUD Reveals Strength Signals (UPDATE)

In our previous market analysis corresponding to EURAUD cross (read here,) we commented that the price action revealed potential raises, supported by the price action and confirmed by the RSI oscillator.

Trade Update

In the current update, we distinguish that the EURAUD cross soared until 1.64 level, from where the price found resistance in the dynamic resistance corresponding to the upper line of the ascending channel. Likewise, the RSI oscillator moves over level 70, which warns us about the intraday overbought.

With the advance over 120 pips in our previous setup, this situation carries us to consider the risk reduction or partially close the long position placed previously.

What’s Next?

For the next path, EURAUD could retrace until the blue box in the area of 1.6357, which could act as a pivot zone from where the price could find fresh buyers expecting to incorporate additional positions in the long side. If the price action does not experience the retracement forecasted, this is signal strong bullish sentiment in the EURAUD cross.

Categories
Forex Signals

EURAUD Reveals Strength Signals

Description

The EURAUD cross exposes in its 2-hour chart a short-term ascending move, developing a sequence of lower highs from the June 03rd low at 1.6033. 

During this trading week, we observe the last upward movement that EURAUD realized from the trading session corresponding to recent Monday 08th low at 1.6065 until Tuesday 09th high at 1.63495, which was elapsed in a small portion of time that the descending sequence from the previous week high at 1.63659. This context convinces us that institutional market participants could be interested in moving the price to the bull-side.

On the other hand, the bounce over level 40 observed in the SI oscillator leads us to conclude that the EURAUD cross is turning its bias from bearish to bullish.

Our outlook foresees a buy-side positioning from the current zone (1.6261) with a potential bullish target at 1.6532. This zone corresponds to the last pivot zone from where the EURAUD found support and then penetrated, creating a new lower low that carried down the price until the June 03rd low at 1.60332.

The invalidation level of our bullish scenario locates at 1.6139.

Chart

Trading Plan Summary

Categories
Forex Signals

EURAUD – Expecting Fresh Bullish Incorporations

Description

The EURAUD cross in its hourly chart exposes an intraday upward sequence, which began at 1.60334, in where the price reacted mostly bullish, developing five internal moves that violated the descending trendline prevailing from the past week.

For the following trading sessions, we expect a limited retrace between levels 1.6177 and 1.6145, from where the price could find fresh buyers waiting to place their limit long positions. 

Our bullish scenario considers the potential retrace until 1.6177 from where the price could find fresh buyers, which could allow us to incorporate in a new rally with a potential bullish target at 1.6394.

The bullish scenario will be invalid if the price plummets and closes below 1.6077.

Chart

Trading Plan Summary

Categories
Forex Signals

EUR/AUD Engulfing Pattern at the bottom of the channel

EURAUD has been moving inside a slightly ascending channel. The last interaction of the price drove the pair to the bottom of the channel. On Monday afternoon, the price did a strong reversal on increased volume, confirmed by a second bullish candle. We see also that the MACD made a bullish transition, as the RSI reversed from the 30 level.

A bullish setup can be created with entry at the current levels and target at the top of the channel, and stop-loss below the last lows.

Main levels:

  • Buy order: 1.67777
  • Stop-loss: 1.67017
  • Take-Profit: 1.69037

Reward/Risk: 1.66

Risk:76 pips, or $491 per lot, 49,1 per mini-lot, and 4.91 per micro-lot

Reward: 126 pips, or  $816 per lot, 81.6 per mini-lot, and 8.16 per micro-lot.

A knowledgeable trader will invest no more than 2 percent of its funds in a trade. A rookie trader should start less, no more than 1 percent. That means five micro-lots every $1,000 in the trading account.


Categories
Forex Signals

EURAUD Advances in a Potential Double Bottom Pattern

Description

The EURAUD cross in its 2-hour chart exposes the price action reacting bullish after the re-test of the short-term support at 1.65390.

The second bearish leg and its subsequent bearish failure make us foresee the EURAUD cross an upside that could boost the price until previous highs.

On the other hand, the RSI oscillator shows an upward breakout, which supports our bullish scenario.

A buy-side position could be placed from the current zone at 1.67166. Our conservative scenario foresees a potential profit target at 1.68166.

Finally, the upward scenario will be invalid if the price drops and closes below 1.66166.

Chart

Trading Plan Summary

  • Entry Level: 1.67166
  • Protective Stop: 1.66166
  • Profit Target: 1.67166
  • Risk/Reward Ratio: 1
  • Position Size: 0.01 lot per $1,000 in trading account.
Categories
Forex Signals

EURAUD – Breaking above the Falling Wedge

Description

The EURAUD cross, in its hourly chart, shows a falling wedge chartist pattern, which could be ending due to the price action soars above the upper line of the descending formation.

The falling wedge is a terminal formation that suggests the end of the trend, and in consequence, the possibility of the change of the market bias.

On the other hand, the oscillators RSI and MACD shows exhaustion signals of the bearish trend in progress. In the same way, RSI exposes a breakout signal, suggesting the probability of a new bullish movement.

If the price action confirms the bullish breakout, the EURAUD cross may soar until level 1.7019. The level that invalidates our bearish scenario locates at 1.6706.

Chart

Trading Plan Summary

Categories
Forex Assets

Understanding The EUR/AUD Forex Currency Pair

Introduction

EURAUD is a minor/cross currency pair traded in the forex market. EURAUD is the abbreviation for the euro area’s euro and the Australian dollar. The left currency, EUR is the base currency and the one on the right, AUD is the quote currency. The price of EURAUD basically tells the value of the Australian dollar.

Understanding EUR/AUD

The exchange rate of EURAUD shows the Australian dollars required to purchase one euro. It is quoted as 1EUR per X AUD. For example, if the value of EURAUD is 1.5995, it means that these many units of AUD are to be possessed by the trader to buy one unit of EUR.

EUR/AUD Specification

Spread

Spread is the way through which brokers make money. It is merely the difference between the bid price and the ask price set by the broker. These prices are often different from broker to broker. The spread differs based on the volatility of the market as well. The approximate spread on an ECN account and an STP account is given below.

ECN: 0.9 | STP: 1.7

Fees

For every trade a trader takes, there is some fee associated with it. And this fee is charged only by ECN type brokers. Typically, there is no fee on STP type brokers. The fee range is usually between 6 pips and 10 pips.

Slippage

A trader can place trades using either market order or using a limit order. In the case of market orders, the trader doesn’t get the exact price at which he executed the trade. The real price he received is different. This difference in the price is referred to as slippage.

Trading Range in EUR/AUD

As a professional trader, it is vital to know how many pips the currency pair moves in each timeframe. It gives the trader an idea of how long he must wait for his trade to perform. Traders can also assess their profit/loss in a given time frame. For example, if a trader takes a trade by analyzing the 1H timeframe, and the min market volatility is three pips, then he can expect to win or lose at least $20.91 (3 pips x $6.97 value per pip).

Procedure to assess Pip Ranges

  1. Add the ATR indicator to your chart
  2. Set the period to 1
  3. Add a 200-period SMA to this indicator
  4. Shrink the chart so you can assess a large time period
  5. Select your desired timeframe
  6. Measure the floor level and set this value as the min
  7. Measure the level of the 200-period SMA and set this as the average
  8. Measure the peak levels and set this as Max.

EUR/AUD Cost as a Percent of the Trading Range

Apart from knowing the potential profit/loss from the volatility of the market in different timeframes, one can also determine the cost variation by considering the volatility and the timeframe. For this, the ratio between total cost and volatility is taken into account. It is then expressed in terms of percentage. The magnitude of the percentage determines the cost of each trade.

ECN Model Account

Spread = 0.9 | Slippage = 2 | Trading fee = 1

Total cost = Slippage + Spread + Trading Fee = 2 + 0.9 + 1 = 3.9

STP Model Account

Spread = 1.6 | Slippage = 2 | Trading fee = 0

Total cost = Slippage + Spread + Trading Fee = 2 + 1.7 + 0 = 3.7

The Ideal way to trade the EUR/AUD

Now that we’ve got the values from the above table, here is our ideal way to trade the EUR/AUD.

The higher the magnitude of the percentages, the higher is the cost of the trade on that particular timeframe. Comprehending this to the above table, it is seen that the percentages are highest and lowest on the min and max columns, respectively. This, in turn, implies that the costs are high when the volatility of the market is feeble. And the costs are low when the volatility is high. So, it is ideal to trade on any timeframe, given the volatility of the market is above average volatility. This will ensure the fairly high volatility with affordable costs.

Furthermore, the costs can be made much lower by placing limit orders instead of market orders because this will reduce the slippage on the trade to zero. As an example, the cost percentage table is given by ignoring the slippage value.

Thus, comparing the two tables, it is evident that the costs have reduced by 50%.

Categories
Forex Market Analysis

Forex and Indices – Daily Update – 03.08.18


Fundamental Overview


The U.S. unemployment rate declined to 3.9 per cent in July.

During the Friday trading session, the US Labor Department issued the employment data for July. Non-farm payrolls reached 157,000 new jobs, being lesser than the 190,000 expected by analysts, and was worst than the 248,000 jobs created in June. The unemployment rate for its part fell to 3.9% in July from 4% reported in June by the Labor Department. Despite these data, it is still not possible to reach the level reached in May, which reached 3.8%. Finally, Average Hourly Earnings increased to 0.3% in July from the 0.1% registered in June. The following question is how much will impact the increase in average earnings in the consumer confidence and inflation rate?

source: tradingeconomics.com


Technical Analysis


EURUSD

EURUSD in the 1-hour chart is consolidating between the daily pivot level and the first daily support. For long positions, we need to wait for the close above 1.16, with a profit target in the first daily resistance at 1.1640. Short positions should be valued if the price breaks and close below 1.1580 with a potential profit target in the second weekly support at 1.1544.


GBPUSD

GBPUSD is testing as the support the lower HHL at 1.30103, a consolidation below this level could be a signal for more weakness. For short positions, the price should break and close below 1.30 level with a potential profit target in the lower low of July 19 at 1.2957. For long positions, the price must to break and consolidate above 1.3038 with a potential target in the weekly pivot level at 1.3130.


USDCHF

The USDCHF pair has moved bullish following the triangle pattern as a continuation structure. Currently, the pair is running between the first daily resistance and the daily pivot level. Long positions could be valued if the price breaks above 0.9960, with a potential profit target in the first weekly resistance at 0.9976. For short positions, the price must close under the daily pivot level at 0.9941, with a potential profit target in the confluence between the second daily support and the first weekly support at 0.99.


EURAUD


EURAUD is moving sideways between 1.5724 and 1.5782. Currently, the cross is testing the lower base of the range. A breakdown could drive to the EURAUD drop to the first weekly support at 1.5673. In the bullish scenario, the price could reach the second daily resistance at 1.5818.


GBPAUD

GBPAUD is moving sideways testing the base of the lateral channel in the same way that EURAUD. The breakdown could trigger more falls with a potential target in the second weekly support at 1.7572. For the bullish case, the breakout above 1.7690 could lead the price to the potential profit in the daily pivot level at 1.7720.


FTSE 100

The British index FTSE 100 is consolidating in the confluence zone between the second daily support and second weekly support. For short positions, the price should break below 7,551 pts., with a potential profit target in the third weekly support at 7,516 pts. For the reversal case, long positions should be valued if the price breaks above 7,590 pts, with a potential target in the next swing zone at 7,661 pts.


DAX 30

The DAX 30 is consolidating below the third daily support. In this case, it is highly probable that the price makes a reversal move, at least, to the first daily support located at 12,684 pts. For short positions, the price should close below 12,485 pts, with a potential target in the second weekly support at 12,348 pts.


Categories
Forex Market Analysis

Forex and Indices – Daily Update – 25.07.18


Fundamental Overview


President Trump will meet with Juncker.

US President Donald Trump will meet with the president of the European Commission, Jean-Claude Juncker, in an attempt to overcome the difficulties in bilateral relations between the United States and the European Union, specifically facing the application of additional tariffs to European cars exported to the United States which Trump seeks to increase.

The European Union applies additional 10 per cent tariffs to automobiles imported from the United States, while the United States applies only 2.5 per cent to European cars. Finally, President Trump commented on his Twitter account that both the United States and the European Union should eliminate all tariffs, barriers and subsidies, making trade between them both more just.


Technical Analysis


Forex Trading Indicators

EURUSD

Forex Trading Indicators: EURUSD continue moving sideways but with an intraday bullish bias. The price continues bouncing from the daily pivot at 1.1684. For intraday positions, long positions should be considered if the price breaks above 1.1710, with a potential profit target placed at the second resistance at 1.1747 and the second potential target in the area between the third daily resistance (1.1777) and the first weekly resistance (1.1785). Short positions should be valued if the pair breaks down the weekly pivot level at 1.1680 with a profit potential target at 1.1615.


GBPUSD

Forex Trading Indicators: The GBPUSD pair, as seen on a 30-minutes chart, broke up and consolidated above the first daily resistance on Tuesday 24th’s trading session. In the current session, the price can not strike above the first intraday resistance (1.3178.) For long positions, the price should break over 1.3175 with a potential profit target at 1.3212 (second intraday resistance). Short positions could be valued when the price breaks under 1.3140 with a potential target in first daily support at 1.3090.


USDCHF

Forex Trading Indicators: The USDCHF pair in the 30-minutes chart is moving sideways between the daily pivot (0.9937) and slightly below the first intraday support (0.9915). For long positions, the Swiss currency should break above the daily pivot level with a short-term target at 0.9960 (weekly pivot level); for bearish continuation, we need to see a price close below the intraday range at 0.9914, the potential profit target is at 0.9887 (third daily support).


EURAUD

Forex Trading Indicators: The EURAUD cross in the 30-minutes chart is testing the confluence between the daily and weekly pivot point at 1.5778. For bullish positions, the price should break above 1.58, and the potential target is at the first intraday resistance (1.5829). Bearish positions should be considered if the cross breaks under 1.5717 with a profit target in the confluence zone between the first weekly support (1.56735) and the second daily support (1.56612).


GBPAUD

Forex Trading Indicators: The GBPAUD cross is running sideways between 1.7680 and 1.7794. For long positions, the price should break above 1.7778, and its potential target is slightly above the first weekly resistance at 1.7858. In the case of short positions, the price should break down 1.7680, with a potential target at 1.7589 level.


FTSE 100

Forex Trading Indicators: The FTSE 100 in the 30-minutes chart turned bearish moving from the daily pivot at 7,699 to the weekly pivot level (7,649.9). For bullish positions, the price should break above 7,700 pts, with a potential target at 7,791 pts, which is the convergence zone between the second weekly resistance level and the second daily resistance. Bearish positions should be valued if the British index breaks under the weekly pivot level at 7,649 with a potential profit at the first weekly support (7,593 pts.), the second profit target is the HHL at 7,521 pts.


DAX 30

Forex Trading Indicators: DAX 30 in the 30 minutes chart. After failing the test to the first weekly resistance (12,737.1 pts.), the German index moves bearish below the daily and weekly pivot level turning to bearish the market sentiment. For long positions, we need to see the breakout above 12,600 pts with a potential target in the re-test of the first weekly resistance at 12,737 pts. A short position is considered if the price breaks down 12,537, and its potential target is the second weekly support at 12,293 pts with extension in the HHL at 12,143 pts.


Categories
Forex Market Analysis

Forex and Indices – Daily Update – 03.07.18


Fundamental Overview


Asian Session with all eyes placed on the RBA decision.

Forex and Indices: In the Overnight session, markets will place their eyes on the Board of Reserve Bank of Australia (RBA) interest rate decision in which the analysts’ consensus expects that Governor Philip Lowe and the Board members decide to keep the interest rate at the record low 1.50% which is unchanged since August 2016.

Despite the unemployment rate drop in May to 5.4%, and the inflation rate kept unchanged in May at 1.9%, being near to the RBA inflation target; The cooling on housing market and  the increased volatility in global markets due mainly to the tariffs conflicts, could drive to the RBA  to decide to keep the interest rate unchanged again.

Forex and Indices - Daily Update

Source: Forex.Academy Collection – Forex and Indices


Technical Analysis


EURUSD

The pair still is moving in a bearish wedge pattern which, if it breaks below 1.15649, could drive the price to a new lower low ending the bearish cycle near to the 1.1450 zone coinciding with the lower trendline of the bearish wedge. In the opposite case, if EURUSD breaks above 1.16801, the common currency could drive to test the invalidation level placed at 1.1852.


GBPUSD

GBPUSD is still running in a bearish wedge and has a new lower low pending before the cable starts a new bullish cycle. This lower low could be developed as a Bullish 2B pattern (Bear Trap) as a reversal pattern. As long as the price does not make a reversal pattern, the price will continue its bearish bias. Invalidation level of the bearish cycle is at 1.34725.


USDCHF

USDCHF is developing a triangulation structure. The RSI oscillator shows that the price has a bearish bias. However, as the price doesn’t have a definite trend in the short-term, we will expect a false breakout before we define our bias for this pair. In the long-term, the Swiss currency is consolidating a rally which started on February 15th, 2018.


EURAUD

The EURAUD cross maintains a bullish bias, due to the price moving inside an ascending wedge. Additionally, RSI is running in an ascending trend and is above the 60 level. We can expect a false breakout to the 1.59 zone before it completes the bullish cycle. If the price falls below 1.5702, we could evaluate short positions.


GBPAUD

The GBPAUD 2-hour chart shows a sideways move, as long as the price moves above 1.78747. The cross will have a last bullish target pending, placed at 1.8085 with an invalidation level below 1.78080, from where we will consider short positions with a profit target in the 1.74 zone.


FTSE 100

The FTSE 100 is moving sideways as a complex corrective structure consolidating the March to May rally. In the middle of global volatility in the stocks markets, we prefer to consider long positions rather than the short positions. The short-term support to control is 7,500 pts.


DAX 30

The DAX 30 2-hour chart shows that the German index has found support at 12,100 pts. From this area, we could start to propose potential zones for entry in the long side.


Categories
Forex Market Analysis

U.S. Housing Starts Soars – Forex and Indices – Daily Update 19.06.18


Fundamental Overview


U.S. Housing Starts soars to 2007 highs in May.

Daily Forex Technical Analysis: The U.S. Housing Starts surged 1.35 million in May, the highest level in near to 11-years and over the 1.31 million forecasted. Building permits fell to 1.301 million, under the 1.35 million expected by the analysts.

This buoyant data is attended by the housing market sentiment which fell to 68 points in June from the 70 points reported in June. This decrease in the homebuilder’s sentiment is produced mainly by the rising costs in lumber prices.

On the other hand, the 20-City Home Price Index in the US reported by S&P/Case-Shiller in May soared to the record high 208.62 points, the highest level previous to the 2008 financial crisis.


Daily Forex Technical Analysis


EURUSD

Tha pair EURUSD is moving sideways finding to test the May 29th level support at 1.15102, and it looks like the price is making a bottom pattern. For it to place us on the bullish side in EURUSD, we expect the short-term resistance breakout at 1.16445.


GBPUSD

The Pound broke down the low of the May 29 (1.32045 level)  losing the 1.32 psychological level. Now we expect that the price will complete the bearish cycle in the area between 1.3109 and 1.2936, from where the price should start to bounce at least to the 1.3298 level.


USDCHF

USDCHF is running bullish to the parity making a flag pattern. Our vision for the Swiss currency is that it could make a new bearish leg with a mid-term target on 0.98 level.


EURCAD

EURCAD is developing an expanding triangle inside an ascending channel; we expect that the cross makes a new high to the 1.555 area before we see more drops to the 1.49 zone.


EURAUD

EURAUD reached the mid-term target zone in the 1.57 area. We foresee that if the cross breaks down the short-term trendline, EURAUD will complete a flag pattern, which should drive to new lower lows, likely to 1.53 area.


DAX 30

DAX 30 is moving laterally in a major degree structure testing the long-term pivot level at 12,652.2. A breakdown of this level could drive the price to test the short-term support at 12,547.6, it could even fall to 12,300 area, from where we expect the start of a new rally.


FTSE 100

FTSE 100 broke down the May-29th low making a new lower low; this makes us foresee that the British index should see a new lower low, probably to the 7,400 area, from where FTSE should build a new bullish connector.


Categories
Forex Market Analysis

Forex and Indices – Daily Update – 12.06.18


Fundamental Overview


The exposure of the historic meeting and agreement reached between the U.S. President Donald Trump and the North Korean leader Kim Jong Un for the “denuclearisation” of the Korean peninsula have already been discounted. However, currently, the uncertainty is being headed by the statements of IMF’s Director Christine Lagarde, who has said that the escalation in trade tensions are affecting the global economy, commenting that clouds over global economy are ‘getting darker by the day’ after the G7 summit.

World Trade Organization General Director, Roberto Azevedo, also echoed the comments made by Lagarde adding that the increase in commercial tensions that we are witnessing involves a high economic impact, which can undermine the strength of economic growth since the last financial crisis.”


Forex Technical Analysis Signals


EURUSD

EURUSD is consolidating, developing a pennant pattern bounded by the levels 1.173 and 1.184. A breakout of this pattern could lead the price to the 1.196 level. Invalidation level keeps in 1.1616.


GBPUSD

GBPUSD moves in a corrective structure as a flag pattern testing the blue box area as a support level. The breakout of the 1.342 level should lead to the pound to 1.359 resistance. The invalidation level of this scenario is 1.3254.


USDCHF

The structure of the Swiss currency looks like an Irregular Flat Elliott Wave. If this scenario is valid, and for inverse correlation with EURUSD, the USDCHF pair could reach 0.99 level before it drops again. Invalidation level is 0.9983.


EURCAD

EURCAD moves inside a pennant pattern; we expect a breakout of this structure to lead the price to new higher highs at least to 1.5533 level where we foresee the start of a new downward move for to build a new bearish leg.


EURAUD

In the same way as EURCAD and EURUSD, the EURAUD cross is consolidating, but in this case, the price is moving inside a pennant pattern. In the short-term, if EURAUD breaks above 1.5621, we expect fresh highs that should reach the 1.5761 level. Invalidation level for this scenario is 1.5282.


DAX 30

DAX 30 continues driving sideways, in the current session it has touched the blue box reaching the 12,948 pts level, rejecting to the downside. We maintain our scenario on which a price decline below 12,652 pts should activate a bearish second leg, with a target of 12,000 pts. Invalidation level is 13,102 pts.


FTSE 100

A lateral channel of 112 pts bounds the FTSE 100; our vision is that the British index should make a false bullish breakout before continuing its previous downward movement to complete the corrective structure. The potential target is 7,390 with an extension at the 7,073 level. The invalidation level of the bearish scenario is 7,903.5.


Categories
Forex Market Analysis

Forex and Indices – Daily Update – June 07th, 2018

Forex and indices trading signals for the end of the trading session of June 07th, 2018 and short-term forecast for the coming sessions. In this issue, we make a follow-up of the price cycles of: EURUSD, GBPUSD, USDCHF, EURAUD, EURJPY, FTSE100 and DAX 30.


Hot Topics:


  • Pairs against the Greenback in key levels
  • Euro crosses close to make a second leg
  • European indices trading signals remain with bearish bias but are not activated.

Pairs Against The Greenback In Key Levels

EURUSD reached the 100% of equal waves in the 1.1831 level; this suggests is that the common currency should make a corrective move, probably to the area between 1.172 to 1.166 levels. The bullish target long-term is the area between 1.1889 to 1.194 levels. Invalidation zone is below 1.1616 level.


USDCHF reached the blue box zone from where we anticipate that the Swiss currency should start a bounce. For this pair, our position has changed from bearish to neutral.


GBPUSD, as expected in the previous daily update, is making a corrective move as a bearish connector, where we expect more rises to the pound. Short-term bullish target is between 1.3485 and 1.36 levels. Invalidation level is below 1.3254.


Euro Crosses Close To Make a Second Leg

EURJPY has reached our target area for the first cycle. By the Alternation Principle from the Elliott Wave Theory, we foresee a complex correction, probably a sideways structure. In principle, the correction could end near 128.6 level. From this zone, the price should pay its bearish divergence. As our readers could see in the chart, the corrective sequence is not tradeable (dashed line.) Invalidation level is 126.330.


For EURAUD we have two scenarios. The first scenario consists of the completion of the internal bullish cycle with the price reaching the 1.5547 level, where it could begin a corrective move. The second scenario is for the price to make a corrective sequence in three waves to the 1.5382 area, where the cross could start a rally to the 1.5547 level. If it soars above the Control Level at 1.5621, it is likely that the price would complete its internal bullish cycle in the zone between 1.57025 to 1.57612 level. Invalidation level is at 1.5282.


European Indices Remain With Bearish Bias But Are Not Activated

The FTSE closed the session in the blue box, the potential bearish move with the target in the area between 7,468 to 7,390.5 is active. If the British index breaks down and closes under the 7680, the bearish targets will be activated. The invalidation level remains above 7,803 pts.


In the same way, the DAX remains with a bearish bias short term, selling positions will activate only if the price breaks down and closes below 12,700 pts, with a profit target at 12,500 pts, and the potential extensions to deeper falls to 12,300 and 11,900 pts. Invalidation level remains above 13,102 pts.


Categories
Forex Market Analysis

Forex and Indices – Daily Update for May 29th, 2018

FX Market Update Hot Topics:

  • U.S. CB Consumer Confidence in May Slightly Below the Analysts’ Expectations.
  • RBA Board Member says “who cares what’s happening to house prices.”
  • The indices sell-off continues, supported by the Italian crisis.

U.S. CB Consumer Confidence in May Slightly Below the Analysts’ Expectations.

The consumer confidence drops slightly below the analysts’ consensus at 128 pts versus the 128.2 expected. However, the confidence level in April was corrected down from 128.7 to 125.6 pts. Despite this correction, the U.S. Consumer Confidence keeps in the highest levels since 2001.fx

EURUSD accelerated its drops to the critical zone of the bearish cycle. The common currency falls for the seventh consecutive week breaking down the November 2017 support at 1.15539. For the coming sessions, we expect a limited fall to 1.14483 and then a recovery in three waves which could see the 1.197 level in the long-term. In the short-term, we update the invalidation level of the bearish cycle to 1.16317.


In the same way with EURUSD, GBPUSD continue its plunges for a seventh consecutive week dropping to the 38.2% Fibonacci level of the previous long-term cycle. We foresee new falls to the region between 1.31095 and 1.29357. Updated invalidation level is 1.33231. If price breaks above the break-down candle, we will consider changing the bias from bearish to bullish.


The Swiss currency is moving sideways expecting more volatility for the Greenback. We continue seeing more drops for this pair to the zone between 0.9815 to 0.9783 levels. The new invalidation level is 0.99831. The break-down candle signals more declines in the short-term.


RBA Board Member says “who cares what’s happening to house prices.”

The RBA’s Board Member Ian Harper said to the Wall Street Journal that “the bank will raise their interest rates when it has a basis for doing that because inflation is starting to pick up.” Member Harper added, “when all that starts to line up who cares what’s happening to house prices.” Harper continued that the RBA target “doesn’t target house prices.”

EURAUD. As the scenario expected, the price fell under the control level; now we expect a limited drop to the area between 1.5307 to 1.5195 levels, from where the price could start to bounce. Invalidation level is 1.54554.


GBPAUD is bouncing in the Potential Reversal Zone, 1.76773 to 1.75597, from where we foresee a bullish move to 1.78995. Invalidation level is on 1.77451. In the short-term, RSI shows signals of change in the trend bias from bearish to bullish.


The indices sell-off continues, supported by the Italian crisis.

FX Market Update: This Tuesday, the FTSE has continued the sell-off started last Wednesday 23rd, and the price consolidates below the invalidation level at 7,750 pts proposed in previous updates. The impulsive bearish move could stop briefly at 7,570 pts and make a bounce.  The new invalidation level for the short-term is 7,803.5 pts, and the main bias keeps on the bearish side.


In the same context, DAX  30 opened with a bearish gap, testing the mid-term support on 12,659.1 pts. Considering the bearish gap context, it is probable that the German index in the short-term makes a Dead Cat Bounce Pattern, watching the 12,000 pts as a target. Invalidation level is updated and established at 13,040.6 pts.


Categories
Forex Market Analysis

Indices Broke Down Their Bullish Trendlines

Hot Topics:

  • Indices Broke Down Their Bullish Trendlines.
  • Euro Group Close to Find a Short-Term Bottom.
  • US Dollar Climbs Before Minutes Release.


Indices Broke Down Their Bullish Trendlines

Trend Line Analysis: Indices in the early trading hours of the session opened lower breaking down its bullish trendlines. However, FTSE and DAX did not crumble below their invalidation levels. Likely, both indices could make a 1-2-3 pattern. Invalidation level in FTSE is at 7,753.3 points.


On the other hand, DAX has paid its bearish divergence in 12,958 points, as said in a previous Daily Update. Invalidation level of the bullish structure is at 12,918. We expect the German index to have a consolidation structure and reveal the new potential move.


Euro Group Close to Find a Short-Term Bottom

The Euro group, in general, is moving bearish. Currently it is consolidating and showing signals of a potential reversal; however, we expect a brief price recovery, to then see more downward moves long-term.

EURUSD continues its downtrend and has two new potential bearish targets in the short-term: 1.16734 and 1.15637. From this zone, the pair could create a new bullish connector. Invalidation level is moved at 1.18298.


EURAUD continues above the Control Level and is moving sideways. For the oceanic cross, we have two scenarios:

  • First scenario: the price breaks below the control level and finds new lower targets in 1.53074 or 1.52952.
  • Second scenario: the price breaks above the invalidation level at 1.56192 and sees new highs, the first resistance is 1.57233 level.


EURCAD is bouncing from the first bearish cycle target level at 1.50373. The invalidation level for this bearish cycle is 1.51385. If the price breaks above this level, the price could see the 1.5533 level again.


US Dollar Climbs Before Minutes Release

Trend Line Analysis: The US Dollar Index raises at the halfway point of the trading session while it waits for the Minutes of the FOMC. GBPUSD still moves at the potential reversal zone, where the price should make a new connector. Invalidation level of the bearish sequence is 1.34918.


In the same way, the USDCHF moves higher making a pullback to the breakdown zone. Probably, the pair will move higher as an ascending A-B-C pattern before to collapsing again, building a new leg long-term. Invalidation level of the bearish cycle is at 1.00561.


Categories
Forex Market Analysis

Negotiations Between US-China Support Indices Advances

FINANCIAL MARKET UPDATE TODAY

Hot Topics:

  • Indices continue soaring boosted by US-China negotiation progress.
  • UK Government seeks to pay its national debt.
  • The price action between EURUSD and USDCHF show divergences.
  • EURCAD and EURAUD are moving on critical zones.

Indices continue soaring boosted by U.S.-China negotiation progress

The advance in negotiations between the U.S. and China maintain the optimism in markets for the second consecutive session. The FTSE 100 consolidated in the record highs. Despite the fact that RSI shows a little bearish divergence, this does not mean a reversal sign of the trend. We keep our bullish vision for the FTSE in 8,000 pts as the next target.


DAX 30 adds to the market optimism by the progress between the U.S. and China negotiations. The index climbs near to the first target level proposed in previous updates (Daily Update – May 15th). The RSI oscillator does not show movement exhaustion signals.
– First target level 13,250.5.
– Second target level: 13,497.7.
– Invalidation level: 12,918.3


UK Government seeks to pay its national debt

The UK Government will appeal to the High Court for access to a National Fund untouched since 1928 to pay its National Debt. The “National Fund” was opened in 1928 by an anonymous donation of £500,000 with the condition that it must keep untouched until the U.K. have enough money to pay its national debt entirely. Currently, the fund ascends to £475 million, but the U.K. debt rises to £1.7 trillion.

The pound is moving sideways, in this session has tested the 1.348 resistance. RSI shows bullish divergences signals; we expect that the RSI moves above the 60 level for it to start to change the current bearish bias to bullish. Consider that the price action must confirm the new bias. For the moment we maintain neutral our position in GBPUSD.


The price action between EURUSD and USDCHF show divergences

USDCHF is moving bearish and has paid its bearish divergence falling to the 0.99203 level. It is likely that the price continues moving bearish to 0.9875 and start to bounce for it to make a new connector for a major degree bearish cycle. Invalidation level remains on 1.00561.


On the other hand, EURUSD keeps moving sideways. In the current session, the common currency has tested the resistance level at 1.18257 without success. However, RSI is showing reversal signals but it is necessary that the oscillator breaks above the 59.06 level and the price soar above the key resistance level 1.18257. Invalidation level is below 1.1717.


EURCAD and EURAUD are moving on critical zones

EURCAD has touched the first long-term bearish target level at 1.50373. The RSI oscillator shows bullish divergences as a bearish trend exhaustion signal. Now is the time to expect what the price action does, if the cross moves to the second long-term bearish target at 1.4866 or makes a reversal pattern. In this zone, our position turns from bearish to neutral.


Similarly to EURCAD, EURAUD moves below our second bearish long-term target placed in 1.5552 level. RSI shows bullish divergence as weakness in the bearish cycle. Now we are watching the control level in 1.54673, and waiting to see what will the price action will do. We have two scenarios:

– First scenario: The price breaks below the control level. In this case, it is likely that the cross continues its bearish momentum. For this scenario, the new bearish targets are placed at 1.5307 and 1.5195 levels. Invalidation level is 1.57279.

– Second scenario: The price makes a bullish reversal pattern, in this case, we have 1.5727 as the target.


Categories
Forex Market Analysis

Italy and the Two Children Policy Drive the Markets


Hot Topics:


  • Majors against US Dollar shows exhaustion signals.
  • European indices close the mixed trading session.
  • GBPNZD arrives at our PRZ aided by the two children policy announced in China.
  • EURAUD reaches the second bearish long-term target.

Majors against US Dollar shows exhaustion signals.

Italy is adding volatility to the Eurozone due to the agreement between Movement Five Stars, and Lega Party for the new Prime Minister.  EURUSD bounced from 1.1717 where the price created a bullish divergence. In today’s session, RSI broke its bearish trendline upward, but to complete the start of a new cycle, it is necessary that the price action confirms the new sequence. Invalidation level for this latest move is 1.17.


The GBPUSD fell to the Potential Reversal Zone as we expected last week. Currently, the price is moving narrowly, but we anticipate that the price would make a new lower low as a false breakdown. We still maintain the bearish bias while the RSI does not break above the invalidation level at 1.36.


The USDCHF pair leads the move against the US Dollar, the price made a throwback to parity and had been rejected downward. Our projection for the Swiss currency is that the price could reach 0.99203 as first support, second support is 0.98097. Invalidation level is at 1.00561.


European indices close the mixed trading session.

The FTSE 100 soars to the highest level reaching 7,868.1 in the last trading hour. The market could be placing its eyes on the 8,000 points as the psychological resistance to be struck during the next days. The new invalidation level is placed at 7,753.3 pts.


On the opposite side, the DAX 30 closed the trading session bearish, consolidating the ascending wedge pattern above the last price congestion zone. The increasing risk of Italy’s exit from the Eurozone is knocking the European markets. On the other hand, the BUBA’s chief Jens Weidman has announced that he is open to succeed Mario Draghi as president of the European Central Bank. The new invalidation level is moved up at 12,918.3 pts.


GBPNZD arrives at our PRZ aided by the two children policy announced in China.

GBPNZD continues moving downward as forecast in the past week, aided by the “two children” policy announced in China. The announcement is raising the confidence of the New Zealand dairy producers. After this bearish accelerated move, we expect a pause in the downtrend. Invalidation level is at 1.96636.


EURAUD reaches the second bearish long-term target.

EURAUD continues moving downward in the second long-term target at 1.5548. RSI shows signals of the climatic move; this means that the price acceleration in this bearish move is close to initiating a consolidation process. Invalidation level is at 1.5727.


Categories
Forex Market Analysis

Forex and Indices – Daily Update – EURAUD Potential 2B Pattern


Hot Topics:


  • Indices consolidate at their highs in the last trading session of the week.
  • Swiss Franc shows the first reversal signals, Pound and Euro still consolidate.
  • GBPNZD – The bearish momentum remains.
  • EURAUD – Develops a potential Bullish 2B pattern.

Indices consolidate at their highs in the last trading session of the week.

After having reached the highest level since January, the FTSE 100 price is rejecting the resistance level retracing to the bullish trend-line. Oscillators show bearish divergences, warning about the trend exhaustion. The leading RSI indicator still keeps the bullish bias for the current trend. We keep our eyes on the 8,000 points mark as a psychological resistance. Invalidation level is at 7,486 pts.

Forex signal live


The DAX 30 continues with its bullish momentum and now consolidates the breakout above the latest sideways structure (13,034 pts). The RSI oscillator still shows that the trend is upward. The pending bullish target is at 13,250 points. Invalidation level of the bullish cycle still rests at 12,665 points.


Swiss Franc shows the first reversal signals, Pound and Euro still consolidate.

The EURUSD continues consolidating in a Potential Reversal Zone. On the other hand, RSI is showing bullish divergence as an indication of exhaustion of downward movement. However, as long as the price does not break above the trend-line and move above 1.1810, we maintain the bearish bias. The invalidation level of the bearish cycle is at 1.1996.

Forex signal live


GBPUSD, the price continues moving in the sideways range and showing its intention to break down towards our Potential Reversal Zone. The RSI oscillator shows the bearish momentum continues. Invalidation level 1.3617.


After moving sideways for nine days, USDCHF is breaking down the consolidation range. We expect the Swiss Currency to reach the 0.9920 level, in agreement with its bearish divergence. RSI also shows bearish signals supporting the corrective scenario.


GBPNZD – The bearish momentum remains. The GBPNZD cross continues developing the bearish movement towards the long-term bullish trend-line. As was observed in our May 16th Daily Report (read more), the next target level for the current bearish move is 1.9388; the invalidation level is 1.9663.


EURAUD – Developing a potential Bullish 2B pattern.

We see a potential Bullish 2B Pattern on the EURAUD, which could be activated as long as the price breaks out of 1.5721 level, with a target at 1.5888. The price is moving at the bottom of the long-term upward trend-line. The invalidation level of this bullish scenario is 1.5654.

Forex signal live


Categories
Forex Market Analysis

Forex and Indices – Daily Update May 17th, 2018


Hot Topics: 


  • Main currencies consolidate levels against the Dollar.
  • Is a new strength cycle to the Euro upcoming?
  • Indexes continue rising

Main currencies consolidate levels against the dollar.

EURUSD

EURUSD continues to move laterally in a potential reversal zone. We still expect the price to visit the level 1.1737 as a cheat pattern (see 2B Pattern), before making a new bullish cycle.

Daily Forex Market Update


GBPUSD

GBPUSD continues to consolidate around the 1.35 level; we foresee that the price could create a false break down to 1.3423, from where it should make a connector and start a bullish process, probably as an ABC.


USD/CHF

USDCHF continues to move laterally in the parity zone without showing signs of change. By its correlation with EURUSD, we cancel the scenario proposed of the potential double top, and we project a last bullish movement, which could reach 1.0101.


Is the new cycle of strength for the Euro upcoming?

EURCAD

After breaking down its bullish trend line, we expect that the EURCAD can make a new lower low in the area between 1.5037 to 1.4866. In case it falls below 1.4818, which corresponds to our level of invalidation of the main upward cycle, we could see deeper declines to the 1.4519 level.

Daily Forex Market Update


EURAUD

EURAUD continues consolidating at its potential reverse zone, as in the case of EURCAD. We anticipate that the cross could make a new lower low at 1.5610 before returning to create a new bullish move. If EURAUD goes below 1.5467, the price could see more drops in the area between 1.5037 and 1.5159.


Indexes continue upwards.

FTSE

FTSE 100 continues its bullish rally for the eighth consecutive week and is approaching record highs reaching 7,788.2 points. It is likely that we will see the British index reach the psychological barrier of 8,000 points and may even reach 8,155 points.


DAX

As we mentioned yesterday, DAX broke up the consolidation structure and goes towards the 13,250 points, pending bullish objective level to reach. While the index does not complete its bullish cycle, all indices will continue with the bullish momentum.


Categories
Forex Market Analysis

Forex and Indices Daily Update – May 16th, 2018

Hot Topics:

  • Currencies against the Dollar could be completing internal cycles.
  • EURAUD – Closing partials and moving SL.
  • GBPNZD – More falls are expected.
  • Indices continue consolidating.

Currencies against the Dollar could be completing internal cycles.

Forex and Indices Market Update: EURUSD continues to move below 1.18 and bouncing within the potential reversal zone. However, it still shows no signs of changing the trend. It should be noted that the Dollar Index has completed an internal cycle which should begin to correct soon. For the pair, we maintain a neutral position.


In the same way, GBPUSD continues to move within a sideway range towards the zone of a potential reversal from where we expect it to begin to bounce.


Without significant changes, the Swiss Franc (USDCHF) continues moving sideways around the parity level; the current movement makes us speculate that there could be a limited upward move as a false breakout.


EURAUD – Closing partials and moving SL.

Forex and Indices Market Update: The EURAUD cross has reached the first level of the potential reversal zone at 1.57236, fulfilling the conditions of the completion of an internal cycle. Additionally, EURAUD has touched the long-term uptrend line and would be forming a bearish channel structure. The bearish bias persists, and the price could reach 1.5610. We still maintain our short positions and move the invalidation level to 1.5888. Now is time to make partial closes in open trades.


GBPNZD – More falls are expected.

Forex and Indices Market Update: The GBPNZD cross is moving within a consolidation structure with a bullish bias. Our outlook is that the price could make a new low in areas from 1.9388 to 1.93049, this area coincides with the long-term trend line. In case of breaking below 1.93, we could see more falls with a target at 1.905 level.


Indices continue consolidating.

Forex and Indices Market Update: The German DAX 30 index continues moving in a range between 12,918 and 13,034 points. We expect a new upward movement to complete the ascending wedge structure that could be in the form of a false breakout. The AO oscillator is showing a bearish divergence, which indicates a price exhaustion signal which could support our bullish target forecasted at 13,250 points.


The FTSE 100 shows the same situation; the British index is also consolidating in the upper part of the ascending wedge. For the moment we remain neutral in indices expecting a new trading opportunity.


Categories
Forex Market Analysis

Dollar Index reaches its highest level since December 2017.

Hot Topics:

  • Dollar Index reaches its highest level since December 2017.
  • Indices return to the bullish path
  • EURAUD advances as forecasted.

Dollar Index reaches its highest level since December 2017.

The dollar index rose to 92.74 after the employment data from the United States, its highest level since December 2017. The unemployment rate fell in April to 3.9% from the 4.1% achieved in March, the lowest rate for more than 17 years. Technically, the greenback reached 92.74 and began to draw back forming a potential bearish 2B pattern.

The single currency reached the potential reversal zone, testing the support level at 1.19 from where it began to bounce. From this area, we will be monitoring long positions in the EURUSD.

The USDCHF made the same move as the dollar index, climbing to a new higher high, but it still did not touch the level of invalidation we have forecast in previous updates (above 1.0370). Short positions will be valued below the 0.9973 level, the invalidation level for short positions remains intact.

The cable, as in the case of the EURUSD pair, made a new low at 1.3488 developing a potential ending diagonal pattern. Once the breakout occurs it will be validated; we could begin to place long positions. In the meantime, we will remain alert to the movements that it carries out.

Indices return to the bullish path

The FTSE short position proposed yesterday has been invalidated when its price has been rejected at the lower edge of the rising wedge, drawing a bullish movement. For now, the index is in our potential reversal zone so we will maintain our neutral position.

The DAX 30 continued moving bullish in the current session with all eyes on the next psychological resistance at 13,000 points. The invalidation level is 12,400 pts.


EURAUD advances as forecasted.

The cross continues moving on the bearish trend we have been forecasting since January and out of which we have been profiting when we took short positions at 1.6084. It is time to move our stop-loss to break-even, and possibly, take partial profits.


©Forex.Academy

Categories
Forex Market Analysis

Indices: Bull traders still could have space to go up?

Hot Topics:

  • Monitoring the indices alignment before a correction.
  • Euro group: weakness will continue against its main pairs.

Monitoring the indices alignment before a correction.

As we have said in previous daily updates, the markets are correlated, and big moves occur when they are all aligned. The FTSE 100 continues making a bullish extended cycle and is near to reaching critical levels for a reversal (7,500 to 7,600 area.)

In this session, for the fourth time, the DAX 30 couldn’t soar above the critical resistance level 12,622. It is likely that the German Index climbs up above the resistance before we expect it to fall.

Finally, as we can see, the NIKKEI 225 could still reach the area between the 22,620 to 22,800, before starting a corrective move. In conclusion, Indices still have space to see a new high, but we expect limited bullish moves.

Euro group: weakness will continue against its main pairs.

The Euro currency is developing a bearish move after the rally that started in 2017. The EURUSD pair continues the bearish cycle reaching the first blue box, testing the 1.2071 level. Before the Employment data release in the US, we expect a downward continuation to the zone between 1.1869 to 1.1815. From this area, it could start to bounce but it is too soon to foresee that move.

Looking at the Euro crosses, EURAUD is moving as we anticipated in our last Short-Term Pick (24th April), We expect the price to drop down to the region between 1.5748 and 1.5650. Invalidation level is at 1.6192.

EURCAD could not reach the 1.5811 zone; this situation makes us think that the bearish force could accelerate to our target level which is 1.54.

On the other hand in the money market, the USDCHF pair is still on an upward trend which is near to completing the bull cycle. In the zone between 0.9943 to 0.9993, the pair could make a new connector, then, start developing a bearish cycle.

The Pound has dropped to the 1.375 level, from where we expect the cable to start a bounce and make a consolidation move. The retracement could reach the area between 1.39 to 1.40. Invalidation level is at 1.4246.(c) Forex.Academy

Categories
Forex Market Analysis

EURAUD short Signal

Fantastic conditions have been met for a short signal on the EURAUD pair.

EURAUD

Price is currently a few days before a pivot in time (red vertical line). Price has also been in a firm short-term uptrend over the past 9 days, which itself is a little extended. There is a beautiful bearish candlestick on the daily chart. Additionally, the RSI and CI are in a mirrored structure, with the CI in extremely overbought conditions. Target area should be the 1.594 zone.

©Forex.Academy

Categories
Forex Market Analysis

Daily market overview: busy day

Events and Volatility

A rise in volatility is expected to take place today as many announcements are going to be published

Wednesday’s main focus will be the Bank of Canada’s monetary policy announcement. We don’t expect any policy change, but the price action on  Canadian dollar tells us that investors are anticipating positive comments from the BoC. A lot has changed since their last March’s meeting. Six weeks ago, they raised concerns about lower wage and household credit growth, but since then, oil prices hit a 3-year high, retail sales rebounded, the unemployment rate declined, job growth accelerated, housing market activity improved, inflation increased, and manufacturing activity expanded at a robust rate. Both U.S. President Trump and Canadian Prime Minister Trudeau have said they are close to reaching a NAFTA deal, and, according to Mexico’s Economy Minister, the negotiation team could meet again on Thursday in Washington to start working on their issues again, and hopefully move the process forward

On the other hand, economic sanctions appear to be a very effective tool for challenging rivals in the market. A couple of weeks ago, the U.S. pushed Rusal to the brink of survival by limiting its services, banning the maintenance of its dollar accounts, and prohibiting Americans from conducting any business with the company. Although these steps may be seen as an attempt to influence the Russian position in Syria, they also make sense from an economic viewpoint.

For the first time, the Minutes revealed that the RBA board explicitly recognizes  “it was more likely that the next move in the cash rate would be up, rather than down” (news.com). This may not seem significant since the RBA governor has been stating this for some time. Still, this is the first time the board has expressed its support for this kind of view and now confirms the RBA’s bent towards a tightening bias, in line with what we observe across the majority of G10 central banks.

GBP remains in play on Wednesday with U.K. CPI scheduled for release. Price pressures are expected to ease. Investors think that the Bank of England will raise interest rates next month but they need to see data validate that view before extending the pair’s gains.


GBP/USD

On the daily chart, the price had done a big effort to reach a pivotal level at 1.4335

there’s a special price action with a hammer, by forming a descending wedge

If a retracement is confirmed, then it might be a correction on its way to 1.409

 EUR/CAD

On the daily chart, the price has broken the down trendline from the low of 2018

The price is located at a very sensitive area, as it reached the lower trendline connecting the highs and the resistance zone between 1.566-1.553

Any breakthrough would expose it to 1.61 level, any continuation of the bears would retest 1.52 level


EUR/AUD

The price was moving in up channel on 4H until it has broken it last Friday

The pair needs a motivating momentum to go down further, so it retested the broken channel with rebounding from the lower trendline connecting the highs as it shown.

It is  also respecting the 200 moving average, and provided us with an AB=CD harmonic pattern.

The price is expected to visit 1.5825 again then to 1.574.


© Forex.Academy