Introduction
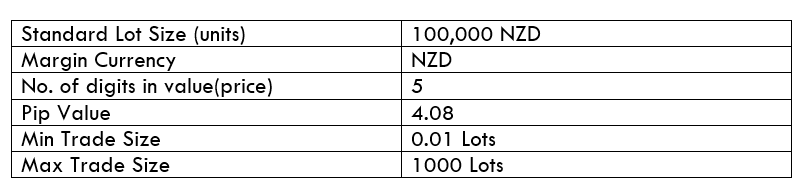
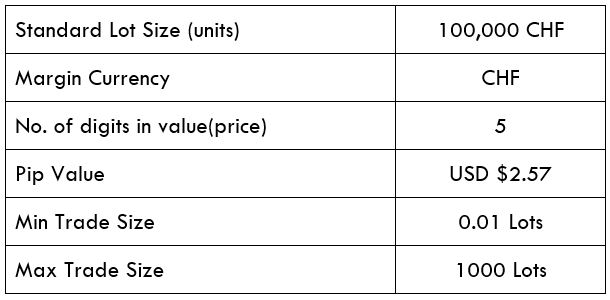
In the JPY/HUF currency pair, JPY represents the currency of Japan. On the other hand, HUF is the Hungarian Forint. This currency pair represents the value of Hungarian Forints (quote currency) per Yen (base currency). This pair can be represented as 1 JPY per X HUF. For example, if the value of this currency pair is at 2.91 (CMP), then about 2.9 HUF is required to purchase one JPY.
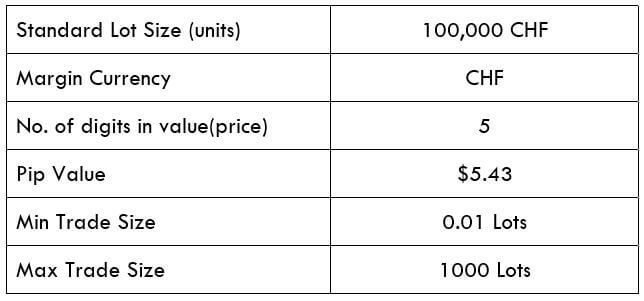
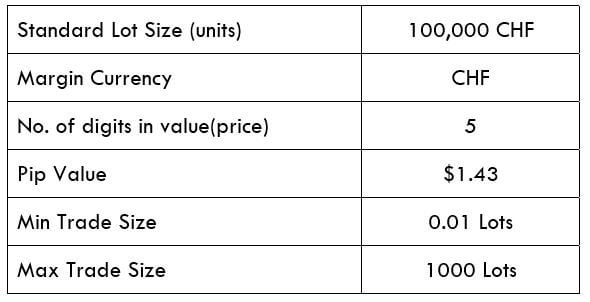
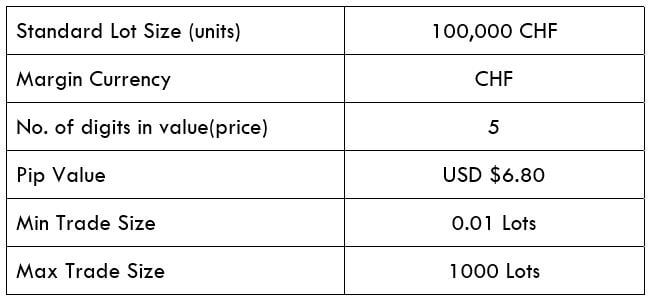
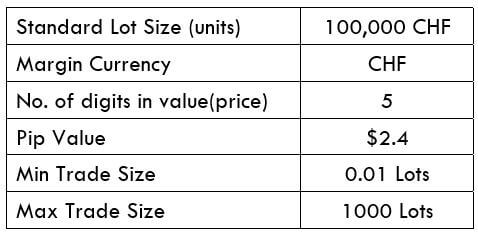
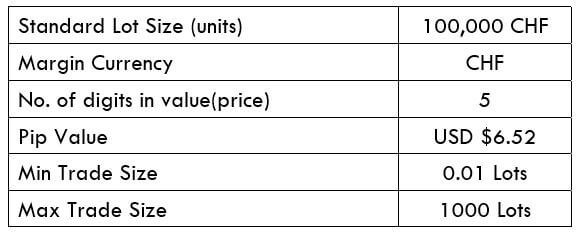
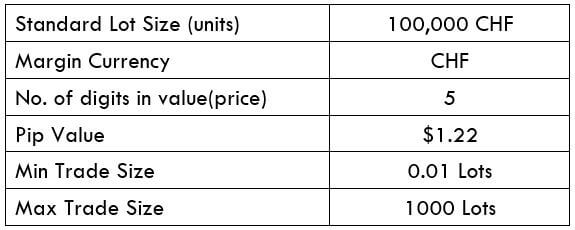
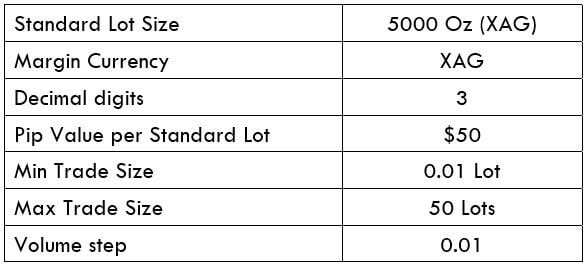
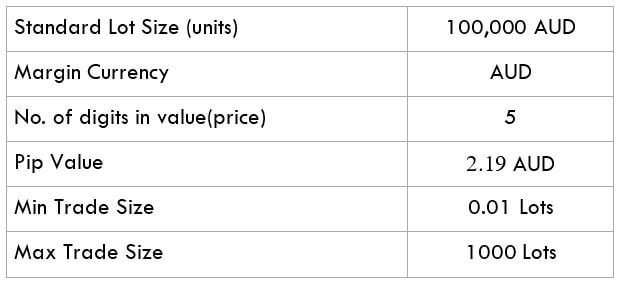
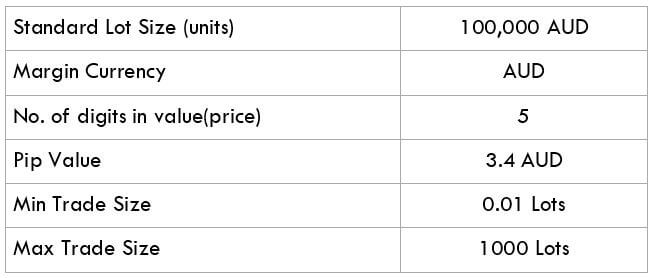
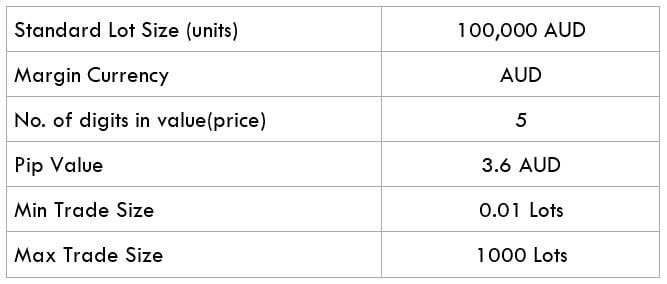
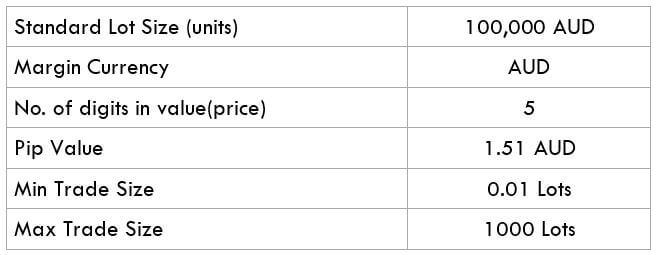
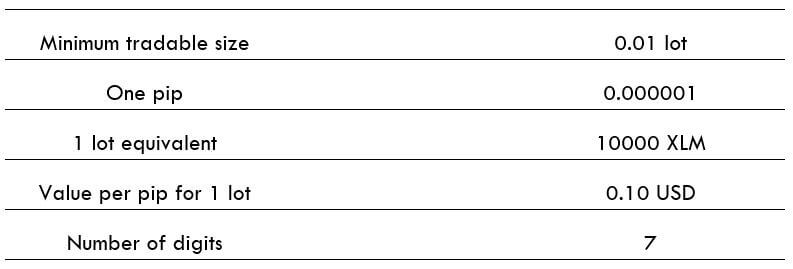
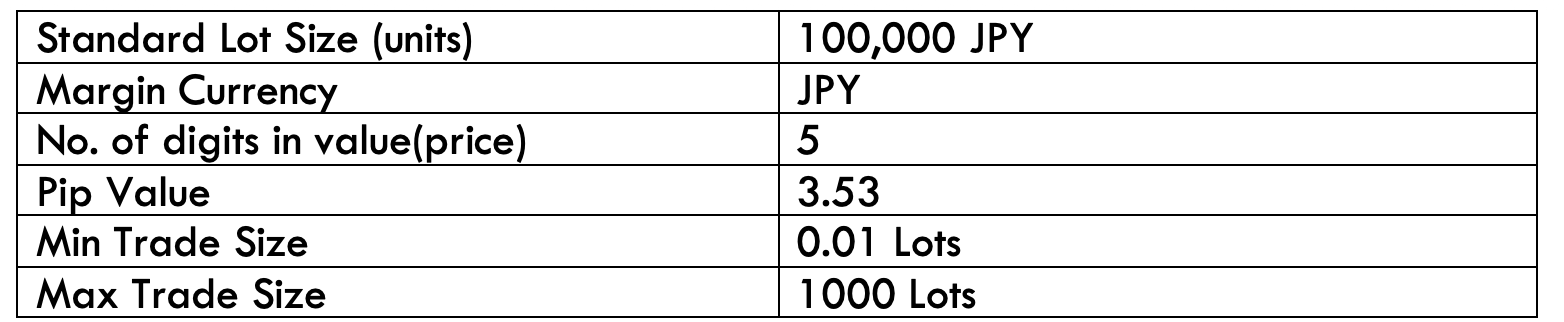
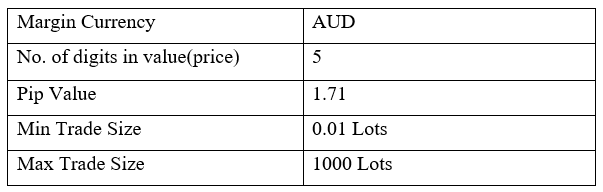
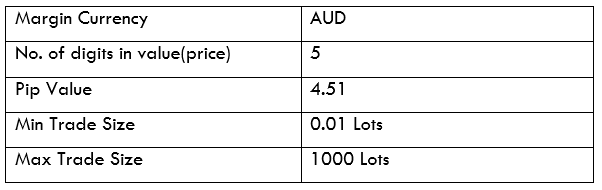
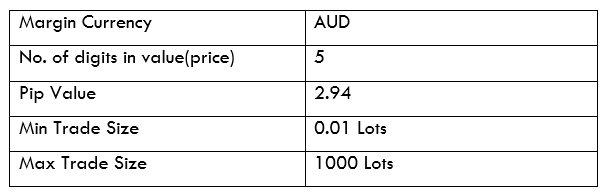
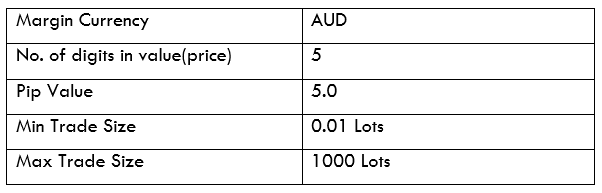
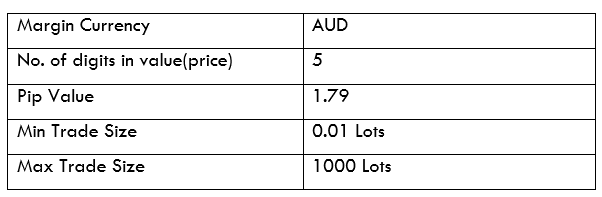
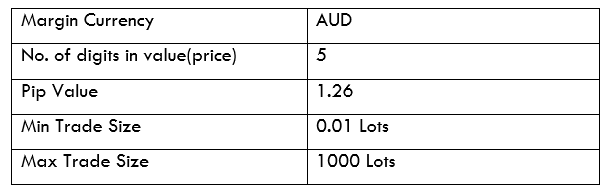
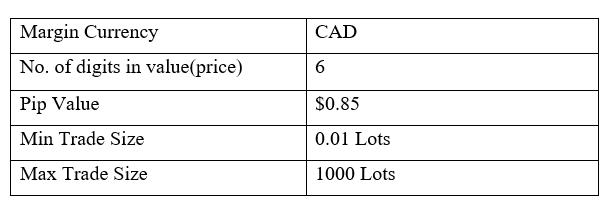
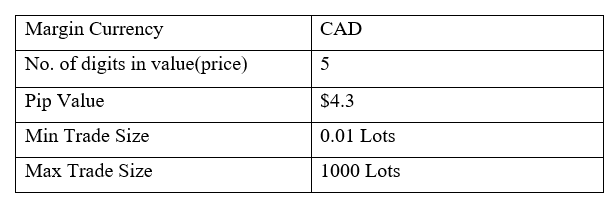
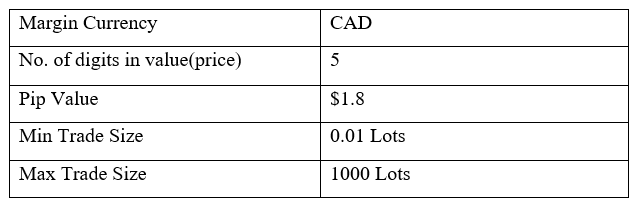
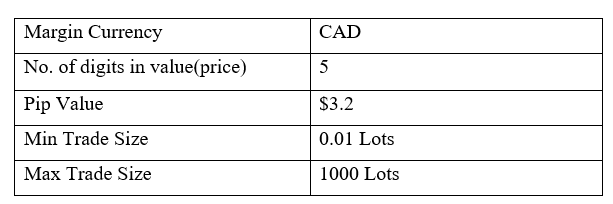
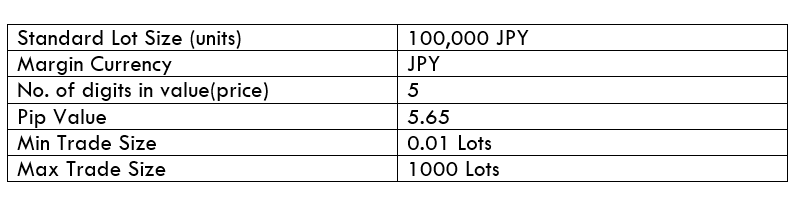
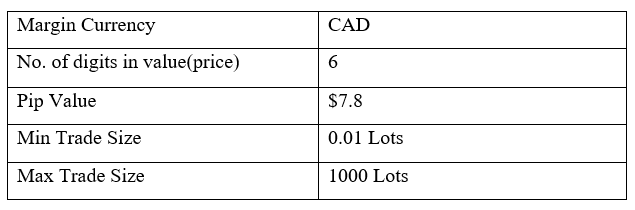
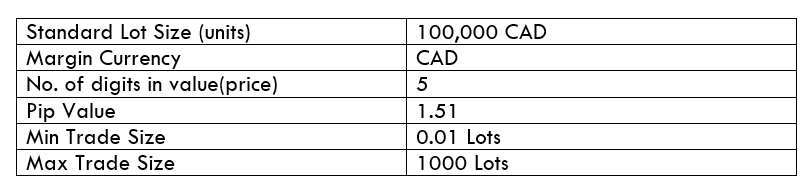
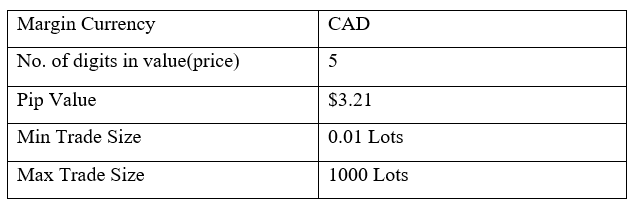
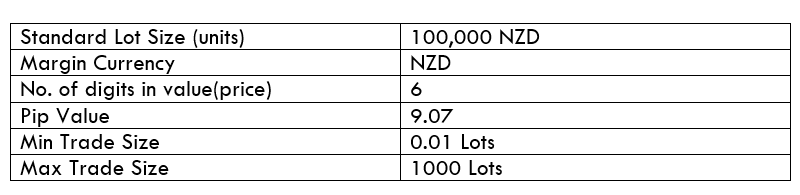
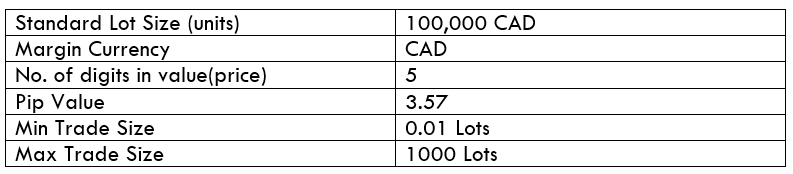
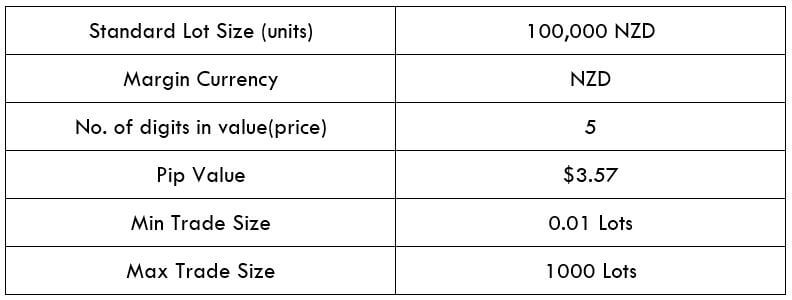
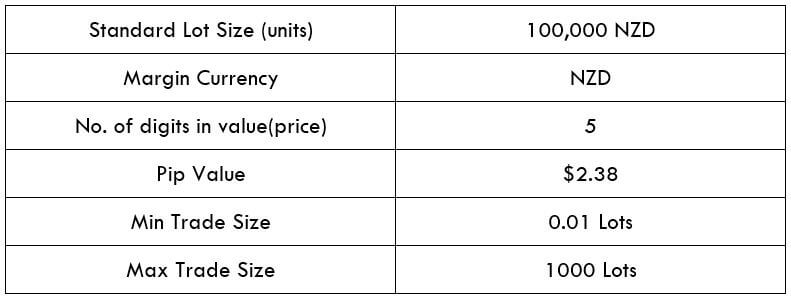
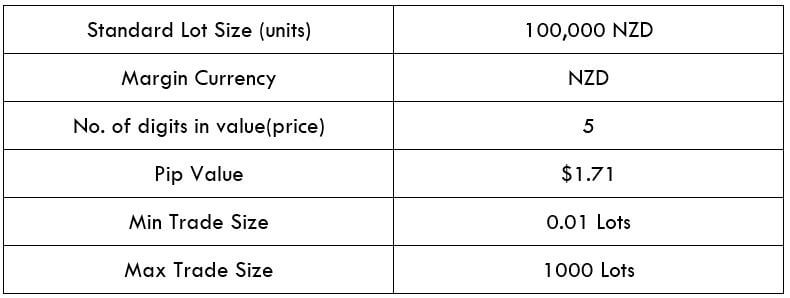
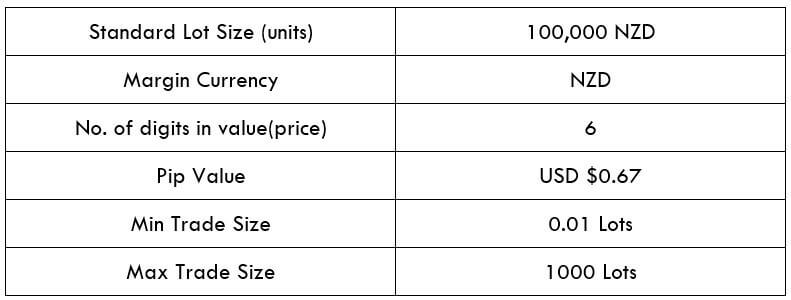
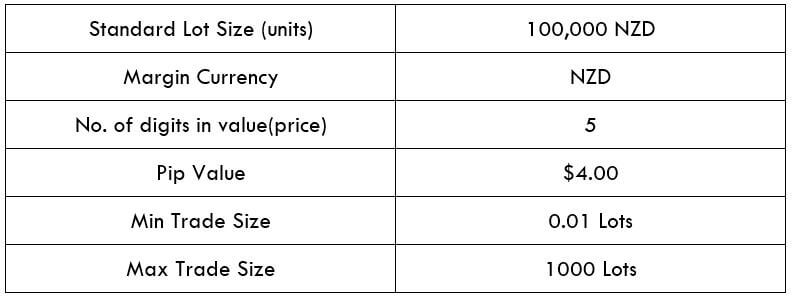
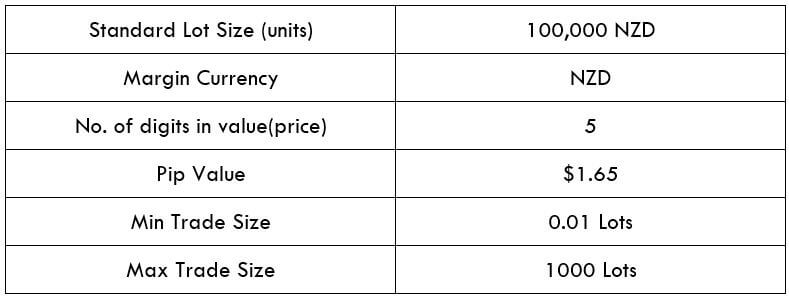
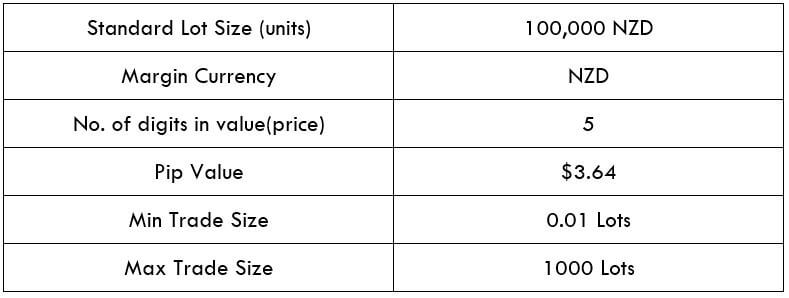
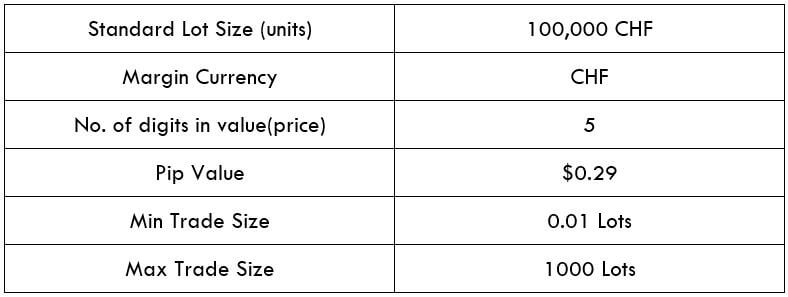
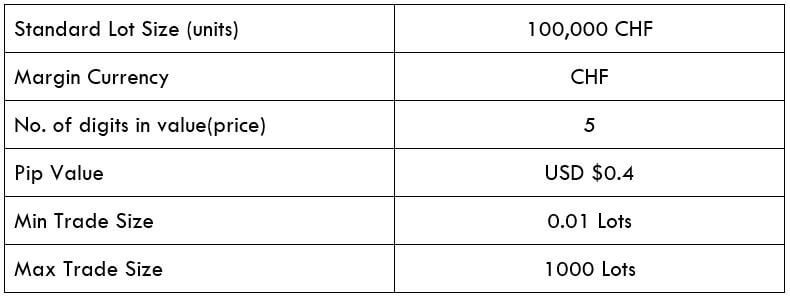
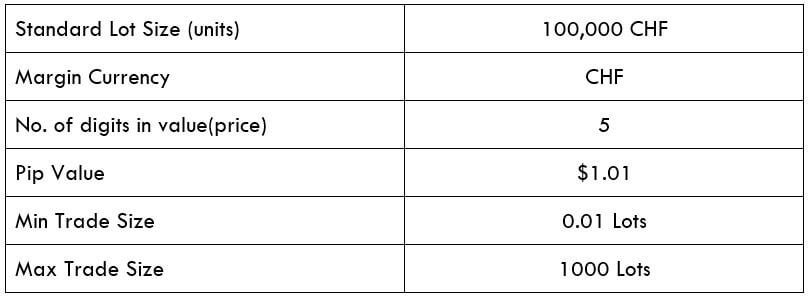
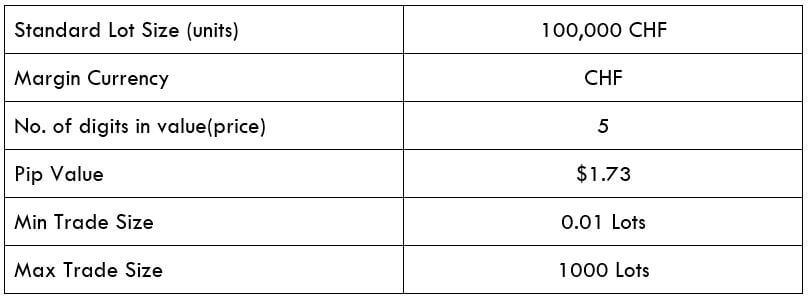
JPY/HUF Specification
Spread
If we want to determine the spread, we should subtract the Bid price and the Ask price. Spread is a trading charge that the broker takes as soon as we open a trade. This value changes with the change of the execution model.
Spread on ECN: 13 pips | Spread on STP: 18 pips
Fees
Every broker takes a trading fee from a trader. The process of taking the fee is almost the same as every broker in the world. Note that the fee is only applicable to ECN accounts.
Slippage
Slippage happens when the execution price and open trade price are not the same. The volatility and the broker’s execution speed are the main cause of slippage.
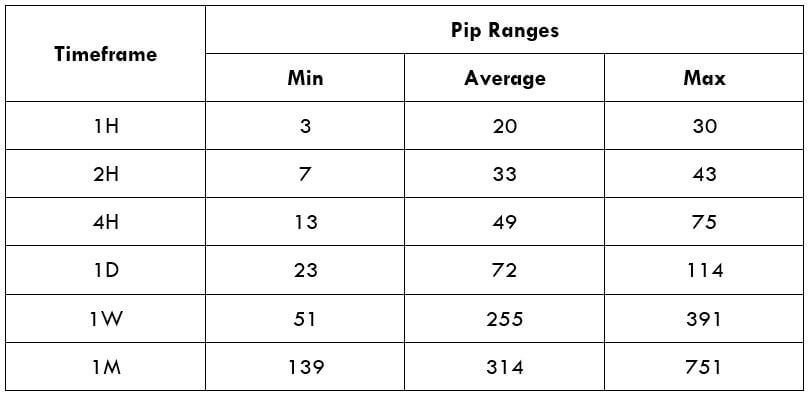
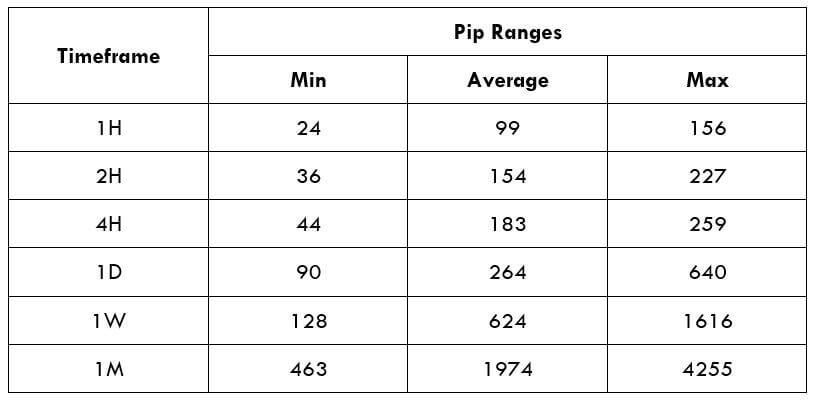
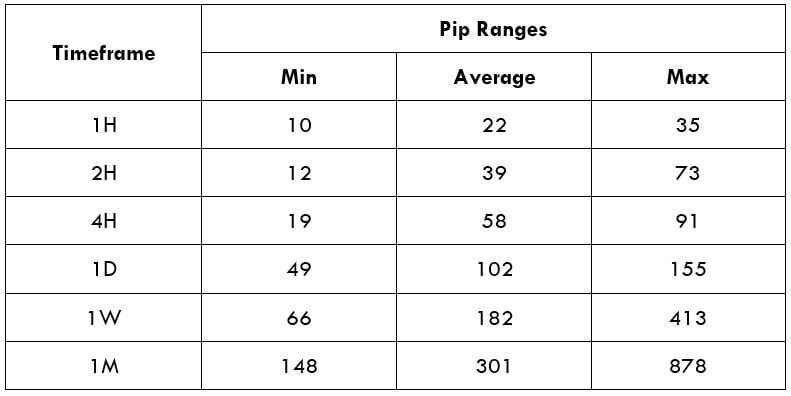
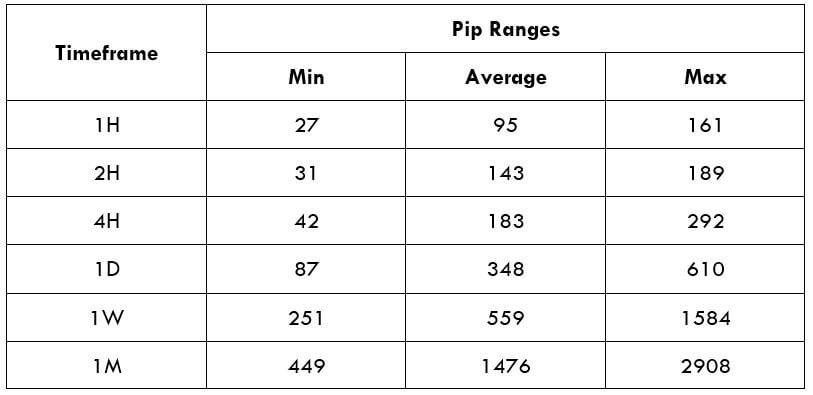
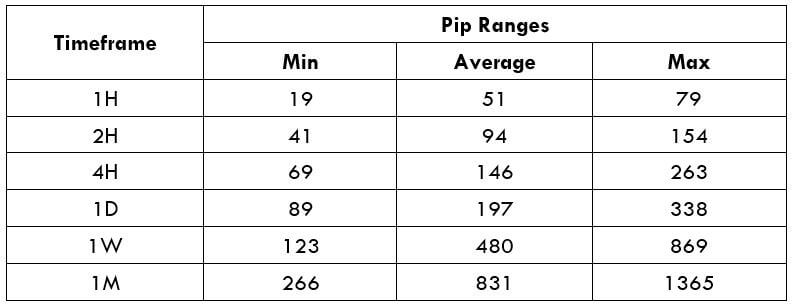
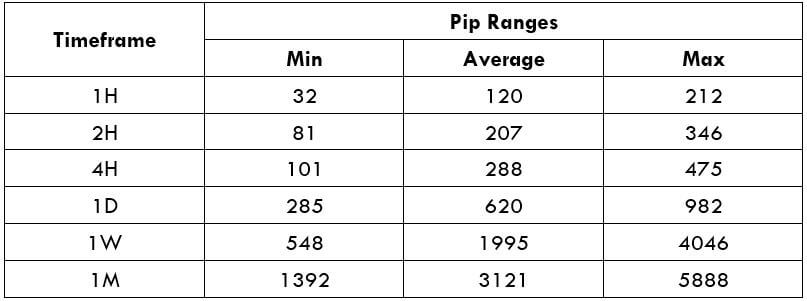
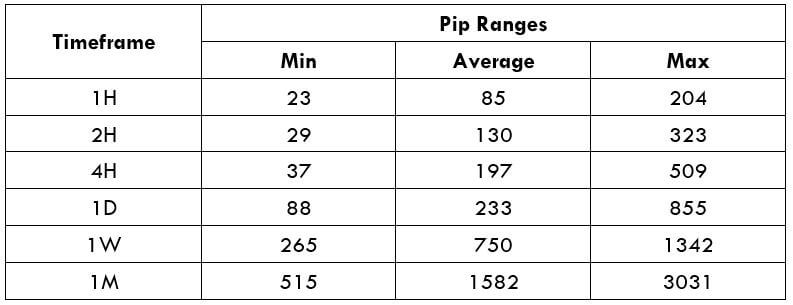
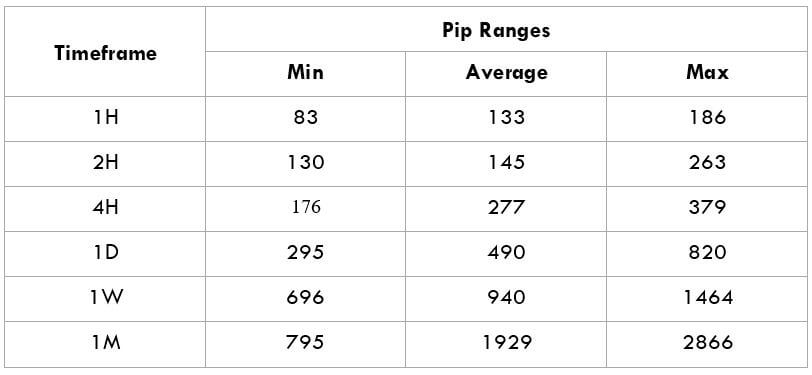
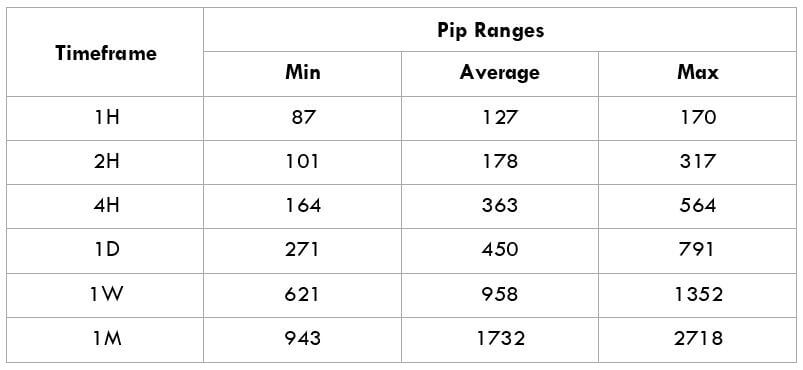
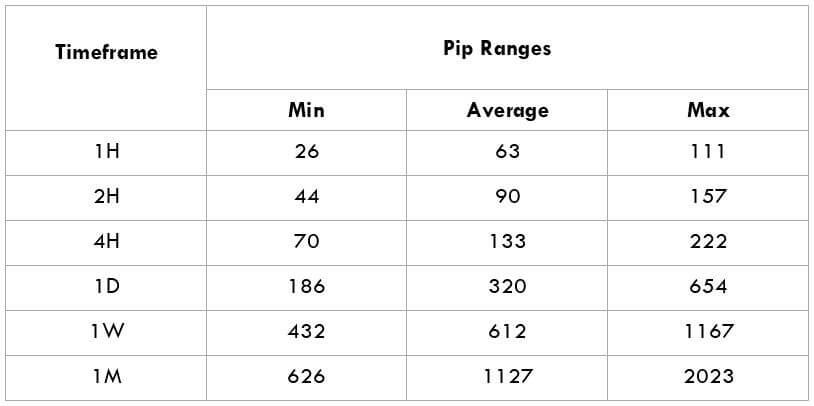
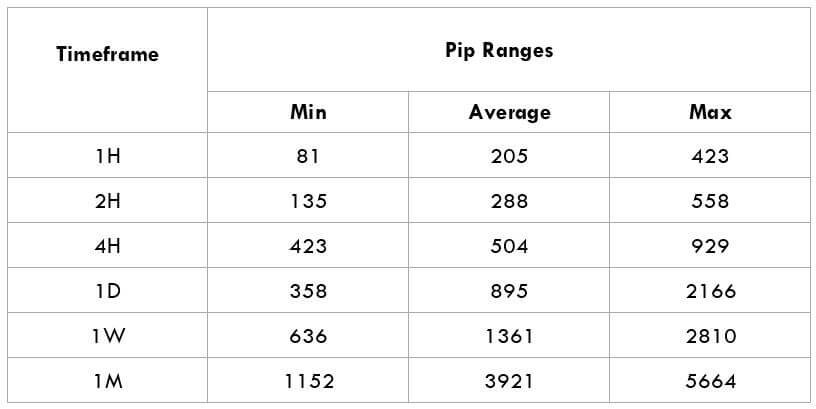
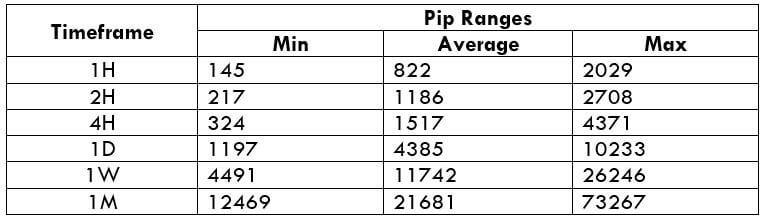
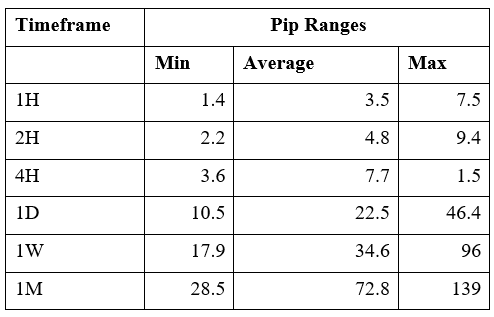
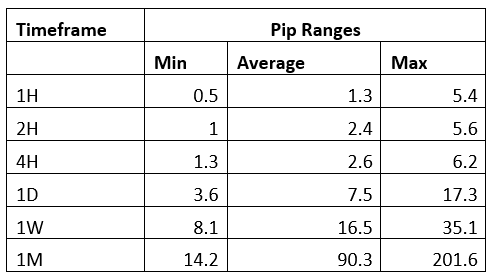
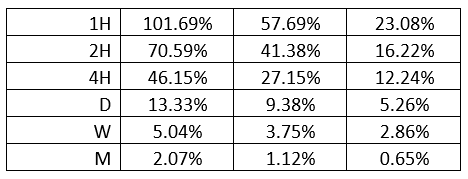
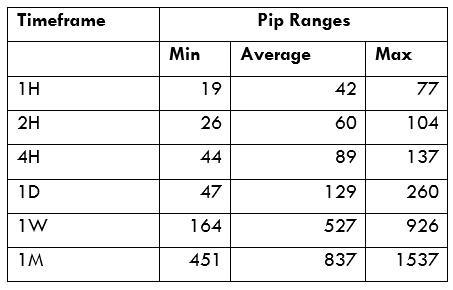
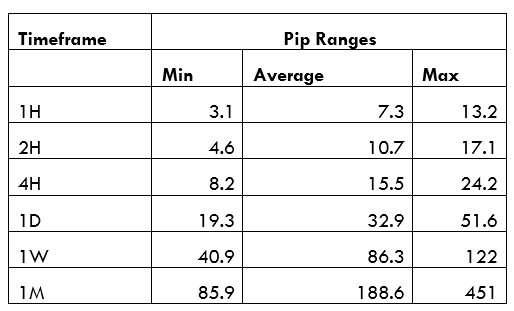
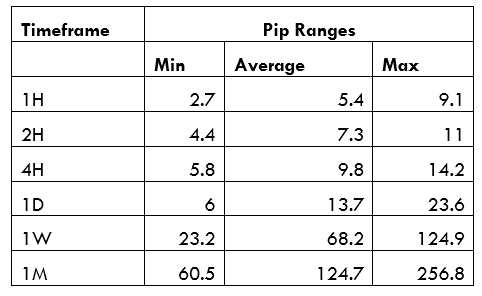
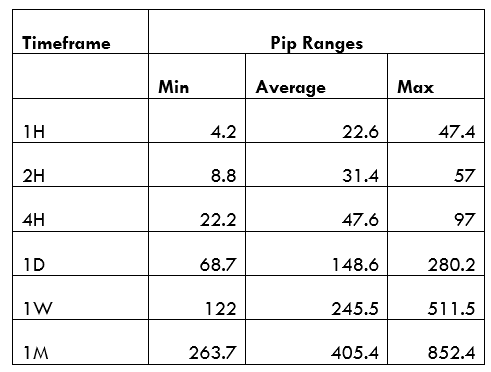
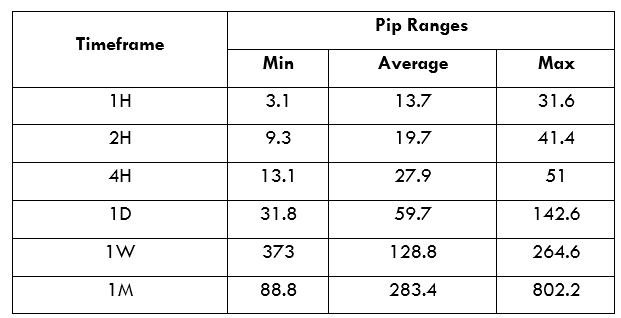
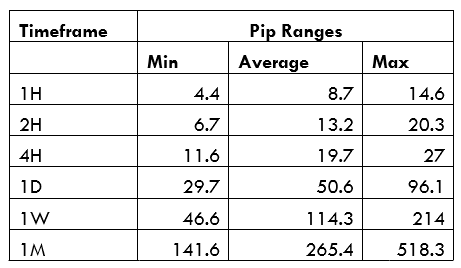
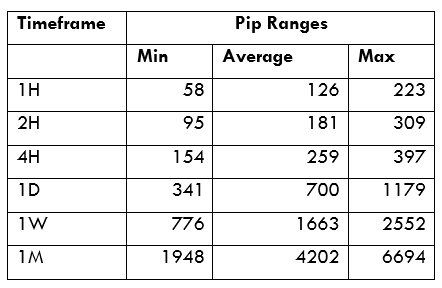
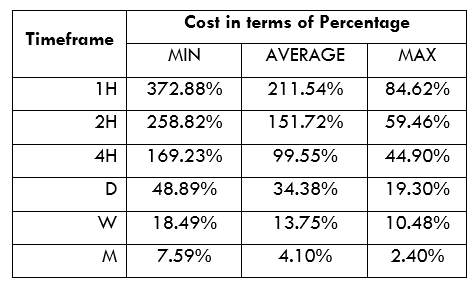
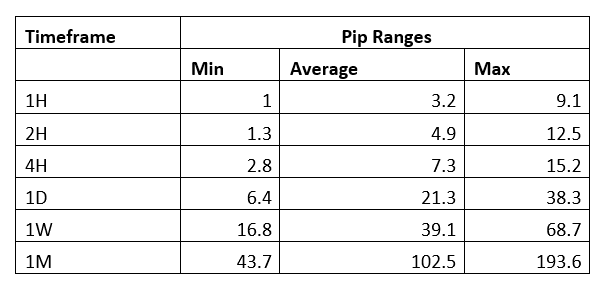
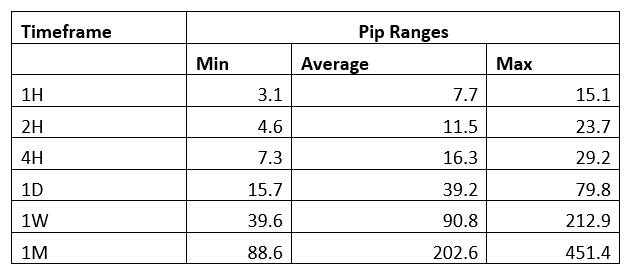
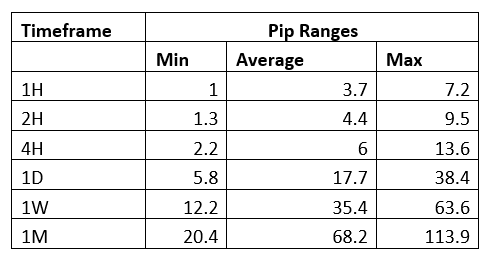
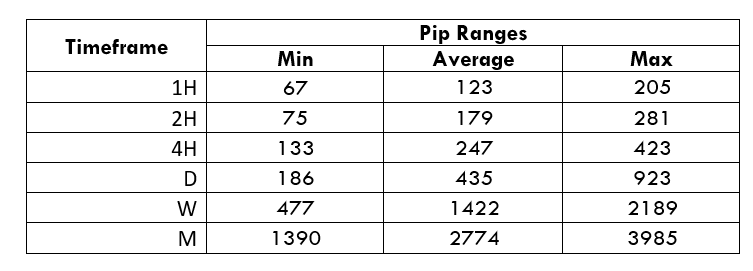
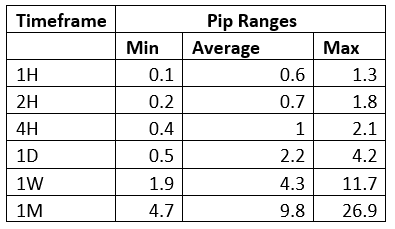
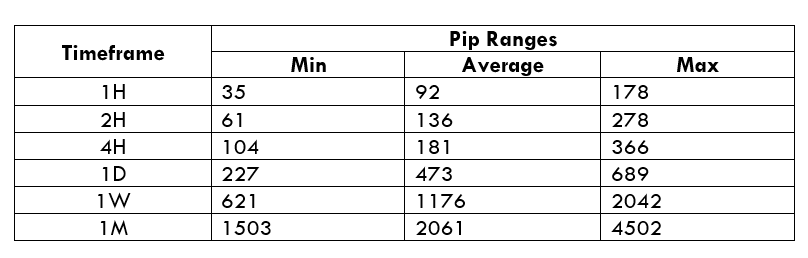
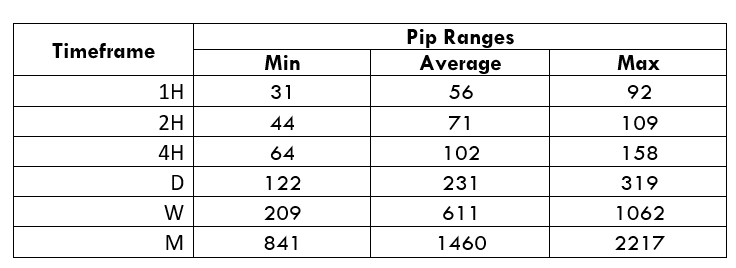
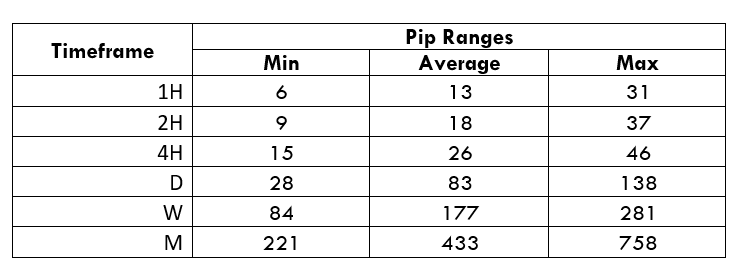
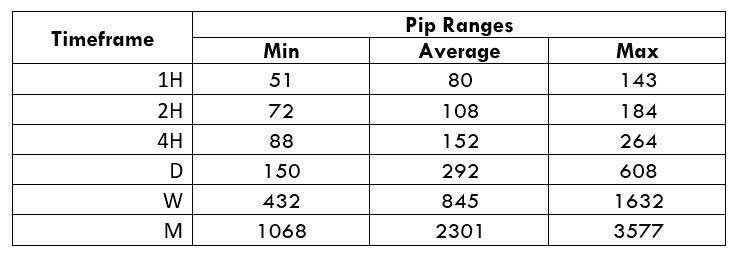
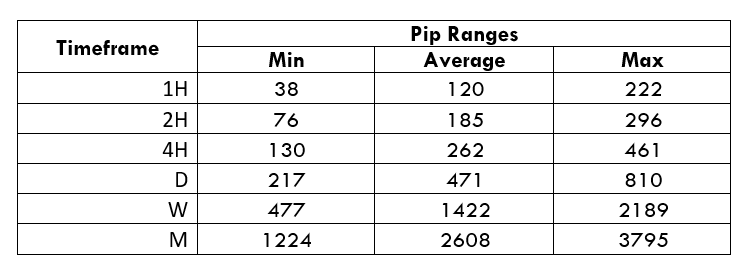
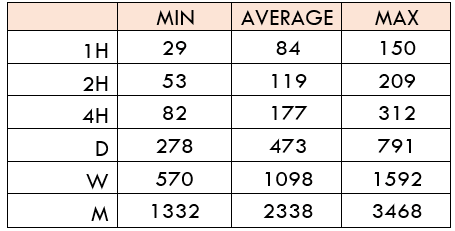
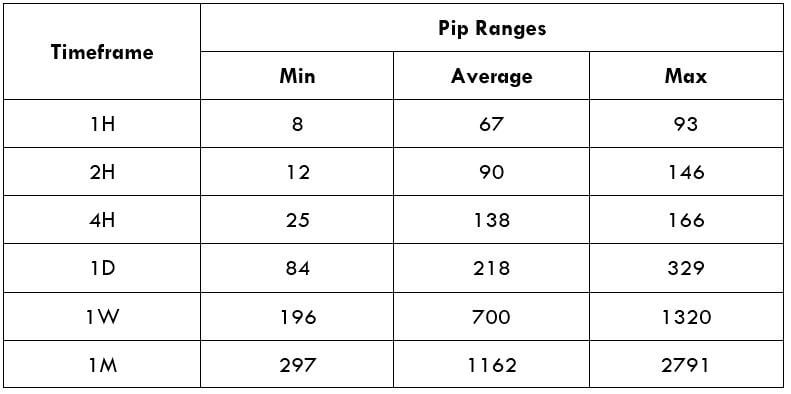
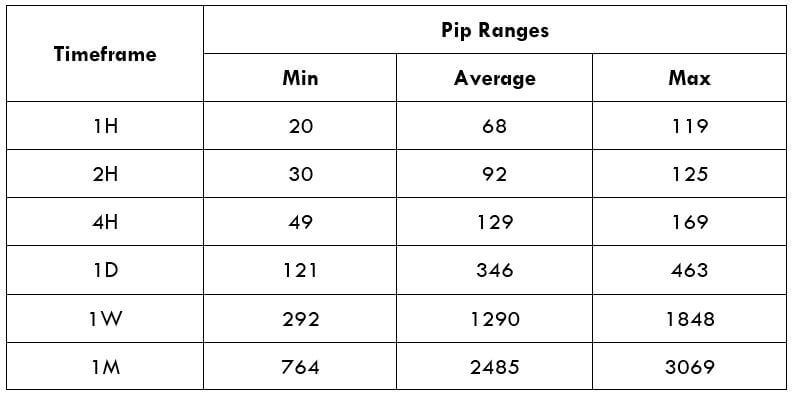
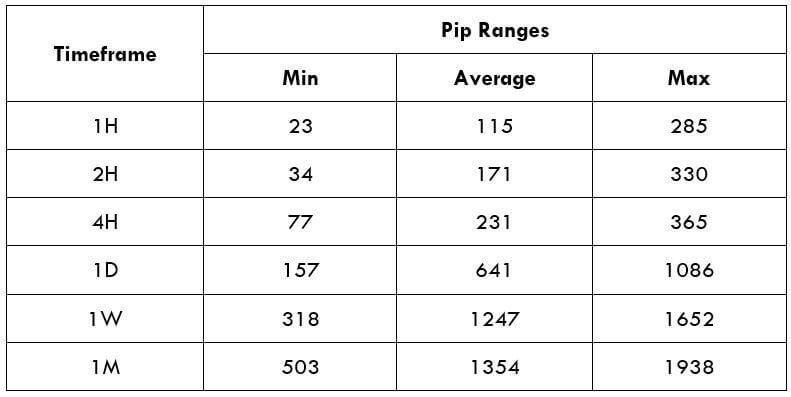
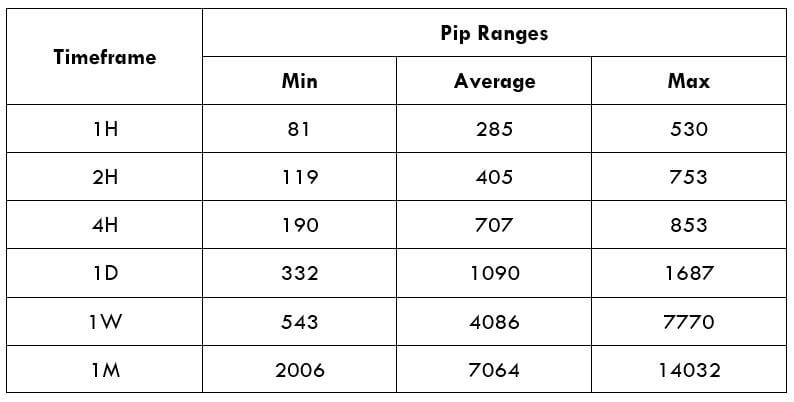
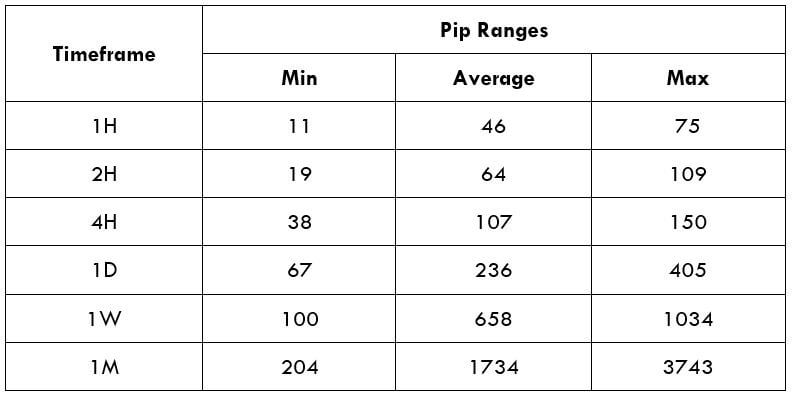
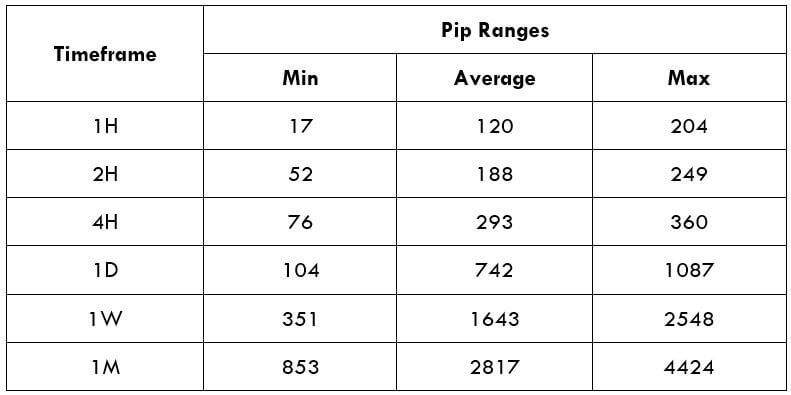
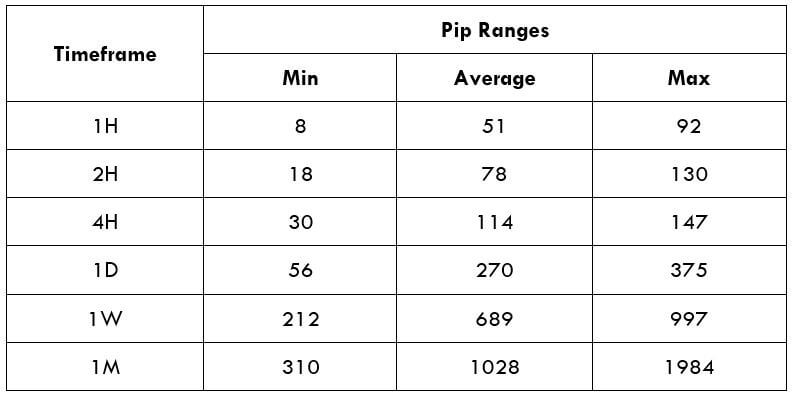
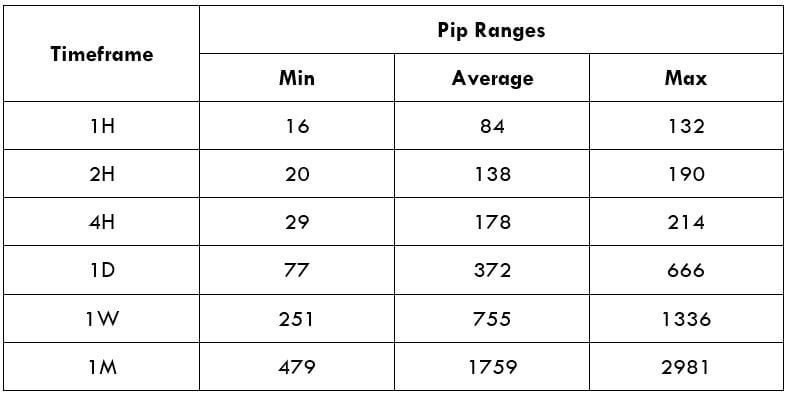
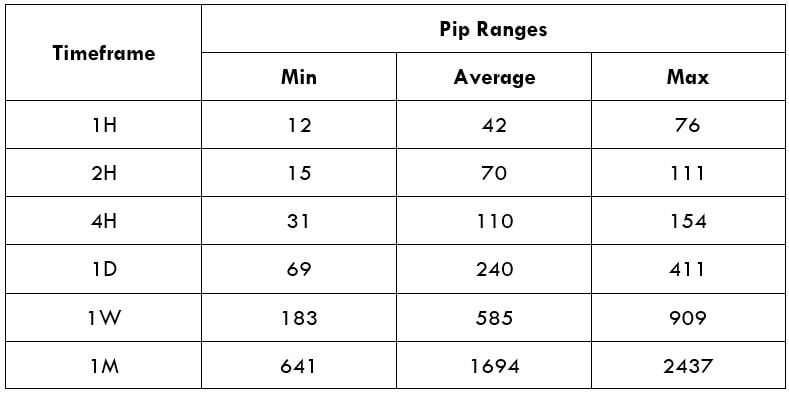
Trading Range in JPYHUF
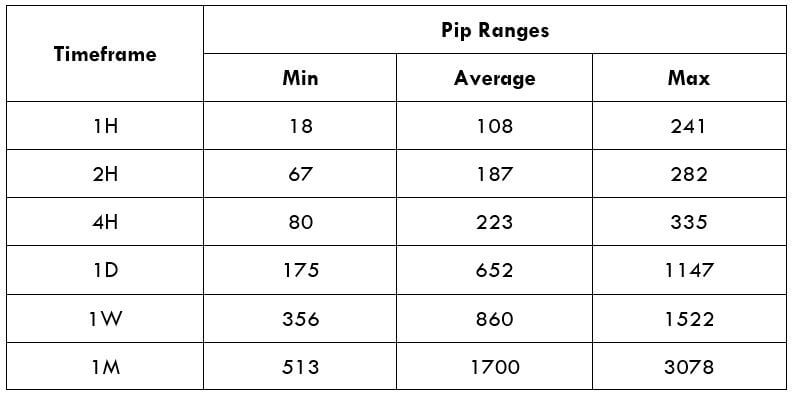
The trading range is the representation of the minimum, average, and maximum volatility of this pair on the 1H, 4H, 1D, 1W, and 1M timeframe. Using these values, we can assess our profit/loss margin of trade. Hence, this proves to be a helpful risk management tool for all types of traders.
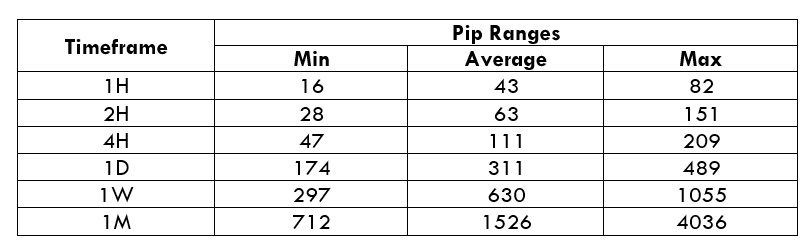
Procedure to assess Pip Ranges
- Add the ATR indicator to your chart
- Set the period to 1
- Add a 200-period SMA to this indicator
- Shrink the chart so you can assess a large time period
- Select your desired timeframe
- Measure the floor level and set this value as the min
- Measure the level of the 200-period SMA and set this as the average
- Measure the peak levels and set this as Max.
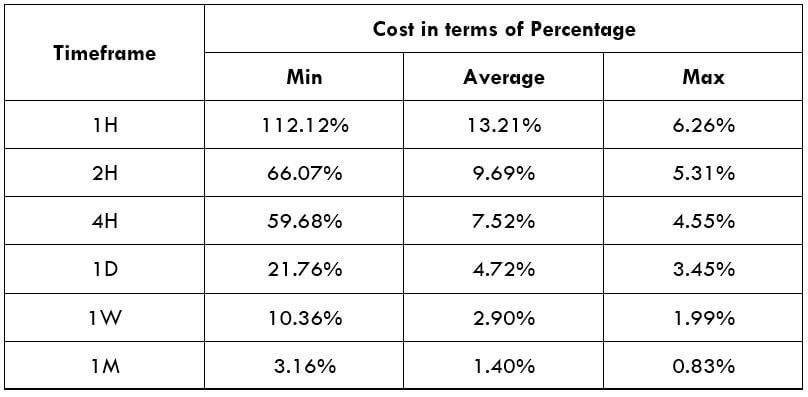
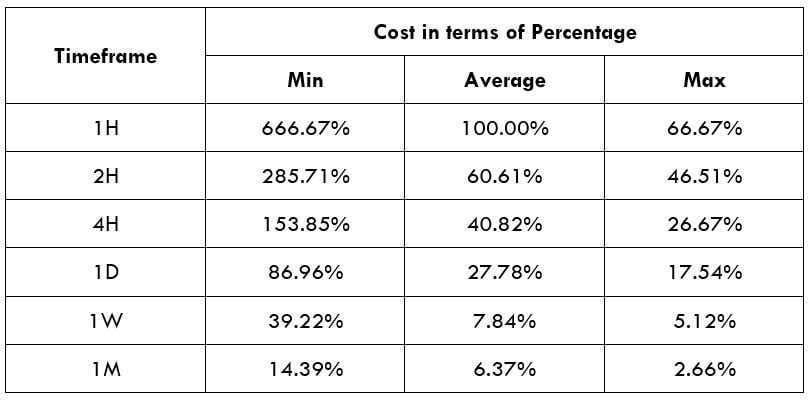
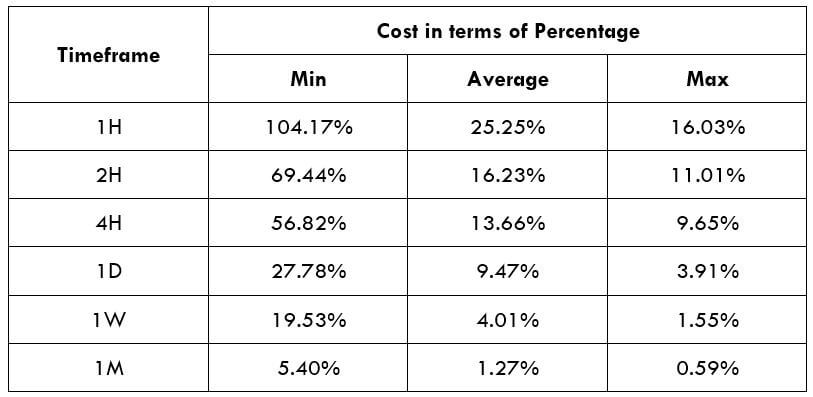
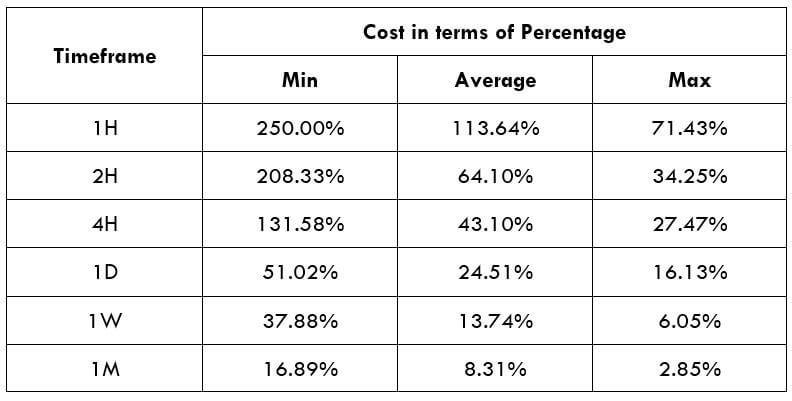
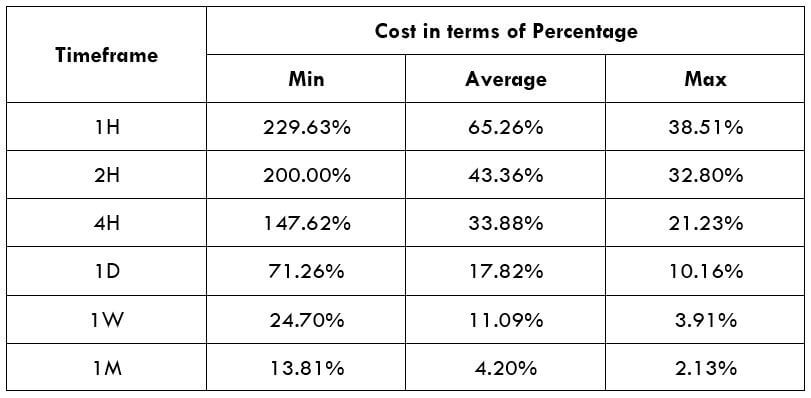
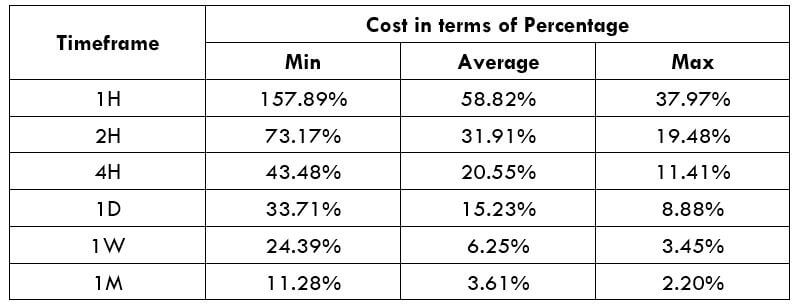
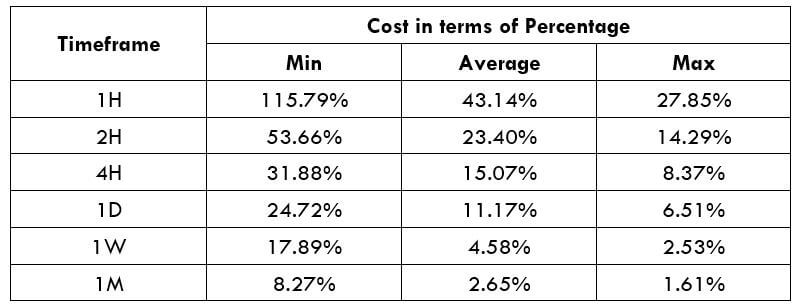
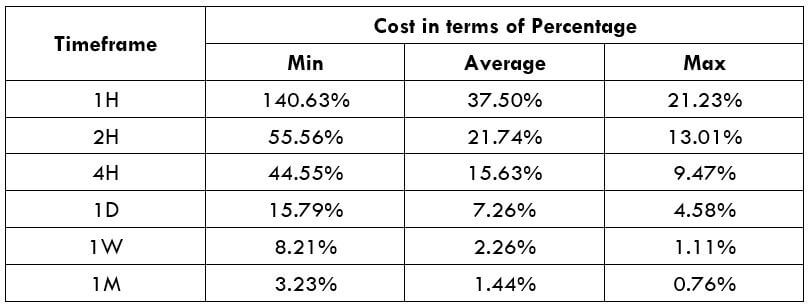
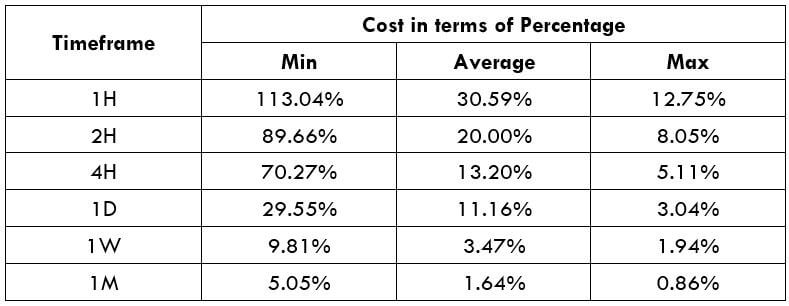
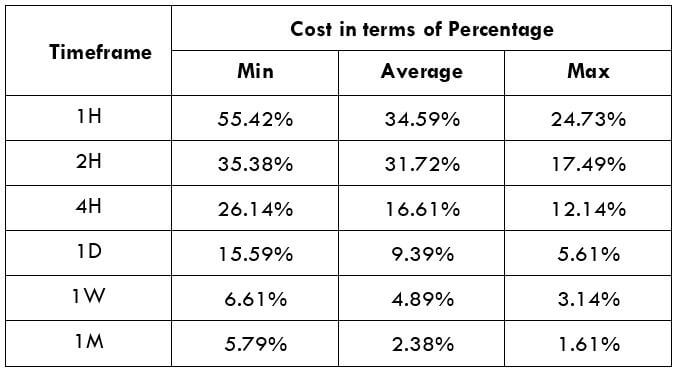
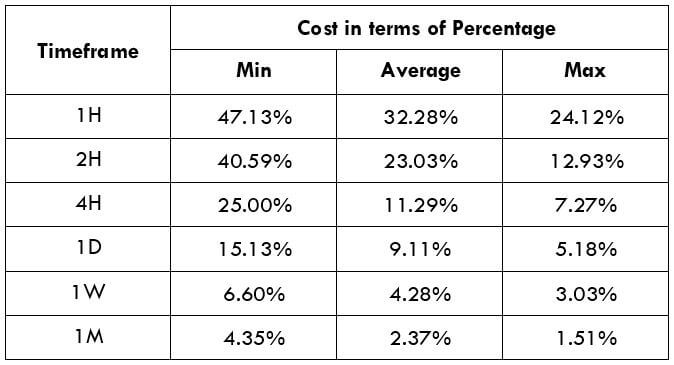
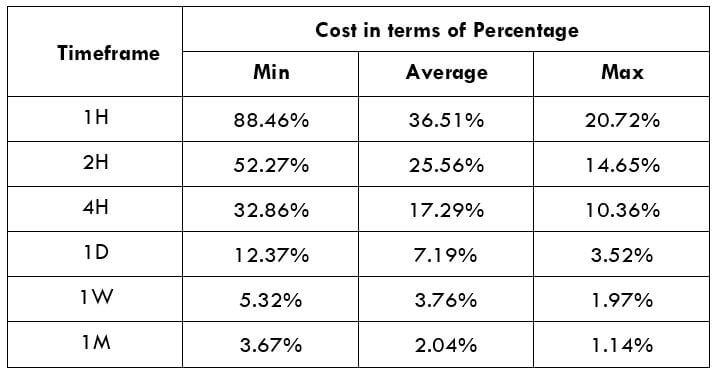
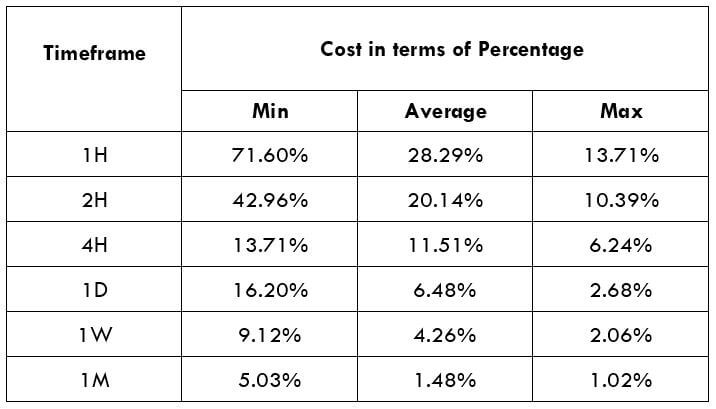
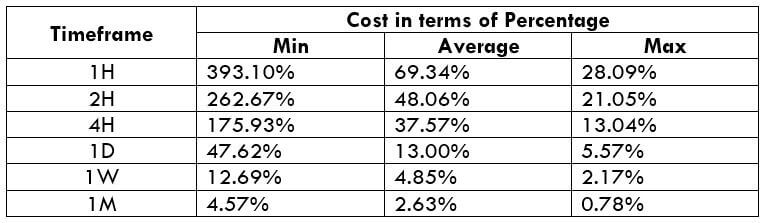
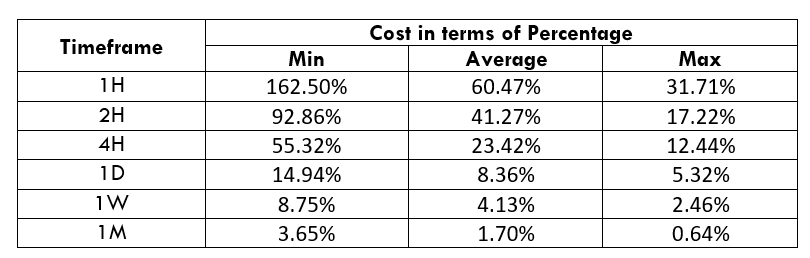
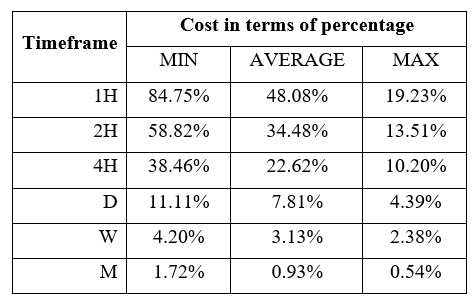
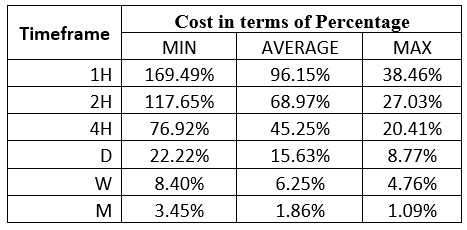
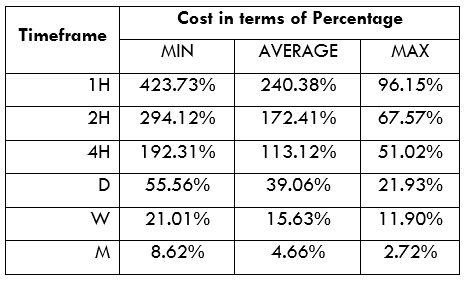
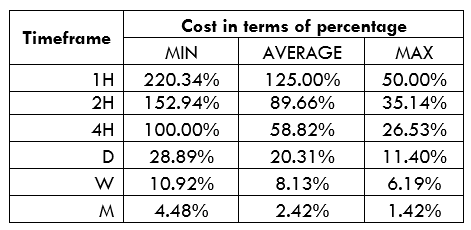
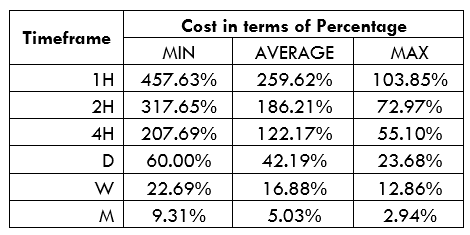
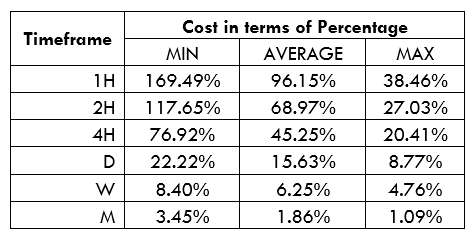
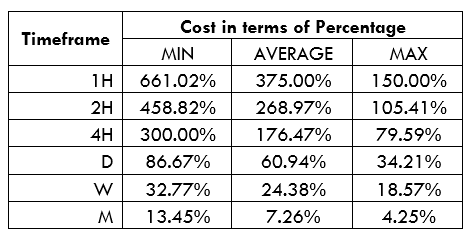
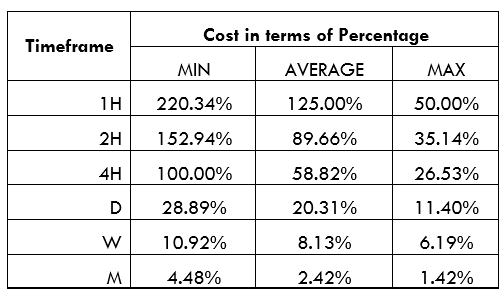
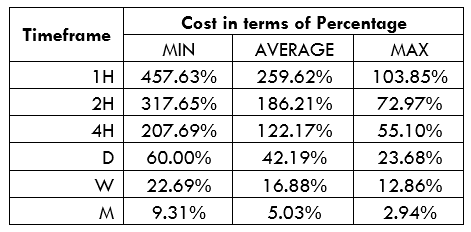
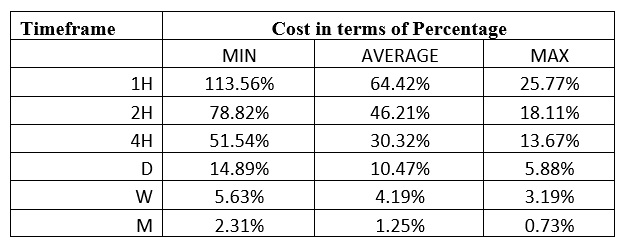
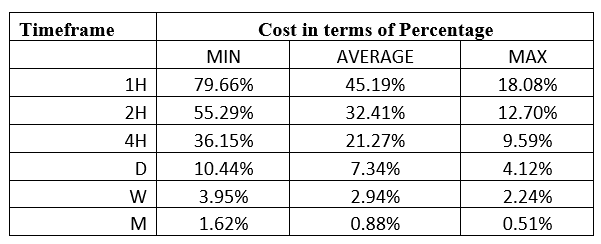
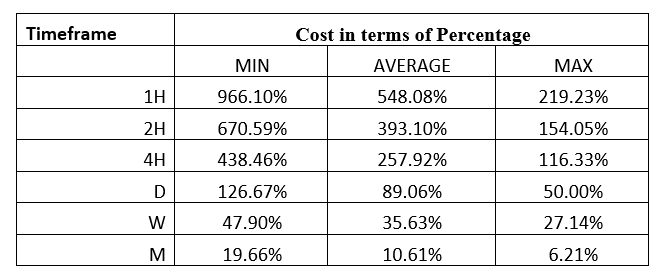
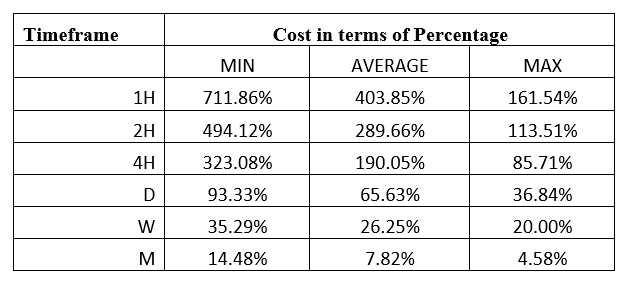
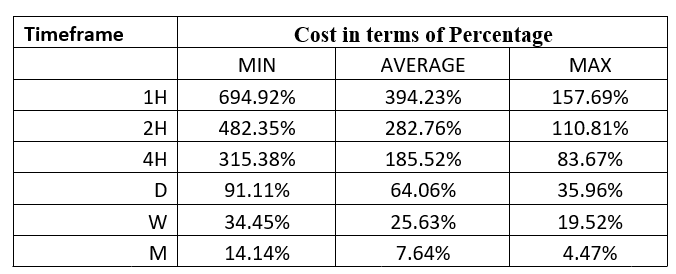
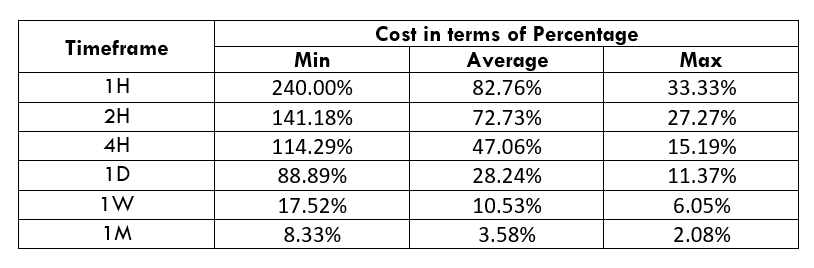
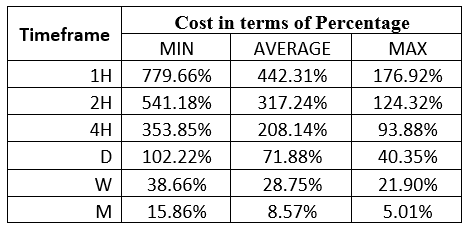
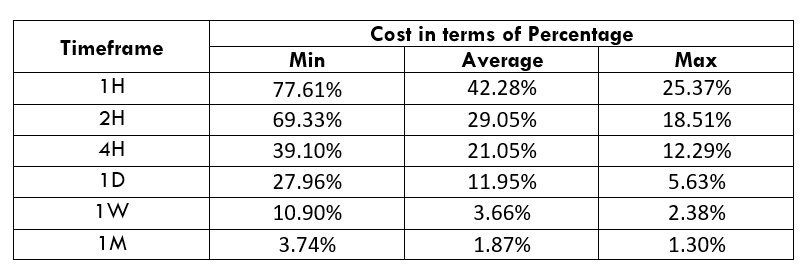
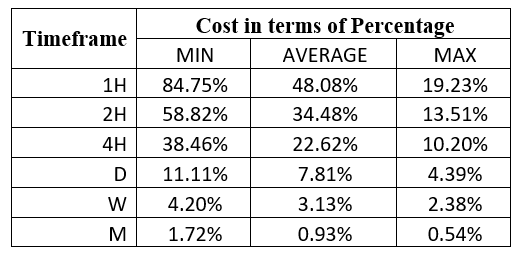
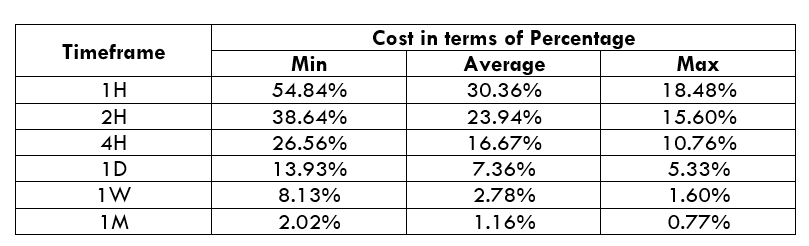
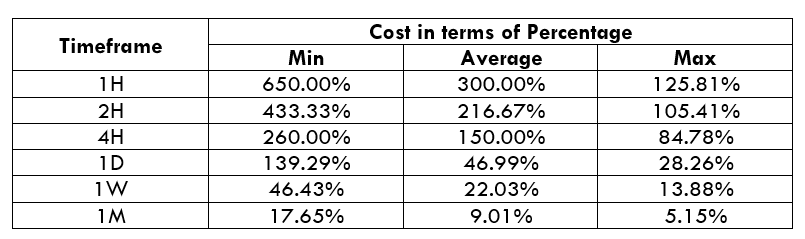
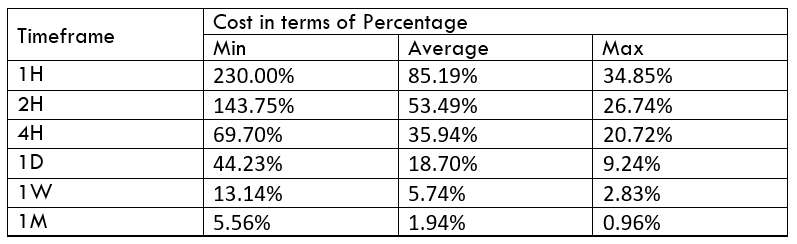
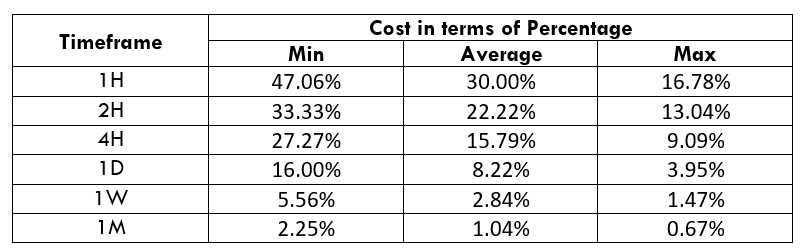
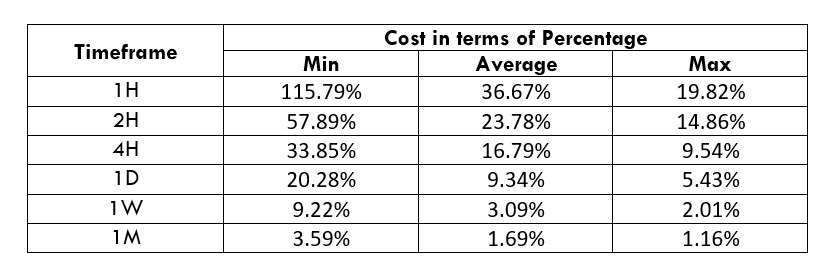
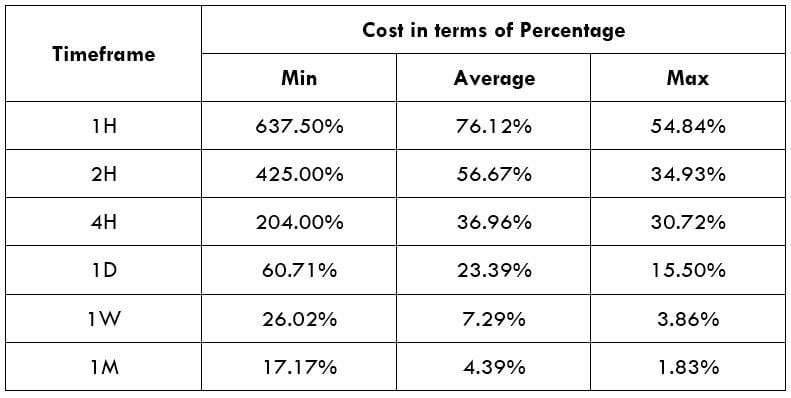
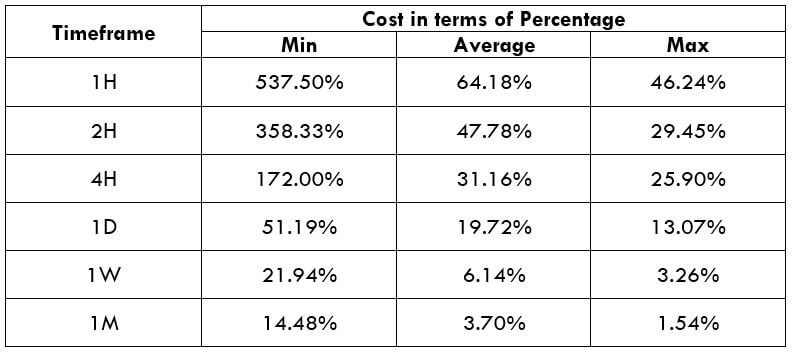
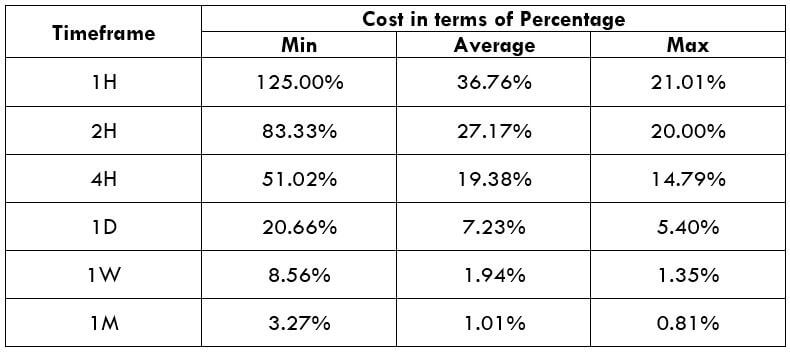
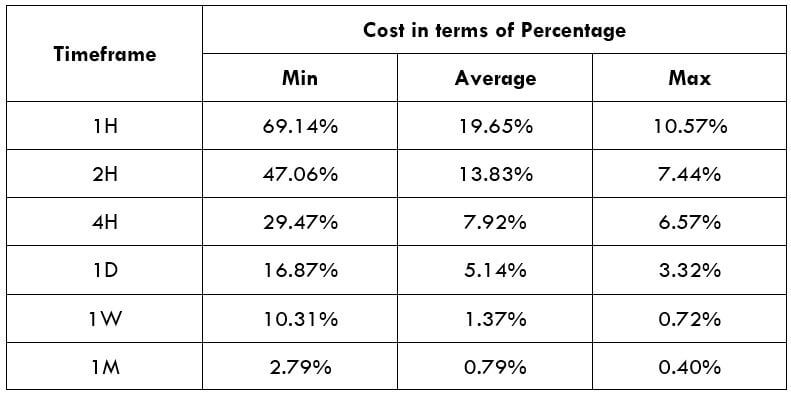
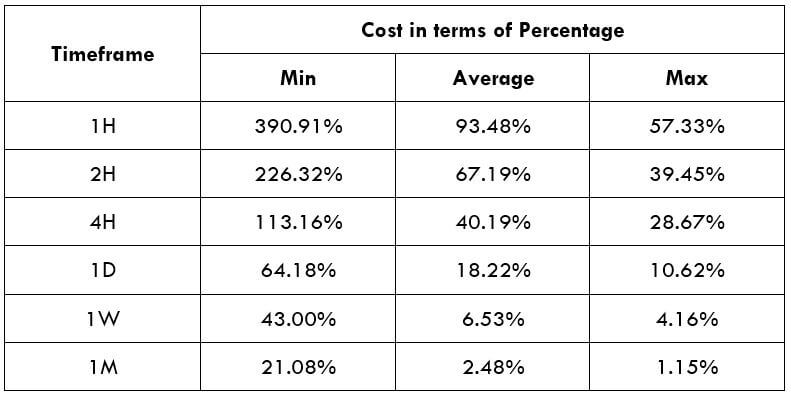
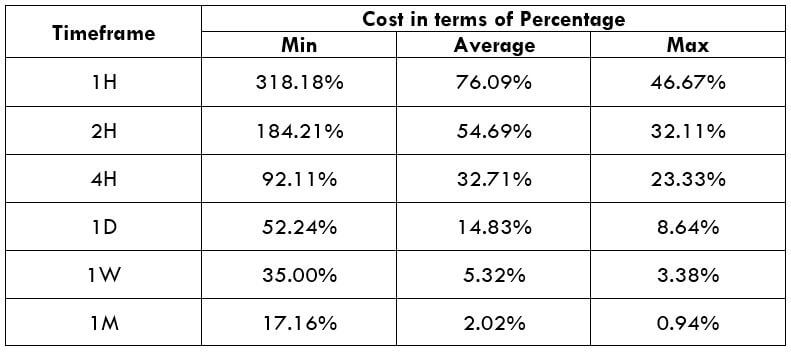
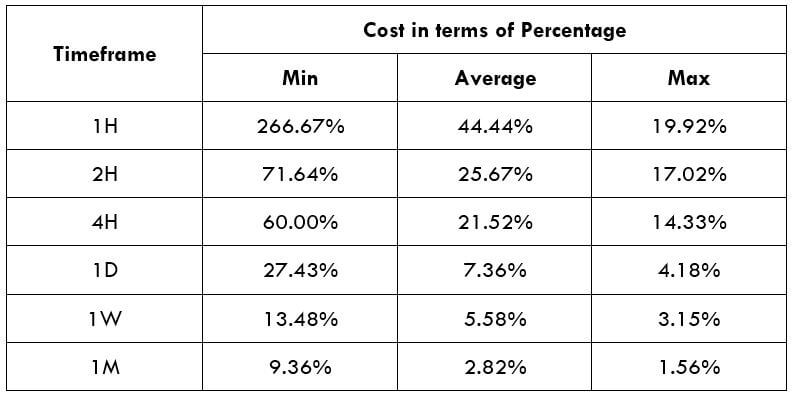
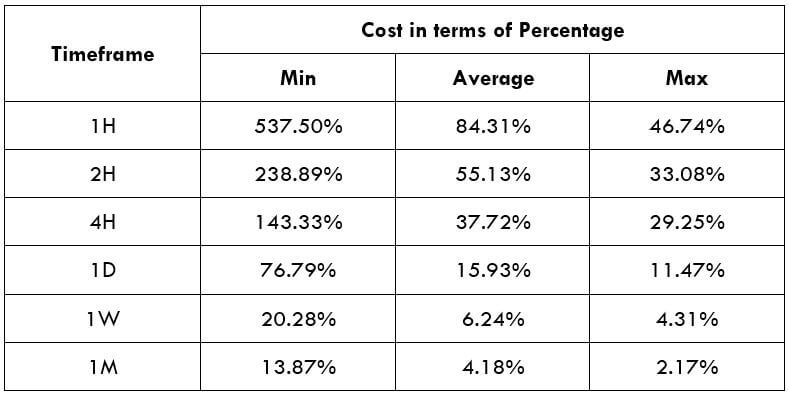
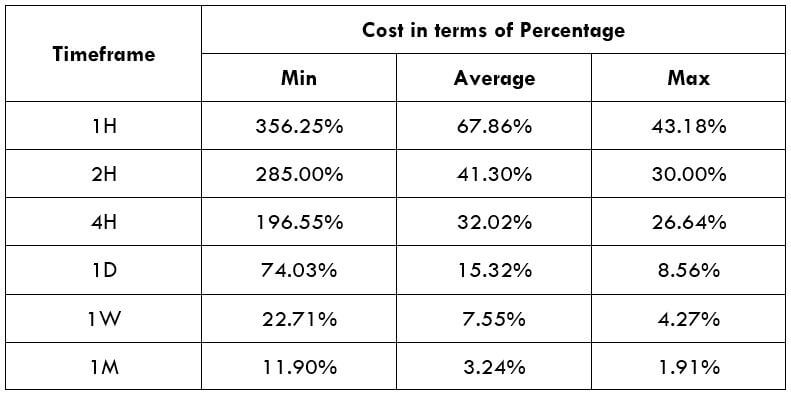
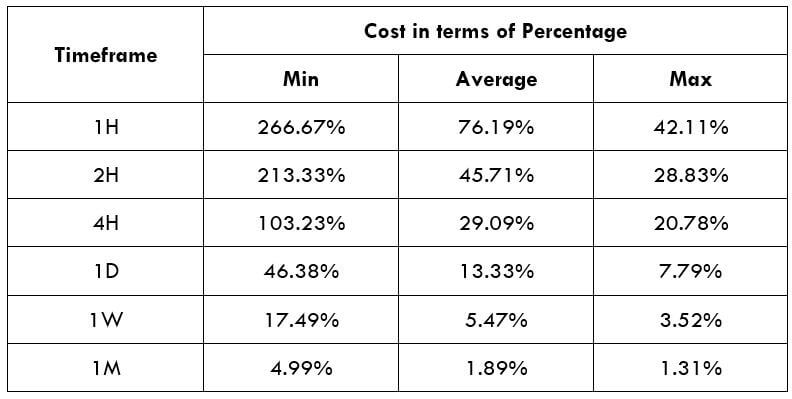
JPYHUF Cost as a Percent of the Trading Range
With the volatility values from the above table, we can determine the chance of cost with the change of volatility. We have got the ratio between total cost and the volatility values and converted them into percentages.
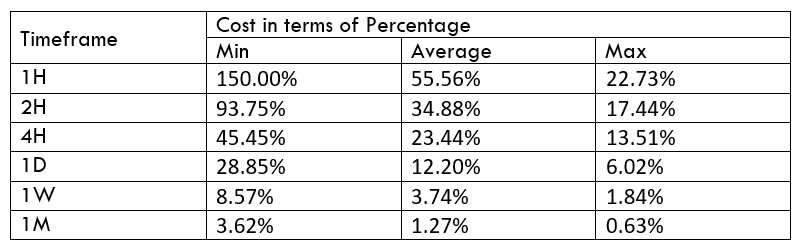
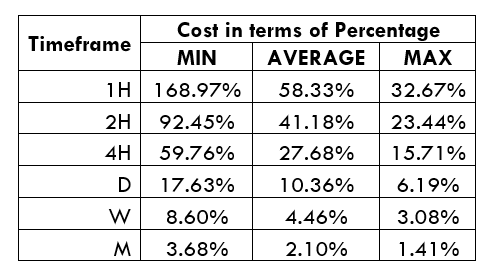
ECN Model Account
Spread = 13 | Slippage = 5 | Trading fee = 8
Total cost = Spread + Slippage + Trading Fee
= 13 + 5 + 8
Total cost = 26
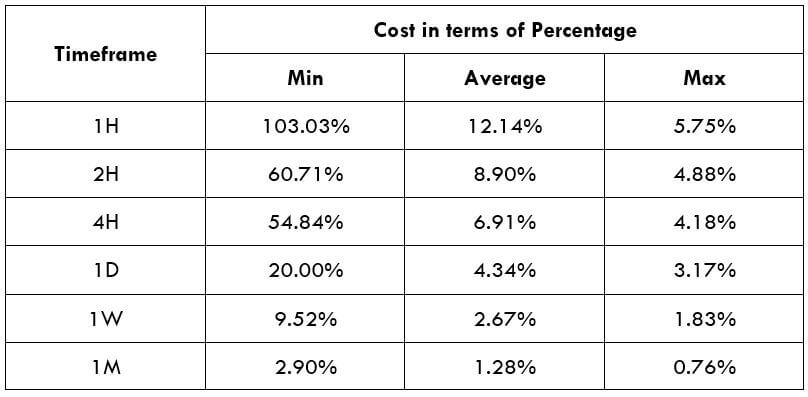
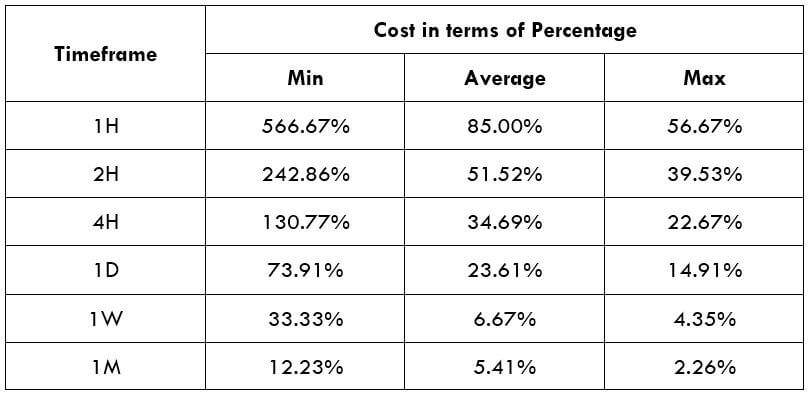
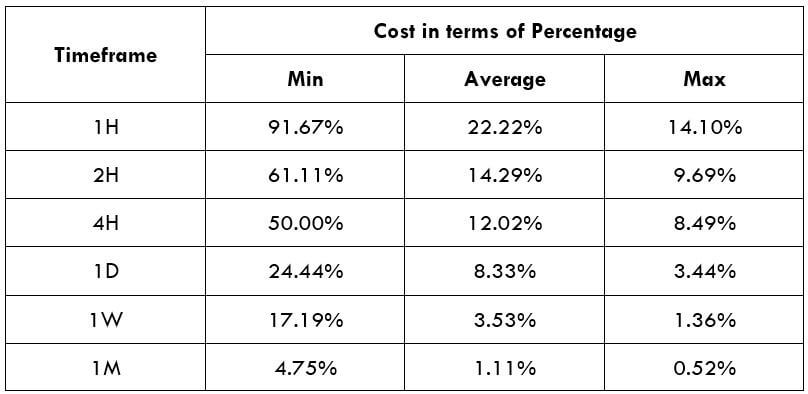
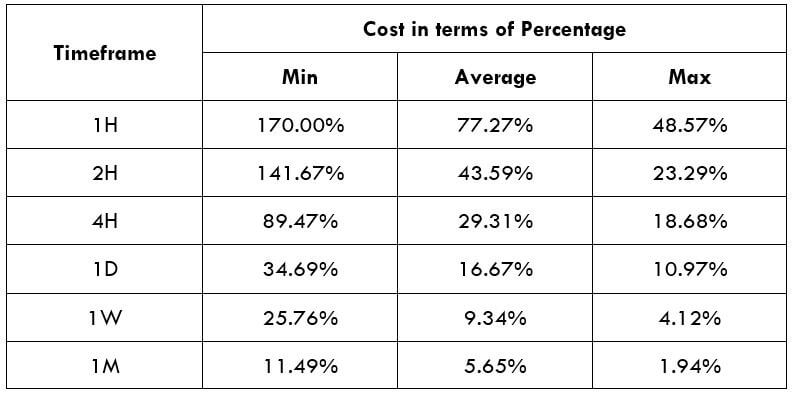
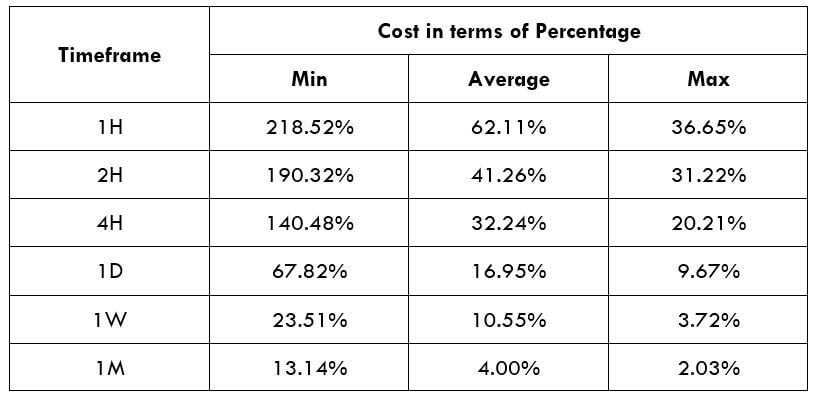
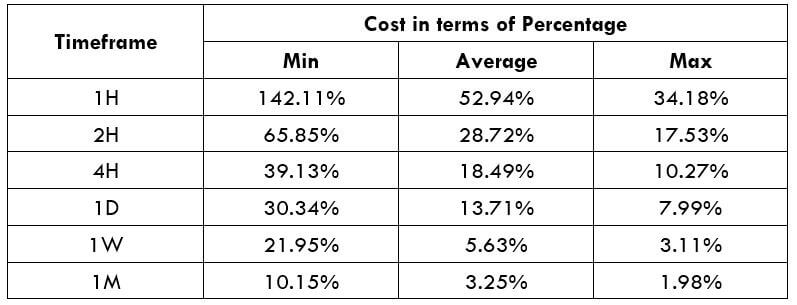
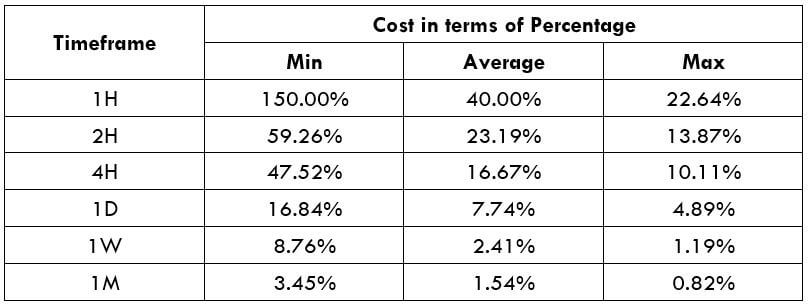
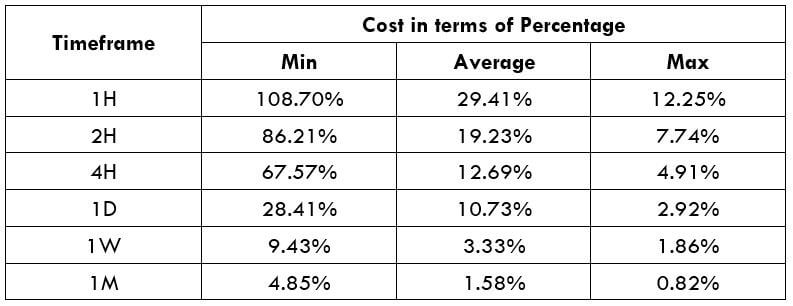
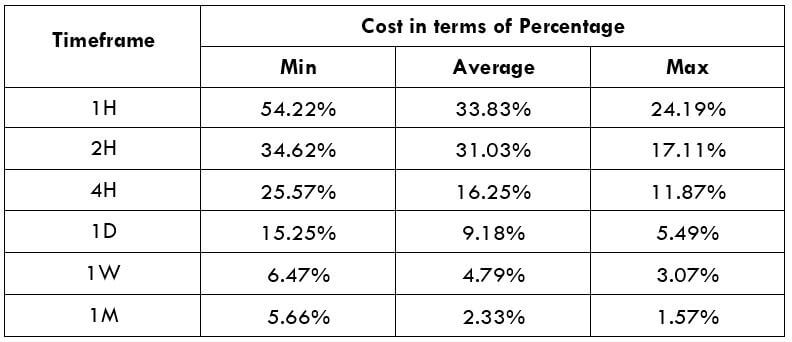
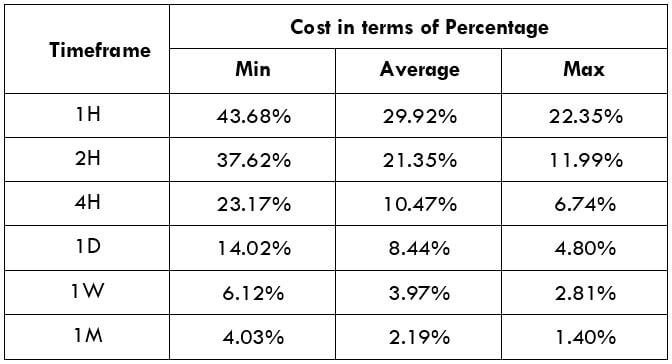
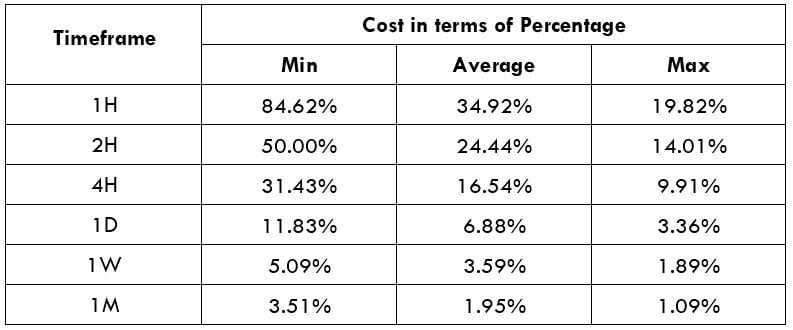
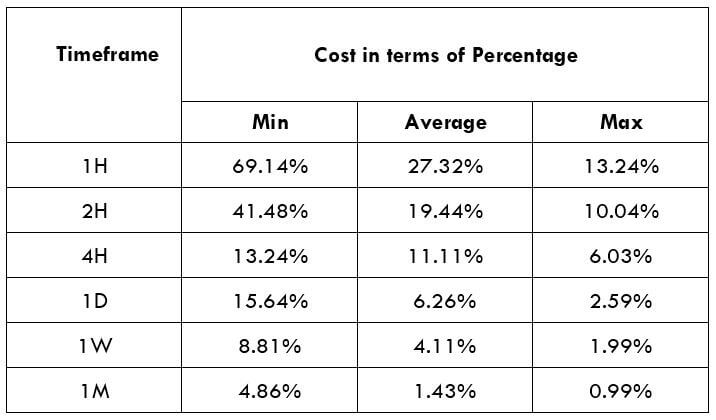
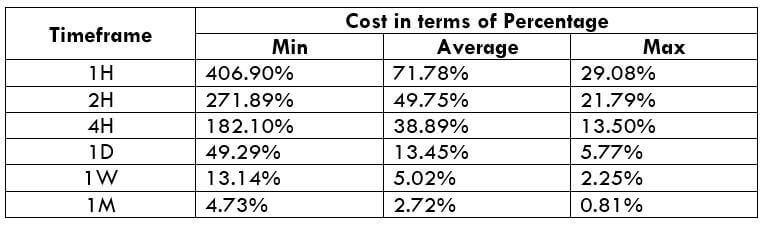
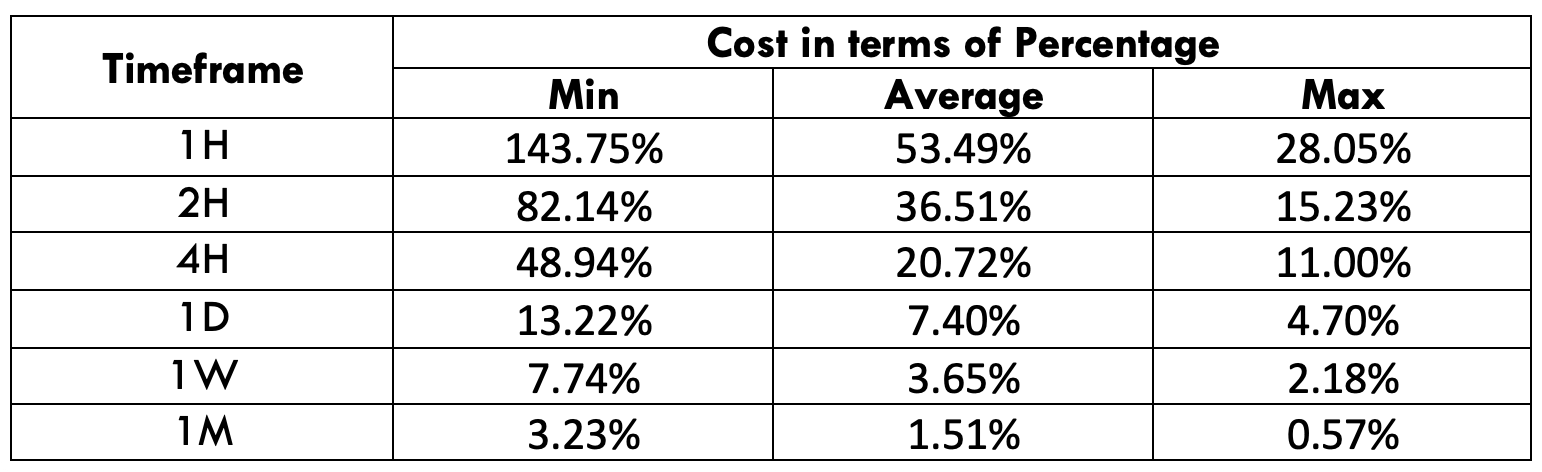
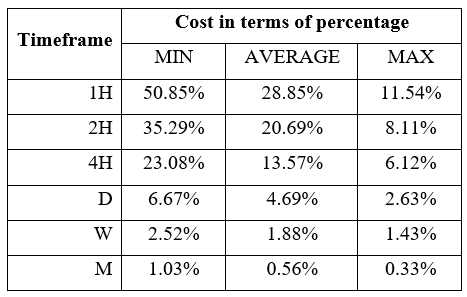
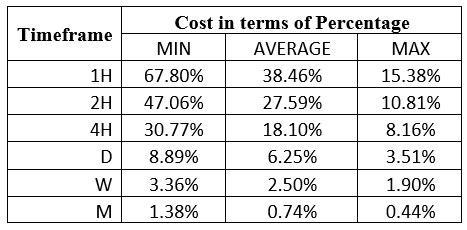
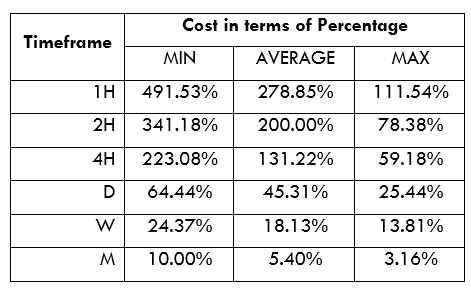
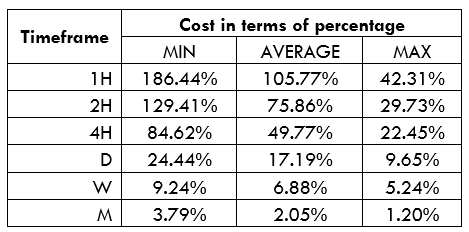
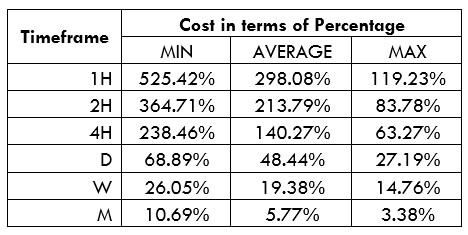
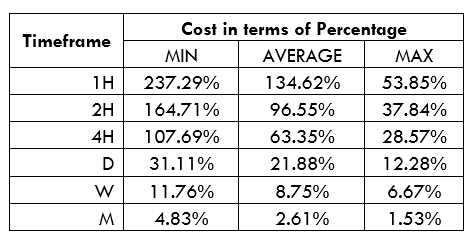
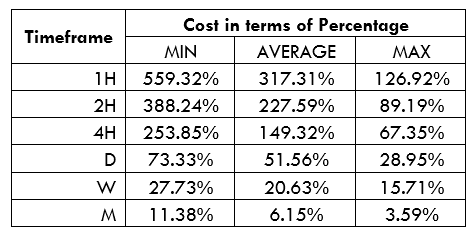
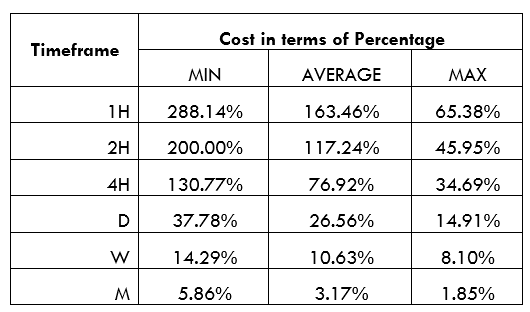
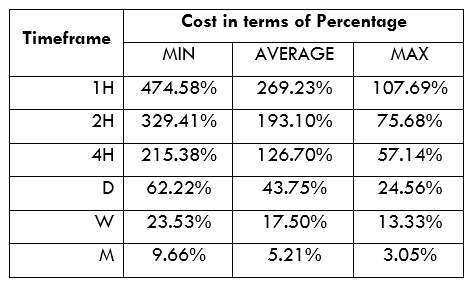
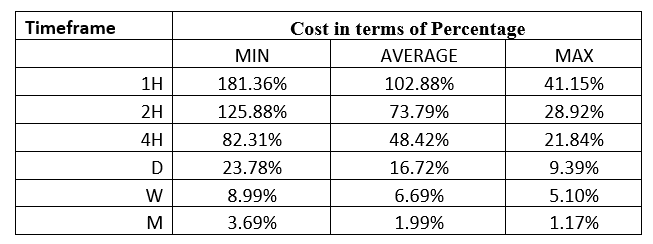
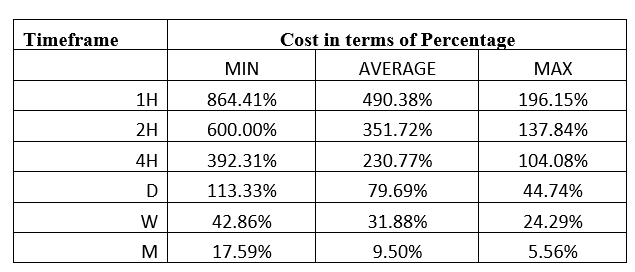
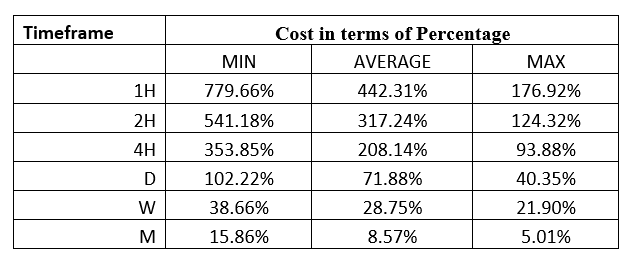
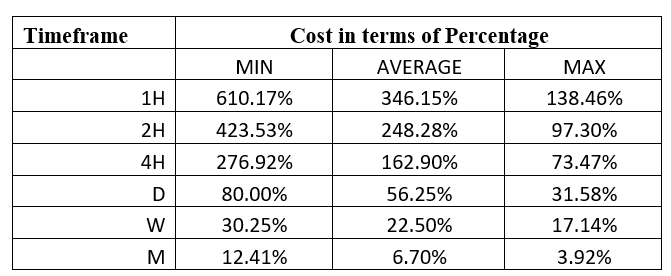
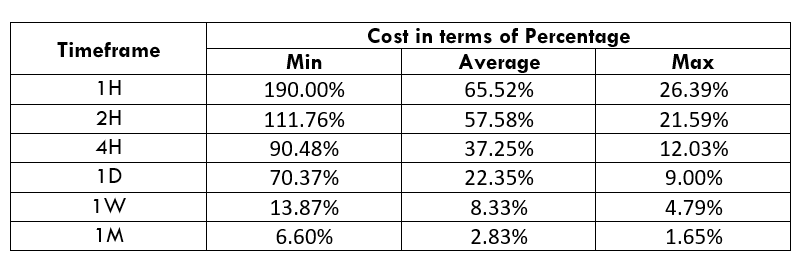
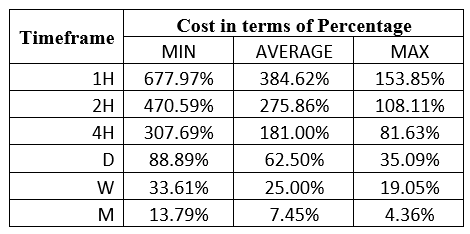
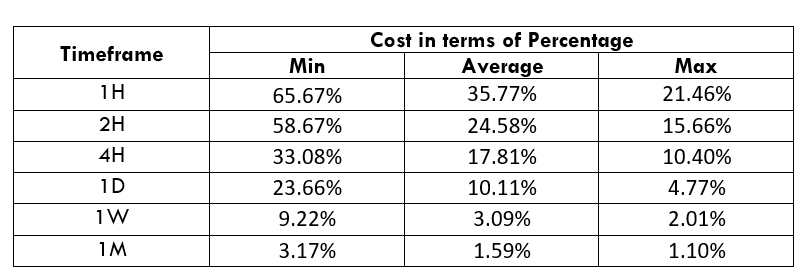
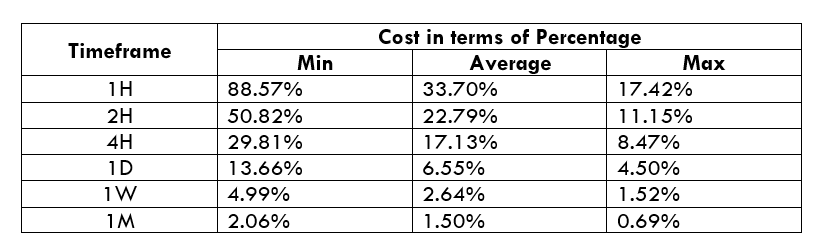
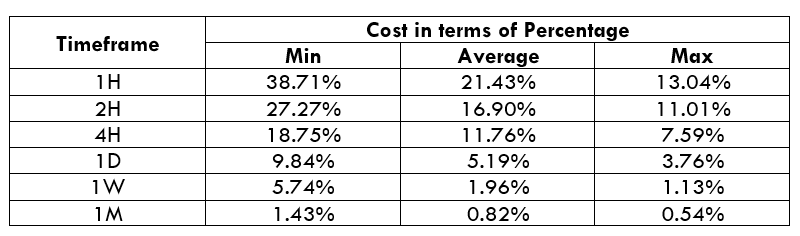
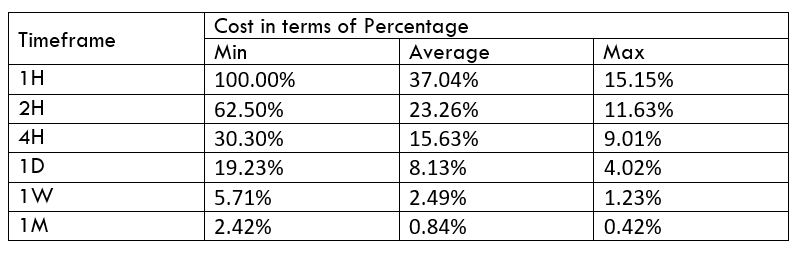
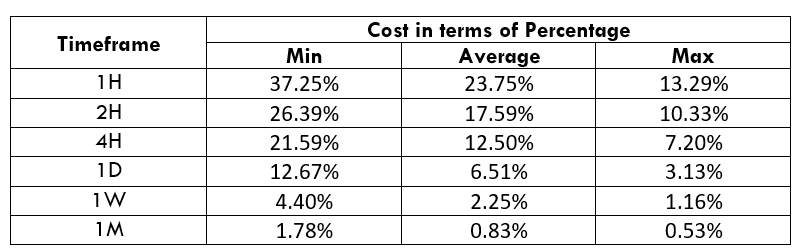
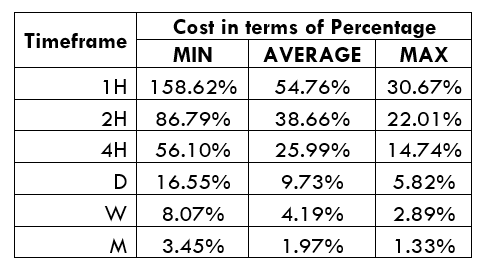
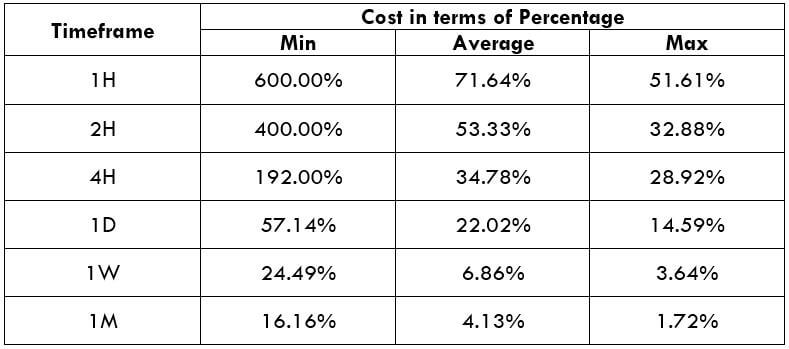
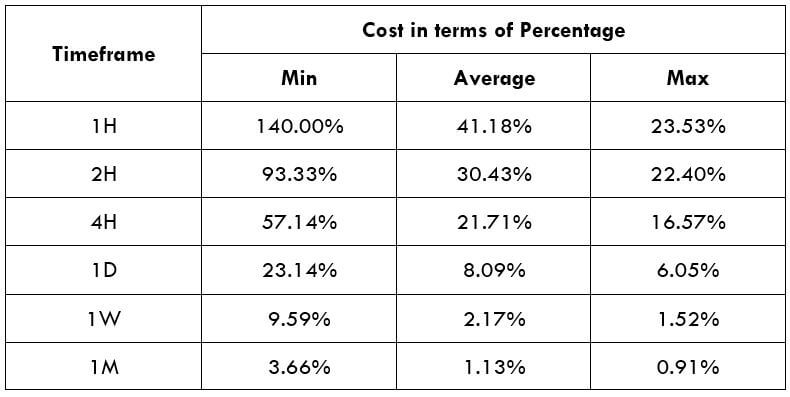
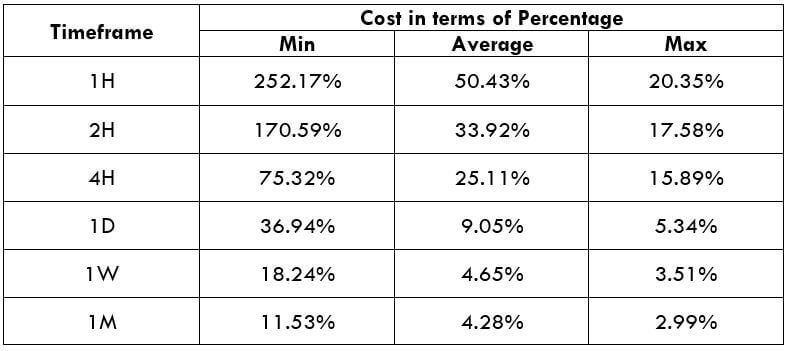
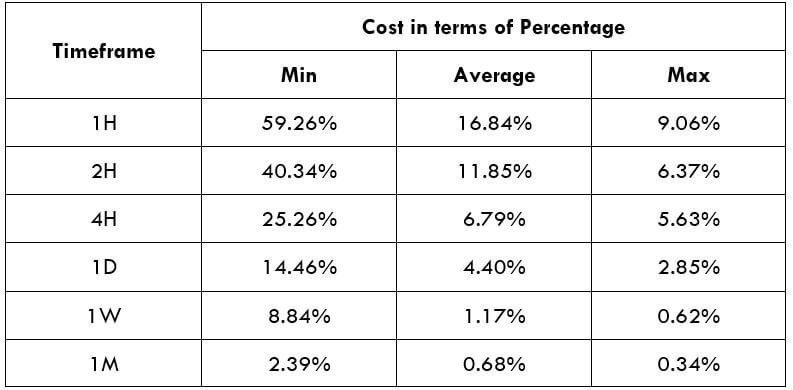
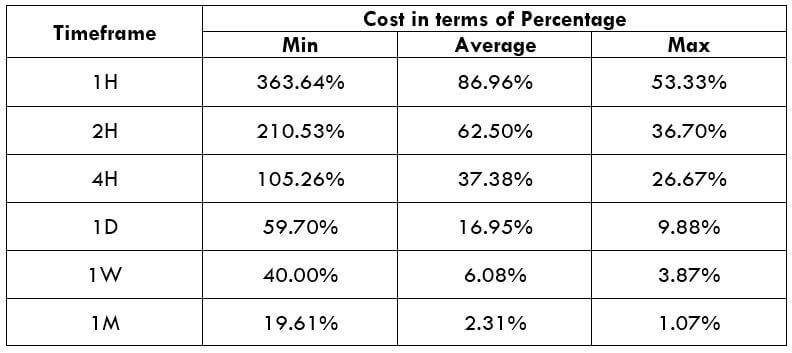
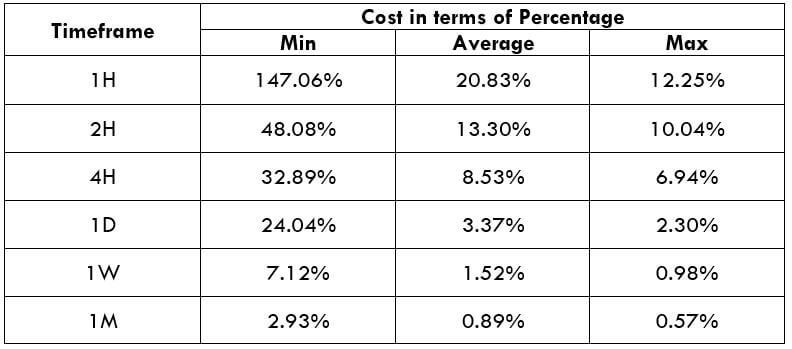
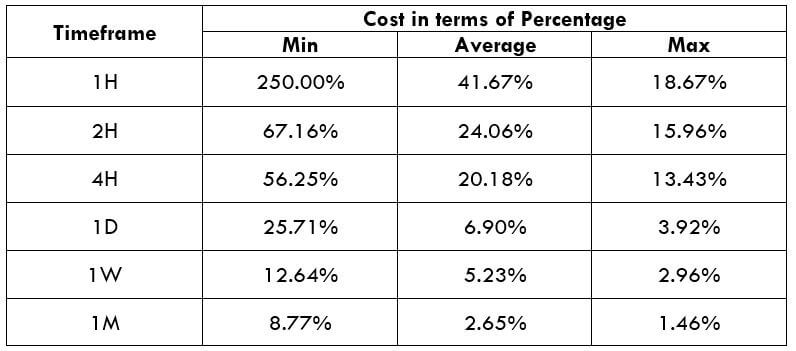
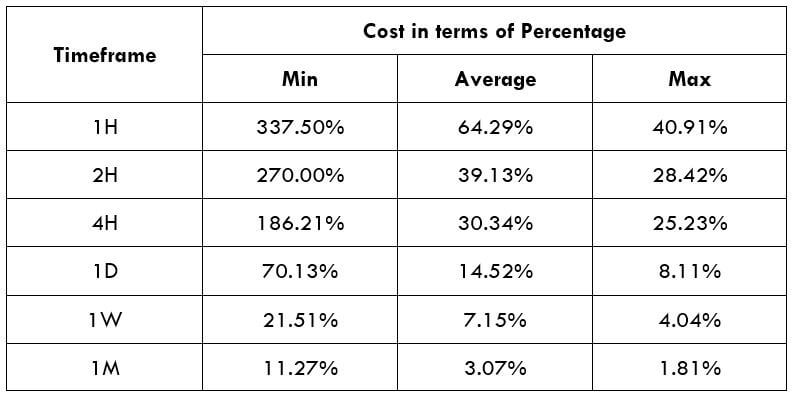
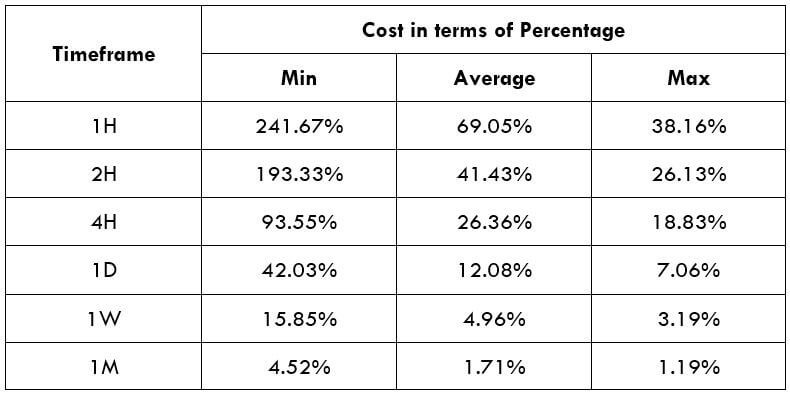
STP Model Account
Spread = 18 | Slippage = 5 | Trading fee = 0
Total cost = Spread + Slippage + Trading Fee
= 18 + 5 + 0
Total cost = 23
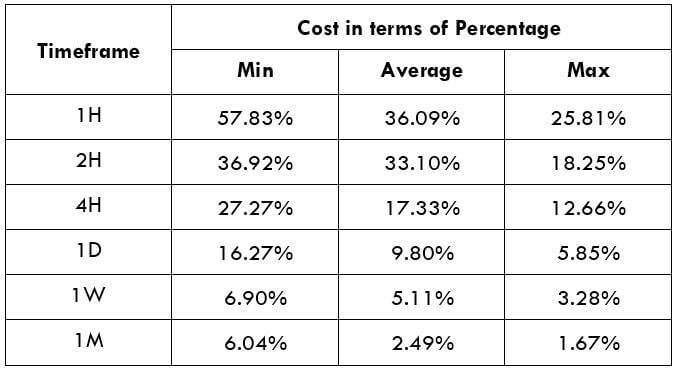
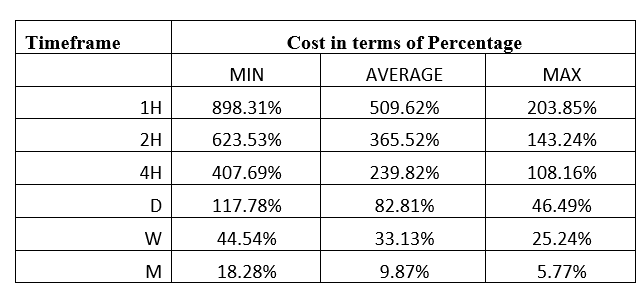
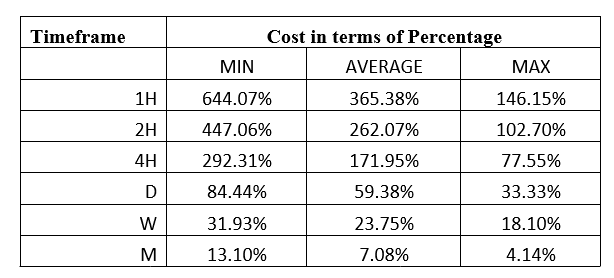
The Ideal way to trade the JPYHUF
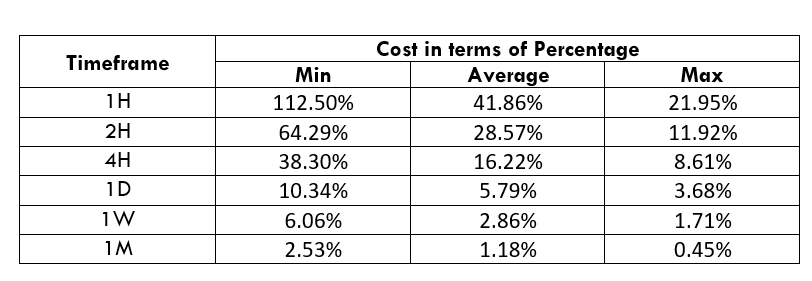
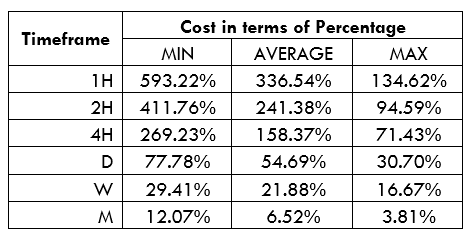
As per the above data, we can say that JPYHUF is not an extremely volatile pair. Therefore, traders from every level can trade with it and make money. The average cost per trade in the H1 timeframe is at 41.86%, which decreases to almost 1% in a monthly timeframe. As a trader, it is often hard to trade in a timeframe like weekly or monthly, as it is very time-consuming. Therefore, sticking to the hourly to daily timeframe is recommended for traders to minimize the trading cost.
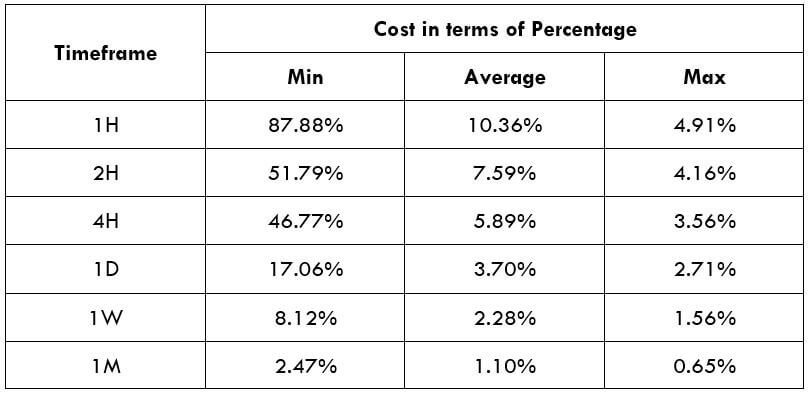
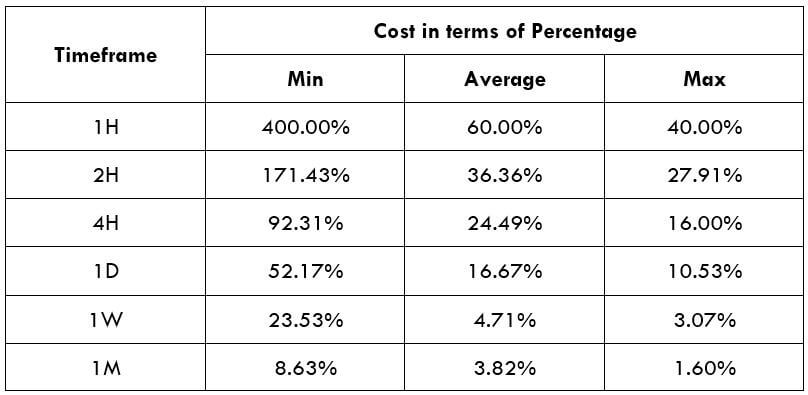
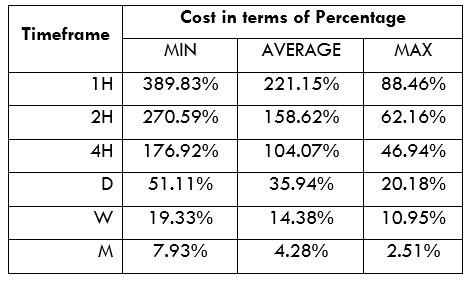
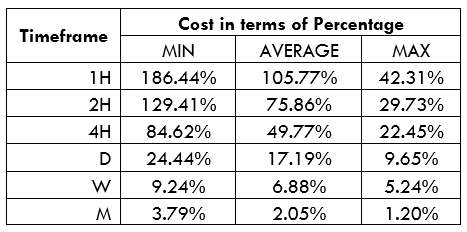
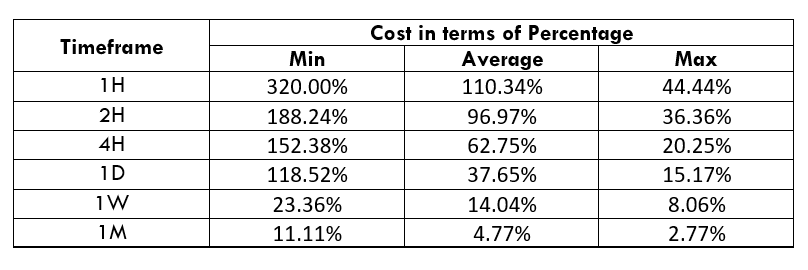
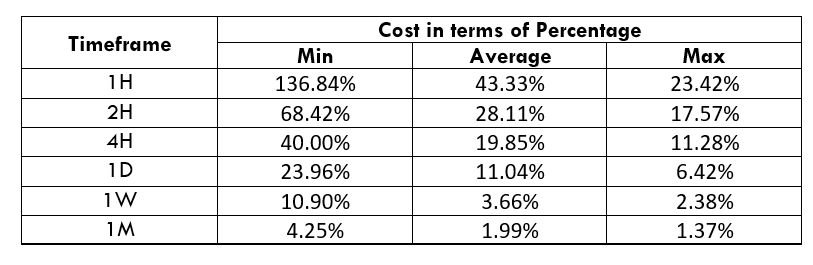
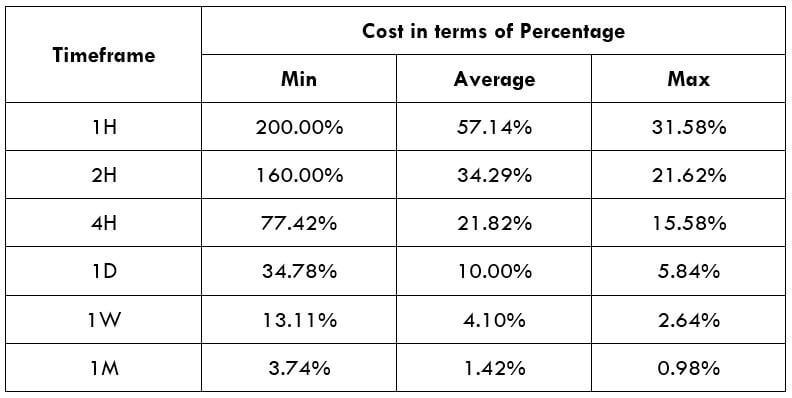
Another way to reduce the cost is to place orders as ‘limit’ and ‘stop’ instead of ‘market’ orders. In limit orders, slippage will not be in the calculation of the total costs. Therefore, in the below example, the total cost will be reduced by five pips.
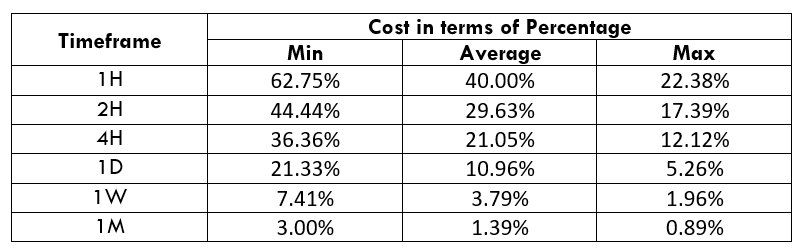
Limit Model Account (STP Model Account)
Spread = 18 | Slippage = 0 | Trading fee = 0
Total cost = Spread + Slippage + Trading Fee
= 18 + 0 + 0
Total cost = 18


 Spread
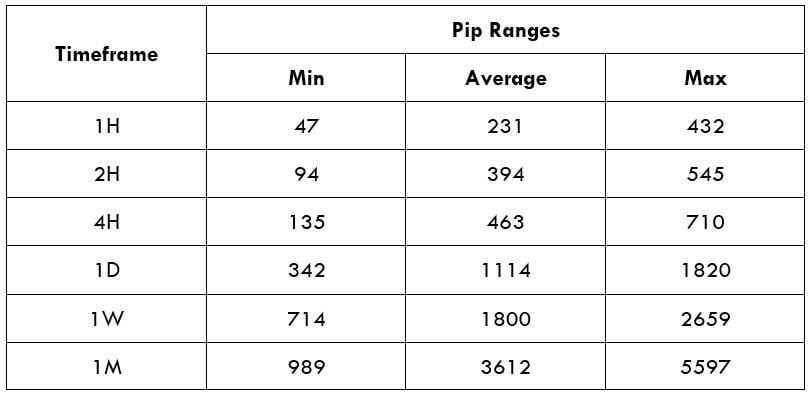 Procedure to assess Pip Ranges
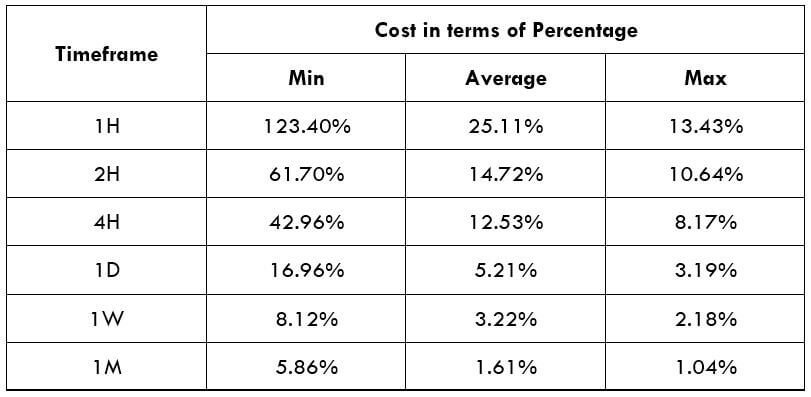 STP Model Account
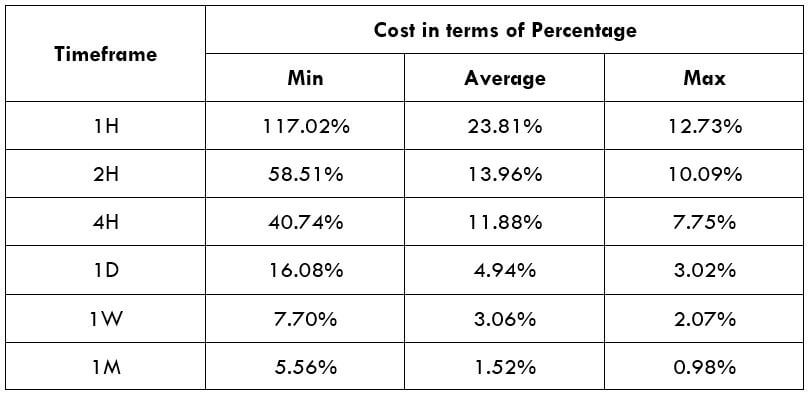


 Spread