Introduction
BCO is an acronym for Brent Crude Oil, which is one of the two types of crude oil and is a benchmark for determining the price of oil, along with West Texas Intermediate (WTI) crude oil. BCO is also known by Brent Blend, Brent Oil, and London Brent. It is the benchmark for the majority of the crude oil from the Atlantic basin, which marks for two-thirds of the crude oil price traded internationally. In the market, it is traded with the ticker XBR/USD.
Understanding XBR/USD
Brent Crude is a commodity traded in barrels. The price of XBR/USD depicts the value of the US Dollar for 1 barrel of crude oil. It is quoted as 1 XBR per X USD. For example, if the market price of XBR/USD is 41.42, then it means that each barrel of crude oil is worth $41.42.
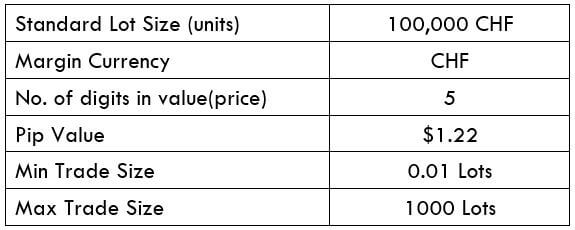
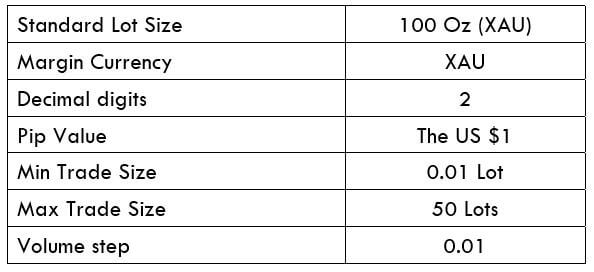
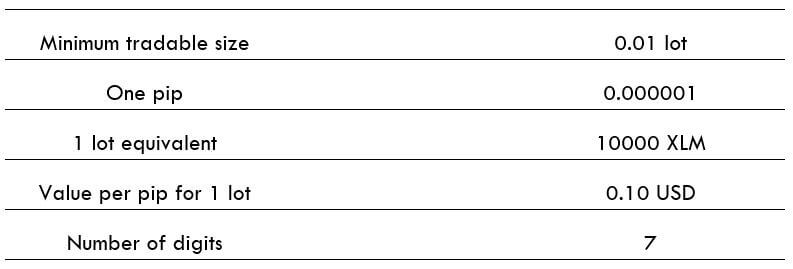
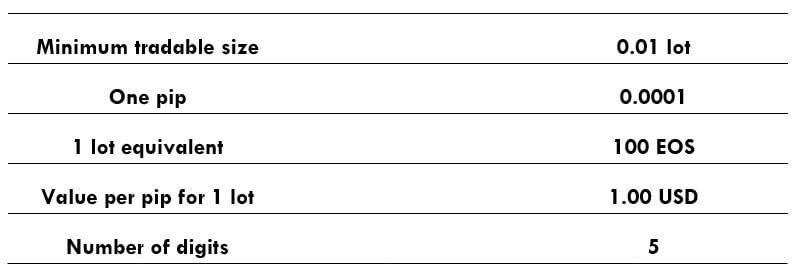
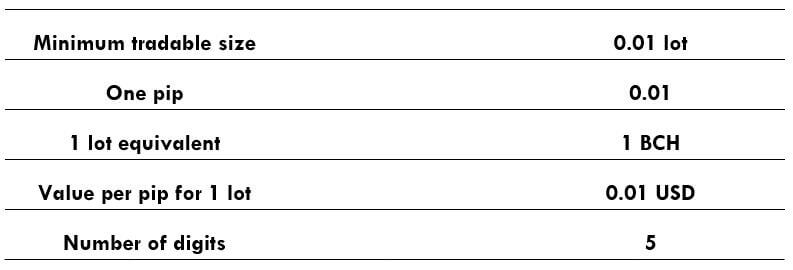
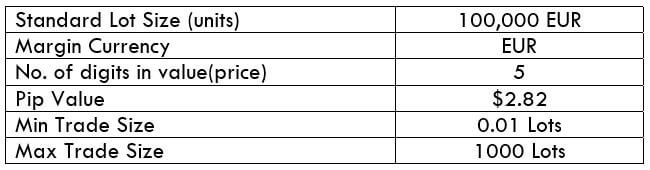
XBR/USD Specification

Spread
It is the basic difference between the bid price and the ask price. The spread on ECN and STP account model is as follows:
ECN: 11 | STP: 15
Fee
There is a fee (commission) for every position a trader opens. However, this fee is only on the ECN account, not the STP account.
Slippage
Slippage is the difference between the price intended by the trader and the price given by the broker. It occurs due to two factors:
- Broker’s execution price
- The volatility of the market
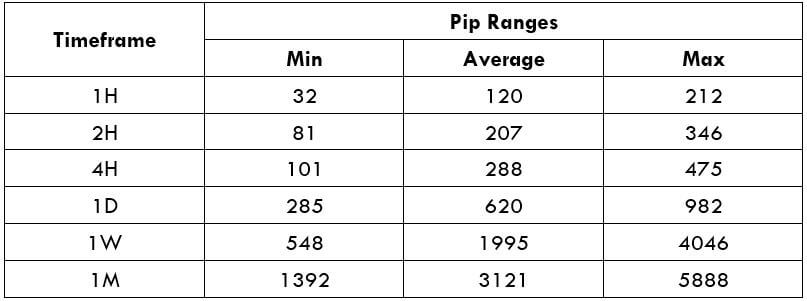
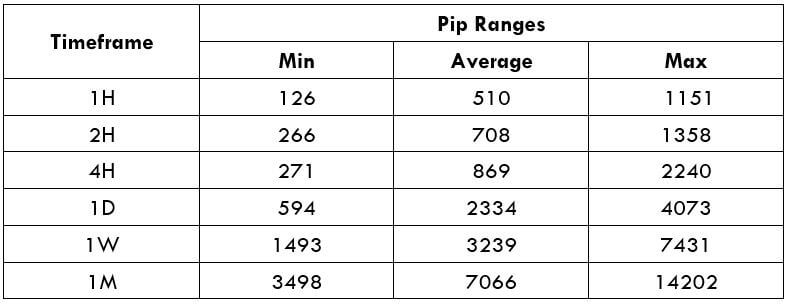
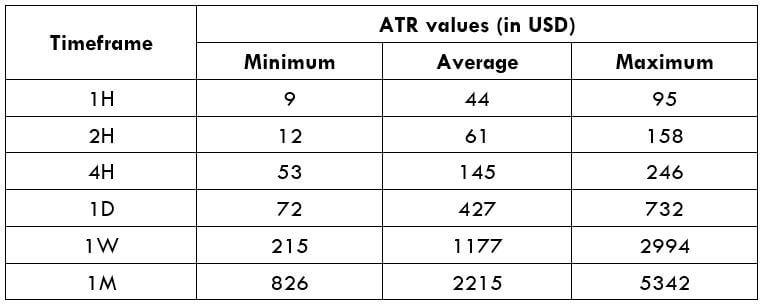
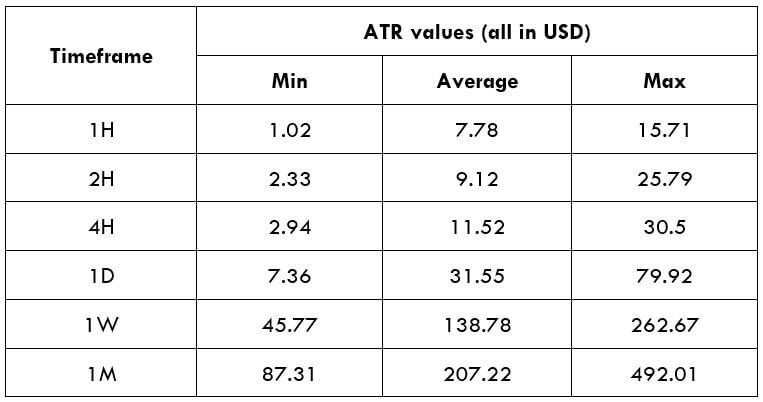
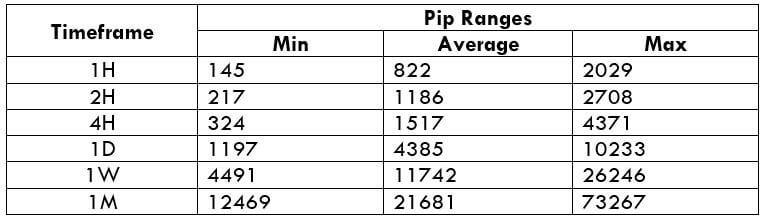
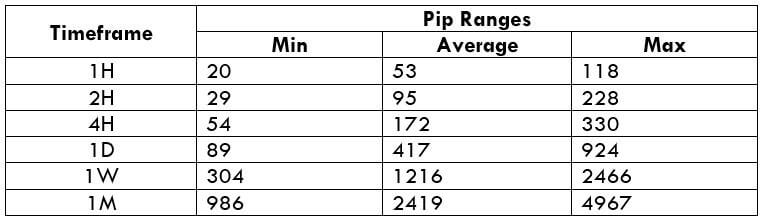
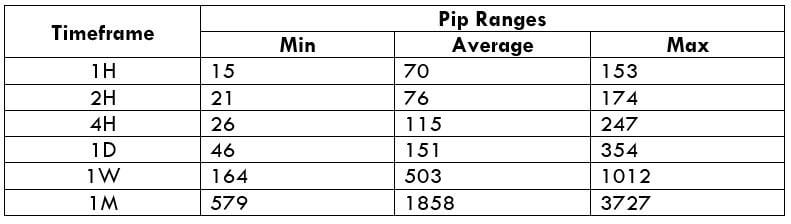
Trading Range in XBR/USD
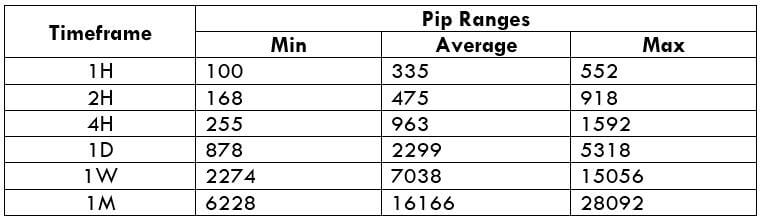
It is the representation of the volatility of the market in different time frames. The table values represent the minimum, average, and maximum pip movements in various time frames.
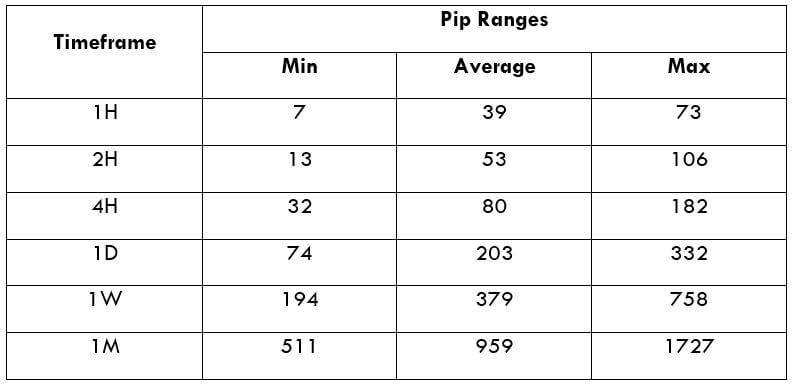
Procedure to assess Pip Ranges
- Add the ATR indicator to your chart
- Set the period to 1
- Add a 200-period SMA to this indicator
- Shrink the chart so you can assess a large time period
- Select your desired timeframe
- Measure the floor level and set this value as the min
- Measure the level of the 200-period SMA and set this as the average
- Measure the peak levels and set this as Max.
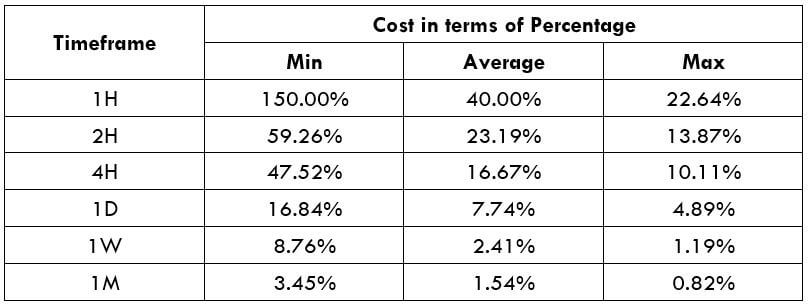
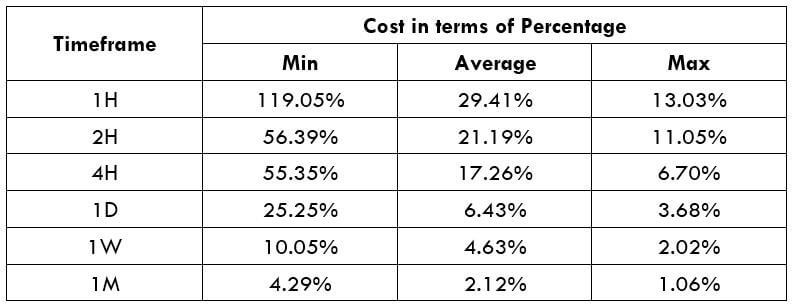
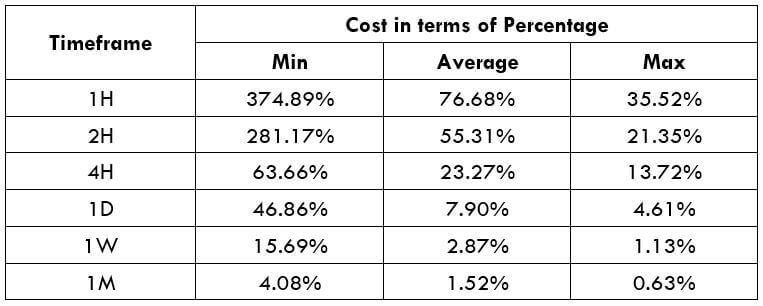
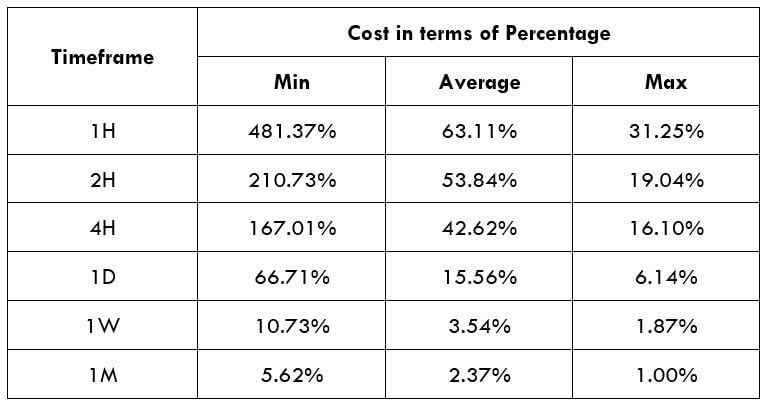
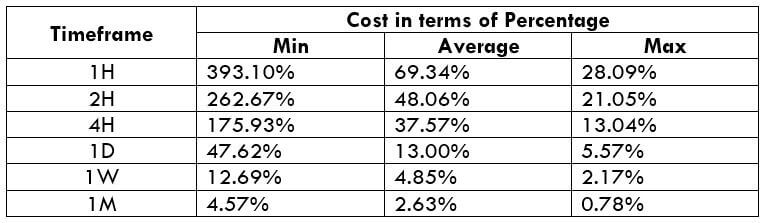
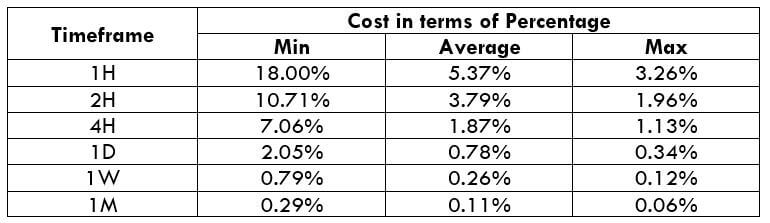
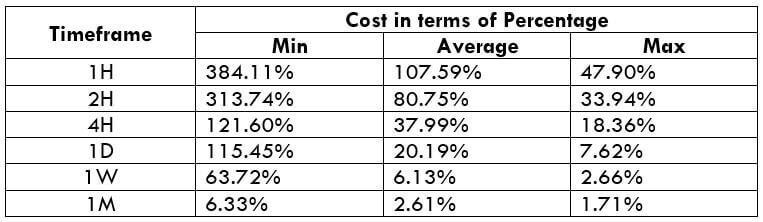
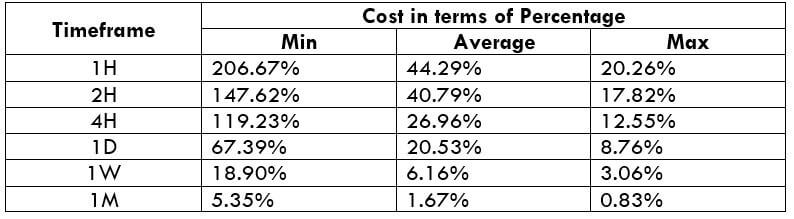
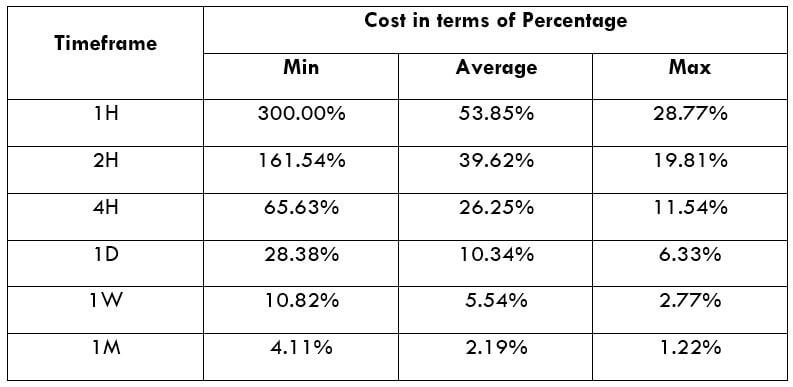
XBR/USD Cost as a Percent of the Trading Range
The following are two tables that represent the variation in the fee in terms of a percentage for different time frames. The percentage values are calculated by finding the ratio between the total cost and the volatility values.
ECN Model Account
Spread = 11 | Slippage = 5 | Trading fee = 5
Total fee = Spread + Slippage + Trading fee
Total fee = 11 + 5 + 5 = 21 (pips)
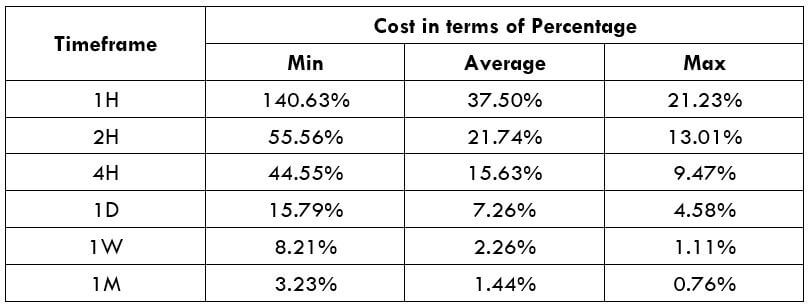
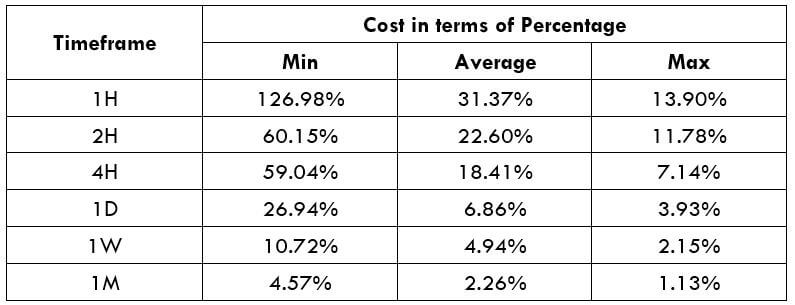
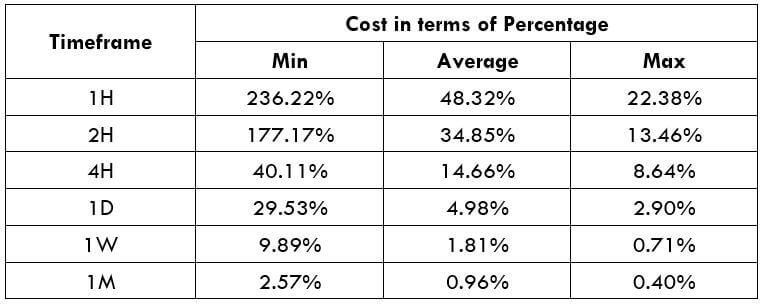
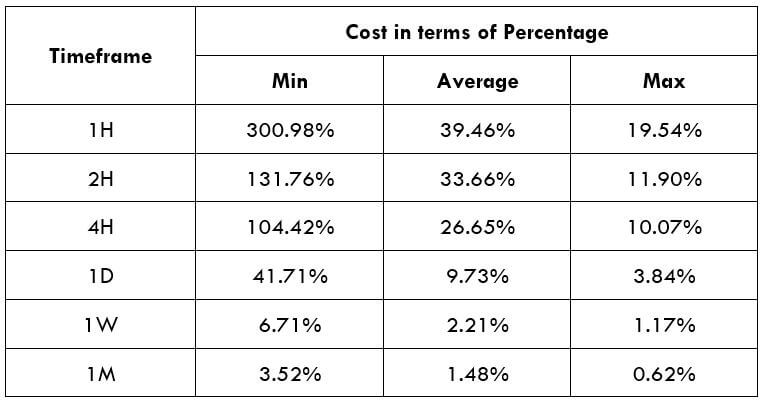
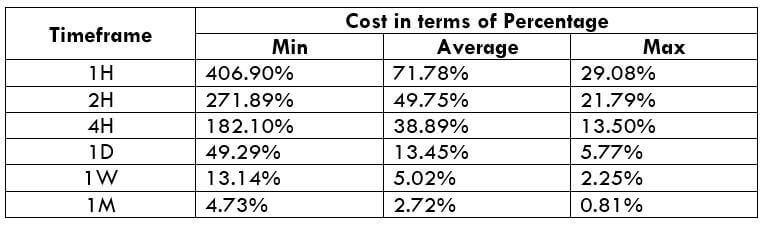
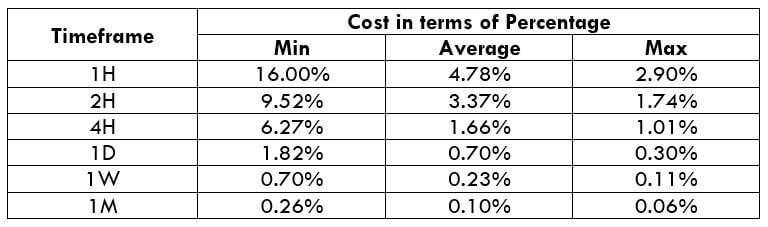
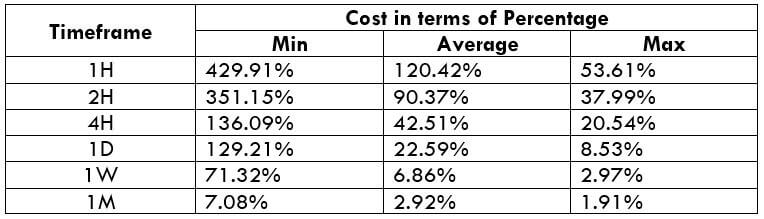
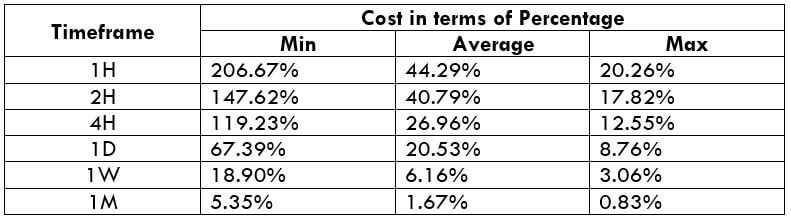
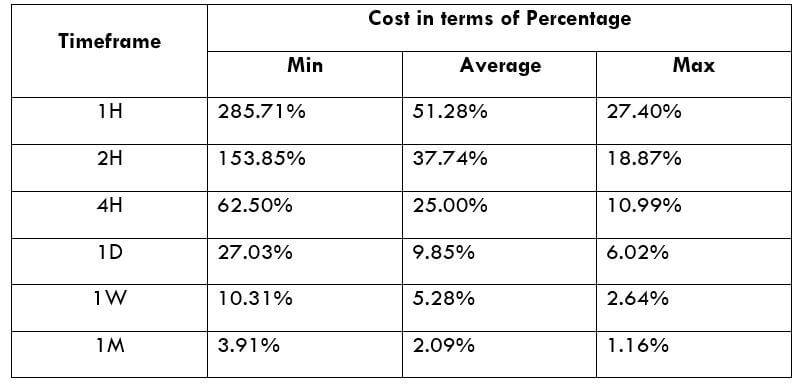
STP Model Account
Spread = 15 | Slippage = 5 | Trading fee = 0
Total fee = Spread + Slippage + Trading fee
Total fee = 15 + 5 + 0 = 20 (pips)
Trading the XBR/USD
Crude oil is a commodity that is rigorously traded in the market. Its volatility and liquidity are comparable to major and minor currency pairs, providing good opportunities for traders to participate in the market. The crude oil prices are driven by various fundamental factors and its Demand and Supply. The reflection of the same is seen on the charts. Thus, traders can apply technical analysis as well to forecast the price movements.
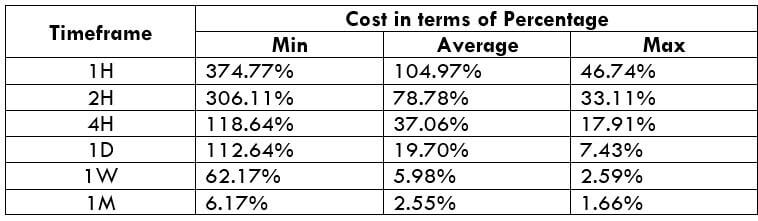
There is a fee on every trade you take with a forex broker. This fee is the same irrespective of the time frame you trade on. So, traders must place themselves in a position that will have a reasonable cost for a sufficient P/L. The trading range and the cost percentage table are the tools for it.
The larger the percentage value, the higher is the relative fee on the trade and vice versa. For example, let’s there are two traders – 1D and 4H trading with the same lot size. The 1D trader places a take profit to 200 pips, while the 4H trader places it at 100 pips. But the fee paid by both the traders is the same. But, seeing the relative fee, the 4H trader pays a higher fee than the 1D trader because his take profit is only 100 pips. Thus, the percentage values are higher in the 1D time frame than the 4H time frame.
There is another scenario where the relative cost changes based on the volatility of the market. In simple terms, the relative fee can vary even if a trader trades in the same time frame. Precisely, the relative fee is higher when the volatility of the market is around the minimum values. Therefore, to balance between the total fee and the P/L, one must trade when the market volatility is above the average volatility, irrespective of the time frame traded.