Categories
Crypto Guides

Could Bitcoin Ever Beat Gold & Get The Safe-Haven Status?

Introduction

The traditional investors from the last few months are trying to understand the unprecedented financial system. The world is suffering from economic uncertainties, where 20% of the US workforce lost their jobs due to the COVID pandemic situation. At the same time, the precious metal “gold” hit an all-time high in this 2020 summer and stayed on a hike for a long time ever since.

The gold rush in the market might be due to various reasons – US dollar fall, US-China deteriorating relations, and general global economic crisis. Also, cryptocurrency investors advocated that Bitcoin perhaps can beat gold as the safe-haven, but researchers pointed out the fact that BTC is not so performing. As with the stock market fall, the market worth of Bitcoin was also down – which means that BTC can’t be classed as a safe-haven asset.

Bitcoin and Gold Market Risk

Bitcoin and gold have emerged as a leading investment unit to stabilize the economic downfall. In the finance industry, there is no guarantee for returns on investment, so there is always high risk. It’s not true that the value of gold will always rise because, in 2012-2015, it was dropped by $20,000 per ounce. Similarly, BTC value bounces up and down. Gold is not so volatile as Bitcoin currency. Gold is acting as a safe-haven from the last 100 years, and bitcoin is in the market from the last decade.

Can Bitcoin be called a Safe-Haven Asset?

Amid all economic crises, bitcoin price hardly reached $9,011, and that too, with a high risk. So, it can’t be considered as a safe-haven asset due to the following two reasons:

Reason 1

The Bitcoin volume in the market is so small to validate the concept of the safe-haven asset. A safe-haven in the traditional market is the asset whose price rises typically. When there is any risk, the investors simply shift their money from risky assets to a safe one to avoid the loss and to retain their investment value.

In the traditional market, Bitcoin’s share is less than $200 billion US dollar, which is not enough to perform as a safe-haven asset. It lacks federal regulations for transactions, and there is a high risk of scams in the Bitcoin cryptocurrency industry. That’s why the Securities and Exchange Commission also rejected the Bitcoin ETF proposal.

Reason 2

Bitcoin can’t be accessed or used in the environment, having no internet connection. In extreme places, you may be cut-off from the cryptocurrency exchange and Bitcoin traders due to limited internet connectivity. For example, due to any major strikes, most of the time, the government shut down the internet accessibility to slow down the protests and all.

In the meantime, due to no internet connection bitcoin wallet and exchange system get hampered instantly. Therefore, bitcoin can’t be used in the emergency situation, so it can’t be considered as an alternative currency or safe-haven asset.

Conclusion

Gold is a risky asset because of sharp falls, and bitcoin, too, has speculative risk factors. In the case of the safe-haven concept, gold is already declared as a safe-haven asset in the traditional market, while Bitcoin is battling for the title. A wide range of economic forces across the world doesn’t impact its value, as BTC trade executes independently. Despite the global recession and high unemployment, BTC is doing great in the market. But for now, we believe that this is not enough to qualify as a safe-haven asset.

Categories
Forex Assets

‘BNB/USD’ – Analyzing The Trading Costs Involved

Introduction

BNB/USD is the abbreviation for the cryptocurrency pair Binance coin against the US dollar. This pair is quite volatile to trade compared to coins like Bitcoin, Ether, Ripple, and Litecoin. It has a market capitalization of 2.76B. Because of its volatile nature, this pair is usually traded in cryptocurrency exchanges than forex brokers.

Understanding BNB/USD

The market price of BNB/USD represents the value of the US Dollar equivalent to one Binance coin. It is quoted as 1 BNB per X USD. For example, if the value of BNB/USD is 17.541, then we can say that each Binance coin is worth 17.541 US dollars.

BNB/USD specifications

Spread

Spread is the difference between the bid and the ask price that is set the exchanges. Below are the spread values of the BNB/USD currency pair in both ECN & STP accounts.

ECN: 45 pips | STP: 53 pips

Fee

For every position a trader opens, the broker charges some fee for it. Traders must know that this fee is applicable only on ECN accounts and not on STP accounts.

Slippage

Slippage is the difference between the price required by the trader for execution and the price at which the broker executed the price. There is this difference due to the high market volatility and slower execution speed.

Trading Range in BNB/USD

A trading range is the representation of the volatility in BNB/USD in different timeframes. The values are extracted from the Average True Range indicator. One may use the table as a risk management tool as it determines the profit/loss that a trader is possessed towards.

Procedure to assess Pip Ranges

  1. Add the ATR indicator to your chart
  2. Set the period to 1
  3. Add a 200-period SMA to this indicator
  4. Shrink the chart so you can assess a large time period
  5. Select your desired timeframe
  6. Measure the floor level and set this value as the min
  7. Measure the level of the 200-period SMA and set this as the average
  8. Measure the peak levels and set this as Max.

BNB/USD Cost as a Percent of the Trading Range

The total cost of the trade varies based on the volatility of the market. So, we must figure out the times when the costs are less to position ourselves in the market. Below is a table representing the variation in the costs based on the change in the volatility of the market.

Note: The percentage values only depict the relative magnitude of costs and not the actual costs on the trade.

ECN Model Account

Spread = 45 | Slippage = 10 |Trading fee = 10

Total cost = Slippage + Spread + Trading Fee = 10 + 45 + 10 = 65

STP Model Account

Spread = 53 | Slippage = 10 | Trading fee = 0

Total cost = Slippage + Spread + Trading Fee = 10 + 53 + 0 = 63

Trading the BNB/USD

Volatility and Cost are the two factors traders take into account for trading any security in the market. With the assistance of the above tables, let’s analyze these two factors to ideally trade the BNB/USD.

Volatility

In every timeframe, we can see that the pip difference is significantly high between the minimum volatility and the average volatility. As a day trader, our aim is to make money from the movement of the market. But, if there is hardly any movement in the price, then it becomes challenging to extract some money out from the market. Hence, it is ideal to trade when the volatility is at least at the average value.

Cost

The cost increases as the volatility decrease. They are inverse to each other. In other terms, highly volatile markets have the least costs. However, it is quite risky to trade markets with extreme volatility though the costs are low. Hence, to maintain a balance between the cost and volatility, traders may find trading opportunities when the volatility is around the average values or a little above it.

Bonus

Traders can also bring down their total costs by placing orders as ‘limit’ instead of ‘market.’ This will entirely cut the slippage on the trade and therefore reduce the total cost. In the above example, the total cost would decrease by ten pips, which quite a decent reduction for just changing the type of order execution.

Categories
Forex Assets

Trading The EOS/USD Crypto-Fiat pair & Understanding The Costs Involved

Introduction

EOS is a blockchain-based cryptocurrency, as well as a platform for decentralized app execution. This blockchain was developed despite the existence of Bitcoin and Ethereum to solve the problem of speed and scalability.

Understanding EOS/USD

The price of EOS/USD represents the value of the US Dollar equivalent to one EOS. It is quoted as 1 EOS per X USD. So, if the market price of EOS/USD is 2.5290, these many dollars are required to buy one EOS.

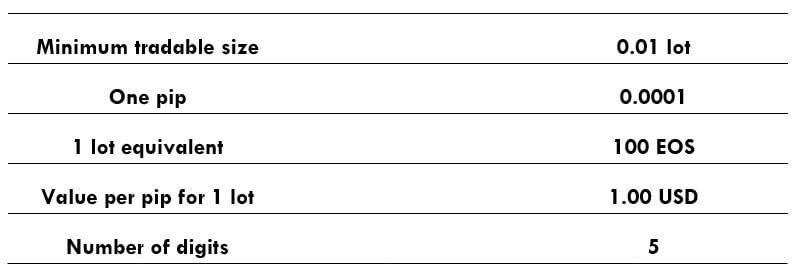
EOS/USD specifications

Spread

The difference between the bid & ask prices is known as spread. It changes with the execution model used brokers. Below are the spreads for both ECN & STP models for EOS/USD pair.

Spread on ECN: 10 pips | Spread on STP: 13 pips

Fee

A Fee is basically the commission on the trade. Note that there is a fee on ECN accounts, not STP.

Slippage

Due to high market volatility and the broker’s slower execution speed, slippage occurs. It is a difference in the price intended by the trader and price executed by the broker.

Trading Range in EOS/USD

The trading range is basically a tabular representation of the pip movement in EOS/USD for different timeframes. These numbers can be used traders as a risk management tool as determines the approx. profit/loss that can be made on a trade.

Procedure to assess Pip Ranges

  1. Add the Average True Range indicator to your price chart
  2. Then set the period to one
  3. Add a 200-period Simple Moving Average to this indicator
  4. You can assess a large time period by shrinking the price chart
  5. Select your desired timeframe
  6. Measure the floor level and set this value as the min
  7. Measure the level of the 200-period SMA and set this as the average
  8. Measure the peak levels and set this as Max.

EOS/USD Cost as a Percent of the Trading Range

The total cost comprising of the spread, slippage, and trading fee, changes with the volatility of the market. Hence, it is necessary for traders to position themselves to avoid paying high costs.

Below is a table representing the variation in the costs for different values of volatility.

ECN Model Account

Spread = 10 | Slippage = 3 |Trading fee = 5

Total cost = Slippage + Spread + Trading Fee = 3 + 10 + 5 = 18

STP Model Account

Spread = 13 | Slippage = 3 | Trading fee = 0

Total cost = Slippage + Spread + Trading Fee = 13 + 3 + 0 = 16

Trading the EOS/USD

The volatility and liquidity in this pair are similar to coins like Bitcoin and Ethereum. Hence, this makes EOS/USD a tradable pair. The spread in this pair is between 10-15 pips, which is extremely less compared to its volatility. Due to this, the costs reduce significantly. The highest cost percentage is only 18%.

However, we cannot ignore the fact about the volatility in this pair. This pair is pretty volatile and must be traded cautiously. It is recommended for traders to trade when the volatility of the market is around the average values. Furthermore, the costs can be reduced even further by placing orders as a limit or stop instead of the market. In doing so, the slippage will become zero and will reduce the total cost of the trade.