Introduction
Tezos is a platform that supports the development of DApps and smart contracts. It was created by an ex-Morgan Stanley analyst Arthur Breitman who launched an Initial Coin Offering (ICO) in 2017, raising $232 million. The next year, Tezos launched its beta network in July.
Tezos works by giving incentives to users willing to participate in the development of its protocol. Note that the complete network is decentralized. Users cannot mine Tezos coins as it based on the Proof-of-stake mechanism, unlike the Proof-of-Work in Bitcoin blockchain. Tezos is powered with its own XTZ token, which is created through a process called “baking.”
Understanding XTZ/USD
The price of XTZ/USD depicts the value of the US Dollar equivalent to on Tezos. It is quoted as 1 XTZ per X USD. For example, if the XTZ/USD’s market price is 2.9157, then each XTZ will be worth 2.9157 US dollars.
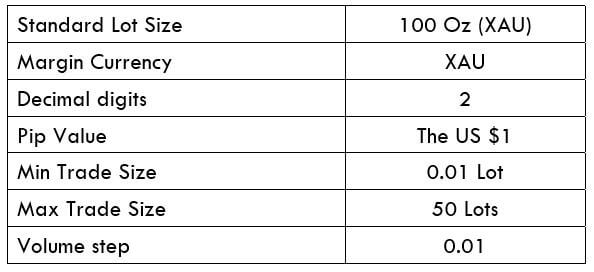
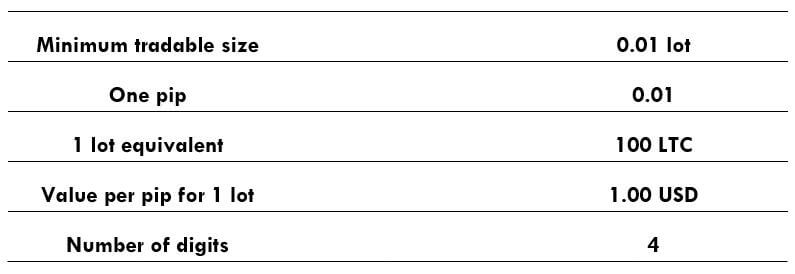
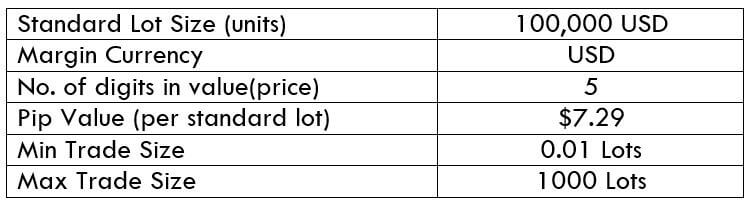
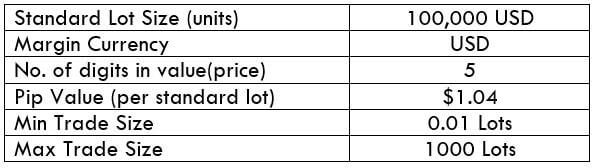
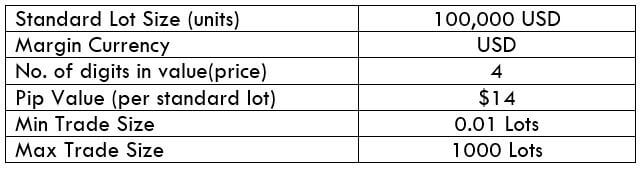
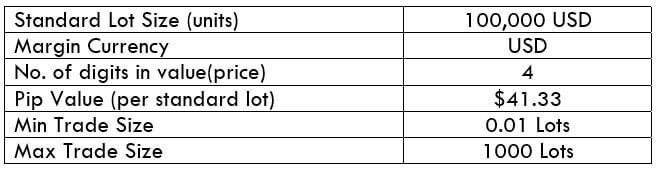
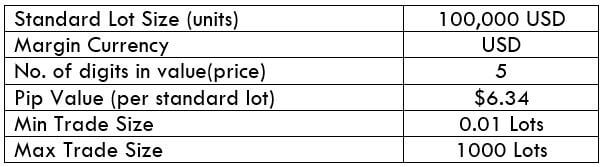
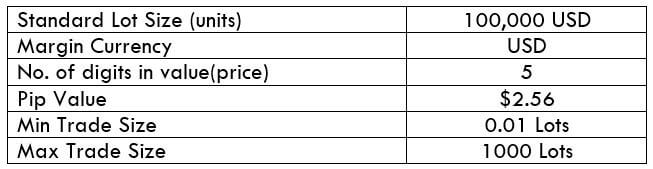
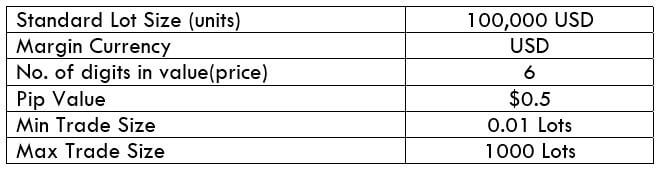
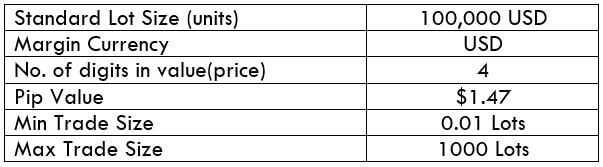
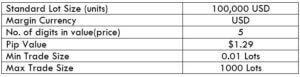
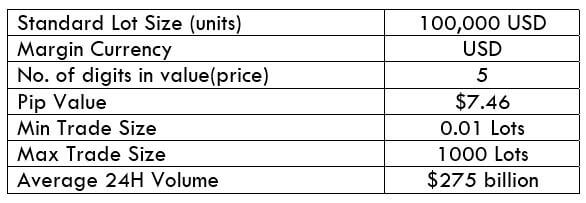
XTZ/USD specifications
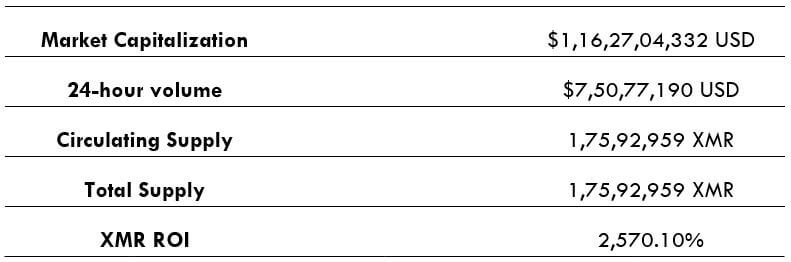
XTZ stands 11th in terms of market capitalization on CoinMarketCap. Forex brokers typically allow trading of only the top 3 or top 5 for trading. So, most brokers do have XTZ enabled for trading. Thus, you will have to approach a cryptocurrency broker instead. They work quite differently from that of the forex broker. For example, instruments are traded in lots with forex brokers, unlike cryptocurrency exchanges.
Spread
Spread is the difference between the buying and selling price of the cryptocurrency. These prices are set by individual traders and not the exchange. Thus, the spread always varies. Hence, we shall not be considering the spread in further calculations.
Fee
There are a number of fees charged by exchanges for trading cryptos. Below are some types of fees levied by most exchanges.
- Execution fee (Taker or Maker)
- 30-day trading volume fee
- Margin opening fee, if applicable
Note that, the taker or maker fee is charged twice – for opening and closing the trade.
Example
- Long 1,000 XTZ/USD at $2.9169
- 30-day volume fee is 0.12%
- Order is executed as Maker
- Without Leverage
Total cost of the order = 1,000 x $2.9169 = $2916.9
Assuming the maker fee to be 0.16%, the opening fee will be – $2916.9 x 0.16% = $4.66
In addition, there is 0.12% fee for 30-day volume fee – $2916.9 x 0.12% = $3.50
Since the trade is opened without leverage, the margin opening fee will be $0.
If the order is closed at $2.9605, the total cost of closing will be – 1,000 x $2.9605 = $2960.5. The fee for closing will be:
$2960.5 x 0.16% = $4.73
Therefore, the total fee for this trade can be calculated as:
$4.66 + $3.50 + $4.73 = $12.89
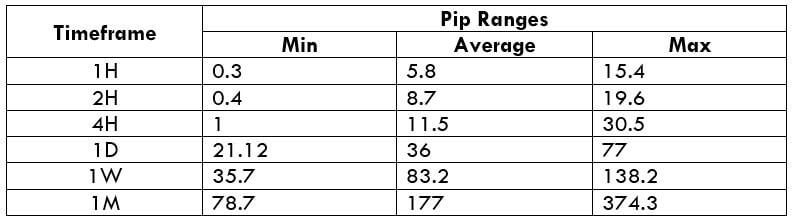
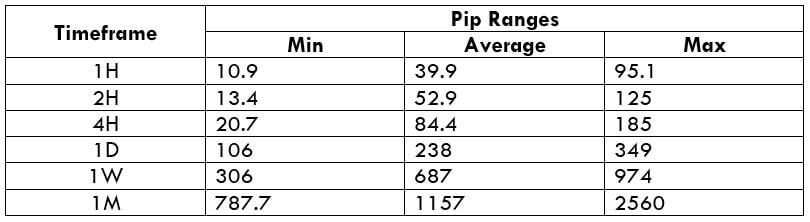
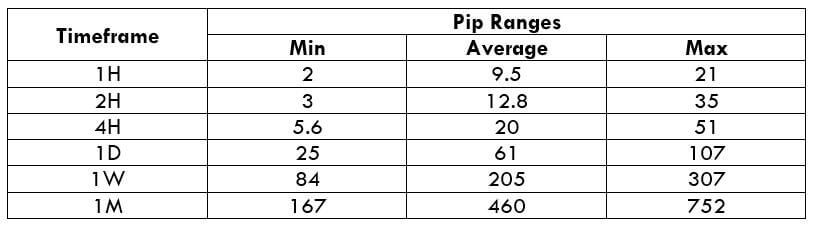
Trading Range in XTZ/USD
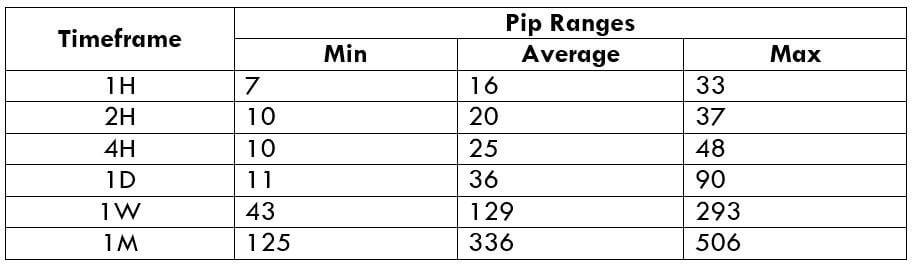
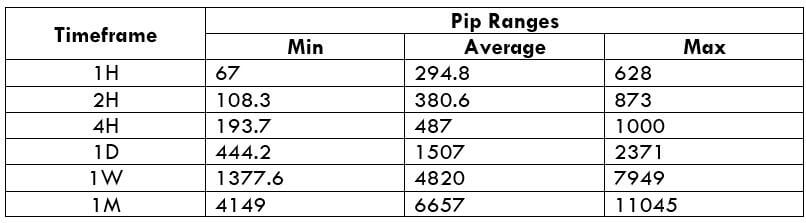
The trading range in cryptocurrencies is different from that of foreign exchange. In forex, we calculated the pip movement using the ATR indicator and multiplied it with the pip value to find its worth. Since in cryptocurrency exchanges, there is no concept of pips. So, instead of representing the pip movement, we directly represent the value/worth of the price movement into the table.
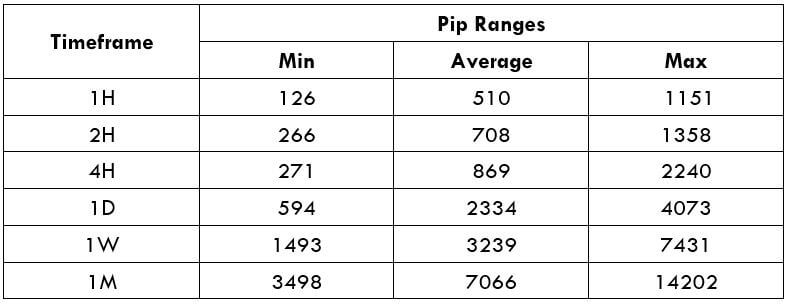
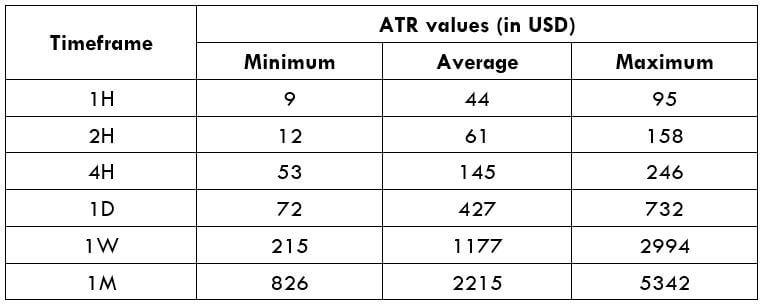
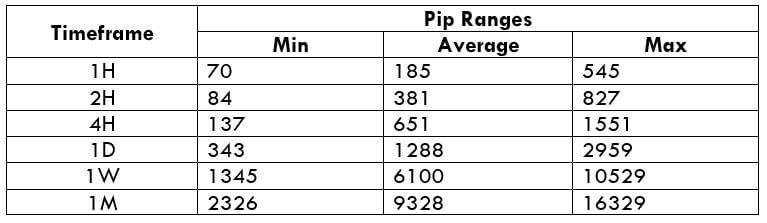
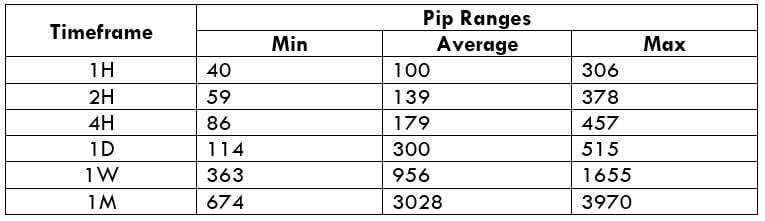
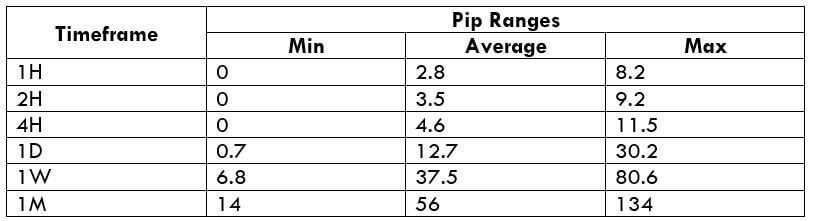
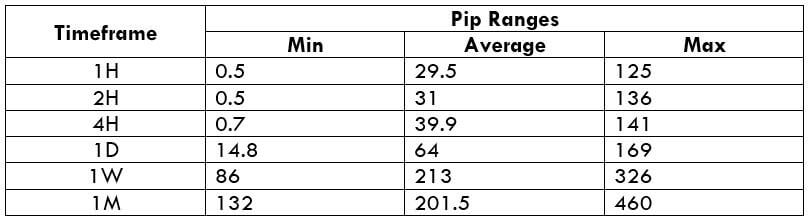
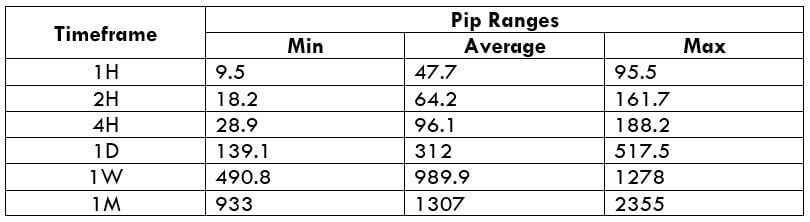
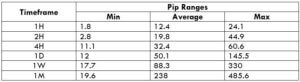
The below table represents the value of the price movement for 1,000 quantities of XTZ/USD.
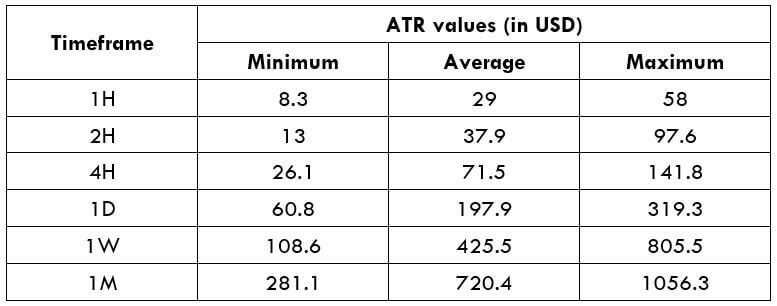
Note: the above values are for trading 1,000 units of XTZ/USD. If X units of the pair are traded, then the ATR values will be,
(ATR value from the table / 1,000) x X units
Procedure to assess ATR values
- Add the ATR indicator to your chart
- Set the period to 1
- Add a 200-period SMA to this indicator
- Shrink the chart so you can assess a large time period
- Select your desired timeframe
- Measure the floor level and set this value as the min
- Measure the level of the 200-period SMA and set this as the average
- Measure the peak levels and set this as Max.
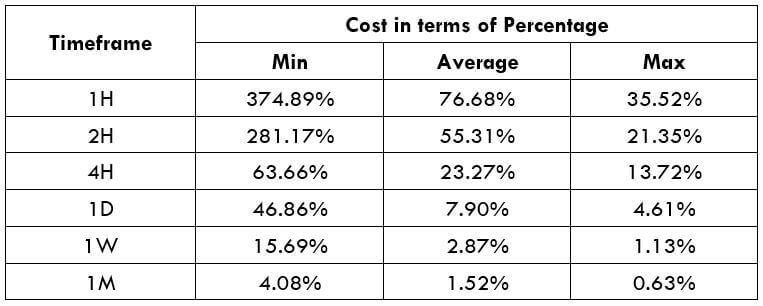
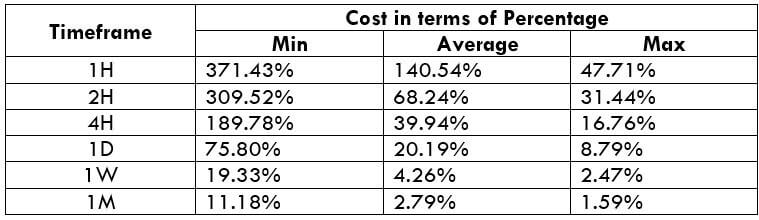
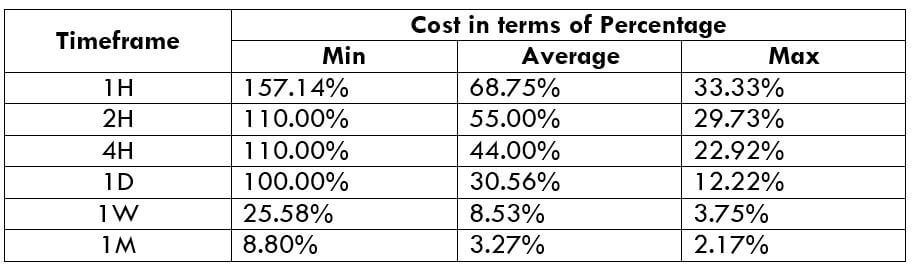
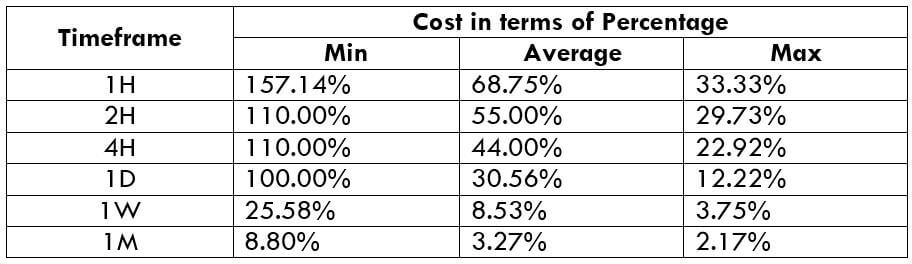
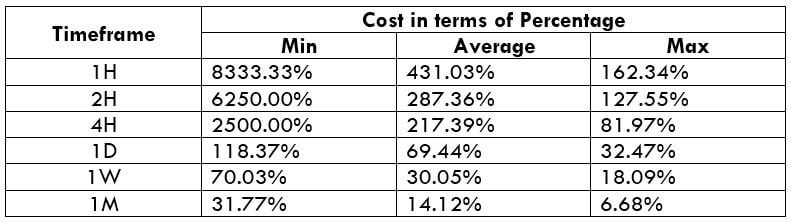
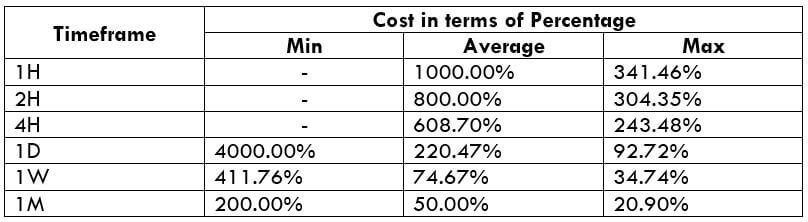
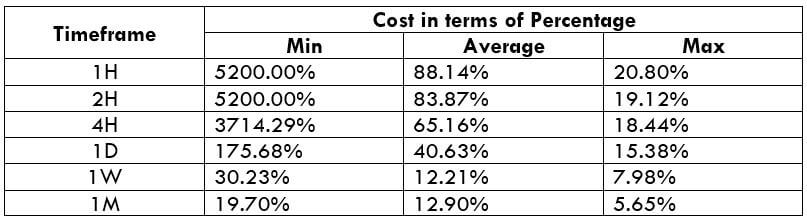
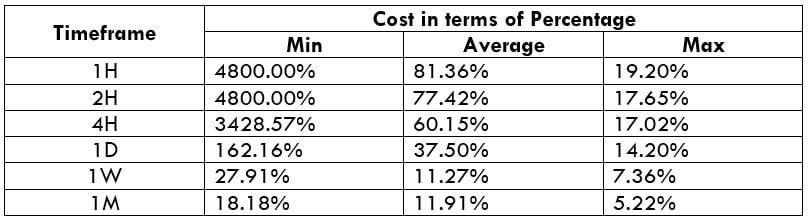
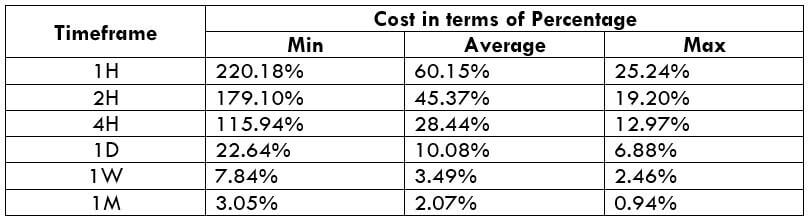
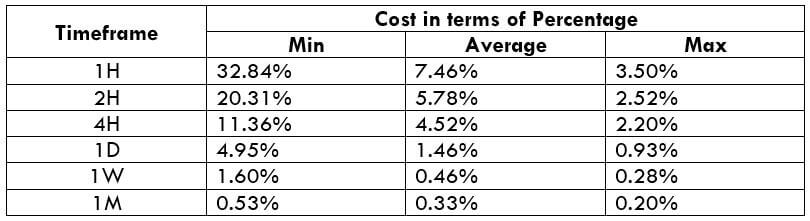
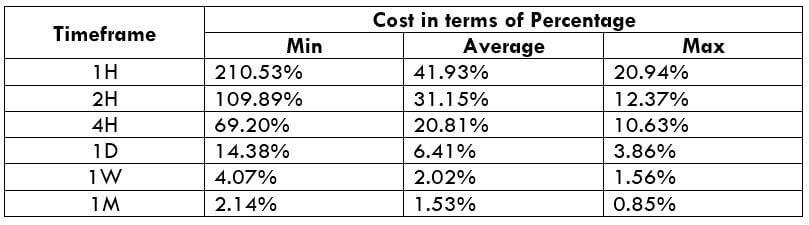
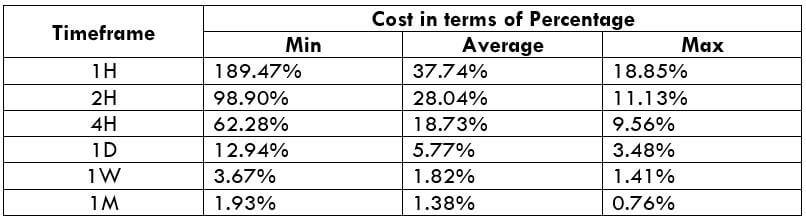
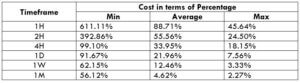
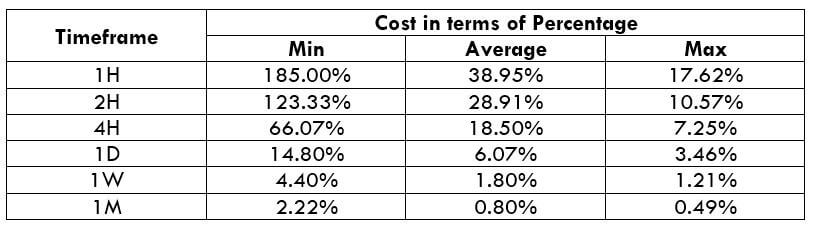
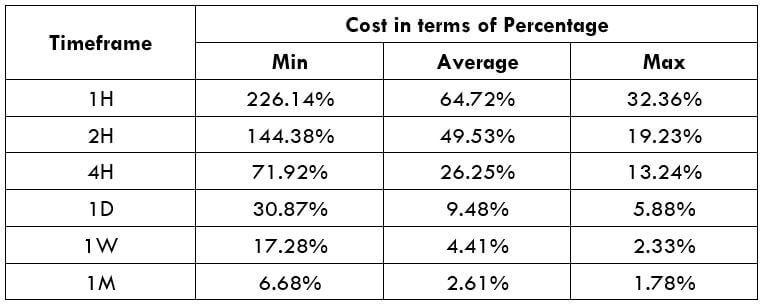
XTZ/USD Cost as a Percent of the Trading Range
Cost as a percent of the trading range represents the relative cost in terms of percentage. It is calculated by finding the ratio between the total cost and the ATR value. The comprehension of it shall be discussed in the subsequent topic.
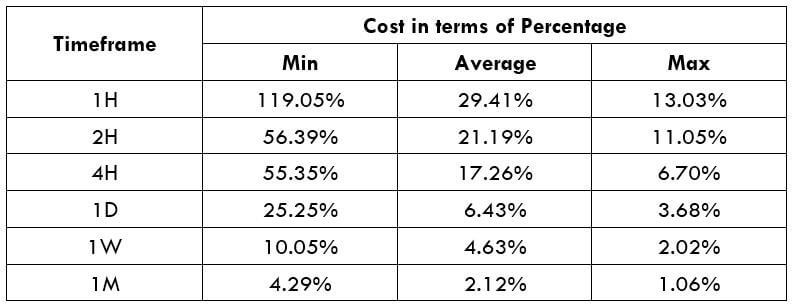
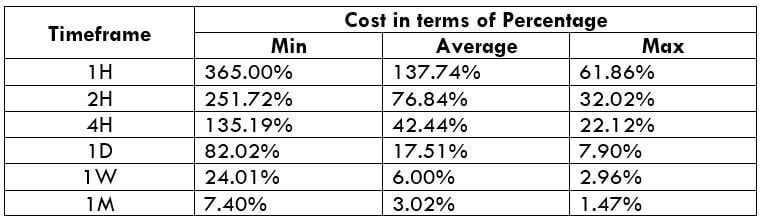
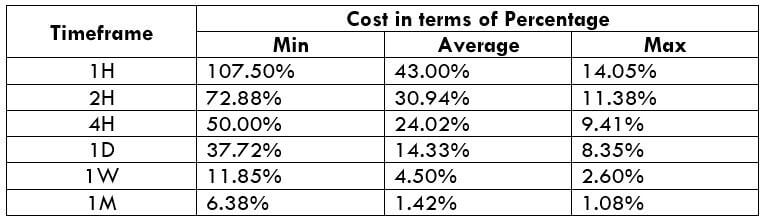
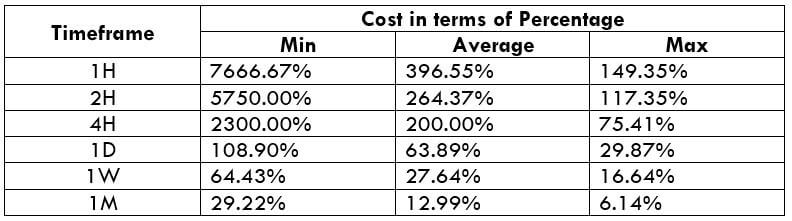
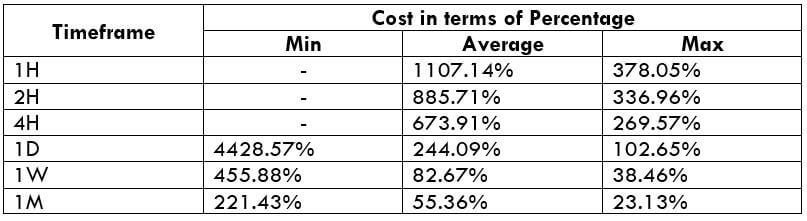
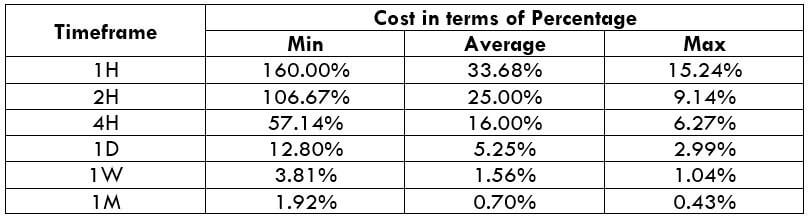
Taker Execution Model
Opening = $7.58 | Margin fee = $0 | Closing = $7.69 | 30-day volume = $3.50
Total fee = Opening + Margin fee + Closing + 30-day volume = $7.58 + $0 + $7.69 + $3.50 = $18.77
*Assuming taker fee to be 0.26% the trade value.
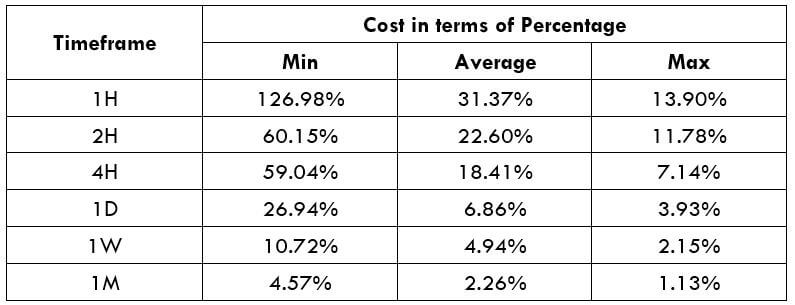
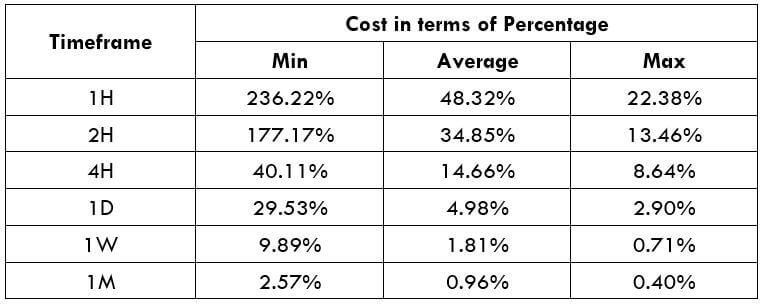
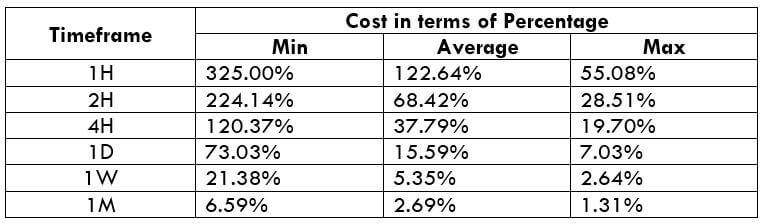
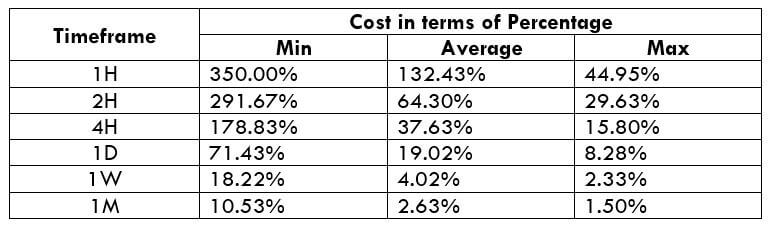
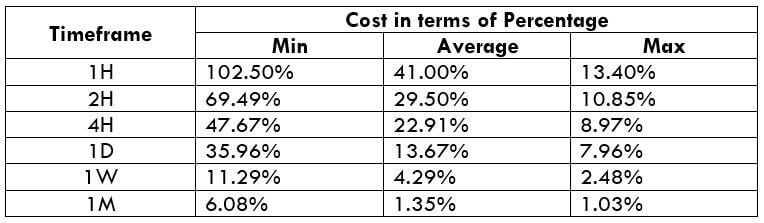
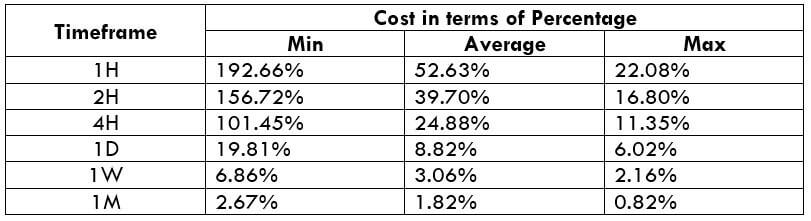
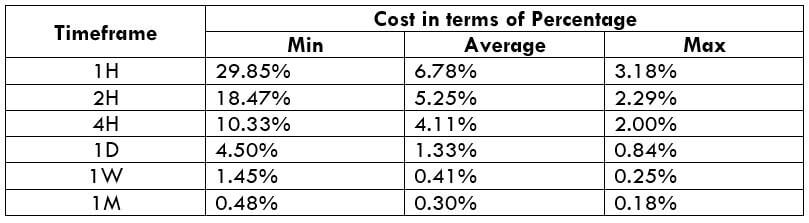
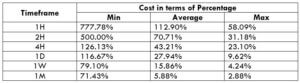
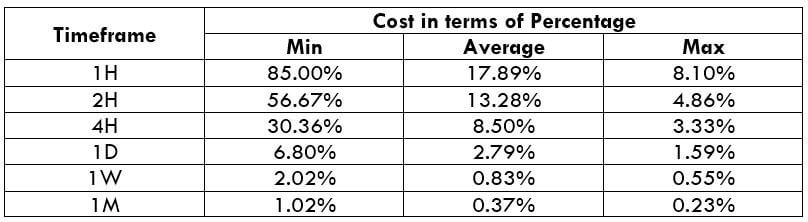
Maker Execution Model
Opening = $4.66 | Margin fee = $0 | Closing = $4.73 | 30-day volume = $3.50
Total fee = Opening + Margin fee + Closing + 30-day volume = $4.66 + $0 + $4.73 + $3.50 = $12.89
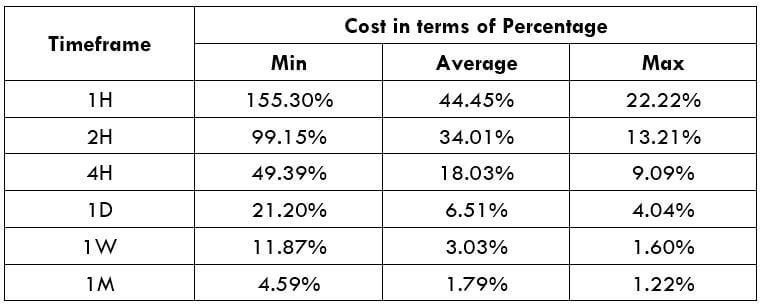
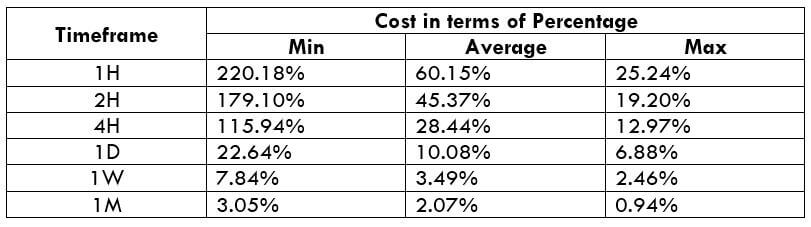
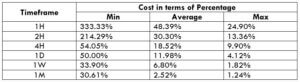
Interpretation of Cost as a Percent of the Trading Range
Firstly, the trading range table, in simple terms, depicts the approximate dollar profit/loss on the trade. For instance, let us consider the average value on the 4H timeframe, which is 71.5. This means that one can gain or lose an average of $71.5 in a matter of 4 hours or so.
With respect to the percentage table, the value of the percentage signifies how expensive the costs are relative to the time frame and profit or loss generated. In other sense, the cost remains the same irrespective of the time frame you trade. For example, let us consider the average percentage on the 4H time frame, which is 18.03%, and the average on the 1H, which is 34.01%. In both cases, the overall is the same, but the cost relative to the profit made, the cost appears to be higher in the 1H time frame because the profit amount is lower than the 4H time frame because there is more price movement on the 4H time frame.
Trading the XTZ/USD
Tezos is under the top 15 in market capitalization according to the data from CoinMarketCap. This signifies that it is intensively traded in the market. Most of the buying and selling happens in the cryptocurrency exchanges.
There are two types of traders – short term and long term. A short term trader may trade the 1H, 2H, 4H, or the 1D time frame, while a long term trader may go with the 1W or 1M time frame. Also, irrespective of the time frame, one must trade when the market volatility is around the average, or maximum value to relatively reduce fees on the trade.