Categories
Forex Signals

ETH/USD Peaking Out of Descending Trendline – Brace for Bullish Trade! 

Yesterday on Tuesday, the ETH/USD pair had exhibited slight bullish momentum on the 4-hour timeframe, which leads Ethereum prices to soar over 200 resistance levels. With this, the ETH/USD pair has crossed over 50 periods EMA and has also closed three white soldiers pattern on an 8-hour timeframe, which suggests odds of the bullish trend.

The support level stays around 205, which is extended by the 50 periods EMA on the 4-hour timeframe. While the MACD is also showing a bullish crossover as it has started concluding histograms above 0, demonstrating bullish bias in ETH/USD. 

For now, the ETH/USD has the potential to target the next resistance around 220 and 224. However, on the way, it may also meet an immediate hurdle around the 211 level. Therefore, the idea will be to place a buy stop above 177.16 with a stop loss below 165.16 and take profit at 192.16.


Trading Plan Summary

Buy Stop: 210.78    

Protective Stop: 203.28    

Profit Target: 222.78    

Risk/Reward Ratio: 1.60    

Categories
Forex Signals

Ethereum on a Bullish Run – Ascending Triangle In Play!

Yesterday on Thursday, the ETH/USD pair had exhibited dramatic bullish momentum on the daily timeframe, which leads Ethereum prices to soar to 174.68 resistance level. With this, the ETH/USD pair formed an ascending triangle pattern, which can be seen on the daily chart, and it is extending substantial resistance around 174.68 along with support at 164.

The support level of 164 is extended bu the 50 periods EMA which is suggesting chances of a bullish trend continuation on the Ethereum while the MACD is also suggesting chances of a bullish trend continuation in the market.


The recent bullish engulfing candle on the daily chart, formed on Thursday, is supporting odds of bullish trend continuation, therefore, the idea will be to place a buy stop above 177.16 with a stop loss below 165.16 and take profit at 192.16.

Trading Plan Summary
Buy Stop: 177.16
Protective Stop: 165.16
Profit Target: 192.16
Risk/Reward Ratio: 1.25

Categories
Forex Assets

Exploring The ETH/USD Pair & The Relative Costs Involved

Introduction

Trading cryptocurrencies is similar to trading in the Forex market, but the only difference being, both base and quote currencies are not fiat currencies. In crypto pairs, one of them is a virtual currency, and the other is a fiat currency. ETH/USD is a cryptocurrency pair, which is an abbreviation for Ethereum against the US Dollar. Participants can trade them via Forex brokers or through cryptocurrency exchanges.

Understanding ETH/USD

The value of ETHUSD represents the value of the US Dollar that is required to purchase one. It is quoted as 1 ETH per X USD. For instance, if the market price of ETHUSD is 170.46, then around 170 US Dollars are needed to buy one ETH.

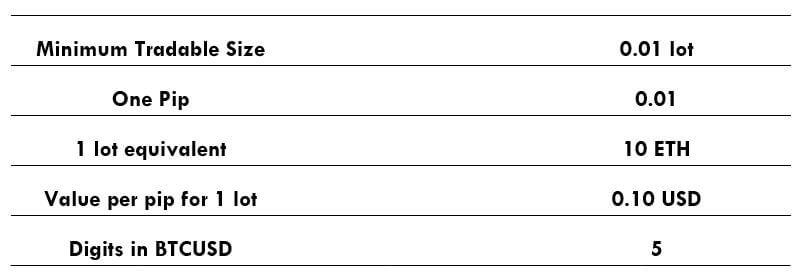
ETH/USD Specifications 

Spread

The difference between the bid price and the ask price marked by the brokers is called the spread. Spread is the main source of revenue for brokers. Spread on major and minor currency pairs is typically very low. But, in cryptocurrencies, the spread is usually high. Below are the spread values of ECN & STP accounts for the ETH/USD pair.

  • Spread on ECN: 200 pips (2 USD)
  • Spread on STP: 250 pips (2.5 USD)

Fee

A Fee is applicable only on ECN accounts and the pro accounts of brokers. Typically, it is between 40-50 pips.

Slippage

Slippage is the difference between the price at which a trader opened a position and the price given by the broker. Due to the high volatility of the market and slow execution by the brokers, slippage occurs.

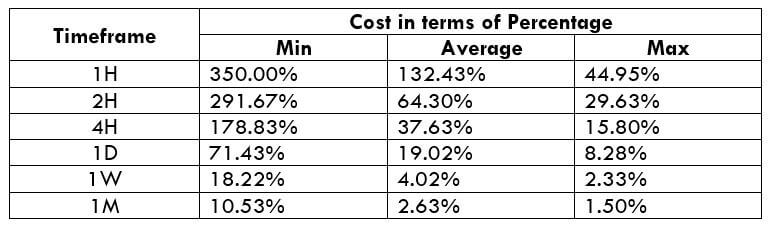
Trading Range in ETH/USD

Below is the representation of the volatility from minimum to maximum for ETHUSD in different timeframes. These numbers are very helpful in assessing one’s risk on a trade.  

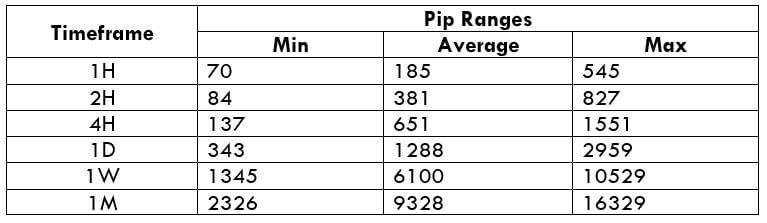
Procedure to assess Pip Ranges

  1. Add the ATR indicator to your chart
  2. Set the period to 1
  3. Add a 200-period SMA to this indicator
  4. Shrink the chart so you can assess a large time period
  5. Select your desired timeframe
  6. Measure the floor level and set this value as the min
  7. Measure the level of the 200-period SMA and set this as the average
  8. Measure the peak levels and set this as Max.

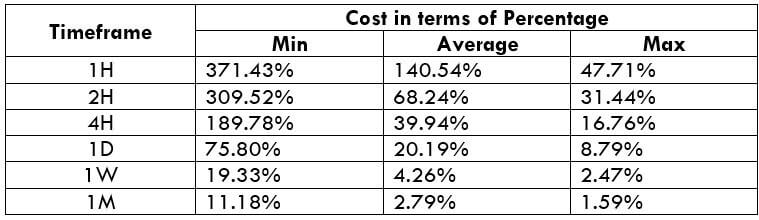
ETH/USD Cost as a Percent of the Trading Range

With the application of the volatility values with the total cost on the trade, the variation in the cost of a trade can be assessed. To do so, the ratio between the total cost and volatility is taken and expressed in terms of a percentage.

The magnitude of the costs represents how high the costs are. If the percentages are large, it indicates high costs and vice versa.

ECN Model Account

Spread = 200 | Slippage = 15 |Trading fee = 45

Total cost = Slippage + Spread + Trading Fee = 15 + 200 + 45 = 260

STP Model Account

Spread = 250 | Slippage = 15 | Trading fee = 0

Total cost = Slippage + Spread + Trading Fee = 15 + 250 + 0 = 265
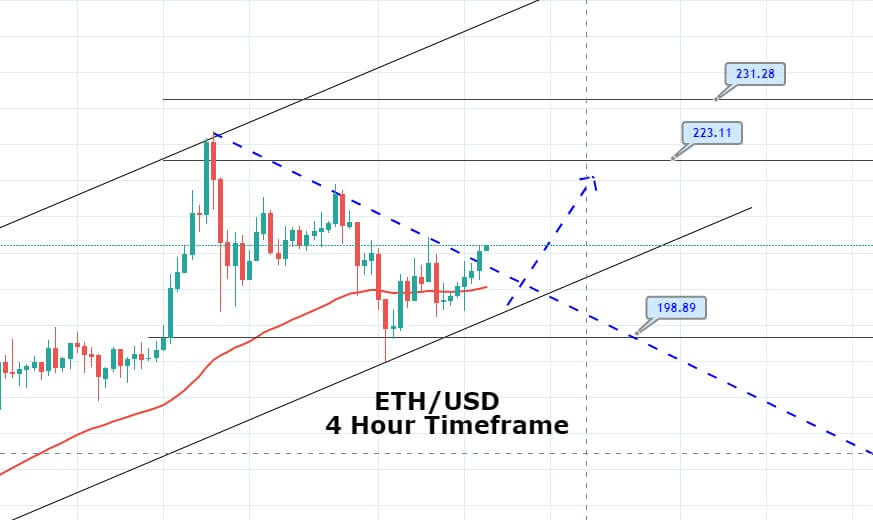
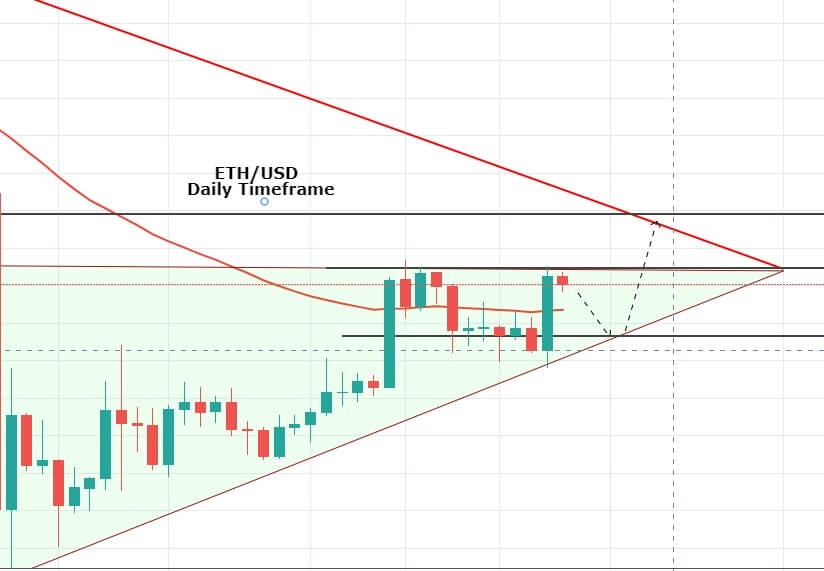
Trading the ETH/USD

Cryptocurrencies can be traded just like any other asset. In ETHUSD, the volatility is good enough for both short-term and long-term traders. Though the volatility values appear to be high, they don’t have a large reflection on your profit/loss. This is because, unlike forex currencies where one lot was equivalent to 100,000 units of the base currency, one lot in ETHUSD represents only 10 units of ETH.

From the above volatility table, it is seen that the costs are more when the volatility of the market is low and is less when the volatility is high. So, trading this pair majorly depends on the type of trader you are. For example, scalpers might trade when the volatility is high to get the greatest number of pips in a short amount of time. If they do so, they can get the benefit of lower costs.

In general, costs on a trade can be reduced by placing orders as ‘limit’ or ‘stop.’ In such orders, the slippage becomes nil. Hence, the total cost would be brought down to a good extent. The cost variations for limit orders or stop orders are given below for your reference and comparison.

ECN Model Account (Using Limit Orders)

Spread = 200 | Slippage = 0 |Trading fee = 45

Total cost = Slippage + Spread + Trading Fee = 0 + 200 + 45 = 245

Categories
Crypto Market Analysis

Daily update: Bitcoin, Ethereum, XRP, Cardano

Daily update: Bitcoin, Ethereum, XRP, Cardano

Bitcoin

  • Fundamental analysis: Bitcoin has seen some increases in transaction volume. However, the sentiment remains bearish. This is due to many people separating the terms Blockchain and Bitcoin, and respecting the value of one, and not the other.
  • Technical analysis: Bitcoin has had a pretty volatile day. In a span of 1 hour, Bitcoin jumped from the low of $6100 to the high of $6550. However, it has remained calm around the price of $6400, where it bounced off the support line ($6390) and stayed above it.

Ethereum

  • Fundamental analysis: Ethereum has been in good graces when it comes to market sentiment these few days. With a web browser on the Ethereum platform which is considered a viable replacement to Chrome, a change of governance to an updated versions of ERC tokens and much more, ETH has seen some bullish potential.
  • Technical analysis: When it comes to price, Ethereum has not seen many changes after the big spike that came on the 18th of September. It is now consolidating and waiting for buyers or sellers to start their cycle. It has also found some resistance at the 100 EMA on the 1h time frame.

XRP

  • Fundamental analysis: There is no doubt that the Ripple is a great company. Partnerships with major corporations just keep getting announced. However, most of these deals do not include XRP. That’s why the price of XRP is not as affected as some people might think it should be. On the other hand, if XRP ever gets included in some of these deals, the price will skyrocket. The trust of this happening is the sole reason people remain bullish when it comes to XRP.
  • Technical analysis: The 18th of September was a great day for XRP. The price spiked up over 20%. Also, the price is consolidating at the top of the move, and has not declined significantly after the upwards move. XRP has found good support at $0.31 and a resistance line at $0.332.

Cardano

  • Fundamental analysis: Fundamentals of Cardano have not changed for quite a while. It is still a platform with great potential, but we have yet to see what it has to offer when it comes to use case. The fundamentals are often speculative when it comes to this kind of Cryptocurrencies.
  • Technical analysis: Cardano is one of the top performers today. It has found an area of support to which the price responds perfectly (bottom blue line). The only times the price did not react was when Bitcoin had a major downswing, and every other Cryptocurrency followed. Once the price has came back above the support line, it has retested it and stayed above.