Categories
Crypto Cryptocurrencies

What Makes Litecoin a Promising Investment?

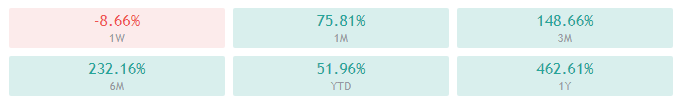
Litecoin has, for a long time, stood out as a good investment, and it’s not just for the competitive prices it has been fetching. The crypto has grown for almost a decade from $4 to over $100. Ranking 5th by market capitalization is fair stability for a crypto that has been around for 9 years. Before 2017, the LTC hardly ever fetched a price above $10. Nonetheless, it soared during the 2017 bull run to fly as high as $321. 

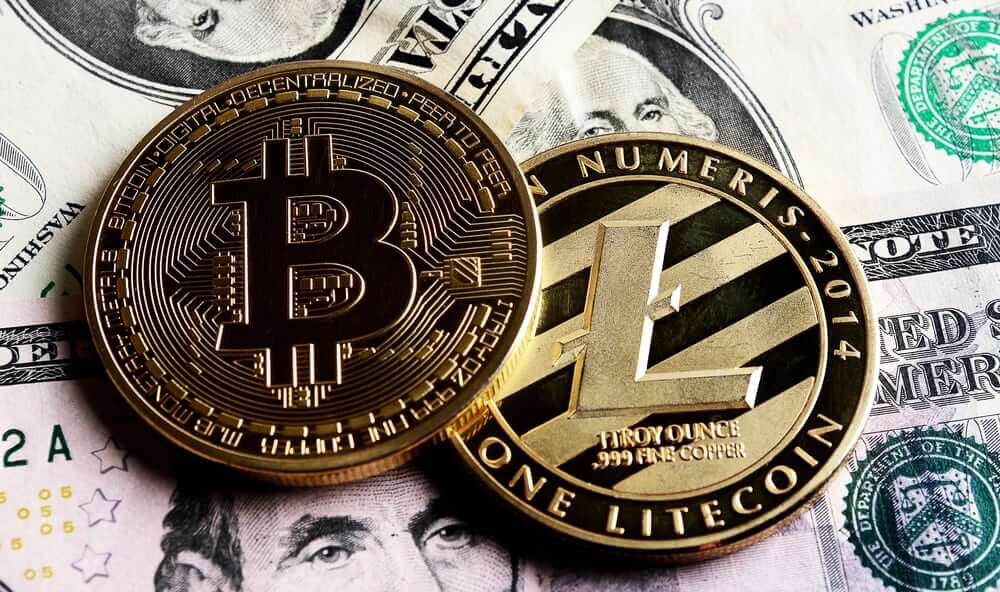
Litecoin was created as an alternative to Bitcoin, with faster transactions so that it could serve as a transactional currency. While facilitating transactions were at the core of its design, crypto users have turned it into an investment asset as they’ve done to all other digital currencies. The past has so far been impressive. But is Litecoin still a good investment? Read on to find out.

What Makes Litecoin Unique?

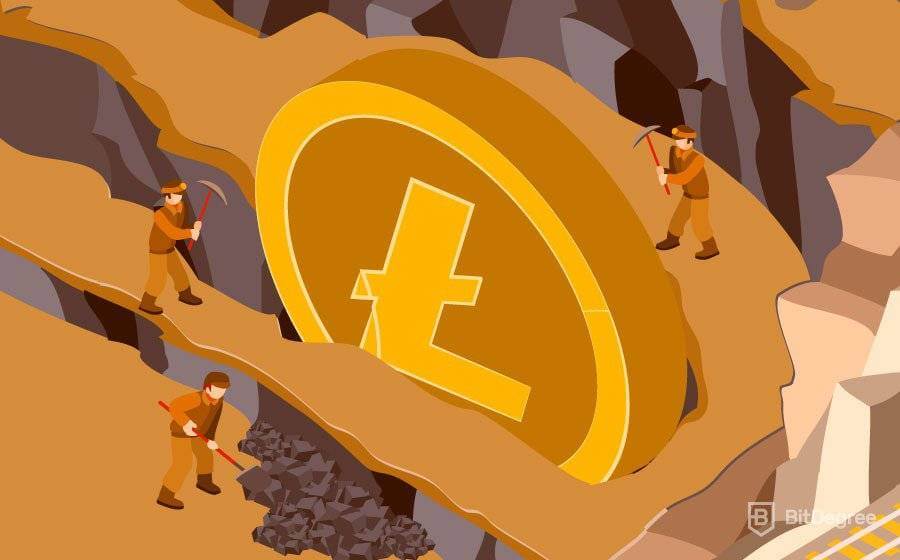
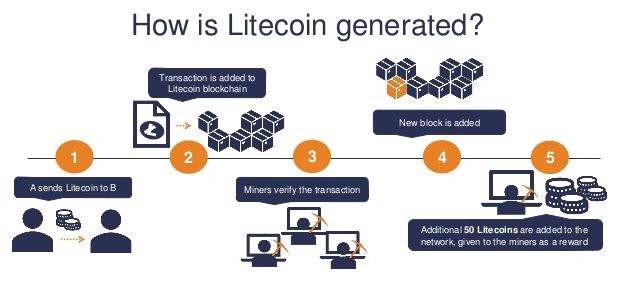
Litecoin was forked from the Bitcoin Core client, and thus bears a lot of resemblance to its ancestor. Nevertheless, some key changes were made to the code to make the network lighter. This involved changing block sizes, adjusting the halving period, increasing total supply, reducing block generation time, and changing the proof-of-work algorithm – all this to improve transaction confirmation time. So, what ultimately makes Litecoin different from Bitcoin is that transactions take a shorter time to complete. 

Historical Performance

Litecoin has had a rather dull timeline. Up until 2017, the crypto’s price barely ever reached $10 and 24-hour trading volumes were consistently below $5 million. For such an old crypto, one would easily deem that performance as dismal. 

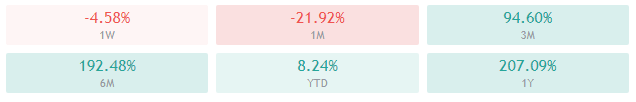
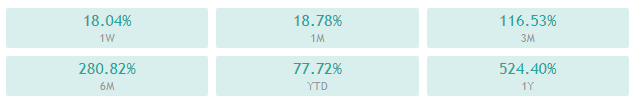
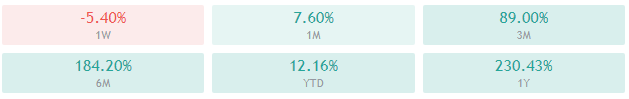
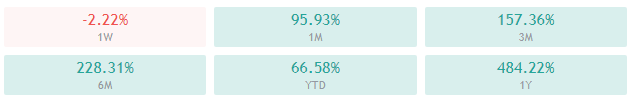
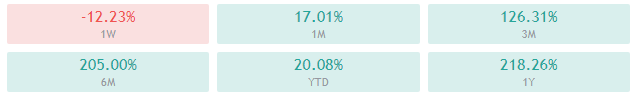
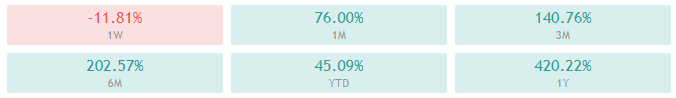
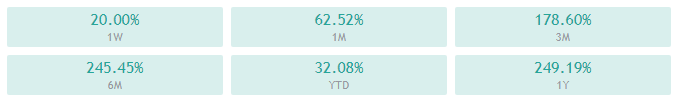
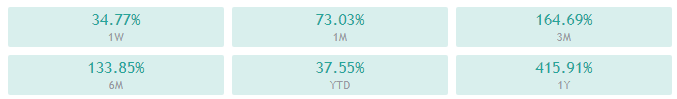
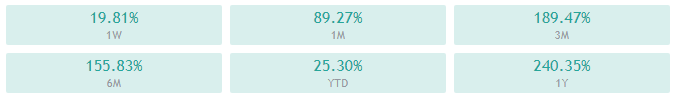
But times change, and so do fortunes. Litecoin presented a completely different outlook in 2017, even before the end-year bull run was in sight. Beginning April that year, the crypto attracted $10 at exchanges for the first time in history. And when the December bull run finally arrived, Litecoin soared to its all-time high of $333. Ever since, the cryptocurrency has been recording impressive performance. Although it has never returned to the December 2017 high, it has equally not declined below $10. 24-hour trading volumes have also been responsive to Litecoin’s growth. From a modest $10 million in 2017, exchanges are reporting volumes of up to $10 billion daily today.

Litecoin’s Future

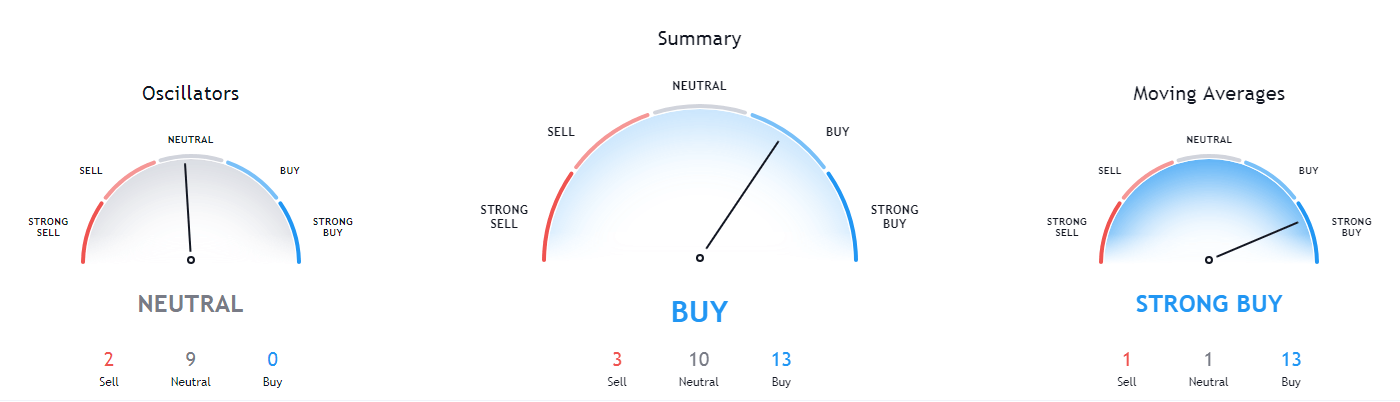
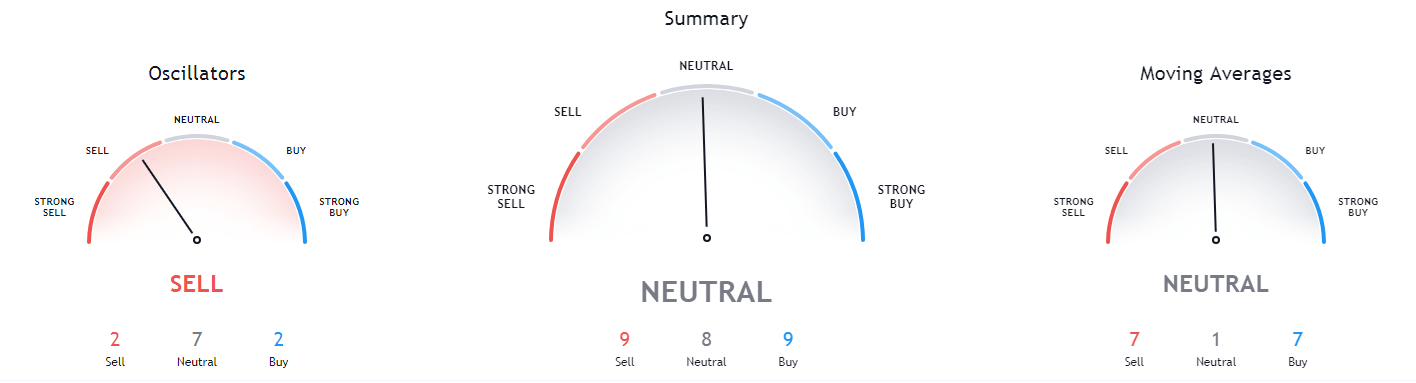
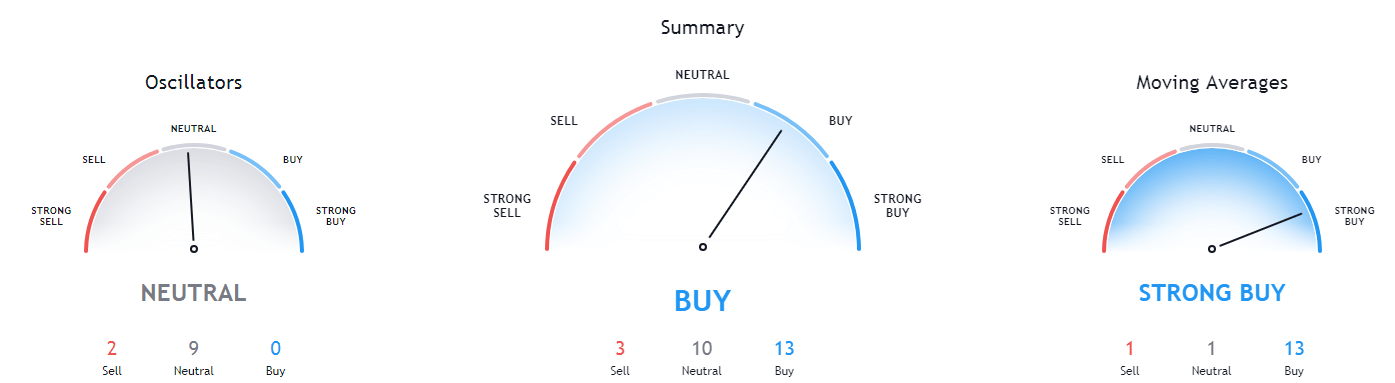
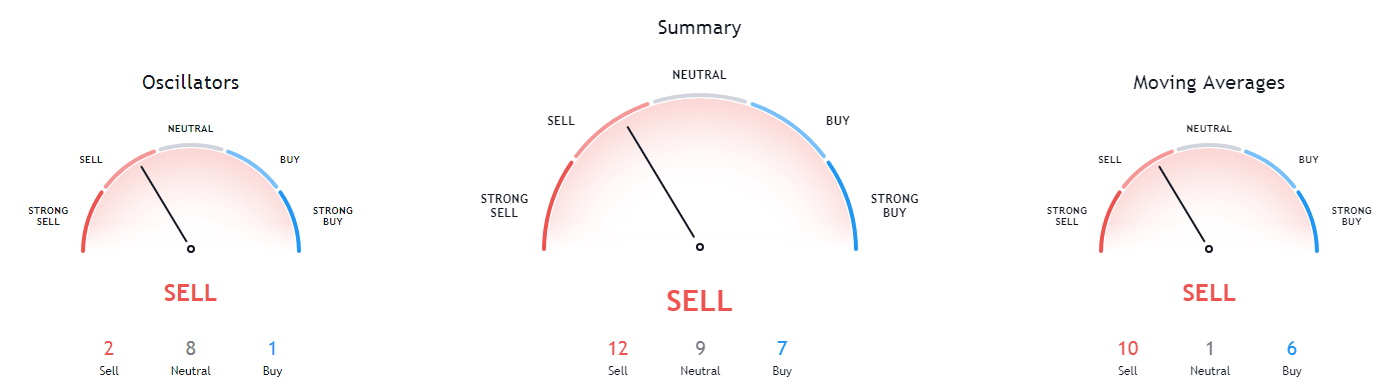
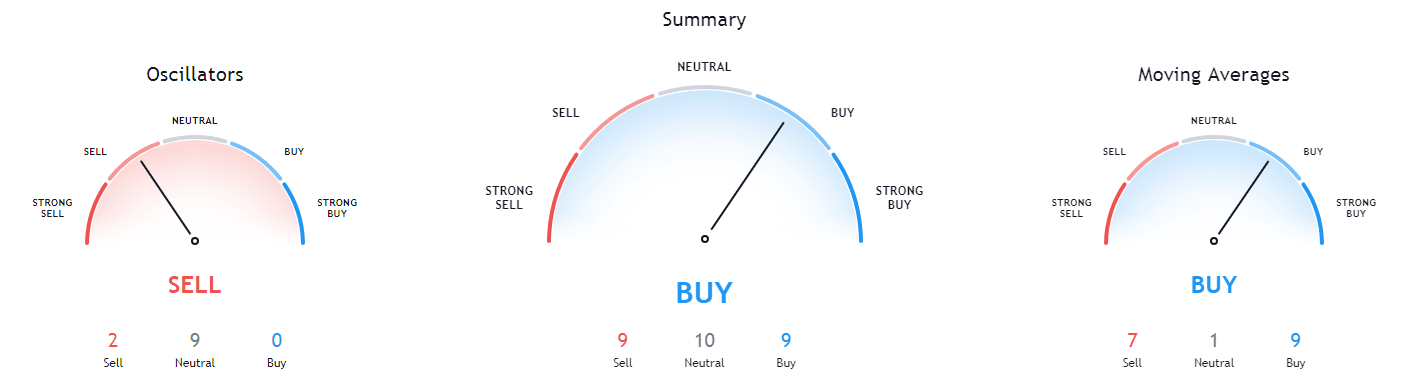
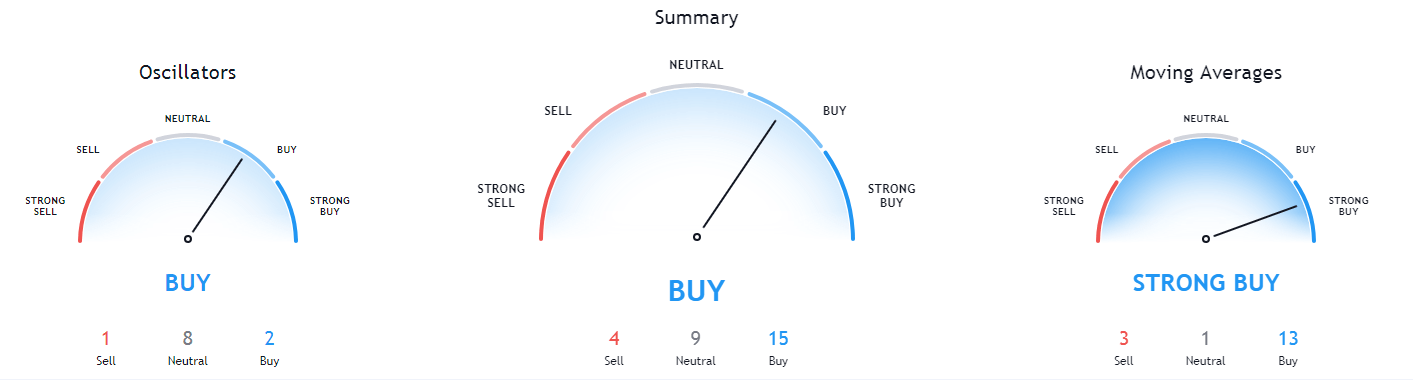
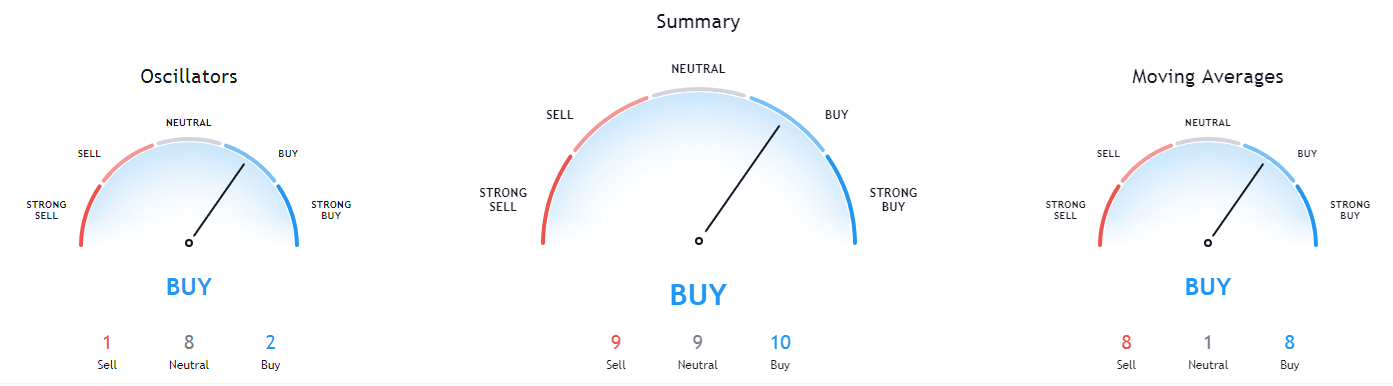
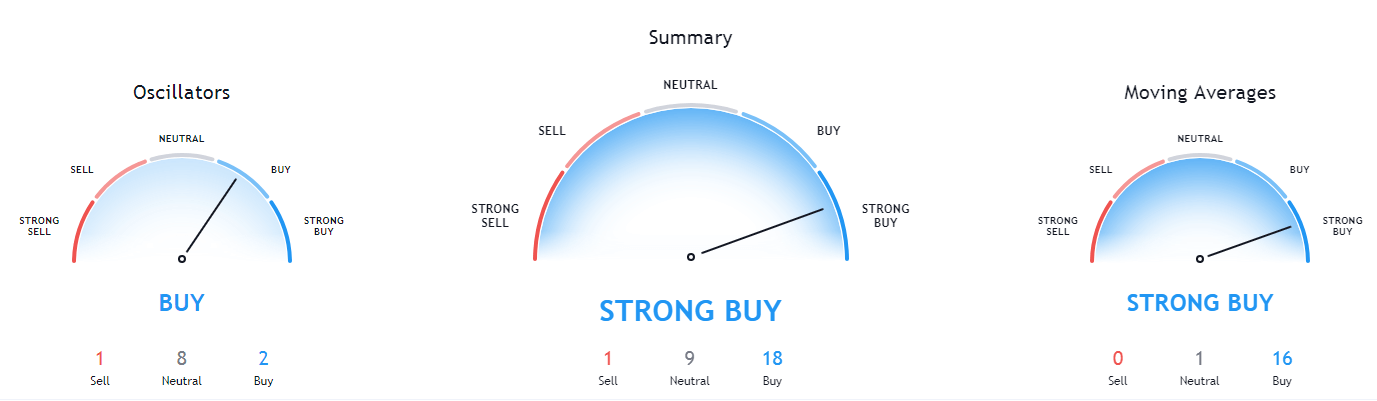
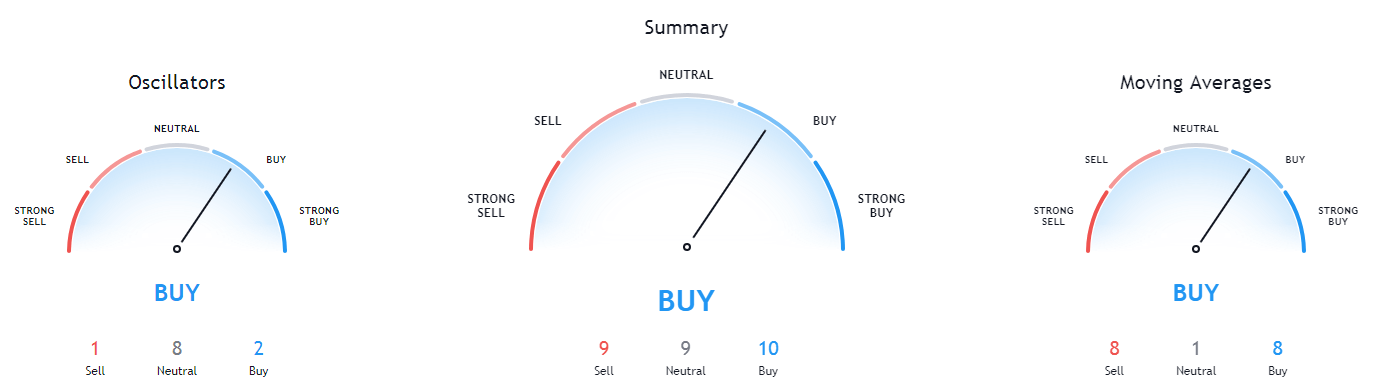
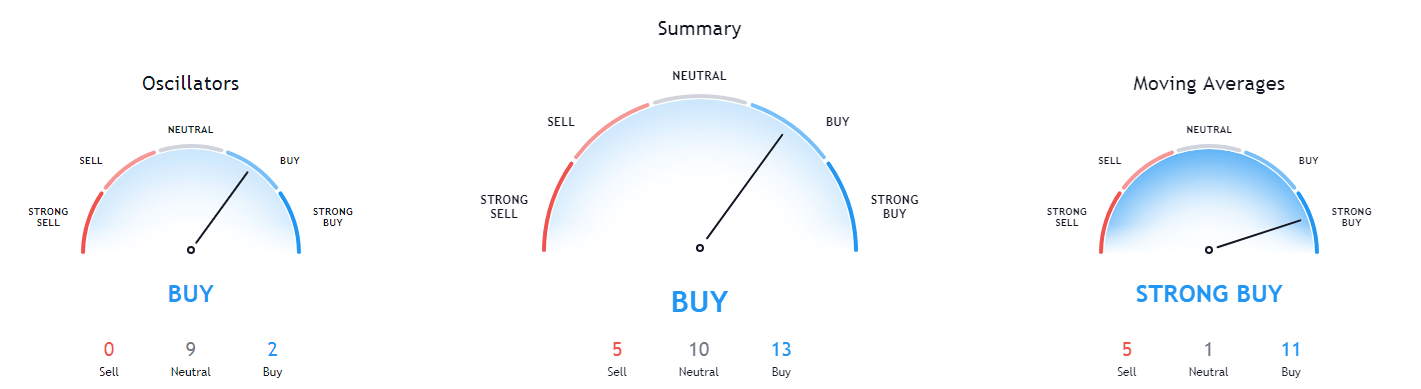
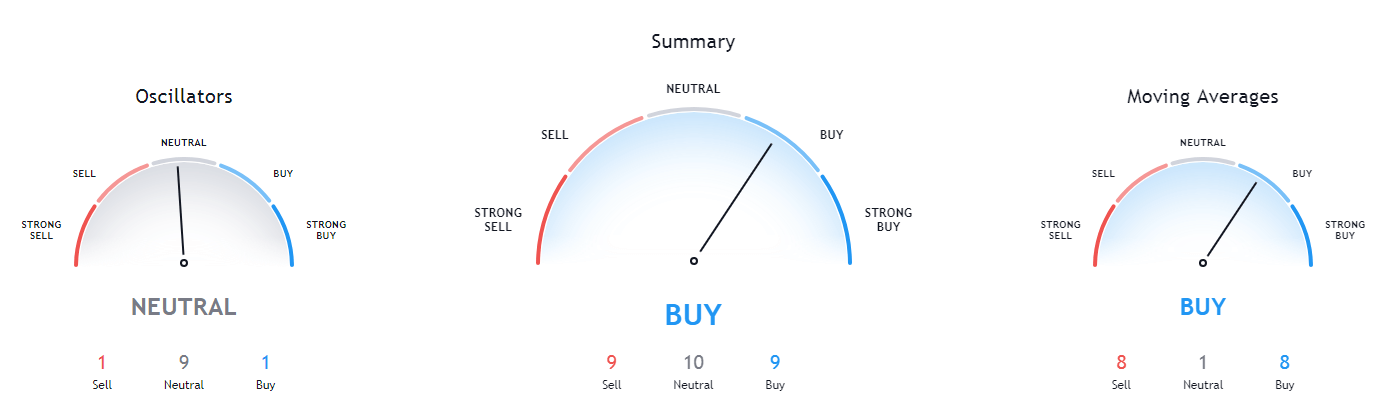
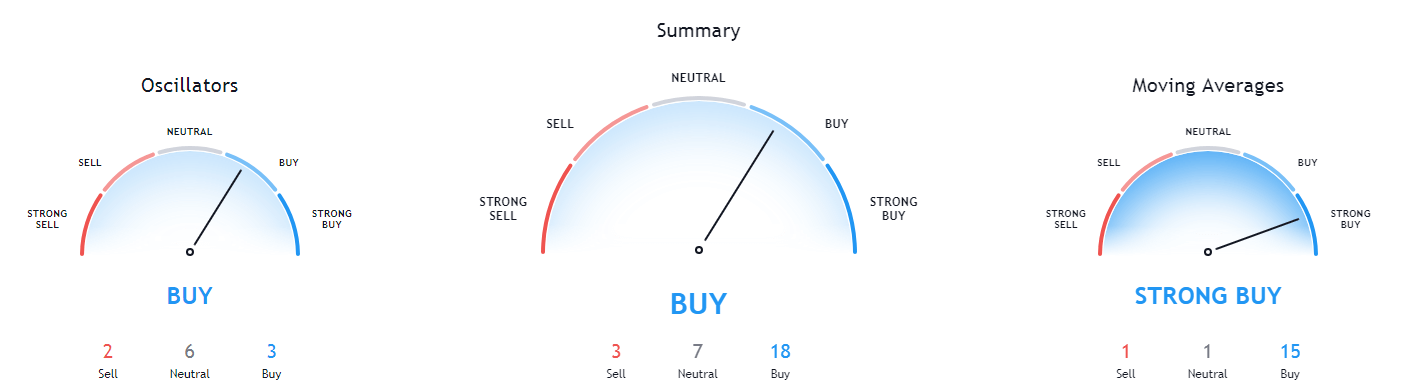
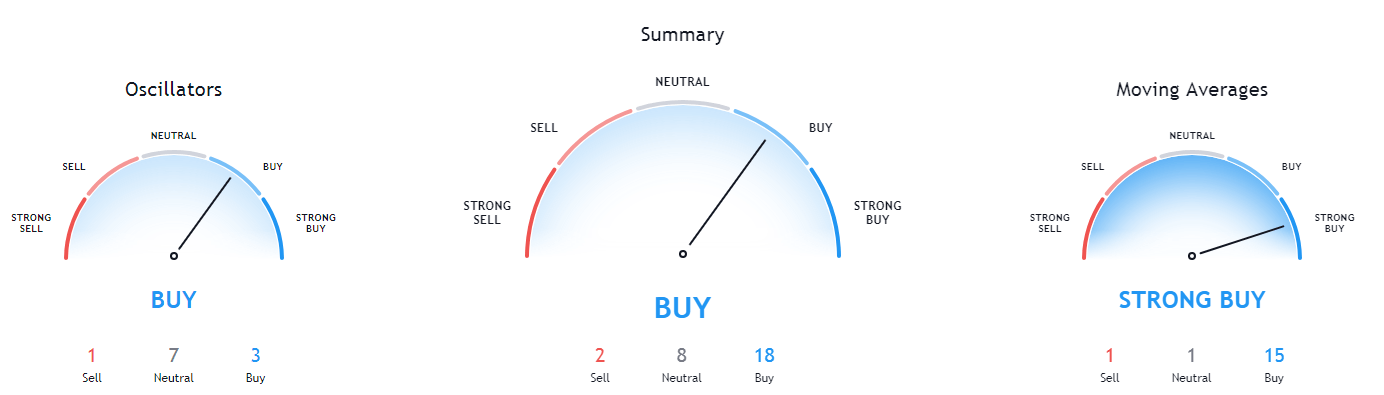
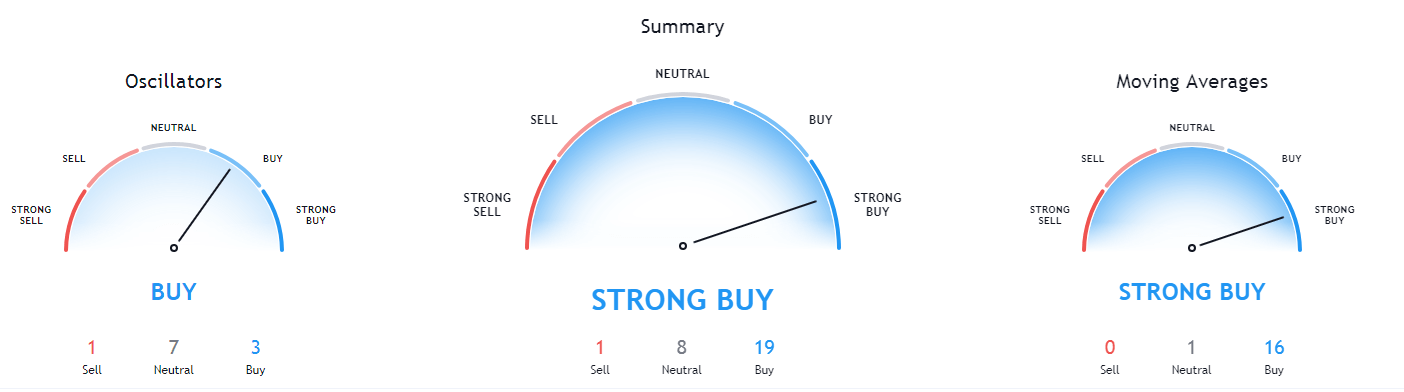
If you’re looking to place your bid on Litecoin for the long term, you’ll probably be more interested in its prospects for the future. We have seen that Litecoin’s performance has been impressive in the past – save for the pre-2017 period. Well, how is the crypto likely to perform in 2021 and beyond? The following insights give a better picture of where crypto is likely to be headed.

  • It has a durable history – For 9 nine years, the crypto has endured both bad and worse times, always clinging on to the top 10 list of best performing cryptocurrencies.
  • Litecoin has had one of the most consistent price patterns. This makes it both suitable for transactions (since its volatility somewhat resembles that of fiat money), and for long-term investment due to its slow but steady growth trend.
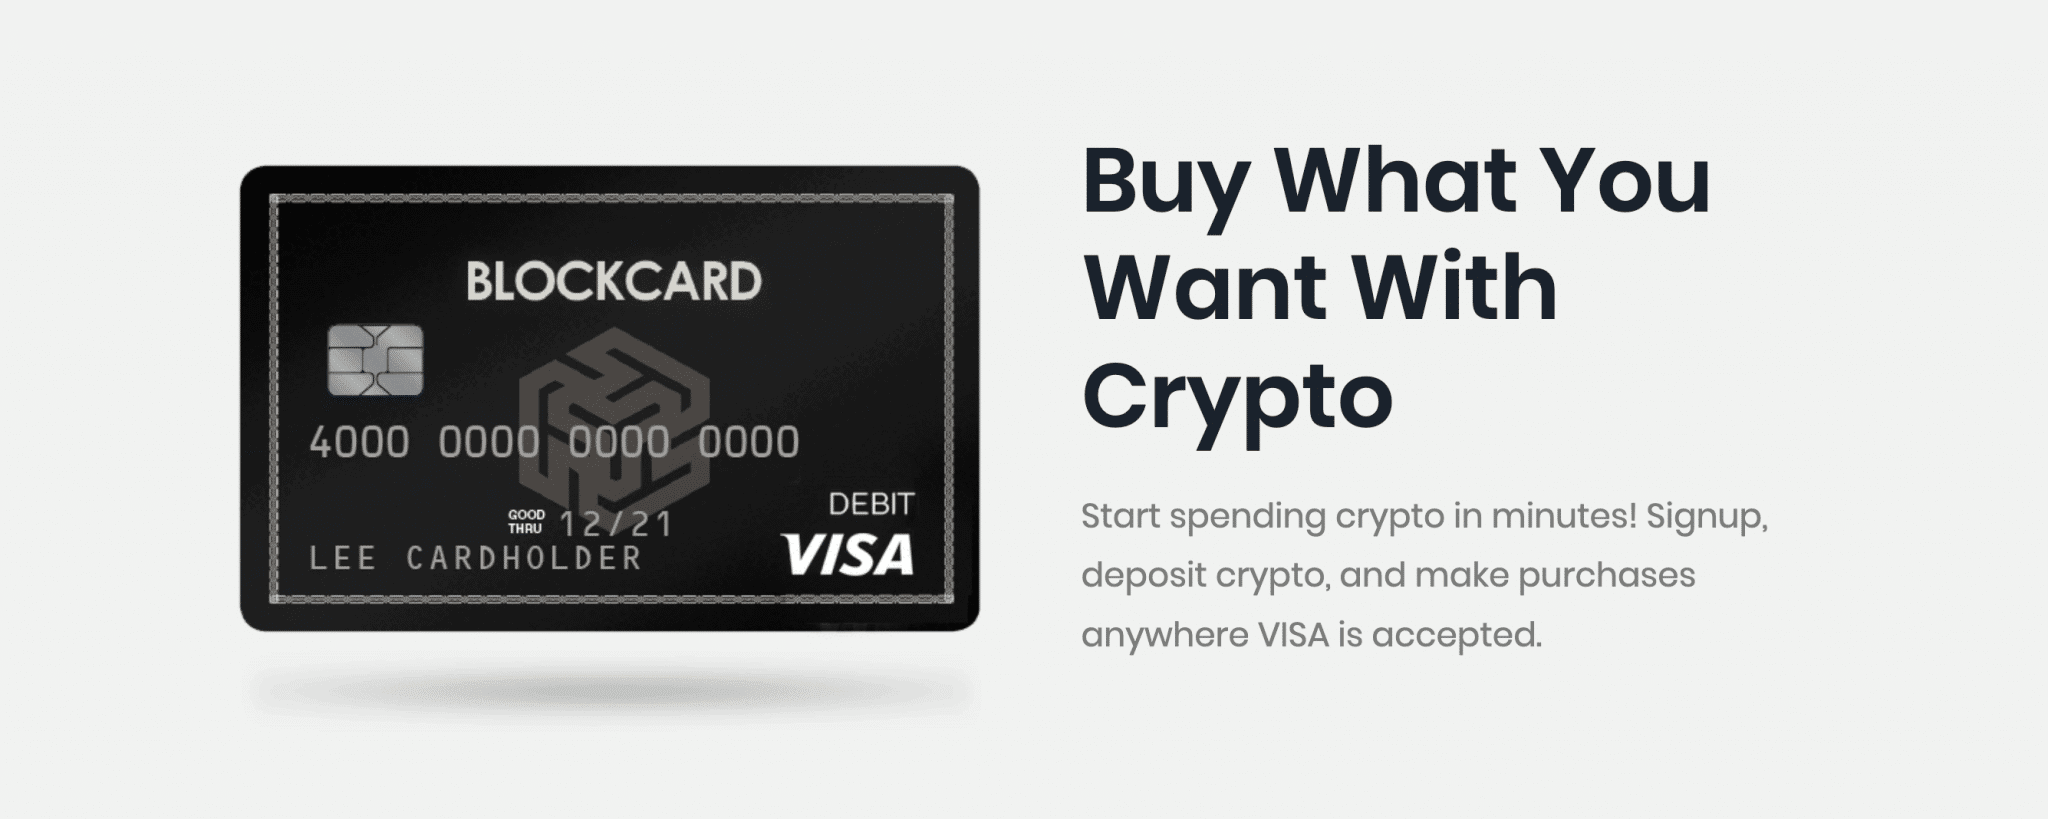
  • The crypto has an active user base and the development of new features is ongoing. This implies that the coin will enjoy increased utility as it continually opens up integrations for mainstream adoption.
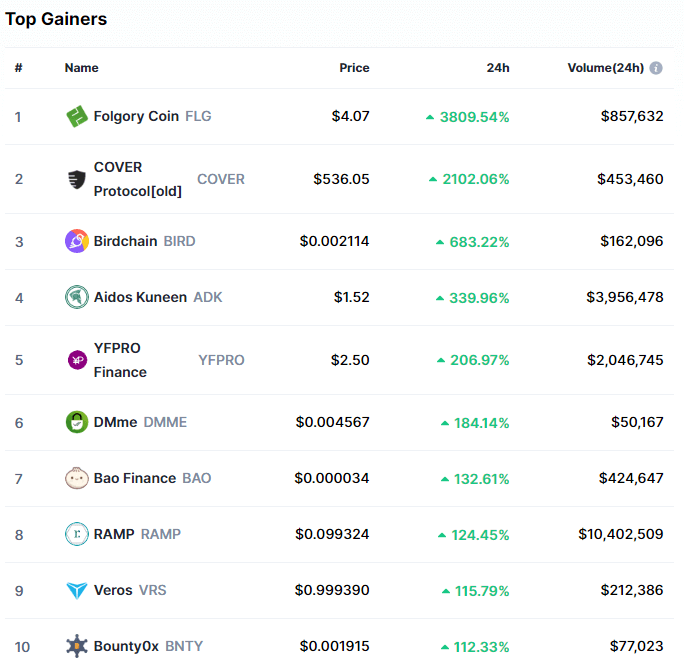
  • The high trading volumes make it increasingly accessible even on smaller exchanges. Thus, investors are assured of high liquidity since it becomes easier to dispose of the asset. 

How to Invest in Litecoin

Investing in Litecoin is not any stranger if you have invested in another crypto before. However, Litecoin’s unique performance profile may make it suitable for certain investments more than others. But which are these?

Typically, crypto investment involves either:

  1. Buy and hold – Where you purchase the crypto and store it in a secure wallet for a long time, with the hope that its value will multiply over the period. 
  2. Trading – Where you buy and sell, and expect to make some profit from price swings. You can either do spot trading (buying at a low and selling whenever you think the price is high enough), or derivatives trading (buying and asking a broker to sell only when the price hits a certain threshold).

Given  Litecoin’s relatively low volatility, both buying and holding and derivatives trading appear suitable. Spot trading is unlikely to yield much because sudden price movements are hardly expected. 

If you choose to buy and hold, you will need secure storage for your coins, preferably, a hardware wallet. You cannot also hold indefinitely. So, you need to plan ahead on how long you intend to hold.

If you choose to go the derivatives trading way, you will need to get a reputable broker such as FXTM or IC Markets. The best part is, these brokers will allow you to trade with demo accounts so you can get a feel of what is like to invest in Litecoin derivatives. 

Pros of Investing in Litecoin

  • During bull runs, the crypto usually experiences explosive surges.
  • Transactions in Litecoin complete way faster than Bitcoin.
  • It has a good track record on the markets.
  • Network fees for Litecoin are typically lower than for other cryptos.

Cons of Investing in Litecoin

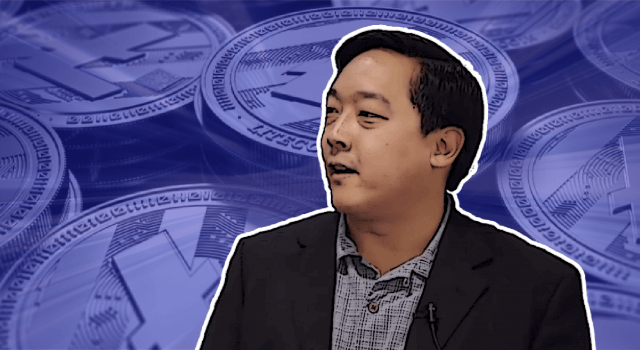
  • Litecoin suffered a reputational injury when its founder Charlie Lee sold off almost all his LTC. Although he claimed the move was aimed at avoiding a potential conflict of interest, the absence of the founder in the project left a shaky reputation.
  • Although LTC is based on Bitcoin, the impact of its halving is insignificant.

Any Foreseeable Risks?

Litecoin has historically presented itself as one of the most stable cryptos but that does not mean it is not a risky asset. By the mere fact that it is a cryptocurrency, it is volatile and its behavior is totally unpredictable. There could be no particular risks in sight. Nevertheless, should you choose to invest in LTC, you might want to follow investment best practices of risk minimization. Do not invest more than you are ready to lose, and try to balance high-risk portfolios with those with lower risk ratings. 

Final Thoughts

Litecoin is one of the oldest cryptocurrencies. It is also arguably among the oldest crypto assets which have been tried and tested by investors. Over the years, the crypto has continued to exhibit stability and consistent price patterns. These characteristics have made LTC a suitable transactional currency. For investors, the lack of volatility has made it difficult to do spot trading. However, long-term investors will see Litecoin as one of the best assets on which to bid their money. Ongoing development plus great community support give a level of assurance that the crypto will continue to rise steadily, albeit slowly, as it has always done. 

Categories
Crypto Market Analysis

Daily Crypto Review, Jan 29 – Dogecoin Skyrockets as r/Wallstreetbets Enters on Crypto; Bitcoin Jumps on Elon Musk’s Twitter Profile

The cryptocurrency space had a wild week, first because of the r/WallStreetBets community entering the market (and pumping Dogecoin’s price by over 1000%) and then because of Tesla’s CEO Elon Musk tweeting about Bitcoin and promoting it. This has, in turn, caused Bitcoin to spike from $31,000 all the way to $38,200 in a matter of one hour. An interesting fact is that Musk’s Twitter bio now has #bitcoin displayed for everyone to see.

The crypto sector ended the day with most of the top cryptocurrencies in the green. Most analysts speculate that the recent wave of buyers came as a result of Dogecoin’s incredible pump, which was caused by the notorious r/WallStreetBets subreddit. Bitcoin is currently trading for $32,964, representing an increase of 5.26% compared to yesterday’s value. Meanwhile, Ethereum’s price has increased by 1.41% on the day, while Litecoin gained 5.11% of its value.

Daily Crypto Sector Heat Map

3X Long Dogecoin Token gained 905.02% in the past 24 hours, making it the most prominent daily crypto gainer by far. It is followed by Dogecoin’s 513.17% and DOGEFI’s 369.90% gain. On the other hand, 3X Short Dogecoin Token lost 99.85%, making it the most prominent daily loser. It is followed by Panda Yield’s loss of 83.13% and Psychic’s loss of 72.46%.

Top 10 24-hour Performers (Click to enlarge)

Bottom 10 24-hour Performers (Click to enlarge)

Bitcoin’s market dominance decreased slightly from when we last reported, currently 62.8%. This represents a 0.1% decrease from our previous report.

Weekly Crypto Market Cap Chart

The cryptocurrency sector’s market capitalization has increased greatly since we last reported, with its current value being $979.02 billion. This represents a $54.27billion increase when compared to our previous report.

_______________________________________________________________________

What happened in the past 24 hours?

_______________________________________________________________________

_______________________________________________________________________

Technical analysis

_______________________________________________________________________

Bitcoin

Bitcoin has spent the day attempting to push its price up as the market turned to green. Its price conquered the $32,350 level and pushed higher without hesitation. The move ended as bulls reached exhaustion near the $34,627 level. BTC’s inability to push past its immediate resistance has triggered a pullback, and the cryptocurrency is now most likely to retest the $32,350 level.

The overall change in market direction today came as a result of (as most speculate) Dogecoin’s insane upswing triggered by r/WallStreetBets.

BTC/USD 1-hour chart

Bitcoin’s technicals on all time-frames are either neutral with a slight hint of bullishness or bullish with a slight hint of neutrality.

BTC/USD 1-day Technicals

Technical factors (1-hour Chart):

  • Price is above its 50-period EMA and at its 21-period EMA
  • Price is at its middle Bollinger band
  • RSI is neutral (51.01)
  • Volume is above average

Key levels to the upside:          Key levels to the downside:

1: $34,627                             1: $32,350

2: $37,445                             2: $30,072

3: $38,000                             3: $27,960

Ethereum

After yesterday’s failed break of the top downtrend line, the second-largest cryptocurrency by market cap pushed past and broke its descending pattern. Its price (at one point) went past the $1,350 level, but as bulls couldn’t confidently hold this level, bears initiated a pullback.

Ethereum’s short-term price direction will be dictated by how the cryptocurrency handles the top downtrend line (which is now a support rather than a resistance line) as well as by Bitcoin’s price direction.

ETH/USD 1-hour Chart

Ethereum’s technicals on all time-frames are bullish but also show a hint of bearishness.

ETH/USD 1-day Technicals

Technical Factors (1-hour Chart):

  • Price is slightly below both its 50-period and its 21-period EMA
  • Price slightly below its middle Bollinger band
  • RSI is neutral (45.66)
  • Volume is average

Key levels to the upside:          Key levels to the downside:

1: $1,350                               1: $1,211

2: $1,420                               2: $1,183.85

3: $1,440                               3: $1047.6

Litecoin

Litecoin has confirmed its position above the $128.4 level after pushing its price above it yesterday. LTC is now in consolidation mode and is currently testing the 21-hour EMA. Its recent moves seem slightly unenthusiastic, meaning that its short-term price direction will most likely be determined by other cryptocurrencies’ movements.

LTC/USD 1-hour Chart

Litecoin’s 4-hour and daily overviews are neutral/bearish, while its weekly and monthly overviews are completely bullish.

LTC/USD 1-day Technicals

Technical factors (1-hour Chart):

  • Its price is slightly above both its 50-period EMA and its 21-period EMA
  • Price slightly above its middle Bollinger band
  • RSI is neutral (55.45)
  • Volume is average

Key levels to the upside:          Key levels to the downside:

1: $142.1                               1: $128.42

2: $161.5                               2: $120

3: $181.3                               3: $114.75

Categories
Crypto Market Analysis

Daily Crypto Review, Jan 28 – Bitcoin Strong Bounce off the 30K level, Altcoins Reversals Followed

The crypto sector ended up almost completely in the red, though most cryptos barely lost any value. Bitcoin is currently trading for $31,200, representing a decrease of 1.13% compared to yesterday’s value. Meanwhile, Ethereum’s price has decreased by 0.95% on the day, while LTC lost 2.06% of its value.

Daily Crypto Sector Heat Map

Zero Collateral Dai gained 828.50% in the past 24 hours, making it the most prominent daily crypto gainer by far. It is followed by QuadrantProtocol’s 327.68% and 3x Long Dogecoin Token’s 137.80% gain. On the other hand, EveryCoin lost 89.97%, making it the most prominent daily loser. It is followed by Zugacoin’s loss of 79.94% and TokenPay’s loss of 50.46%.

Top 10 24-hour Performers (Click to enlarge)

Bottom 10 24-hour Performers (Click to enlarge)

Bitcoin’s market dominance decreased slightly from when we last reported, currently 62.9%. This represents a 0.2% decrease from our previous report.

Weekly Crypto Market Cap Chart

The cryptocurrency sector’s market capitalization has decreased very slightly since we last reported, with its current value being $924.75 billion. This represents a $10.78 billion decrease when compared to our previous report.

_______________________________________________________________________

What happened in the past 24 hours?

_______________________________________________________________________

_______________________________________________________________________

Technical analysis

_______________________________________________________________________

Bitcoin


After another day of its price moving towards the downside, Bitcoin attempted a rally towards the $32,350 mark. After its price establishing strong support at the $30,000 level, the largest cryptocurrency by market cap started surging. There is a strong chance that BTC will pass the $32,350 level if the hourly candle ends up above the 21-hour EMA.

Scott Minerd, the CIO of investment services firm Guggenheim, said that the institutional demand is insufficient to keep BTC above $30,000. Many analysts agree with this short-term assessment, while almost all of them are bullish in the long-term.

BTC/USD 1-hour chart

Bitcoin’s daily overview is mostly neutral (with some hints of bearishness), while its weekly and monthly overviews are tilted towards the buy-side. On the other hand, its 4-hour time-frame is completely bearish.

BTC/USD 1-day Technicals

Technical factors (1-hour Chart):

  • Price is above its 50-period EMA and its 21-period EMA
  • Price is slightly above its middle Bollinger band
  • RSI is neutral (56.39)
  • Volume is above average

Key levels to the upside:          Key levels to the downside:

1: $32,350                             1: $30,072

2: $34,627                             2: $30,000

3: $37,445                             3: $27,960

Ethereum

The second-largest cryptocurrency by market cap spent the day testing the $1,211 level multiple times. After the support level held up on various occasions, ETH bulls entered the market and started pushing its price up. However, it is still uncertain whether this push towards the upside will end as another lower high and a continuation of the downtrend, or a break from the trend.

Ethereum’s immediate downside is guarded by the 21-hour and 50-hour EMAs, while its first major resistance level is the $1,350 mark, as well as the descending line that connects ETH’s recent lower highs.

ETH/USD 1-hour Chart

Ethereum’s technicals on the daily, weekly, and monthly time-frames are tilted towards the buy-side but also show some neutrality. Its 4-hour overview, however, is slightly bearish.

ETH/USD 1-day Technicals

Technical Factors (1-hour Chart):

  • Price is above both its 50-period and its 21-period EMA
  • Price at its top Bollinger band
  • RSI is neutral (57.04)
  • Volume is average

Key levels to the upside:          Key levels to the downside:

1: $1,350                               1: $1,211

2: $1,420                               2: $1,183.85

3: $1,440                               3: $1047.6

Litecoin

Litecoin managed to break out from its downtrend after breaking the $128.4 mark. What’s surprising is that such a strong trend was broken by just average volume. LTC found support in the 21-hour EMA, which currently stands right below the price level.

Litecoin has a zone of heavy resistance straight above it (above $130). It is very unlikely that it can “survive” without a major boost in volume, especially in these market conditions.

LTC/USD 1-hour Chart

Litecoin’s daily overview is mostly neutral (with some hints of bearishness), while its weekly and monthly overviews are tilted towards the buy-side. On the other hand, its 4-hour time-frame is completely bearish.

LTC/USD 1-day Technicals

Technical factors (1-hour Chart):

  • Its price is above both its 50-period EMA and its 21-period EMA
  • Price at its top Bollinger band
  • RSI is neutral (58.51)
  • Volume is average

Key levels to the upside:          Key levels to the downside:

1: $142.1                               1: $128.42

2: $161.5                               2: $120

3: $181.3                               3: $114.75

Categories
Crypto Market Analysis

Daily Crypto Review, Jan 27 – Bitcoin (BTC), Ethereum (ETH), Litecoin (LTC) Price Analysis

The crypto sector ended up either slightly red or slightly green, with only rare exceptions making significant moves to either side. Bitcoin is currently trading for $31,679, representing an increase of 0.51% compared to yesterday’s value. Meanwhile, Ethereum’s price has decreased by 1.61% on the day, while LTC lost 3.33% of its value.

Daily Crypto Sector Heat Map

Coupon Chain gained 74575.19% in the past 24 hours, making it the most prominent daily crypto gainer by far. It is followed by YVS.Finance’s 683.5% and Chonk’s 198.23% gain. On the other hand, Narwhale.finance lost 72.98%, making it the most prominent daily loser. It is followed by 3X Short Matic Token’s loss of 67.68% and MangoChain’s loss of 66.24%.

Top 10 24-hour Performers (Click to enlarge)

Bottom 10 24-hour Performers (Click to enlarge)

Bitcoin’s market dominance increased slightly from when we last reported, currently 63.1%. This represents a 0.2% increase from our previous report.

Weekly Crypto Market Cap Chart

The cryptocurrency sector’s market capitalization has decreased very slightly since we last reported, with its current value being $935.58 billion. This represents a $0.96 billion decrease when compared to our previous report.

_______________________________________________________________________

What happened in the past 24 hours?

_______________________________________________________________________

_______________________________________________________________________

Technical analysis

_______________________________________________________________________

Bitcoin

After a day of attempting to break out of its slightly descending channel, Bitcoin has returned to the downtrend. The largest cryptocurrency by market cap tried to regain the $32,350 level but failed in doing so. This created a strong sell-wall above its current price of just below $32,000.

Bitcoin’s immediate upside is guarded by the 21-hour and 50-hour EMAs, as well as the 32,350 level. Its downside, however, is a free-fall until the zone above $30,000.

BTC/USD 1-hour chart

Bitcoin’s daily overview is mostly neutral (with some hints of bearishness), while its weekly and monthly overviews are slightly bullish. On the other hand, its 4-hour time-frame is completely bearish.

BTC/USD 1-day Technicals

Technical factors (1-hour Chart):

  • Price is slightly below its 50-period EMA and its 21-period EMA
  • Price is slightly under its middle Bollinger band
  • RSI is neutral (46.41)
  • Volume is average

Key levels to the upside:          Key levels to the downside:

1: $32,350                             1: $30,072

2: $34,627                             2: $30,000

3: $37,445                             3: $27,960

Ethereum

The second-largest cryptocurrency by market cap returned to mirroring Bitcoin’s movement after entering its consolidation phase. Ethereum has, after failing to break the $1,350 level, returned to its slightly-downwards movement. The zone just above the $1,300 level mentioned yesterday was also broken, meaning that ETH is now trading between $1,211 to the downside and $1,350 to the upside.

Ethereum’s immediate upside is guarded by the 21-hour and 50-hour EMAs, as well as the $1,350 level. Its first major support level is sitting at $1,211.

ETH/USD 1-hour Chart

Ethereum’s technicals on the daily, weekly, and monthly time-frames are tilted towards the buy-side, but all have neutral oscillators. Its 4-hour overview, however, is completely neutral.

ETH/USD 1-day Technicals

Technical Factors (1-hour Chart):

  • Price is slightly below both its 50-period and its 21-period EMA
  • Price slightly below its middle Bollinger band
  • RSI is neutral (46.02)
  • Volume is average

Key levels to the upside:          Key levels to the downside:

1: $1,350                               1: $1,211

2: $1,420                               2: $1,183.85

3: $1,440                               3: $1047.6

Litecoin

Litecoin has seemingly created a double bottom formation after hitting and staying above the $128.4 level twice. This may be a bullish signal for LTC traders, but the move needs to be accompanied by at least a slight increase in volume.

Despite creating a double bottom, LTC will have a hard time moving past the 21-hour and 50-hour EMAs, as they seem to be its immediate resistance levels. On the other hand, its $128.4 support level is holding up well for now, making it very uncertain where LTC will go in the short-term.

LTC/USD 1-hour Chart

Litecoin’s daily overview is mostly neutral (with some hints of bearishness), while its weekly and monthly overviews are slightly bullish. On the other hand, its 4-hour time-frame is completely bearish.

LTC/USD 1-day Technicals

Technical factors (1-hour Chart):

  • Its price is below both its 50-period EMA and its 21-period EMA
  • Price slightly below its middle Bollinger band
  • RSI is neutral (41.89)
  • Volume is slightly below average

Key levels to the upside:          Key levels to the downside:

1: $142.1                               1: $128.42

2: $161.5                               2: $120

3: $181.3                               3: $114.75

Categories
Crypto Market Analysis

Daily Crypto Review, Jan 26 – Blood on the Streets: Crypto Market in the Red

The crypto sector ended up almost completely in the red as most cryptocurrencies pulled back to lower levels. Bitcoin is currently trading for $31,575, representing a decrease of 5.26% compared to yesterday’s value. Meanwhile, Ethereum’s price has decreased by 7.24% on the day, while LTC lost 6.79% of its value.

Daily Crypto Sector Heat Map

EveryCoin gained 501.69% in the past 24 hours, making it the most prominent daily crypto gainer by far. It is followed by BBYS’s 280.04% and X Infinity’s 255.24% gain. On the other hand, ARTH lost 61.58%, making it the most prominent daily loser. It is followed by Typhoon Cash’s loss of 44.07% and Aventus’s loss of 40.31%.

Top 10 24-hour Performers (Click to enlarge)

Bottom 10 24-hour Performers (Click to enlarge)

Bitcoin’s market dominance increased slightly from when we last reported, with its value currently being 62.9%. This represents a 0.2% increase from our previous report.

Weekly Crypto Market Cap Chart

The cryptocurrency sector’s market capitalization has decreased greatly since we last reported, with its current value being $936.54 billion. This represents a $54.92billion decrease when compared to our previous report.

_______________________________________________________________________

What happened in the past 24 hours?

_______________________________________________________________________

_______________________________________________________________________

Technical analysis

_______________________________________________________________________

Bitcoin

Bitcoin’s gains in the past two days were taken away when bears took over the market after BTC failed to break the $34,627 mark. The cryptocurrency declined to the $32,350 level but quickly lost hold of it as well. BTC is currently hovering right above the $31,000 mark.

Bitcoin’s 1-hour RSI is getting dangerously close to the oversold territory, while its volume is descending, indicating a possible price stagnation or a direction reversal.

BTC/USD 1-hour chart

Bitcoin’s daily overview is completely neutral, while its weekly and monthly overviews are completely bullish. On the other hand, the 4-hour time-frame is completely bearish.

BTC/USD 1-day Technicals

Technical factors (1-hour Chart):

  • Price is below its 50-period EMA and its 21-period EMA
  • Price is close to its bottom Bollinger band
  • RSI is near the oversold area (31.21)
  • Volume is average

Key levels to the upside:          Key levels to the downside:

1: $32,350                             1: $30,072

2: $34,627                             2: $30,000

3: $37,445                             3: $27,960

Ethereum

The second-largest cryptocurrency by market cap spent the day retracing after posting a new all-time high at $1,477.30. ETH tested many levels but ultimately fell below the previous all-time high, and then the $1,420 and $1,350 levels as well. It is currently consolidating just above $1,300.

Ethereum seemingly created a zone of support just above the $1,300 level, which is holding up for 10 hours now. If this support holds long enough for BTC to change its price direction (or at least enter a sideways trading period), we may see ETH bulls reentering the market once again.

ETH/USD 1-hour Chart

Ethereum’s technicals on all time-frames are slightly tilted towards the buy-side, with its oscillators taking a more neutral stance.

ETH/USD 1-day Technicals

Technical Factors (1-hour Chart):

  • Price is below both its 50-period and its 21-period EMA
  • Price near its bottom Bollinger band
  • RSI is very close to being oversold (39.73)
  • Volume is average

Key levels to the upside:          Key levels to the downside:

1: $1,350                               1: $1,211

2: $1,420                               2: $1,183.85

3: $1,440                               3: $1047.6

Litecoin

Litecoin has lost all of the gains it made yesterday, and then some. The eighth-largest cryptocurrency by market cap failed to pass the zone just under $150, which triggered a pullback and a dip below the $142.1 support (now resistance) level. On top of that, LTC also fell below the trading range it was in for the previous four days (excluding yesterday’s push).

LTC/USD 1-hour Chart

Litecoin’s short-term and long-term overviews have opposing stances: while its 4-hour and overviews show a slight tilt towards the sell-side, its weekly and monthly overviews are slightly bullish.

LTC/USD 1-day Technicals

Technical factors (1-hour Chart):

  • Its price is below its 50-period EMA and its 21-period EMA
  • Price slightly above its bottom Bollinger band
  • RSI is close to being in the oversold territory (33.05)
  • Volume is average

Key levels to the upside:          Key levels to the downside:

1: $142.1                               1: $128.42

2: $161.5                               2: $120

3: $181.3                               3: $114.75

Categories
Crypto Market Analysis

Daily Crypto Review, Jan 25 – Ethereum Reaches a new All-Time High: What’s Next?

The crypto sector ended up mostly in the green as altcoins pushed up (while Bitcoin remained mostly stable). Several cryptocurrencies reached new all-time highs, including Ethereum and Aave. Bitcoin is currently trading for $33,335, representing an increase of 1/59% compared to yesterday’s value. Meanwhile, Ethereum’s price has increased by 7.93% on the day, while LTC gained 2.12% of its value.

Daily Crypto Sector Heat Map

Foglory Coin gained 389.19% in the past 24 hours, making it the most prominent daily crypto gainer by far. It is followed by Unifty’s 187.19% and MileVerse’s 160.11% gain. On the other hand, EveryCoin lost 76.45%, making it the most prominent daily loser. It is followed by Zloadr’s loss of 62.48% and FUTUREXCRYPTO’s loss of 54.1%.

Top 10 24-hour Performers (Click to enlarge)

Bottom 10 24-hour Performers (Click to enlarge)

Bitcoin’s market dominance dropped further from when we last reported, with its value currently being 62.7%. This represents a 2.1% decrease from our previous report.

Weekly Crypto Market Cap Chart

The cryptocurrency sector’s market capitalization has increased greatly since we last reported, with its current value being $991.66 14.56 billion. This represents a $77.10 billion increase when compared to our previous report.

_______________________________________________________________________

What happened in the past 24 hours?

_______________________________________________________________________

_______________________________________________________________________

Technical analysis

_______________________________________________________________________

Bitcoin

Bitcoin has spent the weekend with its price slowly descending towards the $30,000 mark until a new surge of buyers changed the price direction. BTC has bounced from the $30,900 level and pushed up past the $33,250 level. Its price is currently consolidating in the $33,400 zone.

Bitcoin’s upside is guarded not only by the $34,627 level but the recent high of $33,865. Traders will have to be careful when taking long positions on BTC and will have to devote most of the time checking the order flow to properly gauge the resistance levels.

BTC/USD 1-hour chart

Bitcoin’s 4-hour and weekly overviews are bullish and show some signs of neutrality or bearishness, while its monthly overview is completely bullish. On the other hand, its daily time-frame is pretty neutral.

BTC/USD 1-day Technicals

Technical factors (1-hour Chart):

  • Price is slightly above its 50-period EMA and its 21-period EMA
  • Price is close to its top Bollinger band
  • RSI is near the overbought area (64.47)
  • Volume is slightly below average

Key levels to the upside:          Key levels to the downside:

1: $34,627                             1: $32,350

2: $37,445                             2: $30,072

3: $38,000                             3: $27,960

Ethereum

The second-largest cryptocurrency by market cap “decoupled” from Bitcoin and pushed up, surging to its all-time highs and briefly creating a new one at $1,477.3. Ether is currently fighting to stay above $140 and enter the price discovery mode yet again.

Ethereum has quite a lot of support levels right beneath its current price, most notably the $1,440, $1,420, and $1,350 levels. Its upside levels past the all-time high will, however, have to be determined by drawing Fib retracement levels.

ETH/USD 1-hour Chart

Ethereum’s technicals on the 4-hour, daily, and weekly time-frames are bullish and show some signs of neutrality or bearishness, while its monthly overview is completely bullish.

ETH/USD 1-day Technicals

Technical Factors (1-hour Chart):

  • Price is above both its 50-period and its 21-period EMA
  • Price near its top Bollinger band
  • RSI is very close to being overbought (68.27)
  • Volume is above average

Key levels to the upside:          Key levels to the downside:

1: $1,440                               1: $1,420

2: $1,477.3                            2: $1,350

3: $1,500                               3: $1,211

Litecoin

Litecoin’s weekend went without much price fluctuation, with LTC moving between $133 and $143.5. However, LTC bulls managed to push past the $142.1 level and bring its price to $145, where it is now consolidating. Litecoin’s volume also surged during the price increase.

Litecoin traders will have to pay attention to several factors, including LTC technicals, Bitcoin price movement as well as Ethereum price movement.

LTC/USD 1-hour Chart

Litecoin’s overviews on all time-frames are bullish, with its 4-hour, daily, and weekly time-frames having some signs of neutrality, while its monthly overview is completely bullish.

LTC/USD 1-day Technicals

Technical factors (1-hour Chart):

  • Its price is slightly above its 50-period EMA and its 21-period EMA
  • Price slightly above its middle Bollinger band
  • RSI is neutral (63.36)
  • Volume is slightly above average

Key levels to the upside:          Key levels to the downside:

1: $161.5                               1: $142.1

2: $181.3                               2: $128.42

3: $186.3                               3: $120

Categories
Crypto Market Analysis

Daily Crypto Review, Jan 22 – Bitcoin Briefly Drops Below $30K; Market Sees Blood on the Streets

The crypto sector ended up almost completely in the red as Bitcoin’s drop below $30,000 (at one point) led the market down. Bitcoin is currently trading for $31,730, representing a decrease of 8.41% compared to yesterday’s value. Meanwhile, Ethereum’s price has decreased by 11.29% on the day, while LTC lost 4.76% of its value.

Daily Crypto Sector Heat Map

EveryCoin gained 734.83% in the past 24 hours, making it the most prominent daily crypto gainer by far. It is followed by Vox.Finance’s 132.94% and DACC’s 129.86% gain. On the other hand, PegsShares lost 99.20%, making it the most prominent daily loser. It is followed by Mithril Share’s loss of 75.17% and Chimpion’s loss of 59.53%.

Top 10 24-hour Performers (Click to enlarge)

Bottom 10 24-hour Performers (Click to enlarge)

Bitcoin’s market dominance stayed at the same spot as when we last reported, with its value currently being 64.8%.

Weekly Crypto Market Cap Chart

The cryptocurrency sector’s market capitalization has decreased greatly since we last reported, with its current value being $914.56 billion. This represents a $10.97 billion decrease when compared to our previous report.

_______________________________________________________________________

What happened in the past 24 hours?

_______________________________________________________________________

_______________________________________________________________________

Technical analysis

_______________________________________________________________________

Bitcoin

Bitcoin has had a horrible day as bears took over the market. Its price dropped to as low as $28,800, but found support in its 50-day EMA. The downturn, however, means that the largest-cryptocurrency by market cap fell out of its triangle formation, most likely spelling a start of a short-term downtrend or sideways trading phase.

Bitcoin is very unpredictable at the moment, but traders could find an opportunity in looking for drastic volume increases and “catch the wave” of buyers or sellers (while taking into account all the support and resistance levels).

BTC/USD 1-hour chart

Bitcoin’s weekly and monthly time-frames are bullish but show some signs of neutrality or bearishness. On the other hand, its 4-hour and daily time-frames are completely bearish.

BTC/USD 1-day Technicals

Technical factors (1-hour Chart):

  • Price is slightly below its 50-period EMA and at its 21-period EMA
  • Price is at its middle Bollinger band
  • RSI is neutral after returning from being oversold (48.04)
  • Volume is above average

Key levels to the upside:          Key levels to the downside:

1: $32,350                             1: $30,072

2: $34,627                             2: $30,000

3: $37,445                             3: $27,960

Ethereum

The second-largest cryptocurrency by market cap followed Bitcoin’s direction, but with slightly less intensity. Ether’s price dropped below the $1,211 and $1,183.85 levels and found support in the $1,047.6 level. However, the bounce that came after the bulls came into the market was insufficient to break the $1,183.85 level, and Ethereum’s price is now trading just below it.

The $1,183.85 level could be considered a pivot point, and ETH’s short-term price direction will greatly depend on whether bulls manage to break this resistance.

ETH/USD 1-hour Chart

Ethereum’s technicals are still mostly tilted towards the buy-side, with its longer time-frames (weekly and monthly) being completely bullish, while its daily time frame’s oscillators are pointing to the sell-side. On the other hand, its 4-hour time-frame is completely bearish.

ETH/USD 1-day Technicals

Technical Factors (1-hour Chart):

  • Price is below its 50-period and at its 21-period EMA
  • Price is at its middle Bollinger band
  • RSI is neutral (45.02)
  • Volume is above average

Key levels to the upside:          Key levels to the downside:

1: $1,183.85                          1: $1047.5

2: $1,211                              2: $960.5

3: $1,350                             3: $932.5

Litecoin

Litecoin’s movement in the past 24 hours much resembled Ethereum, with its price dropping below the $142.1 level and finding support slightly below the $128.4 level. While its push up did not reach the now-resistance level of $142.1, Litcoin did find support in the 21-hour EMA.

Litecoin’s volume increase in recent hours is negligible compared to the increase that Bitcoin and Ethereum saw. This may indicate less intensity in the moves to come, regardless of the price direction.

LTC/USD 1-hour Chart

Litecoin’s weekly and monthly time-frames are completely bullish and but show no signs of neutrality or bearishness. On the other hand, its 4-hour and daily time-frames are completely bearish.

LTC/USD 1-day Technicals

Technical factors (1-hour Chart):

  • Its price is slightly below its 50-period EMA and slightly above its 21-period EMA
  • Price slightly above its middle Bollinger band
  • RSI is neutral (51.31)
  • Volume is slightly above average

Key levels to the upside:          Key levels to the downside:

1: $142.1                               1: $128.42

2: $161.5                               2: $120

3: $181.3                               3: $114.75

Categories
Crypto Market Analysis

Daily Crypto Review, Jan 21 – BTC in a Triangle Formation – What do the Analysts Say?

The crypto sector was split between slight gainers and slight losers, but overall lost some value as the market cap dropped below $1 trillion. Bitcoin is currently trading for $34,644, representing a decrease of 2.39% compared to yesterday’s value. Meanwhile, Ethereum’s price has decreased by 4.12% on the day, while LTC lost 5.41% of its value.

Daily Crypto Sector Heat Map

Cocos-BCX gained 107983.76% in the past 24 hours, making it the most prominent daily crypto gainer by far. It is followed by HAPY Coin’s 383.49% and Vox.Finance’s 371.42% gain. On the other hand, PegsShares lost 59.35%, making it the most prominent daily loser. It is followed by KIMCHI.finance’s loss of 44.21% and EveryCoin’s loss of 34.88%.

Top 10 24-hour Performers (Click to enlarge)

Bottom 10 24-hour Performers (Click to enlarge)

Bitcoin’s market dominance has moved down slightly since our last report as altcoins started to outperform, with its value currently being 64.8%. This value represents a 0.1% difference to the downside when compared to the previously reported value.

Weekly Crypto Market Cap Chart

The cryptocurrency sector’s market capitalization has decreased slightly since we last reported, with its current value being $955.53 billion. This represents a $69 billion decrease when compared to our previous report.

_______________________________________________________________________

What happened in the past 24 hours?

_______________________________________________________________________

_______________________________________________________________________

Technical analysis

_______________________________________________________________________

Bitcoin

Bitcoin’s daily time-frame shows that the cryptocurrency is still contained within the triangle formation, which will be a major determinant in BTC’s future price movement. If we zoom in to the hourly time-frame, we can see that BTC moved down, broke the $34,627, and pushed towards the downside, but got instantly stopped by the triangle formation’s bottom line.

While Bitcoin’s short-term overview seems slightly bearish, many analysts call for a push towards $60,000 before any major pullback. However, judging by the current trading session, BTC has a higher chance of breaking the triangle formation to the downside at the moment.

BTC/USD 1-hour chart

Bitcoin’s weekly and monthly time-frames are completely bullish and show no signs of bearishness. On the other hand, its daily time-frame oscillators point to “sell” while the rest of the overview is still bullish, and its 4-hour time-frame is completely bearish.

BTC/USD 1-day Technicals

Technical factors (1-hour Chart):

  • Price is slightly below both its 50-period EMA and its 21-period EMA
  • Price is slightly below its middle Bollinger band
  • RSI is neutral (44.21)
  • Volume is average (low)

Key levels to the upside:          Key levels to the downside:

1: $37,445                             1: $34,627

2: $40,000                             2: $32,350

3: $42,000                             3: $27,960

Ethereum

The second-largest cryptocurrency by market cap went into retracement mode after creating a new all-time high of $1,440 two days ago. Ether’s price moved in a straight descending pattern at first but then bounced back up and tried to retest the $1,350 level. As time passed, it was more and more evident that ETH failed to break $1,350 to the upside and that its price is now contained between $1,350 to the upside and $1,211 to the downside.

Ether’s current upside is heavily guarded, not only by the $1,350 level but also by the 21-hour and 50-hour EMAs.

ETH/USD 1-hour Chart

Ethereum’s technicals on all time-frames are bullish, but only its daily time-frame shows no signs of neutrality or bearishness. The rest of the time-frames (4-hour, weekly, and monthly) have their oscillators pointing to a neutral or bearish stance.

ETH/USD 1-day Technicals

Technical Factors (1-hour Chart):

  • Price is slightly below its 50-period and its 21-period EMA
  • Price is slightly below its middle Bollinger band
  • RSI is neutral (44.30)
  • Volume is average

Key levels to the upside:          Key levels to the downside:

1: $1,350                               1: $1,211

2: $1,420                               2: $1,183.85

3: $1,440                              3: $1047.5

Litecoin

Litecoin spent the day trading on very low volume compared to the previous days, with its price contesting the $142.1 level twice. At the moment, LTC traders can face two scenarios, one being LTC falling below $142.1 level and pushing towards $128.4, and the second one being that LTC acts on the double bottom it created and pushes up to regain some of the lost value.

LTC/USD 1-hour Chart

Litecoin’s technicals are pretty split, with its 4-hour and daily indicators showing almost complete bearish sentiment and its weekly and monthly overviews showing complete bullishness.

LTC/USD 1-day Technicals

Technical factors (1-hour Chart):

  • Its price is slightly below both its 50-period EMA and its 21-period EMA
  • Price between its middle and bottom Bollinger band
  • RSI is neutral (41.78)
  • Volume is below average

Key levels to the upside:          Key levels to the downside:

1: $161.5                               1: $142.1

2: $181.3                               2: $128.42

3: $186.3                               3: $114.75

Categories
Crypto Market Analysis

Daily Crypto Review, Jan 20 – ETH Reaches a New All-Time High; Crypto Sector in the Red

The crypto sector ended up mostly in the red as altcoins started retracing after their moves to the upside. Bitcoin is currently trading for $35,776, representing a decrease of 2.1% compared to yesterday’s value. Meanwhile, Ethereum’s price has increased by 3.28% on the day, while LTC lost 3.44% of its value.

Daily Crypto Sector Heat Map

Folder Protocol gained 813.46% in the past 24 hours, making it the most prominent daily crypto gainer by far. It is followed by Global Gaming’s 198.29% and Benchmark Protocol’s 159.89% gain. On the other hand, 3XT TOKEN lost 85.20%, making it the most prominent daily loser. It is followed by Ether Kingdoms Token’s loss of 61.70% and Matrix AI Network’s loss of 52.48%.

Top 10 24-hour Performers (Click to enlarge)

Bottom 10 24-hour Performers (Click to enlarge)

Bitcoin’s market dominance has moved down since our last report as altcoins started to outperform, with its value currently being 64.9%. This value represents a 0.7% difference to the downside when compared to the previously reported value.

Weekly Crypto Market Cap Chart

The cryptocurrency sector’s market capitalization has decreased slightly since we last reported, with its current value being $1.024 trillion. This represents a $10 billion decrease when compared to our previous report.

_______________________________________________________________________

What happened in the past 24 hours?

_______________________________________________________________________

_______________________________________________________________________

Technical analysis

_______________________________________________________________________

Bitcoin

Bitcoin’s daily time-frame shows us that the largest cryptocurrency by market cap is still contained within the triangle formation (purple). Any break of the current sideways movement may contest the triangle as well. On the other hand, BTC on the 1-hour time-frame is bouncing between the $34,627 support and the $37,445 resistance level for the past five days.

Bitcoin’s price will soon have to break the sideways trading pattern and contest the triangle formation. If BTC bulls or bears manage to break the triangle formation, we could see a large move in the same direction.

BTC/USD 1-hour chart

Bitcoin’s short-term (4-hour and daily) technicals are slightly tilted towards the sell-side but still show a hint of neutrality or bullishness. Its weekly and monthly technicals are exactly the opposite, as they are slightly bullish but show some bearishness alongside it.

BTC/USD 1-day Technicals

Technical factors (1-hour Chart):

  • Price is slightly below both its 50-period EMA and its 21-period EMA
  • Price is slightly below its middle Bollinger band
  • RSI is neutral (44.32)
  • Volume is average (low)

Key levels to the upside:          Key levels to the downside:

1: $37,445                             1: $34,627

2: $40,000                             2: $32,350

3: $42,000                             3: $27,960

Ethereum

The second-largest cryptocurrency by market cap took advantage of the “altcoin season” as money moved from Bitcoin and onto other altcoins. Ever since Ether’s price bounced from the $1,211 level on Jan 18, we could see bulls coming to the market in larger numbers. This made the $1,350 level fall, and ETH finally set a new all-time high of $1,440. While the new ATH is just $20 away from its previous one, this is considered a testament to Ethereum’s upside potential.

Ether couldn’t position itself above the $1,420 (previous ATH) and fell below as it started retracing. Its price is now testing the $1,350 level but will most likely stay above it.


ETH/USD 1-hour Chart

Ethereum’s technicals on all time-frames are tilted towards the buy-side, but all show a hint of bearishness in the oscillator department.

ETH/USD 1-day Technicals

Technical Factors (1-hour Chart):

  • Price is above its 50-period and at its 21-period EMA
  • Price is slightly below its middle Bollinger band
  • RSI is neutral (50.69)
  • Volume is above average

Key levels to the upside:          Key levels to the downside:

1: $1,420                               1: $1,350

2: $1,440                               2: $1,211

3: $1,450                               3: $1,183.85

Litecoin

Litecoin spent the day retracing from the recent $166.2 high after bulls reached exhaustion. LTC was trying to push towards the $180 levels and contest the 2021 highs but failed to do so as bulls spent too much strength in the $160 area, where the cryptocurrency faced heavy resistance.

Litecoin is now having a downward trajectory and has failed to break the 50-hour moving average in an attempt to break it. LTC traders may look for a trade after the cryptocurrency finishes testing the $142.1 level.

LTC/USD 1-hour Chart

Litecoin’s technicals on the 4-hour and monthly time-frames are completely bullish and show no neutrality or bearishness. On the other hand, its daily and weekly overviews show some form of bearishness.

LTC/USD 1-day Technicals

Technical factors (1-hour Chart):

  • Its price is below both its 50-period EMA and its 21-period EMA
  • Price sightly below its middle Bollinger band
  • RSI is neutral (44.85)
  • Volume is average

Key levels to the upside:          Key levels to the downside:

1: $161.5                               1: $142.1

2: $181.3                               2: $128.42

3: $186.3                               3: $114.75

Categories
Crypto Market Analysis

Daily Crypto Review, Jan 19 – Ether Breaks $1,300; Litecoin Skyrockets

The crypto sector was mostly green, with altcoins attempting to push up and reduce Bitcoin’s market dominance. Bitcoin is currently trading for $36,423, representing an increase of 3.85% compared to yesterday’s value. Meanwhile, Ethereum’s price has increased by 9.89% on the day, while LTC gained 13.38% of its value.

Daily Crypto Sector Heat Map

4THPILLAR TECHNOLOGIES gained 441.52% in the past 24 hours, making it the most prominent daily crypto gainer by far. It is followed by CryptoAds Marketplace’s 221.1% and YAMv2’s 181.43% gain. On the other hand, CY Finance lost 66.83%, making it the most prominent daily loser. It is followed by Basiscoin Share’s loss of 39.38% and Trading Membership Community’s loss of 37.1%.

Top 10 24-hour Performers (Click to enlarge)

Bottom 10 24-hour Performers (Click to enlarge)

Bitcoin’s market dominance has moved down since our last report, with its value currently being 65.6%. This value represents a 0.5% difference to the downside when compared to the previously reported value.

Weekly Crypto Market Cap Chart

The cryptocurrency sector’s market capitalization has returned above the $1 trillion mark since we last reported, with its current value being $1.034 trillion. This represents a $41.3 billion increase when compared to our previous report.

_______________________________________________________________________

What happened in the past 24 hours?

_______________________________________________________________________

_______________________________________________________________________

Technical analysis

_______________________________________________________________________

Bitcoin

Bitcoin spent the day mostly trading sideways, bound by the $34,627 to the downside and $37,445 to the upside. The price hopped between these levels and created a higher high higher low pattern, which later on broke after BTC couldn’t pass its immediate resistance level.

Bitcoin’s price has created a triangle pattern on the daily chart, and breaking this triangle to the upside or downside will determine the short-term price direction.

BTC/USD 1-hour chart

Bitcoin’s technicals on all time-frames show a slight bullish tilt, with its oscillators pointing towards the sell-side.

BTC/USD 1-day Technicals

Technical factors (1-hour Chart):

  • Price is at both its 50-period EMA and its 21-period EMA
  • Price is at its middle Bollinger band
  • RSI is neutral (49.56)
  • Volume is average (low)

Key levels to the upside:          Key levels to the downside:

1: $37,445                             1: $34,627

2: $40,000                             2: $32,350

3: $42,000                             3: $27,960

Ethereum

Unlike Bitcoin, Ethereum has spent the day first slowly preparing for a move and then explosively pushing to the upside. The second-largest cryptocurrency by market cap has, after confirming its position above the $1,211 level, shot up towards the $1,350 level, which it was not able to break. With the volume descending after that move, ETH will most likely not be able to break $1,350 unless a new wave of bulls comes into the market.

ETH/USD 1-hour Chart

Ethereum’s 4-hour, daily, and monthly technicals are completely bullish and show no signs of neutrality or bearishness. On the other hand, its weekly overview shows some neutrality.

ETH/USD 1-day Technicals

Technical Factors (1-hour Chart):

  • Price is above both its 50-period and its 21-period EMA
  • Price is at its top Bollinger band
  • RSI has just left the overbought area (67.24)
  • Volume has spiked up in the recent hours

Key levels to the upside:          Key levels to the downside:

1: $1,350                               1: $1,211

2: $1,420                               2: $1,183.85

3: $1,450                               3: $1,060.5

Litecoin

Litecoin was one of the largest daily gainers after its price suddenly shot up from $141 all the way up to $160 in just one hourly candle. While it seemed at first like the retracement will eat away the gains LTC made, the cryptocurrency made another push towards the upside and stopped just below the $161.55 resistance level.

Litcoin’s descending volume and price movement, as well as the number of sell orders near the $161.55 level, will most likely be enough to keep LTC below the resistance level for now.

LTC/USD 1-hour Chart

Litecoin’s technicals on the 4-hour, daily, and weekly time-frame are completely bullish, while its monthly technicals are slightly more neutral.

LTC/USD 1-day Technicals

Technical factors (1-hour Chart):

  • Its price is above both its 50-period EMA and its 21-period EMA
  • Price close to its top Bollinger band
  • RSI is neutral (66.70)
  • Volume is above average

Key levels to the upside:          Key levels to the downside:

1: $161.5                               1: $142.1

2: $181.3                               2: $128.42

3: $186.3                               3: $114.75

Categories
Crypto Market Analysis

Daily Crypto Review, Jan 18 – Bitcoin Drops During the Weekend, ETH Remains Strong

The crypto sector spent the weekend in a mostly descending fashion, with BTC continuing its short-term downtrend. Bitcoin is currently trading for $35,258, representing an increase of 0.14% compared to yesterday’s value. Meanwhile, Ethereum’s price has decreased by 0.39% on the day, while LTC lost 0.46% of its value.

Daily Crypto Sector Heat Map

Astosch gained 285.95% in the past 24 hours, making it the most prominent daily crypto gainer by far. It is followed by ALL BEST ICO’s 273.67% and Yeld Finance’s 264.65% gain. On the other hand, Bestay lost 87%, making it the most prominent daily loser. It is followed by Zugacoin’s loss of 85.51% and VKF Platform’s loss of 77.77%.

Top 10 24-hour Performers (Click to enlarge)

Bottom 10 24-hour Performers (Click to enlarge)

Bitcoin’s market dominance has moved down since our last report, with its value currently being 66.1%. This value represents a 2.3% difference to the downside when compared to the previously reported value.

Weekly Crypto Market Cap Chart

The cryptocurrency sector’s market capitalization has dropped below the $1 trillion mark since we last reported, with its current value being $993.33 billion. This represents a $43.67 billion decrease when compared to our previous report.

_______________________________________________________________________

What happened in the past 24 hours?

_______________________________________________________________________

_______________________________________________________________________

Technical analysis

_______________________________________________________________________

Bitcoin

Bitcoin spent the weekend following the downtrend it started on Jan 14, with its price slowly declining from a high of $39,600 to a low of $33,833. During the downtrend, the price has contested and broken the $36,640 level to the downside and looks like it will contest the $33,200 level in the near future. BTC is currently trading at a little above $35,000, representing a weekly loss of 6.09% and a monthly gain of 29.87%.

Bitcoin’s price has responded well to the 21-day moving average and found very strong support there. Staying above this level will be crucial if BTC wants to turn to the upside.

BTC/USD 1-hour chart

Bitcoin’s technicals on the daily, weekly, and monthly time-frame are completely bullish and show no neutral or bearish signs. On the other hand, its 4-hour overview is completely bearish.

BTC/USD 1-day Technicals

Technical factors (1-hour Chart):

  • Price is slightly below its 50-period EMA and its 21-period EMA
  • Price is slightly below its middle Bollinger band
  • RSI is neutral (43.00)
  • Volume is descending

Key levels to the upside:          Key levels to the downside:

1: $36,640                             1: $33,200

2: $40,000                             2: $30,640

3: $42,000                             3: $27,960

Ethereum

Unlike Bitcoin, Ethereum’s weekend was not spent in a downfall. The second-largest cryptocurrency by market cap headed towards the $1,300 level but failed to break it, which prompted a weekend of sideways trading. While ETH did break the $1,211 level to the downside, the $1,183.85 level held up. Ether is currently trading in a very narrow range, bound by the aforementioned levels.

ETH’s short-term movement will greatly depend on two factors: Bitcoin’s volatility and Ether itself, breaking its immediate support or resistance levels.

ETH/USD 1-hour Chart

Ethereum’s technicals all time-frames are tilted towards the buy-side, with the 4-hour, daily, and weekly overviews fully pointing towards the buy-side. Its monthly overview, however, has oscillators pointing towards neutrality.

ETH/USD 1-day Technicals

Technical Factors (1-hour Chart):

  • Price is slightly below its 50-period and its 21-period EMA
  • Price is between its middle and bottom Bollinger band
  • RSI is neutral (43.72)
  • Volume is slightly below average

Key levels to the upside:          Key levels to the downside:

1: $1,211                               1: $1,183.85

2: $1,255                               2: $1,060.5

3: $1,350                               3: $1,047.5

Litecoin

Litecoin mirrored Bitcoin’s movements over the weekend, stepping into a downtrend that started on Jan 14, after Litecoin couldn’t push its price to $160. The price is currently fighting for the $142.1 level, which it has recently broken to the downside.

While Litecoin’s movements seem to mirror Bitcoin’s, its volume remains stable despite Bitcoin’s volume dropping. At the moment, LTC might be a better choice for people that want to be less affected by Bitcoin’s volatility.

LTC/USD 1-hour Chart

Litecoin’s technicals on the daily, weekly, and monthly time-frame are completely bullish and show no neutral or bearish signs (though they are slightly less bullish than Bitcoin’s overviews). On the other hand, its 4-hour overview is completely bearish.

LTC/USD 1-day Technicals

Technical factors (1-hour Chart):

  • Its price is slightly below its 50-period EMA and its 21-period EMA
  • Price close to its bottom Bollinger band
  • RSI is neutral (42.47)
  • Volume is average

Key levels to the upside:          Key levels to the downside:

1: $142.1                               1: $128.42

2: $161.5                               2: $114.75

3: $181.3                               3: $97.8

Categories
Cryptocurrencies

Everything You Need to Know About Litecoin

In this article, we will try to develop the essence of the project and the main differences with Bitcoin. Where to buy, save, and how to mine Litecoin, and prospects for cryptocurrency quotes.

The Litecoin cryptocurrency is called silver, compared to Bitcoin, which is rightfully gold. Initially, the currency was created as a reserve variant of BTC, which did not have analogues for a long time. Subsequently, the payment system became a stand-alone project, which created Bitcoin a real competition. However, maintaining the “silver” Litecoin could not, giving way to BCH, Ripple, and decentralized networks EТН and EOS. Although the startup is gradually losing positions, it remains an attractive option for diversification of the investment portfolio. What is Litecoin, what are its characteristics, how to mine the cryptocurrency, where to buy it, and what are the projections of its course.

Litecoin To Replace BTC?

In 2018, relative stability began in the cryptocurrency market and some clear trends were emerging. The success of ICOs is still present and continues to have some growth, but it has begun to follow a pattern: developers are moving further and further away from non-traditional startup ideas, creating analogues (fork, clones) from the most popular cryptocurrencies. Firstly, we are talking about payment systems and decentralised networks such as BTC and ETH. It is logical that when there is a market correction the vast majority will cease to exist, giving way to the oldest, but not less popular cryptocurrencies. And although these older cryptocurrencies have been repeatedly criticized, they remain solid in the top capitalization rating of CoinMarketCap and are unlikely to be eliminated.

One of these coins is the cryptocurrency Litecoin, which is among the most flexible, progressive, and promising. This cryptocurrency is traded on almost every stock exchange in the world, except for “pocket” exchanges (“adapted” for a particular project). Your code is constantly improving, and it is possible that someday this payment system will be able to become equal with BTCs in terms of capitalization. What is Litecoin, what are its differences with Bitcoin, where to buy and save, how to mine and what are the prospects of cryptocurrency, read it in the article.

Charlie Lee was the founder of this project, and I was the one to date is one of the main developers. Initially, cryptocurrency was conceived as an analogue to Bitcoin, a kind of reserve currency. In 2011, its code was developed, copying almost literally the BTC code, only with more bandwidth, and in 2013 the project gained worldwide recognition, occupying second place in terms of capitalization. Subsequently, some changes were made to Litecoin with respect to the mining algorithm, transaction speed, and the number of coins. The order of blockchain construction on both currencies is the same, the differences are only in the function of finding a hash. Both currencies have a Proof-of-Work consensus algorithm.

Differences Between Litecoin and Bitcoin

The number of Litecoin coins is 84 million, of which more than 56 million have been extracted (the BTC issue is limited to 21 million coins, of which 17 million have already been extracted).

Hash search algorithm: Litecoin is Scrypt, Bitcoin is SHA-256.

The speed of computation generation is 4 times higher. The generation of 6 blocks takes place in 15 minutes.

There are many possibilities that in the future an adaptation of Atomic Swap technology, this technology will allow for paying for goods and services with Litecoin and Bitcoin. For example, if the seller accepts only BTC, it will be possible to pay for the goods with LTC (automatic conversion) without commissions. The technology, at present, has not been implemented, but in the future, it may become a significant competitive advantage compared to BTC.

There is protection against “double costs”. The peer-to-peer network excludes third-party intervention. Litecoin and Bitcoin are very similar. LTC developers had one goal: to increase the speed of transactions. And in part, they succeeded, but they failed to break the glory of the BTC. There are two reasons for this:

  1. Investors are used to Bitcoin and have legislative support in some countries. And while the idea of Litecoin looks promising, investors preferred the already proven asset.
  2. Bitcoin doesn’t have a founder, the development team is working on it, and the network itself is completely decentralized. Litecoin was created by Charlie Lee, who had substantial participation until the end of 2017. This dependence partly deterred investors who feared an artificial influence on quotations.

The official startup website is somewhat confusing. It is a single page, where the main information is only data on purses, shoes, and bags. There is neither a White Paper, nor a clear description of the essence of the project and its advantages, nor information about the developers. Why such a serious startup was left without any information support is a mystery. And that’s one of the reasons why Litecoin is inferior to its competitors. Some of the information can be found on the litecoin-foundation.org site, but it is uncomfortable.

Where to Buy and Save Litecoin

It could be thought that the popularity of cryptocurrency should ensure a uniform distribution of turnover, which would mean reducing the risks and equal interest of investors worldwide. However, the largest volume of sales falls to OKEx (okex.com), approximately 27-30%. You have the possibility to purchase a chip here, but only for BTC or USDT, unfortunately, ЕТН or fiat are not provided. Although this exchange is one of the largest, it is surprising why in Huobi or Bitfinex the volume is much smaller. Here it is appropriate to recall the accusations against Charlie Lee, whose essence was the artificial manipulation of LTC’s price when he was one of the developers in the Coinbase exchange.

Litecoin is present in more than 350 exchanges of cryptocurrencies its instruments, but currency trading takes place in just a few tens of them, literally. The second place after OKEx is in the Binance exchange (binance.com) with a turnover of 10-12%, but here the currency is also traded only by USDT or BTC. Between 5% and 9% of turnover corresponds to GDAX (gdax.com), Binance, Huobi (huobi.pro/ru-ru/), Bitfinex (bitfinex.com), Bit-Z (bit-z.com). Few exchanges can have the possibility of purchase cryptocurrencies for a South Korean won, EUR, or ETH.

In terms of the proportion of turnover for each specific exchange, Litecoin is lower than its main competitors: BTC, ETH, XRP, EOS, ВСН. In front of Binance is LTC also TRON and Loom Network, in front of Huobi is Cortex, in front of Bit-Z is TRON, in front of OKEx is True Chain. Due to frequent cryptocurrency exchange attacks, it is not desirable to keep coins in your accounts. An alternative could be the purses, whose list is provided on the site. These include online, cold wallets, and coin purse devices for different types of carriers. To avoid problems and loss of cryptocurrencies, it is recommended to use only these.

Another alternative for intraday trading is Forex. Advantages of this option:

  • The ability to open not only a long position but also a short position. The implementation of any strategy that cannot be implemented in exchanges due to technical details, the possibility of using trading advisors.
  • Account security (protection against piracy and unauthorized withdrawal of money). The ability to recover a password if you have lost it (the wallet password is not restored).
  • Instantaneous transaction speed.

For those who were interested in this possibility, LiteForex prepared a nice surprise: recently, cryptocurrency pairs have been added to the list of instruments, allowing you to win at rates not only relative to the US dollar, but also among themselves. Learn more about the terms and conditions here.

Litecoin Mining

Litecoin is often referred to as “silver after gold,” meaning it is the second most significant cryptocurrency after Bitcoin. It is true that in times past it was in the TOP 3, even the cryptocurrency came out of the TOP 5, occupying a sixth-place rather unstable. By the level of capitalization only a little Cardan is missing to lower Litecoin another line down. And there, she will be reached by Stellar, who is rapidly gaining momentum. We will try to explain this by the following factors:

The emergence of new payment systems, in part “drag on itself”. First, there are numerous Bitcoin forks and a new address in cryptocurrencies: blockchain symbiosis (e.g., Bitcoin and ZClassic). If Bitcoin is backed by great trust and recognition from countries, then other payment systems to reach the CIMA is more difficult.

Competence of decentralized networks. Any startup has the obligation to be a useful project if we look at it from a practical point of view. And if most payment systems are only in a model state, then, based on decentralized networks, application development is already underway. Because Litecoin lost positions to Ethereum and EOS.

The prospects for the Litecoin cryptocurrency are more than optimistic, but the chances of even reaching the TOP 5 (not to mention the TOP 3) are slim. The payment system is improved and developed, actively promoted in forums and media. But competitors don’t stay in place either, and the closest of them, Bitcoin Cash, is out of reach.

One of the decisive factors determining the interest of investors in cryptocurrency is the news fund. In early February 20, 2018, developers announced the release of LitePay, a technology that would allow retailers to make and record payments instantly anywhere in the world. According to the information on the project’s website, this technology would protect against volatility through the instantaneous exchange of LTCs by traditional currency units, thus competing with exchanges.

With a rate close to 3% for payment cards, LitePay technology would reduce costs by up to 1% (which is even lower than BTC’s). The planned launch of the technology did not take place and so far its future is unknown. After the failed release of LitePay (allegedly due to hostile actions by card issuers in relation to cryptocurrency companies), the rate dropped and so far has not returned to the same level.

In the near future, lots of news determine Litecoin’s exchange rate. By the way, startup founder Charlie Lee in December 2017 completely got rid of his share, selling coins at the time of the spike in quotes. After the LTC price on 19 December reached a record high of USD 359, it sold its entire share, motivating that it will now not be accused of influencing the quotations for its own benefit. For several weeks afterward, the coin was halved.

And yet, Litecoin’s exchange rate forecast is positive. Little by little, startups support different platforms, and now the success of the project will depend exclusively on the developers. With cryptocurrency, you can pay for goods in some online stores, but so far their number is limited.

Conclusion

The Litecoin cryptocurrency is a good second-tier currency, lower due to development errors only in the BTC and BCH payment systems (Ripple and decentralised networks are not taken into account, as they have a different essence). It is not strictly necessary that we talk about the stable growth of the exchange rate, but on the other hand, this is a possibility for Forex to gain in the fluctuations of the quotes in both directions. To project the exchange rate, we follow the news and do not forget the diversification of the portfolio.

Categories
Crypto Market Analysis

Daily Crypto Review, Jan 15 – Bitcoin Retraces After Hitting $40k; Ethereum Contests $1.2k

The crypto sector was mostly stable in the past 24 hours, as most cryptocurrencies were trying to find their top or retraced slightly. Bitcoin is currently trading for $37,766, representing a decrease of 0.42% compared to yesterday’s value. Meanwhile, Ethereum’s price has increased by 5.98% on the day, while LTC gained 0.33% of its value.

Daily Crypto Sector Heat Map

FastSwap gained 244.13% in the past 24 hours, making it the most prominent daily crypto gainer by far. It is followed by HedgeTrade’s 225.26% and Capital.Finance’s 145.48% gain. On the other hand, Zugacoin lost 87.51%, making it the most prominent daily loser. It is followed by Roti Bank Coin’s loss of 77.52% and BitiPro Exchange Token’s loss of 74.35%.

Top 10 24-hour Performers (Click to enlarge)

Bottom 10 24-hour Performers (Click to enlarge)

Bitcoin’s market dominance has moved down slightly since our last report, with its value currently being 68.4%. This value represents a 0.6% difference to the downside when compared to the previously reported value.

Weekly Crypto Market Cap Chart

The cryptocurrency sector’s market capitalization has made negligible gains since we last reported, with its current value being $1.037 trillion. This represents a $5 billion increase when compared to our previous report.

_______________________________________________________________________

What happened in the past 24 hours?

_______________________________________________________________________

_______________________________________________________________________

Technical analysis

_______________________________________________________________________

Bitcoin

Bitcoin has ended its uptrend by hitting a high of $40,112 yesterday, prompting a slight pullback. The pullback was, just like the price increase, happening on low volume and had the same intensity as well. The only differentiating factor was its direction. The move to the downside ended with BTC’s price hitting the 50-hour moving average and pushing up.

Bitcoin has a couple of strong resistance lines to the upside, one being the immediate 21-hour EMA, and then the $40,000 and ultimately $42,000 levels. On the other hand, its support is guarded by the 50-hour EMA and the $36,640 level.

BTC/USD 1-hour chart

Bitcoin’s technicals on the daily and monthly time-frame are overall bullish but have oscillators pointing to the sell-side. On the other hand, its 4-hour and weekly overviews are completely bullish.

BTC/USD 1-day Technicals

Technical factors (1-hour Chart):

  • Price is between its 50-period EMA and its 21-period EMA
  • Price is slightly below its middle Bollinger band
  • RSI is neutral (50.19)
  • Volume is average

Key levels to the upside:          Key levels to the downside:

1: $40,000                             1: $36,640

2: $42,000                             2: $33,200

3: $43,600                             3: $30,640

Ethereum

Ethereum’s push to the upside has, just like with Bitcoin, seemingly ended. However, its pullback hasn’t started at all, as its price kept fluctuating between the recently $1,183.85 support level and the recent high. Trading in such a narrow range is not sustainable, and ETH will break either to the upside or downside very soon.

ETH traders can finally catch a nice trade as the cryptocurrency has (at least a bit) moved in a different manner than Bitcoin. Ether’s upside is guarded by the heavy resistance zone slightly below $1,300 as well as the $1,350 level. Its downside has smaller support levels, some of them being $1,211, $1,183.85, as well as the 21-hour and 50-hour EMAs.

ETH/USD 1-hour Chart

Ethereum’s technicals on the 4-hour and daily time-frames are overall bullish but have oscillators pointing to the sell-side. On the other hand, its weekly and monthly overviews are completely bullish.

ETH/USD 1-day Technicals

Technical Factors (1-hour Chart):

  • Price is above its 50-period and at its 21-period EMA
  • Price is near its top Bollinger band
  • RSI is neutral (61.37)
  • Volume is slightly below average

Key levels to the upside:          Key levels to the downside:

1: $1,255                               1: $1,211

2: $1,350                               2: $1,183.85

3: $1,419                               3: $1,060.5

Litecoin

Litecoin continued trading within its range, bound by $142.1 to the downside and $161.5 to the upside. Its price is now also between the 21-hour and the 50-hour EMAs, which have proven to be strong support and resistance levels, especially when paired with low trading volume.

Litecoin is currently mirroring the direction of Bitcoin’s moves, but with much less intensity. This makes it a very unattractive trading pair at the moment.

LTC/USD 1-hour Chart

Litecoin’s technicals on all time-frames are completely bullish and without any signs of neutrality.

LTC/USD 1-day Technicals

Technical factors (1-hour Chart):

  • Its price is slightly above its 50-period EMA and at its 21-period EMA
  • Price at its middle Bollinger band
  • RSI is neutral (53.10)
  • Volume is descending

Key levels to the upside:          Key levels to the downside:

1: $161.5                               1: $142.1

2: $181.3                               2: $128.42

3: $186.3                               3: $114.75

Categories
Crypto Market Analysis

Daily Crypto Review, Jan 14 – Bitcoin Records Double-Digit Gains as it Passes $38K; Crypto Market in the Green

The crypto sector ended up almost completely in the green as Bitcoin recorded double-digit gains and pulled the rest of the market up. Bitcoin is currently trading for $38,222, representing an increase of 11.05% compared to yesterday’s value. Meanwhile, Ethereum’s price has increased by 9.00% on the day, while LTC gained 6.48% of its value.

Daily Crypto Sector Heat Map

Simbcoin gained 366.72% in the past 24 hours, making it the most prominent daily crypto gainer by far. It is followed by Penta’s 229.88% and DEX’s 187.13% gain. On the other hand, Daiquilibrium lost 88.91%, making it the most prominent daily loser. It is followed by Dynamic Supply Tracker’s loss of 80.15% and Dynamic Supply’s loss of 63.83%.

Top 10 24-hour Performers (Click to enlarge)

Bottom 10 24-hour Performers (Click to enlarge)

Bitcoin’s market dominance has moved up slightly since our last report, with its value currently being 69%. This value represents a 0.4% difference to the upside when compared to the previously reported value.

Daily Crypto Market Cap Chart

The cryptocurrency sector’s market capitalization has made significant gains since we last reported, with its current value being $1.032 trillion. This represents an $88.3 billion increase when compared to our previous report.

_______________________________________________________________________

What happened in the past 24 hours?

_______________________________________________________________________

_______________________________________________________________________

Technical analysis

_______________________________________________________________________

Bitcoin

Bitcoin had started changing its price direction on Jan 13, when it started to slowly push towards the upside. The largest cryptocurrency by market cap managed to pass the $36,640 level and reach as high as $38,789 before pulling back slightly. This steady price increase was followed by average (or even slightly descending) volume.

The pullback BTC went into after hitting the recent high was quickly stopped by the 21-hour and 50-hour EMAs, changing the overall stance from an expected downturn to uncertainty.

BTC/USD 1-hour chart

Bitcoin’s technicals on the 4-hour, daily and monthly time-frame are overall bullish, with oscillators pointing to the sell-side. On the other hand, its weekly overview is completely bullish.

BTC/USD 1-day Technicals

Technical factors (1-hour Chart):

  • Price is above both its 50-period EMA and its 21-period EMA
  • Price is between its middle and top Bollinger band
  • RSI is neutral (62.38)
  • Volume is average

Key levels to the upside:          Key levels to the downside:

1: $40,000                             1: $36,640

2: $42,000                             2: $33,200

3: $43,600                             3: $30,640

Ethereum

Ethereum’s period of heavy correlation with Bitcoin has continued as its price slowly gained momentum towards the upside. Ether managed to push its price to the $1,183.85 level but couldn’t quite break it. This caused a minor pullback, which ended very quickly.

Ethereum’s 21-hour and 50-hour EMAs play a significant role in determining its price direction and should be considered by the traders at all times. On top of that, any ETH trader should pay attention to BTC’s movements, as those ultimately determine the price direction of most cryptocurrencies.

ETH/USD 1-hour Chart

Ethereum’s technicals on the daily and weekly time-frame are currently completely bullish, while its 4-hour and monthly overviews show some signs of neutrality.

ETH/USD 1-day Technicals

Technical Factors (1-hour Chart):

  • Price is above both its 50-period and its 21-period EMA
  • Price is near its top Bollinger band
  • RSI is neutral (64.19)
  • Volume is slightly below average

Key levels to the upside:          Key levels to the downside:

1: $1,183.85                          1: $1,060.5

2: $1,211                               2: $1,047.5

3: $1,226.5                            3: $992

Litecoin

While Litecoin did follow Bitcoin’s price direction, it did so with much less conviction and intensity. Its price managed to pass the $142.1 level to the upside and establish its price above it but failed to move into the upper half of the trading range bound by $142.1 to the downside and $161.5 to the upside.

Litecoin currently has a very nicely-built support zone, while its upside is quite open. If Bitcoin’s price remains the same, traders can expect LTC to try to push towards or even contest the $161.5 level.

LTC/USD 1-hour Chart

Litecoin’s technicals on the shorter time-frames (4-hour, daily, and weekly) show overall tilt to the buy-side with hints of neutrality. Its monthly time-frame, however, is completely bullish.

LTC/USD 1-day Technicals

Technical factors (1-hour Chart):

  • Its price is slightly above its 50-period EMA and its 21-period EMA
  • Price slightly above its middle Bollinger band
  • RSI is neutral (57.08)
  • Volume is descending

Key levels to the upside:          Key levels to the downside:

1: $161.5                               1: $142.1

2: $181.3                               2: $128.42

3: $186.3                               3: $114.75

Categories
Crypto Market Analysis

Daily Crypto Review, Jan 13 – Polkadot Outperforms the Market as it Heads Towards $10; Crypto Sector in the Red

The crypto sector ended up mostly trading in the red as cryptocurrencies such as Ether, Litcoin, and Bitcoin Cash dropped over 5% on the day. Polkadot was one of the few cryptocurrencies that managed to score double-digit gains and outperform the market by a large margin. However, this is purely due to fundamental reasons (immense support coming from the Binance exchange) rather than technicals.

Bitcoin is currently trading for $34,223, representing a decrease of 3.03% compared to yesterday’s value. Meanwhile, Ethereum’s price has decreased by 4.09% on the day, while LTC lost 3.07% of its value.

Daily Crypto Sector Heat Map

Metacoin gained 103.61% in the past 24 hours, making it the most prominent daily crypto gainer by far. It is followed by OVR’s 98.72% and Latamcash’s 92.88% gain. On the other hand, Amun Bitcoin 3x Daily Short lost 75.44%, making it the most prominent daily loser. It is followed by Zugacoin’s loss of 73.82% and KIMCHI.finance’s loss of 66.82%.

Top 10 24-hour Performers (Click to enlarge)

Bottom 10 24-hour Performers (Click to enlarge)

Bitcoin’s market dominance has moved down very slightly since our last report, with its value currently being 68.6%. This value represents a 0.1% difference to the downside than the value it had when we last reported.

Daily Crypto Market Cap Chart

The cryptocurrency sector’s capitalization has decreased since we last reported, with its current value being $948.23 trillion. This represents a $17.92 billion decrease when compared to our previous report.

_______________________________________________________________________

What happened in the past 24 hours?

_______________________________________________________________________

_______________________________________________________________________

Technical analysis

_______________________________________________________________________

Bitcoin

Bitcoin spent the day hovering between the $33,320 support level and the $36,640 resistance level, with its price mostly being in the bottom part of the range. The price even breached the support level and went past it on several occasions, but it always returned back up. While it currently seems stable and on decreasing volume, Bitcoin might experience a stronger pullback and an attempt to retest $30,000 once again.

BTC/USD 1-hour chart

Bitcoin’s technicals on the daily and monthly time-frame bullish, but contain some neutrality alongside the bullishness. However, its weekly overview is completely bullish, while its 4-hour chart is completely bearish.

BTC/USD 1-day Technicals

Technical factors (1-hour Chart):

  • Price is between its 50-period EMA and its 21-period EMA
  • Price is near its middle Bollinger band
  • RSI is neutral (50.24)
  • Volume is descending

Key levels to the upside:          Key levels to the downside:

1: $36,640                             1: $33,200

2: $40,000                             2: $30,640

3: $42,000                             3: $27,960

Ethereum

Ethereum has traded almost exactly like Bitcoin in the past 24 hours, both in terms of price direction and intensity. The second-largest cryptocurrency by market cap is currently in an extremely narrow and unsustainable range, bound by the Fib retracement level of $1,060 to the upside and a 2017 Fib retracement sitting at $1,047.

Ethereum’s 21-hour and 50-hour moving averages play a significant role in determining price direction and should be considered by the traders at all times.

ETH/USD 1-hour Chart

Ethereum’s technicals on the daily and monthly time-frame bullish, but contain some neutrality alongside the bullishness. However, its weekly overview is completely bullish, while its 4-hour chart is completely bearish.

ETH/USD 1-day Technicals

Technical Factors (1-hour Chart):

  • Price is between its 50-period and its 21-period EMA
  • Price is at its middle Bollinger band
  • RSI is neutral (48.60)
  • Volume is descending

Key levels to the upside:          Key levels to the downside:

1: $1,129                               1: $1,060.5

2: $1,211                               2: $1,047.5

3: $1,226.5                             3: $992

Litecoin

Litecoin has been pretty stable in the past 24 hours, with its price trading within a range bound by $128.4 to the downside and $142.1 to the upside. These support/resistance levels, alongside the 21-hour and 50-hour EMAs, will determine Litecoin’s future price intensity, while Bitcoin’s next move will most likely determine its price direction.

LTC/USD 1-hour Chart

Litecoin’s technicals on the daily and monthly time-frame are completely bullish. However, its weekly overview shows slightly less bullishness, while its 4-hour chart is almost completely bearish.

LTC/USD 1-day Technicals

Technical factors (1-hour Chart):

  • Its price is between its 50-period EMA and its 21-period EMA
  • Price slightly below its middle Bollinger band
  • RSI is neutral (51.37)
  • Volume is descending

Key levels to the upside:          Key levels to the downside:

1: $142.1                               1: $128.42

2: $161.5                               2: $114.75

3: $181.3                               3: $98

Categories
Crypto Market Analysis

Daily Crypto Review, Jan 12 – XLM Back in the top10 Cryptos by Market Cap; Crypto Sector in the Green

The crypto sector has experienced a rally that brought the market to its feed after yesterday’s dip. One of the best daily performers was Stellar Lumens (XLM), which shot up in the past week on great fundamentals (and once again today), gaining over 30% just a couple of hours, reentering the top10 cryptocurrencies by market cap.

Bitcoin is currently trading for $35,887, representing an increase of 1.28% compared to yesterday’s value. Meanwhile, Ethereum’s price has increased by 1.89% on the day, while LTC lost 1.85% of its value.

Daily Crypto Sector Heat Map

Amun Bitcoin 3x Daily Short gained 1186.87% in the past 24 hours, making it the most prominent daily crypto gainer by far. It is followed by PengolinCoin’s 366.58% and Firdaos’s 330.42% gain. On the other hand, Zugacoin lost 94.92%, making it the most prominent daily loser. It is followed by the True Segniorage Dollar’s loss of 85.08% and Zero Collateral Dai’s loss of 62.33%.

Top 10 24-hour Performers (Click to enlarge)

Bottom 10 24-hour Performers (Click to enlarge)

Bitcoin’s market dominance has moved up very slightly since our last report, with its value currently being 68.7%. This value represents a 0.1% difference to the upside than the value it had when we last reported.

Daily Crypto Market Cap Chart

The cryptocurrency sector’s capitalization has increased since we last reported, with its current value being $964.21 trillion. This represents a $58.14 billion increase when compared to our previous report.

_______________________________________________________________________

What happened in the past 24 hours?

_______________________________________________________________________

_______________________________________________________________________

Technical analysis

_______________________________________________________________________

Bitcoin

Bitcoin managed to stop its descending move and push up slightly after pulling back to the $30,000 mark. The largest cryptocurrency by market cap has (on decreasing volume) seen a price increase to just below the $36,640 level. Many speculate that, while the drop was considered very healthy overall, the institutions bought even more BTC, which brought its price up without affecting the volume as much.

However, BTC/USD doesn’t seem like it currently has the strength to pass the $36,640 level, which may cause another downturn.

BTC/USD 1-hour chart

Bitcoin’s technicals on the daily and weekly time-frame are completely bullish. However, its monthly overview shows slightly less bullishness, while its 4-hour chart is completely bearish.

BTC/USD 1-day Technicals

Technical factors (1-hour Chart):

  • Price is between its 50-period EMA and its 21-period EMA
  • Price is near its middle Bollinger band
  • RSI is neutral (54.63)
  • Volume is descending to average

Key levels to the upside:          Key levels to the downside:

1: $36,640                             1: $33,200

2: $40,000                             2: $30,640

3: $42,000                             3: $27,960

Ethereum

Ethereum has once again matched Bitcoin in direction after hitting the $907 support level, and changed its price direction by pushing to the upside. The second-largest cryptocurrency by market cap is back at its peak from yesterday and seems like it cannot pass $1,129 with conviction at the moment.

Ethereum’s 21-hour and 50-hour moving averages play a major role and should be taken into account when looking for support or resistance levels.

ETH/USD 1-hour Chart

Ethereum’s technicals on the daily and weekly time-frame are completely bullish. However, its monthly overview shows slightly less bullishness, while its 4-hour chart is completely bearish.

ETH/USD 1-day Technicals

Technical Factors (1-hour Chart):

  • Price is between its 50-period and its 21-period EMA
  • Price is between its middle and top Bollinger band
  • RSI is neutral (53.69)
  • Volume is descending to average

Key levels to the upside:          Key levels to the downside:

1: $1,129                               1: $1,060.5

2: $1,211                               2: $1,047.5

3: $1,226.5                             3: $992

Litecoin

Even though Litecoin did follow Bitcoin’s price direction, it did so with less intensity, causing it to ultimately be in the red for the day. Its price is now at a major crossroads, as it is fighting for the $142.1 level. This pivot point will decide whether the price will immediately push towards the upside or downside.

Litecoin has created a strong resistance level near the $150 mark, and traders should pay great attention to it when trading.


LTC/USD 1-hour Chart

Litecoin’s technicals on the daily and monthly time-frame are completely bullish. However, its weekly overview shows slightly less bullishness, while its 4-hour chart is completely bearish.

LTC/USD 1-day Technicals

Technical factors (1-hour Chart):

  • Its price is between its 50-period EMA and its 21-period EMA
  • Price between its middle and bottom Bollinger band
  • RSI is neutral (50.33)
  • Volume is descending to average levels

Key levels to the upside:          Key levels to the downside:

1: $161.5                               1: $142.1

2: $181.3                               2: $128.42

3: $186.3                               3: $114.75

Categories
Crypto Market Analysis

Daily Crypto Review, Jan 11 – Crypto Sector Plummets as BTC Drops to $32k

The crypto sector experienced dipped over $100 billion in market cap as Bitcoin, and the rest of the market plummeted. Bitcoin is currently trading for $35,165, representing a decrease of 13.31% compared to yesterday’s value. Meanwhile, Ethereum’s price has dropped up to 20.64% on the day, while LTC lost 23.04% of its value.

Daily Crypto Sector Heat Map

Foglory Coin gained 589.61% in the past 24 hours, making it the most prominent daily crypto gainer by far. It is followed by NewsToken’s 175.33% and BELIEVER’s 166.3% gain. On the other hand, True Seigniorage Dollar lost 78.35%, making it the most prominent daily loser. It is followed by the 3x Long Bitcoin SV Token’s loss of 76.74% and 3x long EOS Token’s loss of 69.18%.

Top 10 24-hour Performers (Click to enlarge)

Bottom 10 24-hour Performers (Click to enlarge)

Bitcoin’s market dominance has moved down over a percent since our last report, with its value currently being 68.6%. This value represents a 1.2% difference to the upside than the value it had when we last reported.

Daily Crypto Market Cap Chart

The cryptocurrency sector capitalization has decreased slightly since we last reported, with its current value being $906.07 1,03 trillion. This represents a $2 billion decrease when compared to our previous report.

_______________________________________________________________________

What happened in the past 24 hours?

_______________________________________________________________________

_______________________________________________________________________

Technical analysis

_______________________________________________________________________

Bitcoin

Bitcoin has had an interesting weekend, with its price plummeting in recent hours. Its price dipped to the lows of $32,330 just a few hours ago as major buy positions got liquidated. The largest cryptocurrency by market cap slowly fell below the 21 and 50 moving averages, confirmed its position below then, and then headed straight to the downside with almost no pushback.

However, bulls picked up the pace and are currently fighting for the $35,000 level. Investors used this as a buying/accumulation opportunity, while most traders got liquidated (both short and long positions due to the sudden volatility).

BTC/USD 1-hour chart

Bitcoin’s technicals on the daily, weekly, and monthly time-frame show a tilt towards the buy-side with no or slight signs of neutrality, while its 4-hour overview shows a slight tilt towards the sell-side.

BTC/USD 1-day Technicals

Technical factors (1-hour Chart):

  • Price is below both its 50-period EMA and its 21-period EMA
  • Price is near its bottom Bollinger band
  • RSI is near the oversold territory (37.28)
  • Volume is above average

Key levels to the upside:          Key levels to the downside:

1: $36,640                             1: $33,200

2: $40,000                             2: $30,640

3: $42,000                             3: $27,960

Ethereum

Ethereum matched Bitcoin in direction, but did so with increased intensity. The second-largest cryptocurrency by market cap dipped over 20% on the day as its price fell to just above $1,000. This level seems to have held quite nicely, creating space for Ether to recover.

Ethereum is now trading above the $1,060.5 support level and shows no signs of falling again. However, Bitcoin’s movement will greatly affect the future price direction of ETH.


ETH/USD 1-hour Chart

Ethereum’s technicals on the daily, weekly, and monthly time-frame show a tilt towards the buy-side with no or slight signs of neutrality, while its 4-hour overview shows a slight tilt towards the sell-side.

ETH/USD 1-day Technicals

Technical Factors (1-hour Chart):

  • Price is below both its 50-period and its 21-period EMA
  • Price is near its bottom Bollinger band
  • RSI is near the oversold (31.12)
  • Volume is significantly above-average

Key levels to the upside:          Key levels to the downside:

1: $1,129                               1: $1,060.5

2: $1,211                               2: $1,047.5

3: $1,226.5                             3: $992

Litecoin

Litecoin was one of the major gainers today as well, with its price dropping from $172 all the way down to $124. While bulls did pick up the pace and returned its price to the ~$140 zone, Litecoin is still fighting to maintain its position and tackle the $142.1 level.

Litecoin seemingly got hit the hardest out of the three cryptocurrencies, with its price position still being fairly uncertain. This could prove to be a trading opportunity as the cryptocurrency might make a move independent of Bitcoin’s move in the short future (if Bitcoin itself doesn’t move first).


LTC/USD 1-hour Chart

Litecoin’s technicals on the daily, weekly, and monthly time-frame show a tilt towards the buy-side with slight signs of neutrality, while its 4-hour overview shows a strong tilt towards the sell-side.

LTC/USD 1-day Technicals

Technical factors (1-hour Chart):

  • Its price is currently below both its 50-period EMA and its 21-period EMA
  • Price near its bottom Bollinger band
  • RSI is in the oversold territory (29.68)
  • Volume is on above-average levels

Key levels to the upside:          Key levels to the downside:

1: $161.5                               1: $142.1

2: $181.3                               2: $128.42

3: $186.3                               3: $114.75

Categories
Crypto Market Analysis

Daily Crypto Review, Jan 8 – Bitcoin Continues Its Rise as it Breaks the $40k Mark Briefly

The crypto sector pushed even higher as Bitcoin passed the $40,000 mark and created a new all-time high. Bitcoin is currently trading for $39,094, representing an increase of 5.35% compared to yesterday’s value. Meanwhile, Ethereum’s price has decreased by 1% on the day, while XRP gained 23.53% of its value.

Daily Crypto Sector Heat Map

COVER Protocol gained 2124.46% in the past 24 hours, making it the most prominent daily crypto gainer by far. It is followed by KIMCHI.finance’s 1159.97% and TAI’s 265.52% gain. On the other hand, Stand Share lost 74.11%, making it the most prominent daily loser. It is followed by the Receive Access Ecosystem’s loss of 61.71% and CY Finance’s loss of 56.34%.

Top 10 24-hour Performers (Click to enlarge)

Bottom 10 24-hour Performers (Click to enlarge)

Bitcoin’s market dominance has moved up half a percent since our last report, with its value currently being 69.8%. This value represents a 0.5% difference to the upside than the value it had when we last reported.

Daily Crypto Market Cap Chart

The cryptocurrency sector capitalization has decreased slightly since we last reported, with its current value being $1,03 trillion. This represents a $2 billion decrease when compared to our previous report.

_______________________________________________________________________

What happened in the past 24 hours?

_______________________________________________________________________

_______________________________________________________________________

Technical analysis

_______________________________________________________________________

Bitcoin

Bitcoin has continued moving up, with its price surpassing the $38,000 and $39,000 mark without much problem. The largest cryptocurrency by market cap reached as high as $40,402.5 level before crashing down as bulls could not sustain the price. The price instantly dipped to $36,388 but quickly recovered to the $39,000 area, where it is consolidating at the moment.

Bitcoin has positioned itself for another push towards the upside as it quickly found support in the 50-hour moving average, proving that it doesn’t even need to dip to the horizontal support levels to stabilize itself.


BTC/USD 4-hour chart

Bitcoin’s technicals on the 4-hour, daily, and weekly chart show a tilt towards the buy-side with no signs of neutrality or bearishness. On the other hand, its monthly overview shows slight bearishness in the oscillator sector opposing the overall bullishness.

BTC/USD 1-day Technicals

Technical factors (4-hour Chart):

  • Price is above both its 50-period EMA and its 21-period EMA
  • Price is between its middle and top Bollinger band
  • RSI is in the overbought territory (70.36)
  • Volume is above average

Key levels to the upside:          Key levels to the downside:

1: $40,402                             1: $38,140

2: $43,000                             2: $36,740

3: $46,500                             3: $35,610

Ethereum

Ethereum followed Bitcoin to the upside, pushing its price above its previous resistance levels and up to as high as $1292. Just like Bitcoin, Ethereum instantly dipped to $1,140 but quickly recovered. However, this is where the high correlation with Bitcoin ends, as Ethereum didn’t recover its recent highs but rather lost quite a bit of its value.

While it has recovered since the price dip, Ethereum is now right below the $1,211 resistance level. The cryptocurrency has a high possibility of passing it even if Bitcoin remains stagnant. Still, any moves that would contest the next resistance level would have to be backed by the largest cryptocurrency by market cap.


ETH/USD 1-hour Chart

Ethereum’s technicals on the daily time-frame show an overall bullish tilt with no hints of neutrality. On the other hand, the monthly, weekly, and 4-hour time-frames show some signs of neutrality or even bearishness.

ETH/USD 1-day Technicals

Technical Factors (4-hour Chart):

  • Price is above its 50-period and at its 21-period EMA
  • Price is near its middle Bollinger band
  • RSI has left the overbought area (63.27)
  • Volume is significantly above-average

Key levels to the upside:          Key levels to the downside:

1: $1,292                               1: $1,211

2: $1,420                               2: $1,180

3: $1,500                               3: $1,092

Litecoin

Litecoin followed the market as well, pushing its price further up and breaking its previous resistance level of $174.5. However, while LTC did manage to break this level and post a new high of $181.25 for a moment, the price was unsustainable, resulting in a classic price drop, followed by a failed attempt of recovering (the moment when LTC hit the $174.5 level after dropping below it) acting as a confirmation of a price drop, and then a full-on retracement towards the downside.

Litecoin has bounced off of the $152.25 level beautifully and is now attempting to pass the 50-hour and 21-hour moving averages and continue its move up.


LTC/USD 1-hour Chart

Litecoin’s technicals on the 4-hour, daily, and weekly time-frame are bullish but show some neutrality or even bearishness. On the other hand, its monthly overview is completely bullish.

LTC/USD 1-day Technicals

Technical factors (4-hour Chart):

  • Its price is currently above its 50-period EMA and at its 21-period EMA
  • Price at its middle Bollinger band
  • RSI is neutral (54.95)
  • Volume is on above-average levels

Key levels to the upside:          Key levels to the downside:

1: $174.5                               1: $163.7

2: $181.3                               2: $155.25

3: $195.5                               3: $149.3


Categories
Crypto Market Analysis

Daily Crypto Review, Jan 7 – Crypto Sector Market Cap Over $1 Trillion as BTC Approaches the $40k Mark

Most of the cryptocurrency sector ended up in the green as Bitcoin passed $38,000. Another thing to mention is that the overall industry market cap has reached past $1 trillion for the first time in the history of cryptocurrencies. Bitcoin is currently trading for $38,400, representing an increase of 10.78% compared to yesterday’s value. Meanwhile, Ethereum’s price has increased by 7.78% on the day, while XRP skyrocketed, gaining 46.55% of its value.

Daily Crypto Sector Heat Map

X Infinity gained 896.37% in the past 24 hours, making it the most prominent daily crypto gainer by far. It is followed by 7up Finance’s 298.93% and EveryCoin’s 278.57% gain. On the other hand, COVER Protocol lost 99.48%, making it the most prominent daily loser. It is followed by UniMex’s loss of 97.1% and Team Heretics Fan Token’s loss of 91.66%.

Top 10 24-hour Performers (Click to enlarge)

Bottom 10 24-hour Performers (Click to enlarge)

Bitcoin’s market dominance has moved down slightly since our last report, with its value currently being 68.6%. This value represents a 0.7% difference to the downside than the value it had when we last reported.

Daily Crypto Market Cap Chart

The cryptocurrency sector capitalization skyrocketed and passed the one trillion mark since we last reported, with its current value being $1,005 trillion. This represents a $33.51 billion increase when compared to our previous report.

_______________________________________________________________________

What happened in the past 24 hours?

_______________________________________________________________________

_______________________________________________________________________

Technical analysis

_______________________________________________________________________

Bitcoin

Bitcoin continued the upward trajectory and pushed past the previous all-time high with confidence, reaching a new high of $38,510 at one point. While the price did retrace after hitting the 37,800 at one point, but the 50-hour moving average created strong support, and BTC pushed back up to contest the all-time high level once again.

As we have mentioned many times, shorting of any kind and trading against the overall trend is most likely not optimal, and traders might find a good opportunity to long BTC each time it breaks the all-time high, as this is when it gets a large influx of buyers.

BTC/USD 1-hour chart

Bitcoin’s short-term technicals (4-hour and daily) are completely bullish, while its long-term overview is a bit more tilted towards neutrality.

BTC/USD 1-day Technicals

Technical factors (4-hour Chart):

  • Price is above both its 50-period EMA and its 21-period EMA
  • Price is near its top Bollinger band
  • RSI is in the overbought territory (72.04)
  • Volume is above average

Key levels to the upside          Key levels to the downside

1: $37,800                                 1: $35,880

2: $40,000                                 2: $34,800

3: $43,220                                 3: $33,100

Ethereum

Ethereum’s chart looks pretty similar to Bitcoin’s, as they both moved to the upside in the same manner. The second-largest cryptocurrency by market cap pushed past many support levels and reached $1,225 before descending slightly. Alongside Bitcoin’s move to new all-time highs, this move contributed the most to the overall crypto sector market cap passing the $1 trillion mark.

Ethereum is currently trading within a narrow range, bound by $1,169 to the downside and $1,211 to the upside. If ETH decides to move up, the next most likely resistance level will be the $1,341.5 level. If, however, it breaks this range to the downside, it has many support levels.

ETH/USD 1-hour Chart

Ethereum’s technicals on the daily, weekly, and monthly time-frames are fully tilted towards the buy-side, while its 4-hour technicals are slightly more neutral.

ETH/USD 1-day Technicals

Technical Factors (4-hour Chart):

  • Price is above both its 50-period and its 21-period EMA
  • Price is at its top Bollinger band
  • RSI is in the overbought area (73.41)
  • Volume is significantly above-average

Key levels to the upside          Key levels to the downside

1: $1,211                                    1: $1,169

2: $1,341.5                                 2: $1,080

3: $1,425                                    3: $1,050

Litecoin

Litecoin increased in price as well, but while its chart looks similar to Bitcoin’s and Ethereum’s, it’s important to notice that it did not break the high it made on Jan 4. In fact, Litecoin almost got to the $174.5 level but quickly pulled back to $165.

Litecoin found strong support in its 50-hour moving average, which held it above $165 and kept it from possibly breaking $163.7 to the downside.

Litecoin’s next move will most likely be highly dependent on Bitcoin’s short-term movement.

LTC/USD 1-hour Chart

Litecoin’s technicals are fully bullish on every single time frame and vary from “buy” to “strong-buy” indicators.

LTC/USD 1-day Technicals

Technical factors (4-hour Chart):

  • Its price is currently above both its 50-period EMA and its 21-period EMA
  • Price between its middle and top Bollinger band
  • RSI is nearing the overbought area (63.82)
  • Volume is above-average but descending

Key levels to the upside          Key levels to the downside

1: $163.7                                      1: $155.25

2: $174.5                                      2: $149.3

3: $195.5                                      3: $143.5


Categories
Crypto Market Analysis

Daily Crypto Review, Jan 6 – Bitcoin Retraces after Creating a New All-Time High; Sector in the Green

Most of the cryptocurrency sector ended up in the green as Bitcoin pushed towards the upside and created a brand new all-time high. Bitcoin is currently trading for $34,801, representing an increase of 12.63% compared to yesterday’s value. Meanwhile, Ethereum’s price has increased by 9.47% on the day, while LTC gained 6.53% of its value.

Daily Crypto Sector Heat Map

Foglory Coin gained 3809.54% in the past 24 hours, making it the most prominent daily crypto gainer by far. It is followed by COVER Protocol’s 2102.06% and Birdchain’s 683.22% gain. On the other hand, MINDOL lost 74.94%, making it the most prominent daily loser. It is followed by Scanetchain loss of 71.12% and XLMDOWN’s loss of 55.53%.

Top 10 24-hour Performers (Click to enlarge)

Bottom 10 24-hour Performers (Click to enlarge)

Bitcoin’s market dominance has moved up slightly since our last report, with its value currently being 69.3%. This value represents a 1.1% difference to the upside than the value it had when we last reported.

Daily Crypto Market Cap Chart

The cryptocurrency sector capitalization has increased over 100 billion since we last reported, with its current value being $967.49 billion. This represents a $122.12 billion decrease when compared to our previous report.

_______________________________________________________________________

What happened in the past 24 hours?

_______________________________________________________________________

_______________________________________________________________________

Technical analysis

_______________________________________________________________________

Bitcoin

Bitcoin has had another amazing bull run, with its price pushing from just below $30,000 all the way up to $35,879, setting a brand new all-time high. However, this is where the price hit a wall, and Bitcoin started retracing. The largest cryptocurrency by market cap is now trading right below the previous all-time high of $34,800 and is seemingly going further down.

With the volume being as high as it is, the most does not seem like it’s done yet. Traders should pay attention to how the price reacts to certain levels.

BTC/USD 4-hour chart

Bitcoin’s technicals show a strong tilt towards the buy-side with some neutral characteristics, with only the 4-hour time-frame showing full bullish tilt.

BTC/USD 1-day Technicals

Technical factors (4-hour Chart):

  • Price is slightly above both its 50-period EMA and its 21-period EMA
  • Price is near its top Bollinger band
  • RSI is near the overbought territory (65.11)
  • Volume is above average

Key levels to the upside          Key levels to the downside

1: $34,800                                 1: $30,807

2: $35,000                                 2: $28,337

3: $35,890                                 3: $26,340

Ethereum

Ethereum also moved to the upside, with its price slowly but surely going from $975 all the way up to $1,139 before retracing slightly. Its move, however, didn’t seem as forced as Bitcoin’s.

While the overall sentiment around Ethereum is bullish, the fact that it hit nearly the same high three times without passing it could indicate a possible short-term top and a retracement.

Traders should pay great attention to the area around above $1,125 and how ETH reacts to it.

ETH/USD 1-hour Chart

Ethereum’s technicals on the daily and weekly time-frames show an overall bullish tilt with no hints of neutrality coming from oscillators. On the other hand, the monthly and 4-hour time-frames show some signs of neutrality or even bearishness.

ETH/USD 1-day Technicals

Technical Factors (4-hour Chart):

  • Price is above both its 50-period and its 21-period EMA
  • Price is between its middle and top Bollinger band
  • RSI is in the overbought area (72.01)
  • Volume is significantly above-average

Key levels to the upside          Key levels to the downside

1: $1,047                                     1: $1,009

2: $1,080                                     2: $960

3: $1,169                                      3: $932

Litecoin

Litecoin moved in a much more narrow range than Bitcoin and Ethereum. Its price slowly moved towards the upside (with one hiccup that brought its price from $163 to $155) and reached as high as $165. However, this move didn’t create new highs or approach the recent ones either.

At the moment, Litecoin looks like a cryptocurrency that mirrors Bitcoin’s moves, but with less volatility. While this brings a bit of perceived safety, the truth is that the profit potential is also greatly diminished.

LTC/USD 1-hour Chart

Litecoin’s technicals on the 4-hour and monthly time-frame are completely bullish, while its daily and weekly overviews show some oscillators having bearish values.

LTC/USD 1-day Technicals

Technical factors (4-hour Chart):

  • Its price is currently above both its 50-period EMA and its 21-period EMA
  • Price between its middle and top Bollinger band
  • RSI is nearing the overbought area (65.96)
  • Volume is above-average but descending

Key levels to the upside          Key levels to the downside

1: $163.7                                      1: $155.25

2: $174.5                                      2: $149.3

3: $195.5                                   3: $143.5

Categories
Crypto Market Analysis

Daily Crypto Review, Jan 5 – Ethereum Outpaces the Market; Most Cryptos in the Red

Daily Crypto Review, Jan 5 – Ethereum Outpaces the Market; Most Cryptos in the Red

The cryptocurrency sector experienced volatility amongst cryptos as Bitcoin continues its retracement and Ethereum outpaces the market. Bitcoin is currently trading for $31,479, representing a decrease of 4.15% compared to yesterday’s value. Meanwhile, Ethereum’s price has increased by a whopping 11.70% on the day, while XRP gained 1.27% of its value.

Daily Crypto Sector Heat Map

Birdchain gained 1498.92% in the past 24 hours, making it the most prominent daily crypto gainer by far. It is followed by Folgory Coin’s 837.8% and Rewardiqa’s 720.43% gain. On the other hand, Basiscoin Share lost 98.58%, making it the most prominent daily loser. It is followed by Basiscoin Cash’s loss of 90.24% and Mith Cash’s loss of 78.91%.

Top 10 24-hour Performers (Click to enlarge)

Bottom 10 24-hour Performers (Click to enlarge)

Bitcoin’s market dominance has moved down slightly since our last report, with its value currently being 68.2%. This value represents a 0.5% difference to the downside than the value it had when we last reported.

Daily Crypto Market Cap Chart

The cryptocurrency sector capitalization has decreased since we last reported, with its current value being $845.71 billion. This represents a $14.82 billion decrease when compared to our previous report.

_______________________________________________________________________

What happened in the past 24 hours?

_______________________________________________________________________

_______________________________________________________________________

Technical analysis

_______________________________________________________________________

Bitcoin

Bitcoin has possibly ended its retracement and entered sideways trading as its price created a double bottom at the $30,000 mark. However, there was one point where the largest cryptocurrency by market cap dropped as much as 20% and broke $28,000 to the downside, but recovered almost instantly.

BTC is currently right above the $30,807 Fib retracement level and is fighting to stay above it. If it posts a candle that shows it consolidated above this level, we could see another push towards the upside. However, if it breaks the Fib retracement, we could see BTC looking for support at the $30,000 or $29,300 levels.

BTC/USD 4-hour chart

Bitcoin’s technicals are showing a strong tilt towards the buy-side, with only the 4-hour time-frame showing bearish oscillator values.

BTC/USD 1-day Technicals

Technical factors (4-hour Chart):

  • Price is slightly above its 50-period EMA and at its 21-period EMA
  • Price is near its middle Bollinger band
  • RSI is neutral (48.20)
  • Volume is slightly above average

Key levels to the upside          Key levels to the downside

1: $34,800                                 1: $30,807

2: $35,000                                 2: $28,337

3: $36,000                                 3: $26,340

Ethereum

Ethereum is certainly one of the most interesting cryptocurrencies in the last couple of days, with its price going from stagnation to skyrocket mode in a matter of hours. While many thought that the initial push above $1,000 is over and that ETH is destined to retrace below it, the second-largest cryptocurrency by market cap managed to do it again – just one day later.

The cryptocurrency managed to bounce off of one of its numerous support levels and propel its price back above $1,000.

Ethereum is now fighting for the $1,000 level, with its price barely staying above it.

ETH/USD 1-hour Chart

Ethereum’s technicals on all time-frames show an overall bullish tilt with hints of neutrality coming from oscillators.

ETH/USD 1-day Technicals

Technical Factors (4-hour Chart):

  • Price is above both its 50-period and its 21-period EMA
  • Price is near its top Bollinger band
  • RSI has left the overbought area (68.56)
  • Volume is significantly above-average

Key levels to the upside          Key levels to the downside

1: $1,047                                     1: $1,009

2: $1,080                                     2: $960

3: $1,169                                      3: $932

Litecoin

Litecoin ended its 2-day bull run after reaching bull exhaustion at the $174.5 mark, after which it started to consolidate. However, the consolidation phase looks like less of a consolidation phase and more like a fight for the $152 Fib retracement level.

Litecoin is currently losing the battle for $152 –  but even in the case of bears pushing it to the downside, its price has many support anchor points, most notably the zone between $135 and $142.

LTC/USD 1-hour Chart

Litecoin’s technicals on the 4-hour and monthly time-frame are completely bullish, while its daily and weekly overviews show some oscillators having bearish values.

LTC/USD 1-day Technicals

Technical factors (4-hour Chart):

  • Its price is currently above both its 50-period EMA and its 21-period EMA
  • Price is at its middle Bollinger band
  • RSI is neutral (58.54)
  • Volume is above-average

Key levels to the upside          Key levels to the downside

1: $163.7                                      1: $155.25

2: $174.5                                      2: $149.3

3: $195.5                                   3: $143.5


Categories
Crypto Market Analysis

Daily Crypto Review, Jan 4 – Bitcoin Retraces Below $32k, Ether Breaks $1k!

The cryptocurrency sector is trying to find an equilibrium but was mostly volatile in recent days, with BTC retracing slightly and Ethereum skyrocketing towards its all-time highs. Bitcoin is currently trading for $31,796, representing a decrease of 8.08% compared to yesterday’s value. Meanwhile, Ethereum’s price has increased by a whopping 24.61% on the day, while XRP gained 7.37% of its value.

Daily Crypto Sector Heat Map

Scanetchain gained 446.19% in the past 24 hours, making it the most prominent daily crypto gainer by far. It is followed by Amun Ether 3x Daily Long’s 246.1% and Education Ecosystem’s 195.84% gain. On the other hand, Basiscoin Cash lost 96.51%, making it the most prominent daily loser. It is followed by Wownero’s loss of 91.09% and Bridge Finance’s loss of 90.45%.

Top 10 24-hour Performers (Click to enlarge)


Bottom 10 24-hour Performers (Click to enlarge)

Bitcoin’s market dominance has moved down almost two percent since our last report, with its value currently being 68.7%. This value represents a 1.9% difference to the downside than the value it had when we last reported.


Daily Crypto Market Cap Chart

The cryptocurrency sector capitalization has increased greatly since we last reported, with its current value being $860.45 billion. This represents a $97.68 billion increase when compared to our previous report.

_______________________________________________________________________

What happened in the past 24 hours?

_______________________________________________________________________

_______________________________________________________________________


Technical analysis

_______________________________________________________________________

Bitcoin

Bitcoin had continued its move up slowly until Jan 2, when its price skyrocketed and reached as high as $34,800. With this being set as the new all-time high, BTC started retracing and consolidating within a wide range, bound by the all-time high to the upside and $30,807 to the downside.

Any strong pushes were easily foreseen by the gradual increase in volume, which is what traders should pay attention to when trading the largest cryptocurrency by market cap.

BTC/USD 4-hour chart

Bitcoin’s technicals are showing a strong tilt towards the buy-side. However, some of its time-frames show slight neutrality alongside the overall bullishness.

BTC/USD 1-day Technicals

Technical factors (4-hour Chart):

  • Price is slightly above its 50-period EMA and above its 21-period EMA
  • Price is near its middle Bollinger band
  • RSI is neutral (55.04)
  • Volume is slightly above average

Key levels to the upside          Key levels to the downside

1: $34,800                                 1: $30,807

2: $35,000                                 2: $28,337

3: $36,000                                 3: $26,340

Ethereum

Ethereum’s spike could be considered a late response to Bitcoin’s spike, as its price followed in direction but not percentage-wise when BTC pushed towards $35k. However, the second-largest cryptocurrency by market cap skyrocketed in the past hours, reaching as high as $1,169.

This push towards the $1k mark is historic, as the only real upside is the all-time high of $1,420 from Jan 2, 2020.

Ethereum is currently fighting to stay above the $1,000 mark, and its short-term future will be determined by it managing to stay above or retracing below this level.

 ETH/USD 1-hour Chart

Ethereum’s technicals look very much like Bitcoin’s, with the overall tilt being towards the buy-side, with oscillators tilting towards bearishness.

ETH/USD 1-day Technicals

Technical Factors (4-hour Chart):

  • Price is above its 50-period and at its 21-period EMA
  • Price is near its middle Bollinger band
  • RSI is neutral (60.37)
  • Volume is descending from above-average levels

Key levels to the upside          Key levels to the downside

1: $1,047                                     1: $1,009

2: $1,080                                     2: $960

3: $1,169                                      3: $932

Litecoin

Litecoin had an amazing 2-day run as its price increased from $124 all the way up to $175. However, the $175 mark stopped the bulls from reaching any higher, and Litecoin started retracing. The retracement also came as a response to BTC’s retracement, as the two cryptocurrencies are highly correlated.

Litecoin is now struggling to stay above the $155.25 level. However, its short-term price direction will most likely be decided by Bitcoin’s movements, rather than staying above or below any support/resistance levels.

 LTC/USD 1-hour Chart

Litecoin’s technicals on all time-frames are tilted towards the buy-side and show almost no bearish or neutral signs.

LTC/USD 1-day Technicals

Technical factors (4-hour Chart):

  • Its price is currently above its 50-period EMA and at its 21-period EMA
  • Price is at its middle Bollinger band
  • RSI is in the oversold territory (50.57)
  • Volume is currently on below-average levels

Key levels to the upside          Key levels to the downside

1: $163.7                                      1: $155.25

2: $174.5                                      2: $149.3

3: $195.5                                   3: $143.5


Categories
Crypto Daily Topic Cryptocurrencies

How to Mine Litecoin: No One Will Ever Tell You This

Litecoin is one of the most popular cryptocurrencies today. The currency is a clone of Bitcoin and appears to ride on the popularity of the pioneer cryptocurrency. However, the crypto has its own merits – like being a ‘lighter’ version of Bitcoin and thus being used in day-to-day transactions. Litecoin is faster than Bitcoin – having a block time of 2.5 minutes compared to Bitcoin’s 10 minutes, meaning it’s quicker and easier for Litecoin miners to make money. 

Litecoin was created in 2011 by Charlie Lee, a former Google engineer. He modeled it after Bitcoin but with certain modifications intended to help it scale compared to Bitcoin. At the time of writing, the currency has a per-token value of $69.54 and a market rank of #7 with a market capitalization of 4.59 billion. 

In this piece, we’ll take a look into the nitty gritties of mining Litecoin.  

#1. Mining equipment

In the early days of Litecoin, the cryptocurrency could be mined using CPUs and GPUs. Litecoin uses the Scrypt hashing protocol – the first successful cryptocurrency to use it. Lee opted for Scrypt instead of Bitcoin’s SHA-256 due to the former being lighter and also because”using Scrypt allows one to mine Litecoin while also mining Bitcoin.” 

However, it’s no longer possible to turn a profit when mining Litecoin with CPUs and GPUs. This is because as competition has ramped up for the currency, mining difficulty has increased, requiring miners to use application-specific integrated circuits (ASICs) developed specifically for the currency. One of the most popular ASICs for Litecoin include Bitmain’s Antminer and LTCMaster. ASICs tend to go for around $1,000 for older models and around $2,000 for newer models. It’s best to go for the newer models, which are more effective. 

 #2. Should you join a mining pool? 

Once you’ve identified which hardware to use, the next decision will be to mine solo or join a mining pool. A mining pool is a group of miners who share computing power to multiply the chances of finding a block and earn mining rewards. Mining alone means you will get to keep all the mining rewards plus a fraction of the transaction fees. (The current mining rewards are 12.5 LTC per block. This will be halved in the next Litecoin halving, which will happen in 2023). And even then, this will require that you have massive hash power (multiple ASIC machines). Mining with a single ASIC is almost guaranteed never to turn a profit. 

By contrast, concentrated computing power in pool mining makes it many times easier for the pool to discover new blocks and attain a reward. The reward is then distributed according to the contribution of each miner. Bear in mind pool mining itself is not guaranteed to turn a profit since it depends on chance, but earnings via a pool are more steady than solo mining. 

Before you join a mining pool, make sure to investigate it thoroughly. Some pools out there are outright scams, while others are just plain shady. Also, it’s not uncommon for a mining pool to fall victim to hacks. So always check a pool’s security history and how they handled any breaches, reputation, member reviews, and management team. Also, try not to keep large amounts of your proceeds with the pool. It’s good practice to transfer proceeds to your wallet as soon as possible. 

Some of the most trusted and popular Litecoin pools out there include F2Pool, LitecoinPool.org, ViaBTC, and ProHashing.

Litecoin: Cloud Mining 

ASICs and pools are not for everyone. Maybe you want to mine Litecoin and don’t have the means or desire to splurge on expensive hardware. Well, you’re in luck because there’s an option of cloud mining that allows you to pay a remote data center to do the mining for you.

With this option, you will be required to put up a certain amount of money – but not nearly as much as you would for an ASIC – to get access to the cloud mining platform. The more you invest, the more you stand to gain from the platform. 

We can’t stress this enough – cloud mining is even more susceptible to scams than mining pools. There are individuals out there who are happy enough to take strangers’ money without an actual mining operation going on on their side. This behooves you to do serious research before getting entangled with any cloud miner. One of the most reputable cloud mining sites is Scotland-based Hashflare, which also has data centers in Estonia and Iceland. Hashflare has been around since 2014 – demonstrating its credibility and staying power. 

Wallets 

The last thing you need to consider is where to store your Litecoin. You have a variety of options starting with the Litecoin Core Client. This is a wallet by the Litecoin Foundation and is open-source, feature-packed, and updated regularly to make it more robust and easier to use. With the Litecoin Core Client, you can store, send, and receive Litecoin as well as view the transaction history of the blockchain. To use this wallet, you have to download the full blockchain on your computer. Of course, it will take up a lot of space, but it pays a lot of security dividends in the long run. The wallet supports Windows, MacOS, and Linux. By using Litecoin Core, you also contribute to the network’s security and decentralization since you’re running a ‘full node.’ 

You also have the option of a cold storage wallet. A cold wallet is one that’s not connected to the internet. This means it is unhackable, and hence very safe. If you have a large sum of Litecoin, a cold storage wallet is your best go-to option. There are also paper wallets that constitute a physical paper in the form of a QR code or a string of alphanumerics. A paper wallet is safer than an online wallet, but it’s vulnerable to theft and damage through fire, water, and wear and tear. You can increase your paper wallet security by laminating it and putting it in a safe place that only you know about. These days, people even strongly advocate for ‘brain wallets,’ which constitute memorizing a seed phrase that you can use to recreate your private key. Obviously, a brain wallet is the most secure of all these options.

Other people choose to keep their crypto funds on exchanges. Exchanges have the advantage of quickly swapping your crypto for fiat. However, this option is not recommended. That’s because exchanges are famously the target of hacking, and you can lose your money in the case of a security breach. Also, you have limited control over your Litecoin in such a wallet. 

Final Thoughts 

Litecoin is one of the most relevant cryptocurrencies, and investing in it through mining is a savvy move. Of course, there are risks to every profitable endeavor, so make sure to do your due diligence before you go all in. 

Categories
Crypto Videos

Litecoin Gets its Own Visa Debit Card!

Litecoin Gets its Visa Debit Card


The first Litecoin-native Visa debit card is being launched by BlockCard.
The creator of Litecoin, Charlie Lee, said that this is their second attempt at creating a Litecoin-native card as the previous one failed: “We worked with LitePay on a debit card but ultimately failed when they went out of business.”
Lee also made a few distinctions between this Litecoin-native debit card and other cryptocurrency cards that only support Litecoin, but are not Litecoin-native:

“There are other crypto debit cards that are available today, and most of them support Litecoin. However, they only support funding with LTC. This card is natively Litecoin, so funds are kept in Litecoin until you swipe the card.”
Although Litecoiners already have the option to sign up for the card, the service itself will be available only in a few weeks. On a lighter note, Lee clarified his opinion on crypto maximalism, saying that there is no such thing as a “Litecoin maximalist”:

“I don’t think that that even exists. Most Litecoiners support and hold Bitcoin also.”
Users will be able to deposit any of the twelve most popular cryptocurrencies, including all the major stablecoins. According to Lee, somewhere around 300 users have signed up so far. In the meantime, Litecoin has continuously stayed among the top ten cryptocurrencies by market capitalization. It also has one of the biggest followings on social media.

Categories
Cryptocurrencies

Litecoin Core Wallet Review: Features, Pros, Cons, Safety, And Ease Of Use

Litecoin Core is the primary Full node desktop client of the Litecoin network. It was launched in 2011 by the Singapore-based Litecoin Foundation under the stewardship of Charlie Lee, Richards Franklin, and Xinxi Wang. It is one of the few and most effective full-stack blockchain clients available. It will only support the Litecoin cryptocoins, and you need to download the entire blockchain before you can start using it to store the coins and transact.

The Litecoin Foundation is regularly updating the Litecoin Core Wallet and introducing more operational and security features. But how safe and easy to use is the desktop wallet? What are its key features? In this Litecoin Core review, we explain how it works and detail everything else you need to know about this wallet.

We start by looking at its key features:

Key Features:

Full node nature: Most other crypto wallets will only require you to download a light desktop or mobile app. When using Litecoin Core client, however, you have to download the entire blockchain onto your computer. And while this makes it more secure than apps, it is time-consuming and eats up most of your computer space.

Compatible with different OS: The desktop client is highly versatile and compatible with virtually all popular operating systems, including Windows, Linux, and macOS.

Faster transaction processing: The desktop Litecoin client integrates the SegWit protocol used on the Litecoin Blockchain. This integration makes Litecoin transactions initiated on the platform relatively faster and less expensive.

Supports multiple wallets: The most recent update to the Litecoin desktop client introduces multiple wallets. You can now open and host multiple Litecoin wallets on the same desktop wallet.

Security features:

Open source: One of Litecoin Core’s key strengths is that it is built on an open-sourced technology. This implies that it has been vetted and audited by crypto industry experts with possible security loopholes identified and patched. The regular updates provided by the Litecoin Foundation have also become great avenues through which patches to the client are provided.

Highly encrypted: When installing and activating the Litecoin Core wallet, you will be presented with the encryption option. You have the option of encrypting the desktop wallet with a strong multi-character password or not. However, note that you can never recover your private keys should you lose or forget the passphrase.

Physical wallet backup: Litecoin core client makes it possible to back up the entire wallet on an external drive. You are especially encouraged to backup your wallet every time you engage in a transaction that changes your digital asset balances.

Privacy and anonymity guarantee: Litecoin Core integrates a number of features that promote privacy and anonymous transactions. It, for instance, is VPN compatible, ensuring that it helps you mask your IP address when using the desktop wallet. Moreover, you can access the wallet via the highly anonymous Tor Browser.

How to set up a Litecoin Core wallet?

Step 1: Head over to the Litecoin core website. Search for wallets and click on the version that matches your computer’s operating system

Step 2: Download and click on install. Note that downloading and synchronizing the desktop client will take time – be patient.

Step 3: After installation, choose to encrypt the wallet using a strong and multi-character password.

Step 4: Finish the installation process by clicking ‘OK’ on the popup window, after which the wallet shuts down automatically.

Step 4: Reopen the wallet and back it up to a USB device.

Step 5: The desktop client is now set and ready to use.

How to add/receive crypto to your wallet

Step 1: Log in to the Crypto wallet and click on the receive icon.

Step 2: Copy your wallet address and send it to the person sending you Litecoins.

Step 3: You can also have them scan the QR Code address.

Alternatively: Use the request pay option:

Step 1: Click on the ‘Receive’ icon and select ‘Request Payment.’

Step 2: Enter the amounts you wish to receive, the message you wish to send, and the label. Here, the label refers to the name of the individual from whom you wish to receive the coins.

Step 3: Click ‘Receive Payment’ and wait for your coins to reflect in your wallet.

How to send crypto from your desktop client

Step 1: Log in to the Litecoin Core desktop wallet and click on the ‘Send’ icon.

Step 2: On the ‘Pay To’ section, enter the recipient’s wallet address.

Step 3: Enter the number of coins you wish to send.

Step 4: Confirm that these details are correct and hit ‘Send.’

Litecoin Core wallet ease of use

The Litecoin Core desktop client has relatively minimalistic features that make it quite easy to use. Downloading and installing the wallet, though slow, is quite easy and straightforward. Additionally, the wallet features a clean and highly intuitive dashboard that makes it easy to use for both expert crypto traders and beginners. The highly responsive customer support is also ready to walk you through the installation process and guide you on how to interact with the platform.

Litecoin core wallet cost and fees

The Litecoin Core wallet is free to download and install. You will, however, be charged a fee every time you send Litecoin from your wallet. Recent upgrades to the Litecoin Desktop client have introduced a dynamic pricing structure. This gives you the choice of determining the price and speeds at which your Litecoin transactions are fulfilled. Ideally, higher transaction fees translate to faster transaction processing while lower fees often equate to lower transaction speeds.

Plus, unlike most wallets that will automatically deduct the transaction fee from your balance, Litecoin Core desktop client gives you a choice. You can choose to have the fees deducted from either the account balance or the amounts being sent.

Litecoin Core wallet customer support

Litecoin has a readily available customer support team. You can easily connect with Litecoin developers and support teams on their different social media platforms. They regularly post important news and updates on these platforms.

You can also interact with these developers and get assistance from your peers on the Litecoin Core platform.

The website, desktop client, and user platforms are also multilingual. They currently support over 13 international languages, including German, Chinese, English, Russian, Dutch, Polish, and Greek.

What are the pros and cons of the Litecoin core wallet?

Pros:

  • The desktop wallet is relatively safe and embraces multiple security features.
  • Litecoin Core is free and employs a dynamic pricing structure.
  • Help is readily available from the wallet developers via email and social media, as well as from the Litecoin platform users on the platform.
  • Litecoin Core desktop client is also simplistic and easy to use for both beginners and expert crypto traders.
  • You can encrypt the Litecoin client with a passphrase and back it up in an external drive or USB.

Cons:

  • The desktop wallet only supports one digital currency – Litecoin.
  • You need to download the entire Litecoin core blockchain into your desktop if you wish to use the wallet.
  • The wallet has limited operational features.
  • It does not embrace such effective security features as two-factor authentication.

Comparing Litecoin Core desktop client to other crypto wallets

Litecoin Core vs. eToro

Some of the similarities between Litecoin Core desktop client and eToro crypto wallet app are their user-friendliness and inexpensive transaction fees. They, however, are different when it comes to the number of supported cryptocurrencies and integrated security features.

eToro carries the day with regards to the number of supported cryptos. Litecoin can, on the other hand, be said to be more secure as it employs more advanced security features like using open source technology and VPN access.

Bottom line: Is the Litecoin Core wallet safe?

Yes, Litecoin Core desktop client is relatively safe. Since its establishment in 2011, the wallet has been subjected to several technical upgrades, each introducing a new security feature. So far, the Litecoin desktop wallet has employed several highly effective security features. These include open-sourced technology, physical backup, password encryption, VPN/Tor Browser access for improved privacy and anonymity. We, however, observe that the wallet doesn’t employ such security features as two-factor authentication and multi-signature access.

Categories
Cryptocurrencies

Loaf Wallet Review: How Safe And Effective Is This Mobile-Only Crypto Wallet?

The Loaf wallet is often described as the official and standalone mobile wallet for Litecoin. It was created and introduced to the crypto industry by Charlie Lee and the Singapore based Litecoin Foundation. And according to the Loaf wallet website, it was established to help Litecoin enthusiasts store and trade Litecoins using their mobile devices. In 2019, however, this mobile-first Litecoin wallet app changed its name to LiteWallet app.

With the rebranding came about significant changes to the wallet that include the introduction of new operational and security features. In this Loaf wallet review, we will be vetting the effectiveness and the safety of this mobile crypto vault.

Let us start by looking at its operational features.

Loaf wallet key features:

Lightweight: Litecoin was initially designed to provide a faster alternative for the legacy digital coin, Bitcoin. Similarly, the Loaf wallet is specially designed to offer faster transaction processing speeds. To achieve this, the Loaf Wallet app is created using a highly simplified code and integrates the “Simplified Payment Verification” protocol that speeds up transactions by providing a direct link to the Litecoin Network.

Sleek design: Loaf wallet design is modern and features a clean user dashboard. It is easy to navigate and hosts an in-built price ticker that you can use to track your portfolio.

Mobile-specific: Unlike most other Litecoin wallets that are either web-based or desktop integrated, the Loaf wallet is mobile-first. It was designed to provide Android and iOS phone users with a secure vault that they could use to store, manage, and trade Litecoins.

Simplex integration: A recent update to the Loaf wallet has made it possible for individuals to buy crypto with fiat currency and credit cards. It integrates the all-popular Simplex payment service provider that facilitates fiat-to-crypto conversions.

Introduction of Loaf wallet debit card: According to the Loaf wallet website, the Litecoin Foundation is on the verge of launching the first Litecoin based Crypto debit card. The card will be Loaf wallet integrated and furthers the mobile wallet app’s versatility.

Reputation: Loaf wallet has the backing of the Litecoin Foundation and some of the most influential thought leaders in the crypto community. This makes the wallet one of the most reputable Litecoin-specific crypto mobile app.

Loaf wallet security features:

Password and Biometrics support: Like most other crypto mobile apps, the Loaf wallet is secured with a passphrase. This not only eliminates unauthorized access to the wallet but also serves as an encryption tool. Additionally, you can secure the crypto wallet app and set transaction authorization limits using the Touch ID biometrics.

Open sourced: Loaf wallet is built on an open-sourced technology. Anyone can view, audit, and submit recommendations on possible security loopholes. The wallet app has since been audited by numerous internet security experts who have found it to be safe and free of any bugs or malicious codes.

AES encryption: The Loaf wallet mobile app uses AES hardware encryption to encrypt the app data. Every piece of information stored in here, from the private keys to app passwords, is highly encrypted. The crypto wallet app’s communication with third party sites and apps is also highly encrypted.

Non-custodial: The non-custodial nature of the wallet implies that your private keys are stored in your mobile device and not Litecoin Foundation servers. You, therefore, have absolute control over your private keys.

Recovery seed: When installing the Loaf wallet mobile app, you will be provided with a 12-seed recovery phrase. Record these on a piece of paper and store them safely offline. You will need it to reset the app password and recover lost private keys.

How to set up Loaf wallet

Step 1: Go to the Loaf Wallet official website (now LiteWallet) and download the wallet app for your Android or iOS device

Step 2: Once installed, the app will ask if you wish to ‘Create a new Wallet’ or want to ‘Restore’ your private keys. Click on create a new wallet

Step 3: Set the app password. It needs to be unique, yet easy to remember

Step 4: The app will provide you with 12 random words that form the recovery seed. Write them down in their correct order

Step 5: Enable Fingerprint Authentication (optional and can be enabled or disabled on the settings section)

Step 6: Your Loaf wallet mobile app is now active. You can start adding Litecoins and initiating transactions

How to add/receive crypto into Loaf wallet

Step 1: Log in to the Loaf wallet and on your user dashboard click ‘Receive’ to reveal your receiving wallet address

Step 2: Copy the address and send it to the party sending you Litecoins

Step 3: Wait for the digital assets to reflect

How to send crypto from Loaf wallet

Step 1: Log in to your Loaf wallet mobile app and click on the ‘Send’ tab

Step 2: Paste the recipient wallet address, followed by the amount to be sent.

Step 3: Confirm that the transaction details are correct and hit send.

Loaf wallet ease of use

The process of installing and activating the Loaf wallet mobile app is quite straightforward. The app also employs a relatively simple design with a clean and highly intuitive user dashboard. These, plus the ease of initiating Litecon transactions, make Loaf Wallet easy to use for both expert and beginner crypto traders.

Loaf wallet cost and fees

The loaf wallet crypto mobile app is free. Additionally, the Litecoin Foundation will not charge you storage fees when you store private keys in the wallet.

A transaction fee charged by the Litecoin Network will, however, take effect every time you send Litecoins from your wallet. This fee will vary based on the transaction amounts and often starts from 0.002 LTC. The average transaction price on the LTC network currently stands at $0.206, while the Median fee is $0.06.

Loaf wallet customer support

There are two primary ways of seeking assistance when using the Loaf wallet. Start by joining the Litecoin Foundation community forum and have all your queries answered by both the wallet developers and more experienced wallet users. For more personalized queries, however, we recommend that you engage the wallet developers by messaging them on such social media channels as Reddit, Twitter, and Facebook.

What are the pros and cons of Loaf wallet

Pros:

  • Loaf wallet is highly intuitive and easy to use for most both expert and beginner Litecoin traders.
  • It has embraced multiple security features, including biometrics, open-sourced code, and a non-custodial approach that makes it extra safe.
  • The crypto wallet app integrates SPV technology and links with the Litecoin network directly for faster transaction processing.
  • Loaf wallet recently integrated Simplex for fiat-to-crypto conversions and is contemplating the launch of the Loaf wallet crypto debit card.
  • The mobile crypto app is free to use and charges relatively low transaction fees.

Cons:

  • The crypto wallet app will only support Litecoin.
  • The wallet app isn’t immune to the inherent risks associated with hot wallets.

Verdict? Is the Loaf wallet safe?

Well, the Loaf wallet has embraced some of the most popular security measures aimed at keeping the wallet and its contents safe. It combines the password with biometrics, backs up the wallet with a recovery seed, gives the user absolute control of their private keys, and uses AES technology to encrypt the wallet contents. These, plus the fact that the app was developed and is maintained by the Litecoin Foundation, make Loaf wallet one of the safest crypto mobile apps available today.

Categories
Cryptocurrencies

LiteVault Wallet Review 2020: Features, Pros, Cons, and Fees

LiteValut is a Litecoin-specific web wallet. It was developed and introduced to the crypto industry by an anonymous crypto developer referred to as ‘Someguy123.’ Apart from its close association with the Litecoin blockchain, Litevault hosts unique operational and security features. Questions are, however, abound with regards to the safety of the web wallet given that it is not regulated, it is developed and maintained by anonymous entities, and stores its client’s private keys in company servers.

In this review, we will be explaining everything you need to know about the LiteVault web wallet. We will be examining factors such as its key operational features, security measures in place, ease of use, and the number of supported currencies before comparing it to equally popular web wallets.

Key Features:

Fast transaction processing: Litevault is extremely light. Unlike most other full-stack wallets and apps that require you to download the entire blockchain, Litevault is web-based. Private keys are stored online, and all the crypto-transactions are hosted on the company servers. This not only saves your computer space but also guarantees faster execution of Litecoin transactions.

Highly intuitive: Litevault also has a highly decongested user interface that makes it easy to use for both expert and beginner traders.

Single currency wallet: Litevault web wallet is Litecoin-specific. This implies that it will only support the Litecoin digital currency.

Integrates with payment processors: Ideally, the single currency nature of the web wallet means that you can only deposit Litecoin into the wallet. Litevault has, nevertheless, partnered with several payment-processing companies like Changelly that facilitate fiat-to-Litecoin conversions.

Custodial web wallet: Unlike most crypto wallet apps that give you absolute control over your wallet, Litevault is custodial. Instead of storing your private keys in your computer or mobile device, LiteVault stores your private keys on the company servers.

Multiple wallets: There is no limit to the number of Litecoin wallets you can attach to your Litevault crypto wallet.

Security features:

Password: Like any other web wallet or crypto wallet app, Litevault is password protected. You get to set a strong password during account registration. The password serves both the purposes of encrypting the wallet and restricting unauthorized access.

Two-factor authentication: In addition to password protection, Litevault adds a security layer through two-factor authentication. But unlike other wallets that use your phone number to activate 2FA, Litevault uses your email address.

Litevault encryption: Litevault uses in-browser cryptography to encrypt all the client-server communications. According to Litevault, the data is encrypted right after it leaves your browser, and before it reaches the Litevault servers. This ensures that the company employees never have access to your private keys or any other sensitive user data.

Open sourced: Litevault crypto wallet is built on an open-sourced technology that is vetted and approved by the crypto industry experts. The open-sourced nature of the platform ensures that virtually anyone can view and audit its source code.

Back up your keys in a physical device: While Litevault doesn’t store your private keys on your device, you can still backup and export your digital assets. You can export the decrypted version of the private keys as a JSON file and store it in a USB drive or another wallet.

How to set up Litevault wallet

Step 1: Head over to the official Litevault website and click ‘Register.’

Step 2: On the account registration page, enter your email address (optional), and click on ‘Create Account.’

Step 3: The Litevault site will provide you with a unique identifier that you can use as your username

Step 4: Your account is set, and you can now start adding and transacting in Litecoins.

(Note: While the email address is not mandatory, you are advised to add it to your account if you intend to activate two-factor authentication)

How to add/receive crypto into Litevault wallet

Step 1: Log in to your Litevault web wallet and on the dashboard, click on “Receive (manage address)”

Step 2: Copy the wallet address and send it to the parties sending you Litecoins.

Step 3: Wait for these Litecoins to reflect on your Litevault wallet.

How to send crypto from Litevault wallet

Step 1: Log in to your Litevault web wallet and on the user dashboard, click on the “Send” tab

Step 2: If you created multiple wallets, select the address from which you would like to send the crypto

Step 3: Enter the recipient’s wallet address and the number of Litecoins you would like to transfer

Step 4: Confirm that these details are okay and hit send.

Litevault wallet ease of use

The Litevault web wallet user dashboard is clean and easy to use. It is highly intuitive and only features the most important tabs, plus it recently introduced the colorism aspect where different color tags are used for easier in-wallet navigation.

Litevault wallet cost and fees

Creating a Litevault web wallet account is free. Further, you won’t be charged for storing your Litecoins in this wallet.

You, however, will be charged network fees in the name of transaction fees every time you send Litecoins to another wallet or exchange. This transaction fee is highly variable and largely depends on the transaction amounts. These are charged by the Litecoin network administrators and not Litevault.

You will also include currency conversion fees if you buy crypto using fiat through fiat-to-crypto conversion sites like Changelly. This amount includes the transaction charge imposed by your credit/debit card provider and the conversion fees by Changelly.

Litevault wallet customer support

There are two primary ways of getting assistance when using the Litevault web wallet. First, you can rely on their very elaborative FAQs section. Here they address some of the most common challenges LiteVault wallet users face. These may include missing transactions, incorrect balances, the send button not working, or the transaction fee tab that fails to capture the entire amount. The page explains how you can solve each of these changes.

If any of these problems persist, you can reach out to the LiteVault support team via email or directly message them on Twitter.

What are the pros and cons of LiteVault wallet

Pros:

  • Litevault web wallet is easy to use and has a straightforward registration process.
  • You can create multiple Litcoin addresses on one LiteVault web wallet.
  • Litevault has employed several security features that include open-sourcing its technology.
  • LiteVault makes it possible to backup and export it to a USB drive or another wallet.

Cons:

  • It is prone to inherent security limitations associated with hot wallets.
  • It is not regulated.
  • It stores your private keys on the company’s servers, and this increases the risk of loss.
  • It only supports one digital currency – Litecoin.

Comparing Litevault to other desktop Litecoin wallets.

LiteVault vs. Litecoin Core desktop client

LiteVault web wallet and the Litecoin Core desktop client have just but one significant similarity – they both are Litecoin-specific wallets. Their key differences include the fact that LiteVault is web-based and holds coins on behalf of its clients while Litecoin Core is a full-stack desktop client that hosts client private keys within their device. Registering on LiteVault is quite straightforward, as it doesn’t require you to download an app while LiteCoin Core demands that you download the entire blockchain.

Verdict? Is LiteVault wallet safe?

The web wallet has placed several security features aimed at making it the most secure web wallet. It has open-sourced the technology used to create the wallet, it is possible to backup and import your private keys, and uses in-browser cryptography to encrypt all user data. These play a key role in improving the wallet’s security. However, we must observe that while these make the wallet relatively safe, it is still exposed to the inherent problems associated with any hot crypto wallet.

Categories
Forex Signals

Litecoin Shows Two Potential Scenarios

Litecoin is progressing slightly upward within a complex structural series, which leads to foresee two possible scenarios.

The cryptocurrency Litecoin against the US Dollar (LTC/USD), in its 8-hour chart, shows the plummet that led it to lose more than 70% of its value since February 13th when the price topped at level 84.193. 

Once Litecoin hit the top at 84.193, the price made a three-wave bearish sequence, which ended on March 13th when the price found fresh buyers at level 24.850. In the previous chart, we distinguish this structural series identified in the waves ((a)-((b))-((c)) of Minute degree in black.

After LTC/USD completed the wave ((c)), the price action began to advance in a complex structural series with its internal movements composed of three waves. This sideways movement with a slightly upward bias leads us to foresee two potential scenarios for currency crypto.

Scenario 1 – Triangle Pattern in Progress

The first scenario considers the possibility that Litecoin advances in a triangular formation belonging to a wave B of Minor degree labeled in green.

According to the Elliott wave theory, a triangle pattern is composed of a series of five internal segments, which is subdivided into three waves following the 3-3-3-3 structure. Likewise, within a price cycle, this pattern tends to appear in waves 4 and B.

Scenario 2 – Developing a Leading Diagonal

The second scenario presents the option that the price action develops an ending diagonal pattern.

This type of pattern is composed of five internal waves overlapped one each other and follows a 3-3-3-3-3 sequence.

If the price action develops this scenario, the next movement should correspond to a wave 2 of Minor degree, and it should be composed of a three-wave structural series.

The main consequence of this scenario would be that, once the wave 2 completion, Litecoin should perform a bullish wave 3.

At the same time, considering the alternation principle of the wave theory, this third wave should have greater upward momentum than that momentum observed in the current wave in progress.

In conclusion, our short term preferred positioning is on the neutral side until the completion of the current formation.

Categories
Forex Assets

‘LTC/USD’ – Understanding The Crypto/Fiat Pair & Trading Costs Involved

Introduction

Cryptocurrencies are traded in pairs by pairing them with a fiat currency. Always, the cryptocurrency is written on the left and the fiat currency on the right. LTC/USD is a cryptocurrency, which is an abbreviation for the Litecoin versus the US Dollar. Like the Bitcoin and Ethereum, Litecoin is extensively traded in the exchange market.

Understanding LTC/USD

The market price of LTCUSD depicts the value of the US Dollar, which is equivalent to 1 Litecoin. It is quoted as 1 LTC per X USD. For example, if the value of LTCUSD is 41.69, then one Litecoin is worth 41.69 US Dollars.

LTC/USD specifications

Spread

Spread is the difference between the bid and the ask price in the market, where bid price is given considered when shorting a pair and ask price when going long on a pair. The varies from broker to broker. It also differs based on the type of execution model used. Below are the spreads for the LTC/USD pair for both ECN & STP accounts.

  • Spread on ECN: 50 pips (0.5 USD)
  • Spread on STP: 60 pips (0.6 USD)

Fee

ECN brokers charge some commission on every position a trader opens and closes. The fee for ECN accounts is about $0.18 per standard lot, which corresponds to 18 pips.

Slippage

Slippage is the difference between the price asked by the user and the price given by the broker. There is this difference due to two reasons – High market volatility & broker’s execution speed.

Trading Range in LTC/USD

Below is the trading range table for the LTCUSD, which represents the minimum, average, and maximum volatilities of a pair for different timeframes using the ATR indicator. These values can prove to be helpful for assessing one’s profit/loss on a trade.

Procedure to assess Pip Ranges

  1. Add the ATR indicator to your chart
  2. Set the period to 1
  3. Add a 200-period SMA to this indicator
  4. Shrink the chart so you can assess a large time period
  5. Select your desired timeframe
  6. Measure the floor level and set this value as the min
  7. Measure the level of the 200-period SMA and set this as the average
  8. Measure the peak levels and set this as Max.

LTC/USD Cost as a Percent of the Trading Range

The cost as a percent of the trading range represents the variation of cost on a trade based on the change in the volatility of the market. And these variations are indicated as a percentage. Using the magnitude of the percentages, we shall determine the ideal times of the day to trade this coin.

ECN Model Account

Spread = 50 | Slippage = 5 |Trading fee = 18

Total cost = Slippage + Spread + Trading Fee = 18 + 50 + 5 = 73

STP Model Account

Spread = 60 | Slippage = 5 | Trading fee = 0Total cost = Slippage + Spread + Trading Fee = 5 + 60 + 0 = 65

Trading the LTC/USD

LTCUSD is a crypto-fiat pair that has got enough volatility and liquidity to trade in the market. LTC is the fourth highest traded coin in terms of volume. However, it is not apt to trade anytime during the day. There are ways through which one reduces their costs for the same trade.

In the above table, if the percentages are high, then the costs are very high and vice versa. So, the cost is more for low volatile markets and less for high volatile markets. If you are a scalper or short-term trader, you may trade when the volatility is high as the profit margin is small, and you can avoid high costs.

Positional traders – these traders usually aim for large movements, and high costs become a little insignificant for their big pip movements. So, such traders may trade when the volatility is around the average values. Finally, it is not advisable to trade during low volatilities because the costs are high, and there is barely any movement in the market.

Slippage is a variable in total costs that can be eliminated by placing orders as ‘limit’ or ‘stop.’ We hope you found this analysis on LTCUSD useful. Stay tuned for more informative content. Cheers.

Categories
Crypto Guides

Litecoin – Short guide to The Bitcoin Of Altcoins!

Introduction

Litecoin is an early Bitcoin spinoff as it was started in October 2011. It was created by Charlie Lee, who was a Google employee and a former director at Coinbase. Litecoin is a peer to peer cryptocurrency released via an open-source client through Github under the MIT/X11 license. It is one of the most commonly traded coins in the world of cryptocurrency and has a market value of billions. Forked initially from Bitcoin protocol, Litecoin takes the underlying source code from Bitcoin and making specific changes to increase the transaction speed of the network.

Objective

Litecoin is famously called silver to the bitcoin’s gold, i.e., in the world of cryptocurrency; if bitcoin is gold, then Litecoin is like silver. Mainly Litecoin was developed to overcome the shortcomings of Bitcoin. When it comes to the block time (the time taken to generate a block), Litecoin takes 2.5 mins to create a block while bitcoin takes 10 mins for the same. Hence, the Litecoin network is four times faster than the Bitcoin network.

Consensus Used

Litecoin uses a proof of work algorithm called Scrypt. Unlike Bitcoin’s Proof of work algorithm (SHA 256), Scrypt is more efficient as it prevents customization for hardware solutions and favors high-speed random-access memory. Hence miners find it easy to mine without much complexity as this algorithm allows them to use central processing units or graphics processing units.

Market Capitalization

Litecoin is in sixth place in terms of market cap in the cryptocurrency world with $3.9 Billion value while the price of each coin is at $61.70 as of October 27th, 2019. 63.5 million number of coins are in circulation in the market with 24-hour trading volume as $4.3 Billion.

Price History

Litecoin was traded first with a price of $4.30 in April 2013. By November 2013, it was selling at a double-digit price of $35.78. The form then has seen a continuous downfall and maintained a moderate standard rate until April 2017. It had seen a slow and steady rise from April 2017 with $10.28 to $297.18 in Jan 2018. The coin has yet again seen a downfall in 2018, with a price of $30.99 by December 31st, 2018. This crypto has been performing well in 2019 when compared to the previous year, with its highest rate in the year with $145.45 in June 2019. Industry experts are bullish about the growth of the coin due to its transaction speed and other vital properties.

Total number of Coins

Cryptocurrencies have a cap when it comes to production. While Bitcoin has a cap of 21 million coins, Litecoin has a cap of 84 million coins, which means only 84 million Litecoins can be ever mined from the network.

Rewards

For running and maintaining the network, the miners are rewarded for each block generated. Litecoin network rewards the miners with 25 Litecoins for every block generated. However, the reward gets halved for every 8,40,000 blocks made. In August 2019, the network halved the rewards as the milestone was reached, and hence the reward as of now per block is only 12.5 LTC.

Bottom line

The main aim of any cryptocurrency is to stabilize itself as a medium of exchange. While Litecoin has approximately around 100,000 users, it is nowhere near to be the standard medium of exchange amongst the cryptocurrencies. Still, as the usage of cryptocurrencies increases, Litecoin holds an excellent position to attain the place due to its transaction speed.

Categories
Crypto Market Analysis

Daily Crypto Review, Oct 23 – Stablecoins may be considered securities, crypto markets in the red today

The cryptocurrency market is in the red for the past 24 hours. Most of the day has passed by without any downside resistance whatsoever. There has not been any new money coming into the markets as volume seems to be a bit lower than average. However, the downward-facing moves were not weak, but rather steady and stable. The market is now trying to find a price level to consolidate. As for the top3 cryptocurrencies, Bitcoin went down 3.03%, while Ethereum lost 4.3% of its value and. XRP was down 3.01% in the past 24 hours. Out of the top50 cryptocurrencies, BAT performed the best with its gains reaching over 7.5%.


Bitcoin’s dominance increased a fraction of a percent when compared to yesterday’s value. It now sits at 66.5%, which represents a 0.01% increase from the previous day.


Most cryptocurrencies ended up being in the red in the past 24 hours. This, of course, slightly increased the value of the cryptocurrency market as a whole. The industry now has a market capitalization of $217.4 billion, which represents a $5 billion decrease from the previous day.

What happened in the past 24 hours

Cryptocurrencies have had both positive and negative news in the past 24 hours.

As reported by CoinDesk, Morgan Creek Digital managed to raise $60.9 million for its second blockchain venture capital fund. It seems that two pension funds invested $50 million into the project. This is more than double what they initially started with ($21 in the first blockchain fund).

The US Congress may consider a bill which would classify stablecoins as securities. This bill draft was published on Tuesday by Rep. Sylvia Garcia. The bill wants to regulate stablecoins under the Securities Act of 1933, seeking to provide clarity in an area the bill suggests lacks regulatory guidance.

Technical analysis

Bitcoin


Bitcoin has managed to break a bull flag downwards, making quite a bearish announcement to the market. If we take a look at the charts, the downtrend that started on Sep 30 ended up with a bull flag that broke upwards and increased in price right to the 161.8% of the downwards-facing move. After that, another similar downtrend started and we’ve come to the point when a bull flag was starting to rise. Everyone was expecting it to break upwards and Bitcoin to attempt to reach new highs (a 161.8% increase would mean a price of $9,440).

However, Bitcoin managed to fail the pattern and broke it downwards. Its price stabilized at just below $8,000.

Ethereum

Ethereum has lost over 4% of its value in the past 24 hours. It seems to be forming a falling wedge pattern on the daily chart. One more descending move is to be expected before Ethereum could attempt a price increase. However, if that does not happen, even a price of $110 is not excluded.


At the moment, Ethereum is sitting at $167, with a big support line being at $157. Its volume is at extremely low levels and RSI is approaching oversold territory.

XRP

XRP broke its ascending trend range and fell to $0.288. After creating a range that it moved in all the way from Sep 19 until now, XRP managed to break it downwards. It is now trying to recover and get back into the range, but the attempt has been unsuccessful so far.


XRP’s volume is average while its RSI is neither oversold nor overbought. It would take a significant increase in bull power in order for XRP to get back in its lane. If that does not happen, however, XRP has strong support sitting at $0.266.

Categories
Cryptocurrencies

Understanding Litecoin – A step by step guide

Litecoin is a peer to peer, decentralized digital currency that is based on the Bitcoin protocol. It uses Scrypt as its proof of work (an algorithm for confirming transactions by other network participants). Litecoin (LTC) uses blockchain technology to maintain a public ledger of all transactions. The currency is referred to as Bitcoin’s lighter sibling as it was created using the Bitcoin source code, but it can be mined 4 times faster than Bitcoin (BTC). This, in addition to its lower price, makes it more suitable for faster, everyday purchases.

History of Litecoin 

Litecoin was created in 2011 by Charlie Lee, a former Google employee. It was released on October 7, 2011, via the open-source client GitHub, with the network going live on the 13th of the same month. This makes it the first altcoin – a term used to describe all other cryptocurrencies besides Bitcoin.

Since it was launched, it has experienced stable growth and ranks 7th in market capitalization today. Charlie’s mission was to create a cryptocurrency that had the same tight levels of security like Bitcoin, but more suitable for everyday transactions.

Differences between Litecoin and Bitcoin

Litecoin is, by its creator’s own admission, a clone of Bitcoin. If we are to understand Litecoin, comparison with Bitcoin is therefore necessary. These characteristics set the two cryptos apart: 

☑️Mining Algorithm: Both currencies use a proof-of-work algorithm. Bitcoin uses the SHA-256 algorithm, whereas Litecoin uses Skrypt. The SHA-256 is famous for its complexity and uses more power, while Scrypt is computationally less intensive and uses more memory, but also less power.

☑️Transaction Speed: Litecoin’s block time, i.e., the time it takes to process a block, is 2.5 minutes while Bitcoin’s is 10 minutes. This makes Litecoin 4 times faster and also more capable of processing more transactions in any time frame.

☑️Total Coins: Bitcoin has a market supply of 21 million coins, while Litecoin maxes out at 84 million. While it would appear that Litecoin has more potential, both cryptos have the ability to be broken down and transferred in very tiny amounts (for example, the minimum for BTC being a hundredth million or 0.000 00001). With both currencies being able to be divided down so much, the cost of one full coin is not consequential as it may seem.

☑️Rewards: When someone mines a block, they are rewarded a certain number of coins for their contribution to the network. The current block reward for both BTC and LTC is 12.5. Bitcoin’s rewards are halved after every 210,000 blocks have been mined while Litecoin’s reward halving happens after every 840,000 blocks. Because of the block time difference of 2.5 min and 10min for LTC and BTC, respectively, there is more opportunity for LTC miners to be rewarded. 

Current Litecoin Statistics

Litecoin is currently trading at $55.92, with its market cap being $3.5B. Its 24-hour volume is $2.6B and its circulating supply of 63, 476, 342 with a maximum supply (market cap) of 84 million. Its All-Time High was $375.29 in December 2017 with its All-Time Low being in January 2015 at $1.11. 

Characteristics of Litecoin

Just like with other mineable cryptocurrencies, Litecoin has several familiar elements that differentiate it from other types of digital currencies. Some of these are:

☑️Pseudonymous addresses – meaning users can transact without revealing their personal credentials, but the public address still having the possibility of being linked to them

☑️Blockchain – which is a public ledger where all transactions are recorded  

☑️Block Rewards – people who perform the computational work to effect transactions on the BLockchain are rewarded with a specific number of LTC coins   

☑️Transactions are peer to peer (meaning between two computers, without a regulating authority), and are censorship-resistant (meaning no corporation or government can interfere with them) 

How to Invest in Litecoin 

Investing in Litecoin means swapping your currency for Litecoin currency. For instance, 1 Litecoin is equal to $54.81 today. When the value of Litecoin rises, you can exchange Litecoins back to dollars. To invest in Litecoin, you need a digital wallet. So far, Coinbase is one of the best digital wallets where you can buy/sell and store your Litecoins and other cryptocurrencies.

What are the Risks of Trading Litecoin? 

As with other cryptocurrencies, there is not much history to compare the future performance of Litecoin. Since it’s still so “young”, the question of how you can estimate its future value is difficult to answer. Here are some risks associated with trading Litecoin: 

  • Changes to international capital controls may cause a decline in demand for cryptocurrencies. Countries such as China have laws that regulate the flow of capital out of the country – driving people to invest in cryptocurrencies to circumvent such restrictions. A change in these laws could affect Litecoin’s demand.    
  • Cryptocurrencies are still largely unregulated, rendering them a risky option for some
  • Litecoin is prone to market fluctuations – though many investors regard this is a positive risk 

Uses of Litecoin

Litecoin can function as any fiat currency (money that has been declared by the government as legal tender), and it can be used to pay for goods and services. An increasing number of businesses are accepting Litecoin as a legitimate means of exchange. From pet supplies to jewelry to cars to music to health and beauty, food, and travel, there are many places where the currency can pass.

You can also transfer quickly Litecoin to anyone, anywhere, thanks to its short block time and confirmation rate. 

Also, due to its often wild fluctuations – much like other cryptocurrencies, it is a very attractive investment for investors, who can bet on its exponential increase at any given time.  

Conclusion 

Litecoin has witnessed steady growth since its creation and by the look of things, it will only become stronger. This is due to its impressive processing time, and its adoption by trusted crypto exchange and storing platform, Coinbase. Remember, before investing in Litecoin or any other cryptocurrency; it’s important to do your research.


Categories
Crypto Market Analysis

Daily Crypto Review, Oct 2 – Pullback Day or Dead Cat Bounce?

Yesterday, cryptocurrencies behaved as expected, retracing some of their Monday’s gains. Early morning losses continued. Bitcoin lost 2.47% over its 24-hour value. Most altcoins joined the movement such as Ethereum (4%), Ripple (-4.04%), Bitcoin Cash(-4.47%), EOS(-4.57%), Bitcoin SV(-6.15%)  and TRON (-5.61%).

The market cap descended to $218.5 billion, while the 24H volume was $26 billion, as seen in the figure below.

The current market dominance is as follows:

  • BTC:67.55%
  • ETH:8.62%
  • XRP:4.85%
  • BCH:1.82%
  • LTC:1.60%
  • EOS:1.24%
  • Others:15%

The Heat map here, shoes that, as usual, the whole sector moves with almost perfect correlation.

What happens

Ethereum-bases dApp FairWin has collapsed after the exposure of a vulnerability in its smart contract. Researches found the platform admins could drain the entire balance in the dApp easily, an $8 million worth of ETH stored in the platform. Researchers found $250,000 was stolen in a previous version. Source: Medium.com.

According to an article by condesk.com, major Libra backers Visa and Mastercard are re-thinking its participation in this digital project. Libra has been the trigger for regulators to start worrying for the irruption of digital assets and Libra has been opposed by European financial authorities saying Libra could destabilize the Euro, while the US Congress has demanded a complete halt on its development.

The Federal Reserve injects the USD worth the entire crypto market cap in days according to this article by beincrypto.com. The last one is said to add $162 billion to the total USD supply. US FED noted that it is a temporary measure.


Technical Analysis


Bitcoin


Bitcoin’s price has been losing ground after making a double top at $8,519. The MACD is dangerously approaching a bearish transition, while the price is currently sitting on the mean line of the Bollinger Band, at 8,200. That was our expectations yesterday. Thus, nothing to worry about unless weakness continues and the price keeps moving to the lower side of the Bollinger bands and challenge the $8,000 again.


Ethereum


Ethereum is moving in an ascending channel, a weak form of trending. Its price made a high at $185, then during the latest 4H candles has been retracing. At the moment of this writing, the price was held by the mid-line of the Bollinger Bands. MACD is also close to a bearish crossing. The figure created by the latest price action suggests the entire channel is a consolidation of the significant drop made on September 24. Short-term, if the price holds, we see a new test of the $185  high, although the price might go visiting the lower side of the channel.


Ripple


Ripple has retraced more than 50% of the large candlestick made on Sept. 30. Now the price is touching the upper border of the band where it had been ranging before that bullish candle. That may be a supply zone of people who wanted to go long that day but were late.  That means a bounce off of this level is likely. If that does not happen, then the bullish candle was just a trap for bulls, and the movement is negated.


Litecoin


Litecoin is starting to show signs of buying interest. The price has been held by the Bollinger mean line and now has headed up. MACD is bullish, also. The movement is still feeble, and $57 acts as a resistance level, so to confirm a bullish scenario we would like to ask for a close above that level.


Categories
Crypto Market Analysis

Daily Crypto Update, Sept 30 – Bitcoin under $8,000 drives Crypto Assets Down!

Bitcoin breached the $8,000 early morning today, as the bearish sentiment keep persisting in the crypto sector. That lack of buyers is creating a pronounced bearish trend in the whole sector. This weekend, Bitcoin lost another 5% Bitcoin Cash(-5.55%), Binance Coin(-5.82%), Monero(-5.05%) and DASH(-6.2%) lead the loses.  The Market Capitalisation of the sector went further to $207.9 billion.

The heatmap below shows the price change of coins and tokens during the weekend.

The News Front

The Ukranian government is planning to legalize cryptocurrency. That is so according to a report published by an independent Ukranian news media. Currently, cryptocurrencies are not illegal in Ukraine. This step is a government move to regulate it and benefit via taxation. Source: The Block.

JP Morgan strategist Nikolaos Panigirtzoglou claims Bakkt’s launch of a physically-settled Bitcoin Futures contract was the reason for the Bitcoin 20% drop. Source: dailyhodl.com.

Denis Baykov has been fined the value of $7,000 by Russian authorities after mining bitcoin using a supercomputer able to petaflop speeds from an old Russian nuclear facility in Sarov, western Russia. Source beincripto.com.

Google has created a 50qbit computer able to execute in minutes what would have taken 20,000 yeats using a regular computer. Besides that, quantum computing is not a threat to crypto-assets, according to a news piece by bitcoinnews.com.


Technical analysis


Bitcoin


Today, bitcoin definitively broke the $8,000 support level and confirmed, also, the breach of the 200-day MA. On the daily chart, we see also the price has also broken the lower trendline of the descending wedge to the downside.

The next level to break is the $7,700 and, next, we could observe if the supply zone below $7,725 is able to hold prices and stop the downward evolution of the price, to, at least, experience a bounce.


Ethereum


Ethereum’s bounce ended, although the price has not broken the $166 support. We see the price moving slightly below the -1 Bollinger line, which means a downward pressure to prices. That, combined with the bitcoin weakness, makes us think ETH will continue descending to test $160 at least. But we can’t be surprised if $152 is reached in the coming days.


Ripple


Ripple seems to keep holding inside the range between 0.234 and 0.2468, besides the persistent BTC weakness. Today the price is losing 1% while bitcoin is -3.55% down. That shows there is some hidden buying power holding its price. The current sideways channel and technical indicators still show the price is in a downtrend, though. That and another BTC downward spike may force this token to break its support. The best course of action is to be in the sidelines while this is resolved.


Categories
Crypto Market Analysis

Litecoin at the Crossroads, Potential Play Ahead

  • Market Cap: $3,127,694,363
  • Max Supply: 84,000,000
  • Circulating Supply: 58,233,103
  • Daily Volume: $253,712,183

Litecoin is at the crossroads

Litecoin has hit the biggest support line so far, and kept above it. However, the downwards trend line is reaching the support line as well, and they will cross on the 24th of September. What will happen?


The most likely scenario

There is an extremely high probability of Litecoin breaking out before 24th of September, and the break has an extremely high likelihood of pushing upwards. Litecoin has been following BTC’s patterns for quite a while, but has still been a worse-performing asset than BTC itself. This might change soon. A proper long-short portfolio should have a Litecoin long position for the next 20 days. However, we do suggest a long-short portfolio with another asset being shorted for the same amount of equity in order to negate crypto market movements.

The less likely scenario

There is, of course, the other part of the story. Litecoin might break to the downside if the buyers do not rally up. Even if it’s highly unlikely, there is a chance for this to happen. If Bitcoin does go down in the next 20 days, Litecoin has high probability of following down its path. This is why having a long-short portfolio during the “bear market” is crucial. All Cryptocurrencies are highly correlated and we need to either only trade with the general trend of the market, or take long-short positions with extreme caution.

Final word

 Most financial advisors and gurus are losing money in Crypto these days simply due to them not being educated in properly managing risk. This is why Forex.Academy is trying to show people that portfolio and risk management is just as important as creating trade ideas. In the case of Litecoin these days, if the market goes up or stays the same, Litecoin will outperform it. If it goes down, Litecoin will outperform it to the downside as well. Either way, this play on LTC is a market play.


Categories
Crypto Market Analysis

Daily crypto update 07.08.2018


General overview


  • Market Cap: $255,560,502,695
  • 24h Vol: $12,415,147,987
  • BTC Dominance: 47.6%

In the last 24 hours cryptocurrency market capitalization has been stagnating around 255 billion dollar levels.

Consequently, the market is showing mixed colors with an average percentage of change ranging from 2-4%. The biggest gainers are Ethereum Classic who increased by 11% in the last 24 hours followed by Basic Attention Token who increased by 13%. The biggest loser is Mixin who decreased by 11,7%.


News


In the last 24 hours the most important headline that already impacted the price of a particular coin is that trading app Robinhood added support for Ethereum Classic (ETC) according to an official blog post.

“Starting today, you can invest in Ethereum Classic on Robinhood Crypto, commission-free,”

Ethereum Network Overloaded Again, Strong Suspicions of Spam

The Ethereum network is once again undergoing what looks like a spam attack. A single address is sending and receiving transactions, consuming 24.85% of the gas, based on data from the Ethereum gas station. This was the peak value in the early hours on Tuesday UTC, and later the transactions started to gradually decrease their gas use.

China: Trader Sues Exchange OKCoin for Failing to Release Bitcoin Cash

A Chinese Bitcoin (BTC) investor has sued local crypto exchange OKCoin for allegedly preventing him from getting Bitcoin Cash (BCH) after the BTC fork, local news agency Legal Weekly reports July 31. The case is reportedly the first legal action in China that involved last year’s fork of Bitcoin.

Goldman Sachs Mulls Crypto Funds Custody Service – Report

One of the major global banks, Goldman Sachs, is considering to launch custody service for digital coin-based funds, Bloomberg reported on Monday, quoting sources familiar with the bank’s new initiatives. The Sachs spokesman neither confirmed nor rejected the news, according to Bloomberg.

Source: cryptovest. com


Analysis


BTC/USD

From yesterday’s high at 7160$ the price of Bitcoin has fallen to the 6852$ which was today’s low so far but has recovered since to above 7000$.


Looking at the hourly chart we can see that this downtrend line is currently being broken which is a bullish sign but judging by the wicks on the hourly candles the price is experiencing selling pressure below the prior high which is a bearish sign.


Market sentiment 

Hourly chart technical indicators are signaling a buy.


Pivot points 

S3 6367.4 
S2 6674.0 
S1 6807.6 
P 6980.6 
R1 7114.2 
R2 7287.2 
R3 7593.8

ETH/USD

From yesterday’s high at 413$, the price of Ethreum has decreased to 402$ but has recovered since to 410$.


Looking at the hourly chart, we can see that the price action has formed a triangle and the price is currently interacting with its resistance line. The price is still below the uptrend semi-significant level but we will soon see the direction of a breakout.


Market sentiment 

Hourly chart technical indicators are signaling a buy with moving averages signaling a strong one.


Pivot points

S3 380.68 
S2 393.66 
S1 399.31 
P 406.64 
R1 412.29 
R2 419.62 
R3 432.60

LTC/USD

From yesterday’s high at 76,4$ the price of Litecoin has decreased by 1,3% and is currently sitting around 74,78$.


On the hourly chart we can see that like in the case of Bitcoin and Ethereum the price action is forming a triangle and the price is currently heading upward to its resistance levels, but unlike BTC and ETH it hasn’t reached it yet, but instead it’s starting to slow down as it is entering sellers territory.


Market sentiment 

Litecoin is in the buy zone.


Pivot points 

S3 65.431 
S2 69.838 
S1 71.702 
P 74.245
R1 76.109 
R2 78.652
R3 83.059

Conclusion


After the prices have fallen significantly in the last couple of day we are seeing now some recovery. How long this recovery will last it would depend on the momentum behind the move.

Categories
Crypto Market Analysis

Daily crypto update 30.07.2018 – Consolidation Before A Breakout


General overview


  • Market Cap: $293,468,610,906
  • 24h Vol: $13,964,438,115
  • BTC Dominance: 47.7%

From yesterday’s high at 299,774,000,000$, the evaluation of the cryptocurrency market capitalization has decreased by 6,3 billion as its currently sitting at around $293,4B. As you can see from the global chart the evaluation is narrowing down in a triangle like pattern. This consolidative structure has formed as the evaluation failed to break the $300B mark, and from the current level, I would expect the evaluation to go further down to the triangle’s support around $290B. If that level holds than another attempt at the breakout on the upside can be a possibility, but a breakout from the downside is more likely to 284B level.

Following the 6,3 billion dollar decline, the market is currently in red but with a small average percentage of change among top 100 coins ranging from 1-5%. The biggest loser is Mithil which decreased by 17% in the last 24 hours.


News


In the last 24 hours, most significant headlines are those that can fit into the adoption category.

First by its adoption magnitude is the news story of Iran’s plan on creating a state-back cryptocurrency in the midst of the announced U.S. sanctions that will take effect in August. As reported by the Iranian media, a senior official within the government says that the currency could be developed in the next three months. This measure against the sanctions is definitely constructed with Venezuela’s example in mind, as they have developed their cryptocurrency ‘petro’ to surpass the imposed U.S. sanctions in 2017.

The second headline that caught my attention as I viewed it as significant is that Commonwealth Bank of Australia (CBA) successfully, facilitated a shipment of 17 tonnes of almonds from Australia to Germany and in that process tested their supply management system based on the Ethereum blockchain according to a press-release on Monday. Chris Scougall, managing director of industrials and logistics in client coverage at CBA, said in a press release.


“We believe that blockchain can help our partners reduce the burden of administration on their businesses and enable them to deliver best-in-class services to their customers,”

CBA facilitated all three key services in this type of trade deals–shipment operations, documentation and finance issues – by using the cryptocurrency technology.

The third headline by its significance in the adoption category is that Nasdaq discussed with Gemini and other crypto exchange representatives the future trends in regulation and the ways those exchanges can be in line with them as a way to improve the image of the cryptocurrency market in general, a source familiar with the matter told Bloomberg. This interest and reaching out seen by Nasdaq to the cryptocurrency exchanges certainly isn’t because they want to help other exchanges. It looks like they want to take advantage of the cryptocurrency market potential when it’s still an evolving market and push it to the mainstream providing more legality and in the end maintaining their position as the operator of one of the worlds largest exchanges.

In April, Bloomberg reported that “Gemini partnered with Nasdaq to use its advanced surveillance system to prevent and control market manipulations.” and they have confirmed last week that they are offering their technological solution to SBI Virtual Currencies and three other cryptocurrency exchanges that were not disclosed.

This is very important especially when the Winklevoss brothers, Bitcoin Trust application for an ETF was declined again with an explanation that The Securities and Exchange Commission doesn’t find the product safe enough for investors. The SEC said that it cannot “conclude that bitcoin markets are uniquely resistant to manipulation.”

So potentially is Nasdaq provides the solution to that problem with their surveillance technology that can provide more certainty for the SEC to approve a Bitcoin ETF soon.


Analysis


BTC/USD

From yesterday’s open which is also yesterday’s high at 8276$ the price of Bitcoin has decreased by 1,84% as its currently trading at 8128$.


As it can be seen on the hourly chart, the price action has formed a descending triangle and is currently interacting with its support levels. Descending triangle pattern usually breaks from the downside and that already happened on Friday but the price action found itself back in it again, which means that buyers are there. This triangle pattern is similar to that on the global chart, so I would expect a breakout soon. This pattern could be interpreted as a bull flag buy investors and traders and they might act accordingly – buying at support, which would result in a breakout to the upside. However, that is highly unlikely.


Market sentiment 

Hourly chart technicals support the bearish scenario as they signal a sell.

Oscillators are signaling a sell, and moving averages a strong one.


Pivot points

S3 7838.5 
S2 8028.8 
S1 8124.9 
P 8219.1 
R1 8315.2
R2 8409.4 
R3 8599.7

ETH/USD

From yesterday’s open and high at 471,3$ the price of Ethereum has decreased by 3,65% as its currently trading at 453$.


Looking at the hourly chart we can see that the price of Ethereum has broken out off of the ascending channel on the downside and judging by the size of that red candle it isn’t an interaction with the support that will result as a wick on the higher time-frame like it did prior three times. As I think Ethereum is lagging behind Bitcoin, and it didn’t retest the prior low on the daily chart, this breakout is going to push the price of Ethereum significantly down in the upcoming period – if the breakout doesn’t end like a fakeout that is.


Market sentiment 

Ethreum’s hourly chart technicals signal a sell.


Pivot points 

S3 444.41 
S2 455.61 
S1 461.04 
P 466.82 
R1 472.25 
R2 478.03 
R3 489.24

XRP/USD

From yesterday’s open at 0,454$ the price of Ripple has decreased by 2,5% and is currently trading at 0,442$.


On the hourly chart we can see that the price of Ripple is in a similar position like the price of Ethereum – its on the support levels of the ascending channel, but unlike the Ethereum, Ripple’s price is just starting to interact with it. As the price struggled to exceed the 0,453$ level where 0 Fibonacci retracement level is this decline is the logical progression of the price pathway. If we have in mind the global chart, the Bitcoin chart and the Ethereum’s potential breakout, we can say that a breakout on the downside should be expected.


Market sentiment 

Hourly chart technical indicators are signaling a sell.


Pivot points 

S3 0.43719 
S2 0.44567
S1 0.44939
P 0.45415 
R1 0.45787
R2 0.46263 
R3 0.47111

LTC/USD

From yesterday’s open at 85,118$ the price of Litecoin has decreased by 5,27% as its currently sitting at 80,786$.


On the hourly chart, we can see that yesterday’s open was on the triangles resistance line which again rejected the price and has sent it on a downward trajectory. The price is currently sitting on the minor range support, but I am expecting it to continue going down to the ascending channels support at around 78,111$.


Market sentiment

Like in the case of other cryptos, Litecoin’s hourly chart technical indicators are signaling a sell.


Pivot points 

S3 80.043 
S2 82.184 
S1 83.130 
P 84.325 
R1 85.271 
R2 86.466 
R3 88.607

Conclusion


As the prices of four major cryptocurrencies are interacting with their minor support levels, and Ethereum is showing early stages of a breakout, more downside is expected in the upcoming period for the cryptocurrency market. Bitcoin’s chart is similar to that of global pattern wise, and this doesn’t come as a surprise as Bitcoin’s dominance has increased to 47,7%. On the global chart, we have seen an attempt to break the $300B mark, after which the market is consolidating. After the consolidation, a breakout on the downside is most likely, but it is also possible that buyers make another attempt at breaking that level. If that happens, and I hope it does the prices will go further up but not that further as sellers are just waiting for a better price to dump their holdings.

I hope this happens as it would be a healthy move for the market thus making further projections more accurate. This would result in dumb money getting dumped on which would cause them to give up buying and those who are willing to sell are going to push the prices down where they should have gone.

Categories
Crypto Market Analysis

Daily crypto update 23.07.2018


General overview


  • Market Cap: $288,355,459,859
  • 24h Vol: $13,743,240,958
  • BTC Dominance: 45.9%

From Friday’s low at 280B the evaluation of the cryptocurrency market cap has even lower on Saturday to around 272,506,000,000$ which was the weekends low. After that, the evaluation has been steadily rising and is now sitting just slightly below 290B.

The market is mostly in green, with an average percentage of change among top 100 coins ranging from 3-8%. The biggest gainer is Holo who increased by a staggering 64%. Next is Bitcoin Diamond with an increased of 52% and two-three more coins have shown gains of around 12%.


News


Two of the 12% gainers that are mentioned are Nuls and Augur. Fundamental are impacting the price, and the traction is picking up creating a small hype around them for now, but I will look if this hype increased over the next day or so.

NULS Spikes as Binance Backs Mainnet Token Swap

Nuls (NULS), the virtual coin of a project for a commercial blockhain ecosystem, leapt nearly 14% on a daily basis on Monday morning (UTC), reaching $2.76, a level not seen since mid-June, when the project announced its main network (mainnet) token swap. The possible reason for NULS price growth, which was one of the largest this morning, may be the announcement of Binance support for the NULS swap.

Augur (REP) Price Booms as Betting on its Platform Picks Up

REP prices have been picking up again, adding more than 26% overnight to reach $37.36 as of 4:30 UTC. The jump in prices comes on the back of surging volumes, with trading of REP against BTC on Binance gaining notable traction. Still, the most active trading of Augur, almost half of the total volume, happens on Upbit, against the Korean Won.

Source: Coinvest


Analysis


BTC/USD

From yesterday’s low at 7331$ the price of Bitcoin has increased by 4,39% and is now trading at around 7696$.


Bitcoin has reached another significant resistance level at the 0.236 Fibo line where also the resistance line of the triangle from the daily chart is.


Market sentiment 

Bitcoin is in the buy zone.


Pivot points

S3 6942.1
S2 7188.0 
S1 7292.8
P 7433.9 
R1 7538.7 
R2 7679.8 
R3 7925.7

XRP/USD

The price of Ripple has been hovering around the same levels from Friday, and the price hasn’t changed much.


As you can see from the hourly chart, the price is sitting around 0 Fibonacci retracement levels.


Market sentiment 

Hourly chart technicals signal a sell.


Pivot points

S3 0.41922 
S2 0.43596 
S1 0.44238 
P 0.45270 
R1 0.45912 
R2 0.46944
R3 0.48618

LTC/USD

The price of Litecoin has changed by only 1,1% since yesterday’s low at 82$.


As you can see on the chart things are looking pretty calm, which is why I am expecting some more sideways movement.


Market sentiment 

Hourly chart technicals signal a sell.


Pivot points

S3 77.505 
S2 80.100 
S1 81.160 
P 82.695 
R1 83.755 
R2 85.290 
R3 87.885

Conclusion


The market is experiencing some short-term sideways movement and in the following day, we will see where this trend wants to go.

Categories
Crypto Market Analysis

Daily Crypto Update 06.07.2018 – Retracement Continuation


General Overview


Market Cap: $264,564,228,297

24h Vol: $16,267,409,706

BTC Dominance: 42.6%

In the last 24 hours, the evaluation of the cryptocurrency market capitalisation has failed to go past the resistance at around 275 billion dollar area, so it has retraced since to the 261,722,000,000$ level at its lowest today.

Retracement Continuation | Forex Academy

Consequently, the market is currently in the red, with an average percentage change among top 100 coins ranging from 5-8%.


News


In the last 24 hours, there are four headlines that came out, that are considered significant. The headlines are those regarding governmental relation to the crypto space and utilisation of the blockchain tech and they are all positive.

First in the line is that Uzbekistan “has signed a decree on the development and integration of blockchain technology, crypto assets, and crypto mining with the goal of modernising the state administration system and advancing digital economics in the country.”

President Shavkat Mirziyoyev signed a decree “On measures for digital economics development in the Republic of Uzbekistan”

Malta has passed three bills into law that establish a regulatory framework for blockchain technology, as reported by the local media outlet. The bills include the Malta Digital Innovation Authority Act, the Innovative Technological Arrangement and Services Act, and the Virtual Financial Asset Act.

The South Korean government is drafting major new industry classification standards for the domestic blockchain industry.

The scheme will reportedly serve as a basis for policy making, notably aimed towards “blockchain promotion and regulatory frameworks,” and covers areas including blockchain systems construction, decentralised applications (DApps) development, and cryptocurrency exchanges and transactions.

IBM has signed a five-year AU$1 billion ($740 million) deal with the Australian government to use blockchain and other new technologies to improve data security, Bloomberg reports. The major contract will see IBM provide technology such as blockchain, automation and artificial intelligence (AI) to Australian federal departments, including defence and home affairs. IBM’s Asia Pacific head, Harriet Green, told Bloomberg that the new partnership will give Commonwealth citizens access to the “world’s greatest technologies” “across many, many government agencies.” The new partnership will catapult Australia to “the top three of digital governments in the world,” she suggested.


Analysis


BTC/USD

The price of Bitcoin has decreased by 1.7% from yesterday’s high at 6645$ and is now sitting at 6523.50$.


Looking at the hourly chart we can see that the price of Bitcoin has retraced back to the minor support level above the 0 Fibonacci level. As the selling pressure is stronger than the buying and judging by the steepness of the down move, I am expecting the price to decline further to around 6310$.


Market sentiment 

Hourly chart technicals signal a buy overall.

Oscillators are signalling a sell, and moving averages a buy.


Pivot points 

S3 5990.5 
S2 6271.8 
S1 6401.6 
P 6553.1 
R1 6682.9 
R2 6834.4 
R3 7115.7

ETH/USD

From today’s open at 470$, the price of Ethereum has declined by 1.1%. The price went lower to 455$ but has recovered since to 464$ where it is currently.


On the hourly chart, we can see that the price action is forming a triangle, which is why I am expecting the price to bounce a few more times inside it in the following days.


Market sentiment 

Hourly chart signals a buy.


Pivot points

S3 427.49 
S2 447.80 
S1 457.66 
P 468.12 
R1 477.98 
R2 488.44 
R3 508.75

LTC/USD

The price of Litecoin has been declining from yesterday’s open at 85.43$ to the 81.20$ at today’s low. Since the low, the price has recovered and is now sitting at 83.80$.


As you can see from the hourly chart the price has broken out off of the triangle and found support on the prior range resistance levels around 81$. Now the price has recovered, but I think that this current green candle is there to test if prior support from the triangle is going to serve as resistance, and if it will, the price is going to go further down.


Market sentiment 

Hourly chart technicals signal a buy.


Pivot points

S3 73.146 
S2 78.610 
S1 80.963 
P 84.074 
R1 86.427
R2 89.538 
R3 95.002

Conclusion


As the evaluation of the cryptocurrency market capitalisation hasn’t exceeded the 275 billion level and it want’s to, the sellers must be baited to sell for the lower price and exhaust their supply which is why I am expecting this retracement to last a bit more before the uptrend continues.

Categories
Crypto Market Analysis

Daily Crypto Update 05.07.2018 – Today’s Action Will Provide Confirmation


General Overview


Online Coin Market Cap: $274,137,015,909

24h Vol: $15,046,476,500

BTC Dominance: 41.9%

From the opening at 275,197,000,000$, the evaluation of the cryptocurrency market cap has fallen to around $270 billion at the lowest point today but has recovered since and is close to the levels of the resistance line.

Online coin market

The market is currently in green with a small percentage of change among the top 100 coins. The biggest loser is Syscoin who decreased by 26%, and biggest gainer is Ethos who increased by 27.53%.


News


As the market is showing signs of recovery, many headlines that have come out are analytical in nature, as people across space are trying to figure out what is coming next. There are some significant headlines regarding blockchain adoption and regulatory tone.

First on the line is news coming from Spain.  Spanish National Securities Market Commission (CNMV) Spain’s securities regulator in association with various banking and financial institutions have announced the completion of the pilot test for the Fast Track Listing (FTL) project.

In a statement the CNMV has announced:

“The objective has been to simplify processes and reduce the amount of time needed to register issuances. It has been proven that the use of blockchain technology can improve efficiency in terms of time and resources, as well as increase the security and traceability of processes.”

Source: CCN

Second news in line is the one coming from Malta. Malta’s prime minister Joseph Muscat confirmed the parliament will favour and approve three cryptocurrency bills designed to embrace the blockchain sector.

Speaking to CCN, the Parliamentary Secretary for Digital innovation and Finance Silvio Schembri stated:

“This is the last stage of the legislation that will put Malta on the international map for blockchain and crypto regulation. There is political consensus on this roadmap and we are foreseeing that this area will be the mainstay of our economic growth for the next 4-5 years”.

Source: CCN

And the last news headline that fits into this category is that coming from Russia. The CEO of  Sberbank, Russia’s largest state bank, Herman Gref said he could not yet foresee governments “yielding their centralised role” in fiat currency creation as part of his comments on cryptocurrency.

Speaking to reporters during the Astana Finance Days international conference in the Kazakhstan capital July 4, Sberbank’s Herman Gref repeated the comments he has made “many times” about cryptoassets’ future role in the economy.

“I don’t think that the state is ready to yield its centralised role in emission of fiat currency to some other decentralised institutions.”

Source: cointelegraph


Analysis


BTC/USD

From yesterday’s open at 6721$ the price of Bitcoin has decreased by 2.16% as its now sitting at 6577$.


Looking at the hourly chart, we can see that the price was repealed by minor resistance, and has retraced slightly since. The price is still above the 0 Fibonacci level which is the prior low level on the daily chart which is a good sign. However looking at the price action, we can see that the momentum behind the upward move is slowing down as higher highs are getting shorter, and higher lows are getting lower.


Market sentiment 

Bitcoin is in the sell zone, as indicated by hourly chart technicals.


Pivot points

S3 5854.7 
S2 6225.5 
S1 6407.8 
P 6596.3
R1 6778.6 
R2 6967.1 
R3 7337.9

LTC/USD

From yesterday’s high at 88$, the price of Litecoin has decreased by 3.54% and is now sitting at 84.90$.


Looking at the hourly chart we can see that the price action is forming a triangle, and the price is currently close to its support line. Like in the case of Bitcoin we can see that the momentum behind the upward movement is slowing down, so a breakout from the downside is more likely.


Market sentiment 

Hourly chart technicals signal a sell.


Pivot points

S3 73.895 
S2 79.999 
S1 82.711 
P 86.103 
R1 88.815 
R2 92.207 
R3 98.311

DASH/USD

From yesterday’s high at 251.70$ the price of Dash has decreased by 1.8% and is currently sitting at the 246.90$ level.


On the hourly chart, we can see that the price action has formed a symmetrical triangle, and the price is currently sitting close to its support. The breakout looks very close and what I think it’s going to happen is that we are going to see a breakout from the upside, but the price fails to create a higher high and consequently fall to the levels of the current range support around 238,9$.


Market sentiment 

Hourly chart technicals signal a buy.


Pivot points

S3 181.963
S2 211.383
S1 228.243
P 240.804
R1 257.664
R2 270.22 
R3 299.646

 Conclusion


Online Coin Market: As seen on the global chart and on the charts of the coins covered in this article, the first significant resistance hasn’t been broken. The prices of the coins covered are currently in consolidative patterns, and today we are going to see a confirmation if the uptrend continuation or the start of the retracement.

Categories
Crypto Market Analysis

Weekly Crypto Update 07.02.2018 – The Recovery Has Started


General Overview


Crypto Coin Market Cap: $270,492,089,135

24h Vol: $16,547,075,818

BTC Dominance: 42.3%

Last Monday on 25th of June, cryptocurrency market capitalisation was 258,924,000,000$ at it’s highest point. Since then, the market cap fell all the way to 232,613,000,000$ on Friday 29. On Saturday the evaluation rose from those levels back to the levels of Monday’s open, and now we are seeing a breakout as the evaluation exceeds Monday’s around $258B. Because the global chart is lagging behind a bit, I have drawn with a brush were the chart should be at the moment.

Crypto Coin Market Cap Chart

The market is in the green at the moment. Biggest gainers so far among top 100 coins are: Neo 16%, 0x 18.56%, Verge 18.3%, Wanchain 15%. The average percentage increase is around 6% but there are a lot of coins that have gained 10% or more in the lasts 24 hours, which is a sign of recovery.


News


There are a number of significant news items that came out in the last 7 days. Out of those that could impact the market I point out the following:

Facebook will no longer ban crypto ads, but ICOs are still on the blacklist and only verified accounts can post them, according to their announcement. This headline is good, as Facebook ads will help expose the market, however, if they are in control of the type of projects they are going to allow or particular cryptocurrencies, Facebook will have control of the content displayed to the users, and they could, in fact, help manipulate that market, or create a general impression that is aligned with their agenda around a particular coin or project. For example, I don’t believe that they are going to allow promoting Steemit which is a blockchain based social media rival that pays out their users with their native coin. But we are yet to see what happens, as the pressure is applied on to major players but the technological advancements of the blockchain.

Other significant headlines that could impact the market as they bring more exposure and open up the space for new participants are that Binance launches a crypto-fiat exchange in Uganda– Binance Uganda, as reported by cointelegraph. This will bring more cryptocurrency exposure to the retail investors.

On the other hand Blockchain.com – the best-known crypto wallet and blockchain explorer data service has introduced their institutional platform, Blockchain Principle Strategies (BPS). BPS will offer over-the-counter services managed by experts from Goldman Sachs, JP Morgan, and UBS as part of the platform.


Analysis


BTC/USD

From last Monday, the price of Bitcoin has increased by 5.13% coming from 6282$ to the low at 5800$ at its lowest point back to 6443$ and now above the level of last Monday’s open at 6618$.


Looking at the hourly chart, we can see that the price has found support on the unconfirmed triangle support, and broken the downtrends resistance line as it’s heading in an upward trajectory. The first target I am looking at is an unconfirmed baseline support 2 (purple dotted line) at 7054$. I am expecting the first significant resistance from there to 7320$ area, and if the price gets passed through that resistance I am expecting the price to go to around 8000$.


Market sentiment

Daily chart technicals signal a sell.

Oscillators are on neutral and moving averages signal a sell.


Pivot points 

S3 4649.7 
S2 5440.2 
S1 5915.8 
P 6230.7
R1 6706.3 
R2 7021.2
R3 7811.7

ETH/USD

From last Monday’s opening at 451$, the price of Ethereum has increased by 5.34% as its currently sitting around 475$.


On the daily chart, we can see that the correction has ended and it was a WXY correction just like I pointed out it would most likely be in the charting section last week. I have pointed out that this correction might make another low and be complete as a WXYXZ sideways correction but that from those levels around 400$ the price is going up soon. Currently, the price has broken the downtrends resistance line and is heading upward steeply after consolidating in a descending channel.


Market sentiment 

Ethereum is in the sell zone, as indicated by daily chart technicals.

Oscillators are on neutral, and moving averages signal a strong sell.


Pivot points

S3 303.76 
S2 374.27 
S1 414.06 
P 444.78 
R1 484.57 
R2 515.29 
R3 585.80

LTC/USD

In the last 7 days, the price of Litecoin has risen by 5.42% from the opening on last Monday at 81.5$ to 85.8$ where it is currently sitting.


The price of Litecoin has found support at around the 72$ level, which is the level from where the price went on to create the all-time high.  Today the price has broken the downtrends resistance line and is in an upward trajectory. Like in the case of Bitcoin, I am expecting this upward movement to be the final wave Z from the WXYXZ correction from which the price is heading lower afterwards. Some of the significant level to look out for in the following week is from 111$ to 124$ which was considers as a support area, and probably now serves as strong resistance, so I will be closely monitoring what happens at those levels because I am expecting the price to go higher than 124$.


Market sentiment

Litecoin is in the sell zone as indicated by daily chart technicals.

Oscillators are on neutral and moving averages signal a strong sell.


Pivot points

S3 55.377 
S2 67.393 
S1 74.299 
P 79.409 
R1 86.315
R2 91.425 
R3 103.441

NEO/USD

The price of Neo has increased by 15.38% coming from 31.6$ last Monday to 36.42$ where it is currently.


Looking at the Neo daily chart we can spot the similarities between the current candle formation and the last time the price of Neo has recovered from its lowest. As I have measured with the Fibonacci retracement tool, last time the price recovered to the 0.5 Fibonacci level, and I have projected the same recovery this time which fits perfectly with the potential interaction with the uptrend baseline support that was broken. In price terms, I am expecting the price of Neo to rise to around 56.89$.


Market sentiment

Neo is in the sell zone as the daily chart technicals indicate.


Pivot points

S3 16.25 
S2 23.49 
S1 27.20 
P 30.73 
R1 34.44 
R2 37.97 
R3 45.21

DASH/USD

From last Monday’s open at 238.9$, the price of Dash has increased by 5.46% as its currently sitting at 250.8$.


Looking at the daily chart we can see that like in the case of other cryptos that are covered in this report, the price has broken the downtrends resistance line and is heading upward. I have labelled this correction as WXYXZ and as you can see it has ended. I have projected that the price is mostly going to recover to the 384$ as that is the half of the range from the last retracement, much like it did two prior times.


Market sentiment

Dash is in the sell zone, as indicated by daily chart technicals.


Pivot points

S3 155.17
S2 195.52
S1 217.44
P 235.88
R1 257.79
R2 276.23
R3 316.58

ADA/USD

From last Monday’s open at 0.135$, the price of Cardano has increased by 11.42% as its sitting around 0.151$.


As you can see from the daily chart, the 5 wave move down has ended, and the price is now starting to recover in an upward movement after it broke the downtrends resistance. I am expecting the price to go up to 0.23$ where the first major resistance line is and corresponds with the half of the range.


Market sentiment

Cardano is in the sell zone.


Pivot points

S3 0.076333 
S2 0.103199 
S1 0.120628 
P 0.130065 
R1 0.147494 
R2 0.156931 
R3 0.183797

Conclusion


Crypto Coin Market Cap: After the prices have tested the old lows and dipped beyond them a bit we are seeing a trend reversal taking place. As the chart of the cryptocurrencies analysed in this report point out, this is going to be a short-term recovery, before another drop.

This was my projection from 02.06.2018 in which I have drawn the recent low the recovery I am expecting before another potentially final drop to around 178B level.
Crypto Coin Market Cap

This recovery might serve as a great shorting opportunity, but as there is so much manipulation going on, things can get pretty uncertain, so be careful.

Categories
Crypto Market Analysis

Weekly Crypto Update 27.06.2018 – One More Low Expected To The Bottom


General Overview


Market Cap: $245,897,879,486

24h Vol: $10,982,438,642

BTC Dominance: 42.6%

From last Monday, the cryptocurrency market has been in a constant decline as the market fell from 294,184,000,000$ which was last weeks high on Tuesday 19.06.2018. The lowest the crypto market has been was on Sunday when the crypto market capitalization hit 235,331,000,000$.

Those levels were expected to be a lower low after which the cryptos were going to recover, but as the new high failed to exceed the prior one, there aren’t any signs of a trend reversal, and the evaluation is close to the last low levels. This situation implies that a lower low is more likely and that this is the bottom after which the trend reversal is going to start.


News


Out of those stories that marked the past week, the most significant one is the Bithumb hack.

Bithumb, which has fallen from 6th to 10th place for cryptocurrency exchanges worldwide by trading volume, has had about $30 million worth of cryptocurrencies stolen in an apparent hack.

This headline created a lot of FUD (fear, uncertainty, and doubt) in the market and many blamed this event as the fundamental reason of the continuation of the bear market, which was not the case as this exchange is not that large.

In the law and tax category, there are two major headlines. First is that  U.S. federal employees will have to report their cryptocurrencies holdings if they equal more than $1,000 or made more than $200 during the reporting period. The other one is that the Uruguayan Chamber of Fintech has announced the creation of a special committee to develop a framework for crypto regulation and promote innovation to support the country’s financial system.

Both of this news is positive, as the first one implies that cryptocurrency is valuable and should be reported as “other forms of securities.”

In the adoption category, the news items that stands out is the news of Square receiving the New York BitLicense. The announcement means that Cash App users in every state except for Georgia and Hawaii now have the option to buy and sell Bitcoin.


Analysis


BTC/USD

From the opening on Monday, June 18 at 6875$, the price of Bitcoin has decreased by 11.19% as it is now sitting around 6110$. The opening price is the highest Bitcoin has been, and the lowest was at 5770$, from which it quickly recovered closing as a Doji candle with a big a wick from the downside on the daily chart on 24.06.2018.


Looking at the daily chart, we can see that the current wave is near completion, but it looks like another low might happen whos target I’ve projected to be from 5664$ on the supportive significant level (purple dotted line), to 5515$ which is the support line from which Bitcoin created the all-time high. As I think this current wave is the wave X of the WXYXZ sideways correction, I am waiting to see signs of the short-term trend reversal, before the price continues to new lows.


Market sentiment 

Daily chart technicals signal a strong sell.

Oscillators are on sell, and moving average signal a strong one.


Pivot points

S3 4426.3 
S2 5365.2 
S1 5758.6 
P 6304.1 
R1 6697.5
R2 7243.0 
R3 8181.9

LTC/USD

From last Monday, the price of Litecoin has depreciated in value from 100$ to slightly below 80$ which is a 20% decrease in ten days. The opening on Monday was the weeks high, and the lowest Litecoin has been is to the 73.5$ area on Sunday.


Looking at the daily chart, I am seeing another low ahead to the support line at 71.29$ which is significant as from that level the price of Litecoin went on to create the all-time high. If that level holds I would be expecting a short-term trend reversal as I think that the current wave is an X from the WXYXZ sideways correction


Market sentiment

Litecoins daily chart technicals signal a sell.

Oscillators are on sell, and moving averages signal a strong one.


Pivot points

S3 44.663 
S2 66.371 
S1 74.517 
P 88.079 
R1 96.225 
R2 109.787 
R3 131.495

EOS/USD

At the start of last week on Monday, June 18, the opening price of EOS was at 10.95$. Since then the price has decreased substantially to 8$ which is a decrease of 25.81%. The price went even lower on Sunday when it spiked to 6.89$.


Looking at the daily chart, we can clearly see that the corrective move was a WXY correction and that the Y wave is near completion. I am expecting the price to drop to the 6.58$ level were an 8/1 Gann fan level is and another support level from a prior range from whom similarly to the case of Bitcoin and Litecoin, the price created the all-time high. As this would be the last low a trend reversal would be expected, but how long would it live we are yet to see from the formations and patterns ahead.


Market sentiment

Daily chart technicals signal a sell.

Oscillators are indicating a sell, and moving averages signal a strong one.


Pivot points

S3 3.3173 
S2 6.2033 
S1 7.2797 
P 9.0893 
R1 10.1657 
R2 11.9753 
R3 14.8613

XRP/USD

From the opening price at 0.55$ last Monday, the price of Ripple has decreased by 15.48% as it is now sitting at 0.47$.


On the chart, we can see that the support at the prior low level at 0.4541$ held the price again. As the current wave is the last impulse wave I am expecting a trend reversal, but the price may fall a bit lower before that happens. The new potential low would be at the next support level at 0.4144$. However, this level may hold and the trend reversal starts happening from here. The move up would be a corrective move, probably in a form of another three-wave ABC move, which is why I am expecting the price to go down further.


Market sentiment

Ripple’s daily chart technicals indicate a sell.

Oscillators are signalling a sell, and moving averages a strong one.


Pivot points

S3 0.32270 
S2 0.41468 
S1 0.45231 
P 0.50666 
R1 0.54429 
R2 0.59864 
R3 0.69062

XMR/USD

The price of Monero is on the same levels like on Monday last week which is around 128$. The price fell by 17% from Monday to Sunday to the weeks low at 106.78$.


Looking at the 4-hour chart, we can see that the price is currently on the rise, but that would only be a corrective move from where I am expecting the price to go lower to the 100$ level, which would be the support line 2 of the support area.


Market sentiment

Monero is in the buy zone.

Both oscillators and moving averages signal a buy.


Pivot points

S3 97.133 
S2 102.972 
S1 108.811 
P 126.405 
R1 146.510 
R2  190.105 
R3 210.210

Conclusion


If you remember this was my projection from 02.06.2018

As you can see I was expecting to see on the global chart that the prior lows at around 250 billion dollar evaluation get retested, after which another similar pattern would appear.

The lows were retested and the evaluation is hovering around those levels which is why now I am looking for signs of a reversal.

After looking at the charts of major cryptos, and especially Bitcoin as it has the 42% market dominance, I think that another low is going to happen before some short-term recovery. Those lows would be to tests the support levels from where the all-time high was made in all cryptos that we’ve covered in this report.

Categories
Crypto Market Analysis

Daily Crypto Update 20.06.2018 – Another Crash Coming


General Overview


Market Cap: $284,566,156,804

24h Vol: $14,268,669,088

BTC Dominance: 40.0%

In the last 24 hours, cryptocurrency market capitalisation has decreased from 294,184,000,000$ which was the yesterday’s high to around 284 billion dollars where it is currently sitting in stagnation.

TThe market is mostly in red, but we can see a mix in colour, with a nonsignificant average percentage change.


News


Top stores that came out in the last 24 hours are mostly negative in sentiment which may impact the market negatively. One of the most significant headlines is the Bithumb exchange hack.

Hackers have stolen cryptocurrencies worth $30 million from South Korea’s leading virtual currency exchange Bithumb, Cointelegraph Japan reported June 19. As a result all deposits and payments have been temporarily suspended.

Another significant headline that can impact the market negatively is a statement made by CBOE Global Markets President Chris Concannon who said that the initial coin offering (ICO) market could soon face a two-fold regulatory “reckoning,” Business Insider reports June 19.

“The reckoning will come in two waves. First, the SEC will go after ICO market participants. Then, class-action lawsuits against the teams behind ICO projects will surge.”

A lot of negativity is circling around EOS at the moment as EOS blocks producer froze users funds. Seven accounts have been compromised by the registration process through phishing scams, and in an attempt to protect user funds, EOS block producer has declined to process those transactions.

EOS Block Producers discussed the decision to freeze the accounts over a two hour conference call, ultimately deciding that since the EOSIO constitution has not yet been ratified, they could ignore the EOS Core Arbitration Forum’s (ECAF) decision not to freeze the funds.

This created a twitter bashing from some of the most respectful and credible figures in the crypto world, like the pioneer Nick Szabo and Charlie Shrem.

With so many problems EOS has faced in the midst of their launch – vulnerability fix, launch freeze, and now this centralised face that they have shown, investors may lose confidence in the project which may impact the price negatively.


Analysis


BTC/USD

From yesterday’s open at 6733$, the price of Bitcoin has decreased by 1.67% and is now sitting at 6622$.


Looking at the hourly chart, we can see that the price went to the range resistance line where it was quickly repealed by it. After that happened, the price went below the range support, back inside the range and is currently retesting that same support line. It looks like its going to be broken again and the next level I would expect the price to interact with is the 0 Fibonacci retracement level which would be in the terms of price around 6500$.


Market sentiment

Bitcoin is in the sell zone.

Oscillators are on neutral and moving averages signal a sell.


Pivot points

S3 6359.8 
S2 6553.0 
S1 6644.3 
P 6746.2 
R1 6837.5 
R2 6939.4 
R3 7132.6

NEO/USD

The price of Neo has fallen by 8.28% from yesterday’s high at 41.46$ to where it is currently sitting at 38$.


On the hourly chart, we can see that the price went into the support zone, which now serves as resistance and quickly fell back from those levels to the levels of the minor support, where it is retesting it. I don’t believe that these levels will serve as resistance as they haven’t been that strong and respected in the past.


Market sentiment 

Neo is in the sell zone.

Oscillators are on neutral while moving averages are signalling a strong sell.


Pivot points

S3 34.60
S2 37.32 
S1 38.64 
P 40.05 
R1 41.36 
R2 42.77 
R3 45.49

LTC/USD

The price of Litecoin has decreased by 5.4% from yesterday’s spike at 101.68$ to 96.133$ where it is currently sitting.


Litecoin’s hourly chart is showing similarities with that of Neo, as we see a spike up after which the price fell down below the minor support area, went above it and is now sitting right on it testing it for support.


Market sentiment 

Litecoin hourly chart technicals match the Neo’s much like the chart patterns.

Litecoin is in the sell zone with oscillators on neutral and moving averages signalling a strong sell.


Pivot points

S3 89.600 
S2 94.348 
S1 96.551 
P 99.096 
R1 101.299 
R2 103.844 
R3 108.592

Conclusion


After going through the news and looking at the chart I conclude that we are in for more red today. The artificial spike we have seen on Monday didn’t trigger buying, and there’s not a single sign of a potential trend reversal. The prices look unstable and the selling may be very steep as a consequence of the spike up we have seen. As soon as the market participants realise there’s no trend reversal coming, sellers will start selling and there will be no buyers which will result in a significant price drop in a short time period.

Categories
Crypto Market Analysis

Daily Crypto Update 19.06.2018 – Will Yesterday’s Spike Trigger a Trend Reversal


General Overview


Market Cap: $287,823,534,235

24h Vol: $12,135,483,741

BTC Dominance: 40.0%

In the last 24 hours, something strange has happened. After a period of stagnation, all of a sudden the evaluation of the crypto market cap has spiked up from 276,698,000,000$ to 289,453,000,000$. The spike wasn’t caused by news or any fundamental factors, which is why this is strange.

I have written my take yesterday on what I think has happened in the post entitled ‘The Reason Of The Sudden Rise In The Crypto Market May Be Manipulation‘ which you can read here.

The market is currently in green as a result of the rise with an average percentage change ranging from 3-5%.


News


There aren’t any significant news items that came out in the last 24 hours that can justify the up move we have seen in the market. Top headlines that came out are informative in nature and every major news outlet reported on the sudden rise in the crypto market capitalisation rise.

Crypto Markets See $13 Bln Price Spike in One Hour, Despite Negative BIS Report – cointelegraph

Investors Turn Bullish as Cryptocurrency Market adds $12 Billion 24 Hours – ccn

Bitcoin Recovery Stalls Raising Risk of Price Drop – coindesk

Majority of analysts expected a steep fall to 6000$ for Bitcoin, which is why this unexpected rise is considered a news event and was reported by many.

Other relevant news in the crypto space are the following:

US: Federal Employees to Disclose Crypto Holdings Following New Guidance

The US Office of Government Ethics (OGE) has ordered federal employees to report their holdings of virtual currency, according to new guidance issued June 18. The guidance will affect around 2 million federal executive branch employees, including the Departments of Homeland Security, the Army, Justice, Veterans Affairs, and others.

Source: cointelegraph

EOS Vulnerability Will Lead to ‘Massive Exchange Hack’, Predicts Cornell Blockchain Researcher

Cornell professor Emin Gün Sirer forecasted his belief that EOS, will be the root cause of a significant cryptocurrency exchange hack at some point during the next calendar year.

“I’m calling it: there will be a massive exchange hack within the next year, taking advantage of an EOS vulnerability. That exchange will lose its hot wallet.”

“If EOS uses its arbitrators to reverse the hack, the contagion will spread downstream,” he added. There will be threats of lawsuits involving the devs and the [block producers].”

While clarifying that this prediction is not based on any specific vulnerability he has identified or believes lies hidden within the EOS source code, he argued that such an exploit is likely inevitable given the way developers “handle safety critical bugs.”

Source: ccn


Analysis


BTC/USD

From yesterday’s opening at 6378$ until now, the price of Bitcoin has increased by 5.28% and is currently sitting around 6714$.


Looking at the hourly chart we can see that the price interacted with the unconfirmed baseline support 2 (black dotted line) and was stopped at resistance found on those levels at 6850$. Currently, the price is sitting quietly in the middle of the range, as market participants are waiting to see if the spike up will push the prices higher.


Market sentiment 

Hourly chart signals a buy.

Oscillators are on buy and moving averages signal a strong one.


Pivot points 

S3 5685.4 
S2 6164.3 
S1 6436.7 
P 6643.2 
R1 6915.7 
R2 7122.2 
R3 7601.1

XRP/USD

From yesterday’s opening, the price of Ripple has increased by 4.91% going from 0.52$ to 0.547$ where it is currently.


The price has found support at the 0.51$ level and bounced off it, and is starting to interact with the minor resistance line, as you can see from the hourly chart. We will see what happens in the following hours, but if this resistance line gets broken I would expect the price to go up to the purple dotted line which is a significant level that served as support in the past.


Market sentiment 

Hourly chart technicals signal a buy.

Oscillators are on buy, and moving averages signal a strong buy.


Pivot points

S3 0.43653 
S2 0.48395 
S1 0.51157 
P 0.53137 
R1 0.55899 
R2 0.57879 
R3 0.62621

LTC/USD

In the last 24 hours, the price of Litecoin has increased by 4.29% rising from 93.6$ to 98$ where it is currently.


On the hourly chart, we can see that the price broke out of the bearish pennant on the upside and has stopped at a minor resistance line like other coins.


Market sentiment 

Litecoin is in the buy zone.

Oscillators are on sell, and moving averages signal a strong buy.


Pivot points

S3 82.890
S2 90.100
S1 94.469
P 97.310
R1 101.679
R2 104.520
R3 111.730


Conclusion


After the sudden rise, the prices of all major cryptos including these that are covered in this report have spiked up but were stopped out at minor resistance levels which means that the momentum behind the move wasn’t strong. Today, we will see if the spike serves as a signal for market participants to start buying, and that will be confirmed if the minor resistances are going to be broken and we see a high exceeding the prior one. That will in the case of Bitcoin be around 7000$, in the case of Ripple around 0.578$ and in the case of Litecoin around 111$.

Categories
Crypto Market Analysis

Weekly Crypto Update 18.06.2018 – Retest of the Lows Expected


General Overview


Market Cap: $276,493,181,374

24h Vol: $10,178,348,969

BTC Dominance: 40.1%

From last Monday, 11th of June, the cryptocurrency market cap has experienced a short-term rise from 294,722,000,000$ to 301,321,000,000$ which was the weeks high, and after that, it has fallen to 265,974,000,000$ which was the weeks low on 13th of June. After the low, the market has recovered slightly and is currently sitting in the middle of the high-low range as you can see from the graph below.


Crypto Weekly Update


News


Top stories that came out in the last week are the following:

German Government Doesn’t Think Bitcoin Threatens Financial Stability

Officials from Germany’s federal government do not believe that Bitcoin poses a threat to the existing financial structure, as the volume of crypto transactions is too low compared to the size of the global financial system to be a great influence. However, the government added that cryptocurrency should be regulated as they continue to monitor the crypto space.

Proposed Bills In Michigan Classify Blockchain Tampering As Crime

Two bills currently proposed in the Michigan state legislature would make altering the public digital record on a blockchain with intent to defraud into a felony punishable by up to 14 years in prison, as well as adding definitions of distributed ledger technology to the Michigan penal code.

CBOE President Says SEC Calling ETH Not A Security Paves Way For ETH Futures

The president of CBOE–which released the first Bitcoin futures last December–said that the SEC’s recent decision that Ethereum will not be regulated as a security has removed a big “stumbling block” from the possibility of offering Ether futures.

Source: cointelegraph


Analysis


EOS/USD

From last Monday, the price of EOS has dropped from 11.3$ to 10.22$ which is 9.28% decrease.


As you can see from the daily chart, last Monday’s opening was the highest price it has been, and that level now serves as resistance. On June 13th, on which we saw the market experienced a low was also the day that EOS was at its lowest, closing as a Doji on that day. The next day price recovered significantly but was stopped out by the resistance of Monday’s open. Currently, the price pattern is looking unstable and I would expect another low from here to around 9.1$ at least which was last weeks low, or even further down to the support at 8.69$.


Market sentiment 

Daily chart technicals signal a sell.

Oscillators are signalling a sell, and moving averages a strong one.


Pivot points

S3 1.1720
S2 6.2113
S1 8.3731
P 11.2506
R1 13.4124
R2 16.2899
R3 21.3292


LTC/USD

From 108.461$ which was the opening price last Monday, the price of Litecoin has decreased by 13.87% and is currently 93.395$ per Litecoin.


As you can see from the daily chart, the opening on 11th of June was the highest price Litecoin has been, and since then it has fallen to 89.277$ on 13th of June and recovered slightly, but today’s candle is on the levels of 13th of June’s close. The price is currently about to break out from the triangle in which it was consolidating, and judging by the market sentiment the breakout from the downside is expected.


Market sentiment

Daily chart technicals signal a sell.

Oscillators signal a sell, and moving averages a strong one.


Pivot points

S3 44.706
S2 72.869
S1 84.755
P 101.032
R1 112.918
R2 129.195
R3 157.358


DASH/USD

The price of Dash has dropped from 281.27$ which was the opening price on Monday 11th of June to 251$ where it is currently sitting, which is a decrease of 10.2%.


As you can see from the daily chart, the price of Dash has followed the same pattern as the other cryptos as markets are strongly correlated – the price was at its highest on last Monday, its lowest on 13th of June and is now looking like its going to break out from the downside of triangle.


Market sentiment

Dashes daily chart technicals signal a sell.

Oscillators are signalling a buy, and moving averages signal a strong sell.


Pivot points

S3 130.32
S2 198.03
S1 231.81
P 265.73
R1 299.51
R2 333.43
R3 401.14

XMR/USD

From last Monday until today, the price of Monero has been dropping from 140.89$ to 103.84$ on 13th of June which was the lowest Monero has gone in the past week. Since that low, the price has recovered and went above the support line at 121.775$, but is now back below it.


On the daily chart, we can see that the support at 121.775$ is a significant level as that was the prior range resistance, from which the price went on a steep upward trajectory to the all-time high. We will see what happens on this level, maybe today’s candle will close above it, however, that’s highly unlikely considering the market correlation and the bearish sentiment.


Market sentiment 

Monero’s daily chart technicals signal a strong sell.

Oscillators are on sell, and moving averages signal strong one.


Pivot points

S3 22.723 
S2 75.123 
S1 100.647 
P 127.523 
R1 153.047 
R2 179.923 
R3 232.323

Conclusion


Crypto Weekly Update: As the prices were mostly consolidating after the low experienced on June 13th, the crypto market was mostly stagnating. The consolidation period is near completion and from my analysis of the four cryptocurrencies that are covered in this report, I conclude that we are in for another low. This week will most likely be the week of the retest of the lowest points cryptos have experienced in this prolonged correction after which I am expecting a short-term trend reversal.

This was my projection published on 02.06.2018 in my weekly update post, and it looks like it all going in accordance with my projection. What I meant by a ‘retest of the lowest points cryptos have been’ is to see the market at around $250B. After that, I would expect a short-term trend reversal to slightly below last high and then a final down move that many would consider ‘capitulation’, but I would consider it a great buy opportunity.


Crypto Weekly Update Chart

Market cap on 02.06.2018 with my drawn projection 


Market cap today 


For more on what I think it’s coming next, make sure to check out the weekly update video in which I will provide my longer-term analysis and the potential scenario of this correction using Elliott Wave principles.

Categories
Crypto Market Analysis

Daily Crypto Update 18.06.2018 – Another Low Ahead


General Overview


Market Cap: $276,643,180,630

24h Vol: $10,182,196,782

BTC Dominance: 40.1%

From yesterday’s open at 281,509,000,000 cryptocurrency market cap has decreased by around 4,5 billion dollars. The evaluation has been hovering around these levels for the most part as you can see from the graph below.

It looks like its forming a plateau as market participants are waiting to see if this is the bottom. Buyers don’t want to come in just yet as prices may decline further, and those who are thinking of selling don’t want to sell if this is the bottom.

Currently, the market is mostly in red, with an average percentage change ranging between 1-3%.


News


There aren’t any significant news items that came out over the weekend that could impact the market neither positively or negatively. Most significant headlines are those regarding technical improvements in particular cryptos and situations in their ecosystem.

Out of those stories that fit into this category the first that stands out is that Bitcoin Core Version 0.16.1 has been launched, according to the post from Linux Foundation

This is a new minor version release, with various bugfixes as well as updated translations.

This Bitcoin Core version removed miner block size recalling the depreciation of the “-blockmaxsize” option for miners to limit their blocks’ sizes in version 0.15.1. It states that miners now should apply “-blockmaxweight” option if they want to limit the weight of their blocks.

Ethereum is going to combine Casper and Sharding upgrades, as reported by cointelegraph.

The key point of the recent meeting is rescheduling the releases of two main Ethereum chain upgrades such as Casper and Sharding. Casper should have been released as a smart contract separately from the sharding upgrade. The new proposals suggest that Casper may be released on a shard, or a sidechain instead.

EOS blockchain is live again after a bug froze the network

The bug is now fixed and the network is up and running.


Analysis


BTC/USD

From yesterday’s opening at 6542$, the price of Bitcoin has decreased by 2.05% as it is currently sitting at 6430$.


As you can see from the hourly chart the price action has formed a symmetrical triangle and it looks like a breakout is soon going to happen. After the price consolidated a bit, it looks like it ready for a move, and I think a move to the downside is more likely to around 6000$, to retest of the lowest points and give potential buyers a better price, as the last low hasn’t triggered significant amount of buying that could push the price upward.


Market sentiment

Hourly chart technicals signal a sell overall.

Oscillators are signalling a buy, and moving averages a strong sell.


Pivot points

S3 6182.3
S2 6330.5
S1 6384.5
P 6478.7
R1 6532.7
R2 6626.9
R3 6775.1


ETH/USD

From yesterday’s high at 507$, the price of Ethereum has decreased by 3% and is now 492,68$.


Looking at the hourly chart we can see that the price action is also forming a triangle like in the case of Bitcoin. The breakout from the downside is more likely as the purple line represents the resistance from the descending channel which held the price strong in the past.


Market sentiment

Hourly chart technicals signal a strong sell.

Oscillators are on sell, and moving averages on a strong one.


Pivot points

S3 469.31
S2 484.44 
S1 490.76 
P 499.57 
R1 505.89 
R2 514.70 
R3 529.83

LTC/USD

The price of Litecoin has decreased over the last 24 hours by 4.21% – from 97.65$ to 93.66$.


Again we can see a triangle forming as market correlation is strong in the bear market, and judging by the steep angle of the triangle resistance line we can conclude that sellers are more aggressive at the moment, which means the breakout from the downside is more likely.


Market sentiment 

Litecoin is in the sell zone.

Oscillators are on neutral, and moving averages signal a strong sell.


Pivot points

S3 88.024 
S2 91.986 
S1 93.430 
P 95.948 
R1 97.392 
R2 99.910 
R3 103.872

Conclusion


As you have seen consolidative triangles are on all of the cryptos that I have covered in this report, and the breakout is about to happen today. As market sentiment is bearish, technical indicators signal a sell and judging by the steepness of the resistance line from the triangles I conclude that we are in for another low. I am expecting the price of Bitcoin to retest 6000$ level, Litecoin to 85$ and Ethereum to 460$ or less. Overall that would mean another 8% drop in the whole market which would bring the crypto market cap to around 250B which was the prior low.

Categories
Crypto Market Analysis

Daily Crypto Update 14.06.2018 – Is The Bottom In?


General Overview


Market Cap: $280,634,597,761

24h Vol: $16,964,367,687

BTC Dominance: 39.8%

In the last 24 hours, the cryptocurrency market cap went from around $281B to 264,215,000,000$ which was yesterday’s low and from there on, the evaluation has been on a rise. 

Currently, the market is mostly in green but with an average percentage change ranging from 2 to 5% amongst the top 100 coins. Biggest gainers are Icon +13%, Siacoin 23.9%, Nano 17%, All Sport +25%. Out of those who are in red biggest losers are Emercoin -7%, Maker -5.5% and Dogecoin -5.16%.


News


There isn’t any significant news that can impact the market sentiment. News stories that came out are mostly negative or neutral, but there are positive once. Most significant headlines that came out in the last 24 hours are the following:

Finance professor at the University of Texas, John Griffin, an academic with a history of spotting fraud in financial markets conducted a research in which he concluded that Bitcoin’s price was artificially inflated last year, through Tether and Bitfinex, as reported by NY Times.

Mr. Griffin looked at the flow of digital tokens going in and out of Bitfinex and identified several distinct patterns that suggest that someone or some people at the exchange successfully worked to push up prices when they sagged at other exchanges. To do that, the person or people used a secondary virtual currency, known as Tether, which was created and sold by the owners of Bitfinex, to buy up those other cryptocurrencies.

Thomson Reuters adds sentiment data tracking of 100 Top Cryptocurrencies

Canadian mass media and information company Thomson Reuters will now be tracking the top 100 currencies in its sentiment data tool. The necessary data will be provided via a partnership with MarketPsych Data LLC, according to a WebWire press release published Wednesday, June 13.

Google Trends: Bitcoin in Its Dark Hours Still More Popular Than Beyonce

Google searches for Bitcoin have reportedly declined 75 percent through 2018, yet the leading cryptocurrency is still outstripping the famous music star Beyonce on Google Trends, CNBC reported Tuesday, June 12th.

Ripple CEO Claims Bitcoin Is Under Control of Small Group of Miners From China

Ripple’s CEO Brad Garlinghouse said that “Bitcoin is really controlled by China,” speaking at the 2018 Stifel Cross Sector Insight Conference in Boston, financial news outlet TheStreet.com reported June 12.

Ripple: Banks Unlikely to Apply Blockchain for Cross-Border Payments in Near Future

Ripple chief cryptographer David Schwartz claims that banks are unlikely to deploy blockchain to process international payments, citing low scalability and privacy problems, Reuters reports June 13.

Western Union Will Not Add Crypto Transfer Support in Near Future, Says CEO

Western Union Co. CEO Hikmet Ersek said the global money transfer service will not add a cryptocurrency transfer solution to its services anytime soon, MarketWatch reported June 13.


Analysis


BTC/USD

In the last 24 hours, the price of Bitcoin has spiked down from 6541$ to 6112$ and quickly bounced off of that level leaving a wick. The price is currently sitting at 6483$ which is just slightly below yesterday’s opening.


Looking at the hourly chart we can see that the spike down was below the 0 Fibonacci level, and the price is currently struggling to go above it, as indicated from the wicks on the upper side of the candles. I have labelled with a rectangle the prior low pattern and it looks similar to the current one. My target for this low was at 6000$ which was the lowest low of this correction so far, and I think we were going to retest it. This still may be happening so the question imposes – is the bottom in? Judging by the spike and a quick bounce we could say that, but we will have to wait for a confirmation.


Market sentiment

Hourly chart technicals are not useful, as they are all on neutral.


Pivot points

S3 5330.6 
S2 5834.4 
S1 6064.8
P 6338.2 
R1 6568.6 
R2 6842.0 
R3 7345.9

LTC/USD

The price of Litecoin has decreased from just slightly below 100$ to 89.2$ at the lowest point yesterday and has recovered since to 96.16$ where it is currently sitting, which is an overall decrease of 3.49%.


Similar to Bitcoin we can see the spike down as a wick on the hourly chart, which means that the spike happened in less than an hour. From that, we can conclude that buying was triggered and buyers were eager to buy at those levels quickly, as they figured it was a great price to get in. I am expecting it to maybe retest those levels again, much like it did previously.


Market sentiment 

Litecoin hourly technicals signal a buy.

Oscillators are on buy, and moving averages are on a buy.


Pivot points

S3 71.966 
S2 83.149 
S1 88.335 
P 94.332
R1 99.518 
R2 105.515 
R3 116.698

NEO/USD

From yesterday’s opening at 41.4$, the price of Neo has dropped to 35.85$ and has recovered since to just slightly below 40$ where it is sitting currently.


As you can see from this hourly chart, this was my short-term projection and the target had a slightly offset but I was close. The price of Neo is currently interacting with the support area so we will see if it serves as resistance or not. If it does serve as resistance I would expect the price to go slightly below my target but the candle to close on it.


Market sentiment 

Hourly chart technical signal a buy.

Oscillators are on buy, and moving averages are on neutral.


Pivot points

S3 26.84
S2 32.61
S1 35.27
P 38.38
R1 41.04
R2 44.15
R3 49.92


Conclusion


The prices of three major cryptos that were covered in this report missed the lowest lows in this correction just slightly. In the case of Bitcoin, that’s at 6000$ which was my short-term target. The question that everyone is asking is “is the bottom in” cannot be answered conclusively still. Judging by the quick spike and a quicker recovery we can definitely say that buying was triggered, but are those buyers going to propel the price upward and cause a trend reversal we will see. I was really hoping to see a retest of the lowest lows, and I still think there’s a possibility that we see another low and another spike and a quick recovery. What I can say at this moment regarding this matter is that the bottom is in this area, and we are likely going to see some sideways action today before a confirmation.

Categories
Crypto Market Analysis

Daily Crypto Update 13.06.2018 – Another Flash Crash Coming?


General Overview


Market Cap: $272,840,869,681

24h Vol: $15,609,802,094

BTC Dominance: 40.4%

In the last 24 hours, the cryptocurrency market cap has declined from 295,086,000,000$ to around 272 billlon dollars which is a 23 billion dollar decrease.

The market is currently in the red, with an average decrease ranging from 10-15%. Among top 100 coins, only Decentraland (+2%) and Emercoin (+5%) are in the green.


News


Top headlines that came out in the last day are mostly regarding corporations and major players adopting blockchain technology. Some of the most significant news that fit into that category are the following:

Multiple Russian corporate giants have created a joint venture that plans to develop projects in blockchain and the digital economy, as reported by TASS.

Russian telecom company MegaFon, Gazprombank, government corporation Rostec, and the USM Group have created a joint venture – referred to as MF Technologies (MFT) – that is worth $450 mln and has a 59 percent stake in Russian Internet giant mail.ru.

Argo, crypto mining firm, set to become London Stock Exchange’s first blockchain listing, as reported by Bussines insider.

After launching its subscription service for mining contracts the same day, the company says it plans to hold an IPO, following a $2.5 mln funding round it completed in January of this year.

Argo says it aspires to “democratise” the mining landscape for four altcoins – Bitcoin Gold, Ethereum, Ethereum Classic and Zcash – by renting computing power from an eco-friendly facility located in Quebec.

 VeChain (VEN), Singapore-based blockchain startup, and DB Schenker, global logistics provider, have co-developed a blockchain-based supplier evaluation system, according to cointelegraph

A new decentralised application (DApp) will use the VeChainThor blockchain to score DB Schenker’s third-party logistics partners in China based on collected data – the result being an evaluation for services such as packaging, transportation, and the quality of goods.

Out of news that fit into this category, the story reported by Korea JoongAng Daily regarding South Korean commercial banks launching a blockchain-powered customer ID verification platform is the most significant one.

Korea Federation of Banks (KFB) will launch their “BankSign” identity verification system to be used in both online computer-based and mobile banking. According to Korea JoongAng Daily, the move is intended to replace the 20-year old public verification system that is reportedly notorious for its complexity and inefficiency.

Other significant headlines that are leaning on the side of the general sentiment toward cryptocurrencies are those that came from Germany and Financial Action Task Force (FATF).

The German Federal Government has stated that cryptocurrencies do not pose a threat to financial stability, Cointelegraph auf Deutsch reports today, June 12. Nevertheless, the government sees the need for regulatory measures to control digital currencies.

The Financial Action Task Force (FATF), the international group that combats money laundering and terrorism financing, will start developing binding rules for crypto exchanges in June, a Japanese official familiar with the matter told Reuters June 12.

The new rules would be an upgrade to the non-binding resolutions which were adopted by the FATF in June 2015. The FAFT will consider whether existing guidelines on anti-money laundering (AML) measures and reporting suspicious trading activity are still appropriate, and if they can be applied to new exchanges. The intergovernmental organisation will also reportedly investigate how to work with countries who have moved to ban cryptocurrencies.

Source: cointelegraph.com


Analysis


BTC/USD

From yesterday’s opening at 6853$, the price of Bitcoin has decreased by 5.49% and is currently sitting slightly below 6500$.


Looking at the hourly chart, we can see that the price is now below 0 Fibonacci retracement level and below the unconfirmed baseline support 2. In my weekly update, I have stated that I would expect the price to continue falling down to these levels, as there was no strong support prior that can hold the momentum. I am expecting the price to go even lower to around the 6000$ area which was the lowest point in this correction before we see some short-term trend reversal.


Market sentiment 

Hourly chart technicals signal a strong sell.

Oscillators are on sell, and moving averages signal a strong one.


Pivot points

S3 5743.2 
S2 6180.5 
S1 6362.2 
P 6617.8 
R1 6799.5 
R2 7055.1 
R3 7492.4

LTC/USD

From yesterday’s opening at 107$, the price of Litecoin has decreased by 11.12% and is currently sitting around 95$.


On the hourly chart, we can see that the price of Litecoin is in a straightforward downfall and is going to continue moving in a downward trajectory as there’s no support until the wedge support line (blue dotted line) at 85$, so I am expecting interaction with it soon.


Market sentiment

Litecoin is in the sell zone, as indicated by hourly chart technicals.

Oscillators are one sell, and moving averages signal a strong one.


Pivot points

S3 79.310 
S2 90.506 
S1 95.165
P 101.702 
R1 106.361 
R2 112.898 
R3 124.094

OMG/USD

In the last 24 hours, the price of OmiseGo has declined by 9% – from yesterday’s open at 9.97$ to 9.08$ where it is currently sitting.


Looking at the hourly chart we can see that the price found some support at the current levels, but I don’t believe that it will bounce off of it as selling pressure is strong. Most likely, the price is going to continue its downward movement and will interact with the 0 Fibonacci level much like it did in the case of Bitcoin, and form a double bottom at around 8$ level.


Market sentiment

OmiseGO is in the sell zone.

Oscillators are on buy, and moving averages signal a sell.


Pivot points

S3 7.1564 
S2 8.2784 
S1 8.6688 
P 9.4004 
R1 9.7908 
R2 10.5224 
R3 11.6444

ZRX/BTC

From yesterday’s open the price of 0x has decreased by 15% coming from 15542 Satoshi to 13222 Satoshi where is currently sitting.


Looking at the daily chart we can see that the price pathway was, as I have projected it would be, in a bearish scenario – the handle pattern is a downward channel and the price fell down to the channel support for a retest.


Zooming into the hourly chart we can clearly see the interaction with the channel support – the price is currently below it and is back to retest it for resistance. We will see if the breakout will happen and the price breaks from the cup and handle on the downside, or will it bounce back into the channel range and continue on as I have projected the pathway.


Market sentiment 

Hourly chart technical signal a strong sell.

Oscillators are on sell, and moving averages on a strong one.


Pivot points

S3 0.00010967
S2 0.00012567
S1 0.00013133
P 0.00014167
R1 0.00014733
R2 0.00015767
R3 0.00017367


Conclusion


As the prices of the cryptocurrencies that were covered in this report are still in a downfall with no real support in sight, I conclude that we are in for more downside. We could see a short-term trend reversal if the prices are so low that the potential buyers couldn’t resist not buying.  That’s why I believe that this trend continuation will maybe even be another flash crash, which will spike down to new lows that would exceed prior once, which would in the case of Bitcoin be around 5700$.

Categories
Crypto Market Analysis

Weekly Crypto Update 12.06.2018 -Indecision (VIDEO)

From last Monday, 4th of June, cryptocurrency market capitalisation has decreased from 350,914,000,000$ to slightly below $300B where it is currently, which is a 51 billion dollar decrease.

After we have seen the prices decrease over the last 7 days, we are likely to see some sideways action in this one, followed by indecision over the weekend. I think that the prices are going to retest prior support levels which now serve as resistance and fall back further to the levels of prior lows, which for Bitcoin would be around the 6000$ area. That may trigger some buying or may create a panic selling. I am considering this week a ‘no-trade week’ as long as I don’t see either retest of the prior lows or a confirmation of a trend reversal.

For the reasons why I think that, make sure to check the video.

Categories
Crypto Market Analysis

Weekly Crypto Update 12.06.2018 – Indecision


General Overview


Market Cap: $299,872,893,997

24h Vol: $14,697,169,020

BTC Dominance: 39.1%

From last Monday, 4th of June, the cryptocurrency market capitalisation has decreased from 350,914,000,000$ to slightly below $300B where it is currently, which is a 51 billion dollar decrease.


Analysis


BTC/USD

From last Monday, the price of Bitcoin has decreased by 11.87% from 7749$ to 6814 where it’s currently sitting.


Looking at the daily chart we can see that the price has broken out from the triangle and found support on the unconfirmed baseline support 2 (dotted line) that dated back from 23.03.2017. The price is currently recovering from yesterday’s low and is likely heading toward the triangle’s support for a retest of resistance.


Market sentiment 

Bitcoin daily chart technical signal a sell.

Oscillators are on neutral, and moving averages signal a strong sell.


Pivot points

S3 6735.8 
S2 7142.8 
S1 7320.7 
P 7549.8
R1 7727.7 
R2 7956.8 
R3 8363.8

ETH/USD

From last Monday, the price of Ethreum has decreased by 14.62% – from 620$ to 529.70$ where it is currently.


Looking at the daily chart we can see that the price broke four support lines since Monday – 0.382 Fibonacci level,  569.47$ support (red line), channel resistance which served as support (purple line) and the support at 539.5$ (black line). The last three were broken by the red candle two days before on Sunday when the price found support at 0.236 Fibo level.


Market sentiment 

Ethereum daily chart technicals signal a sell.

Oscillators are on neutral, and moving averages signal a strong sell.


Pivot points

S3 492.69 
S2 545.99 
S1 569.60 
P 599.29 
R1 622.90 
R2 652.59 
R3 705.90

XRP/USD

From last week, Ripple’s price has decreased by 16.88%, dropping from 0.689$ to 0.574$ where it is currently sitting.


Looking at the daily chart we can see that the price is currently sitting on the unconfirmed support line (dotted purple line), which will be confirmed if the price finds support now after this current retest. Prior to that, support at 0.236 Fibonacci retracement level has been broken and the price found temporary support on the 0.573$ level, leaving a wick below it close to the prior low levels.


Market sentiment 

Ripple daily chart technicals signal a strong sell.

Oscillators are on sell, and moving averages signal a strong one.


Pivot points

S3 0.51906 
S2 0.59188
S1 0.62438 
P 0.66470
R1 0.69720 
R2 0.73752 
R3 0.81034

LTC/USD

The price of Litecoin has dropped by 16.43% in the last week, as the price fell from 126$ to 104,8$ where it is currently.


On the daily chart, we can see that the price is below the retracement zone which serves as a strong support in the past and is now going to serve as strong resistance. The price is likely going to retest how strong that resistance really is, so I am expecting a short-term upward movement to those levels at around 111$ before another drop. The next low I am looking at is the wedge support line (dotted blue line) which is at around 85.4$.


Market sentiment 

Litecoin is in the sell zone.

Oscillators are neutral, but moving averages signal a strong sell.


Pivot points

S3 92.713 
S2 106.843
S1 112.077 
P 120.973 
R1 126.207 
R2 135.103 
R3 149.233

Conclusion


After we have seen the prices decrease over the last 7 days, we are likely to see some sideways action in this one, followed by indecision over the weekend. I think that the prices are going to retest prior support levels which now serve as resistance and fall back further to the levels of prior lows, which for Bitcoin would be around 6000$ area. That may trigger some buying or may create a panic selling. I am considering this week a ‘no-trade week’ as long as I don’t see either retest of the prior lows or a confirmation of a trend reversal.

As far as the global chart is concerned this was my last week’s projection 

So far, it is playing out as I have projected as I think we will have another low to around $250B which would be a retest of prior lows.