
The crypto sector experienced dipped over $100 billion in market cap as Bitcoin, and the rest of the market plummeted. Bitcoin is currently trading for $35,165, representing a decrease of 13.31% compared to yesterday’s value. Meanwhile, Ethereum’s price has dropped up to 20.64% on the day, while LTC lost 23.04% of its value.

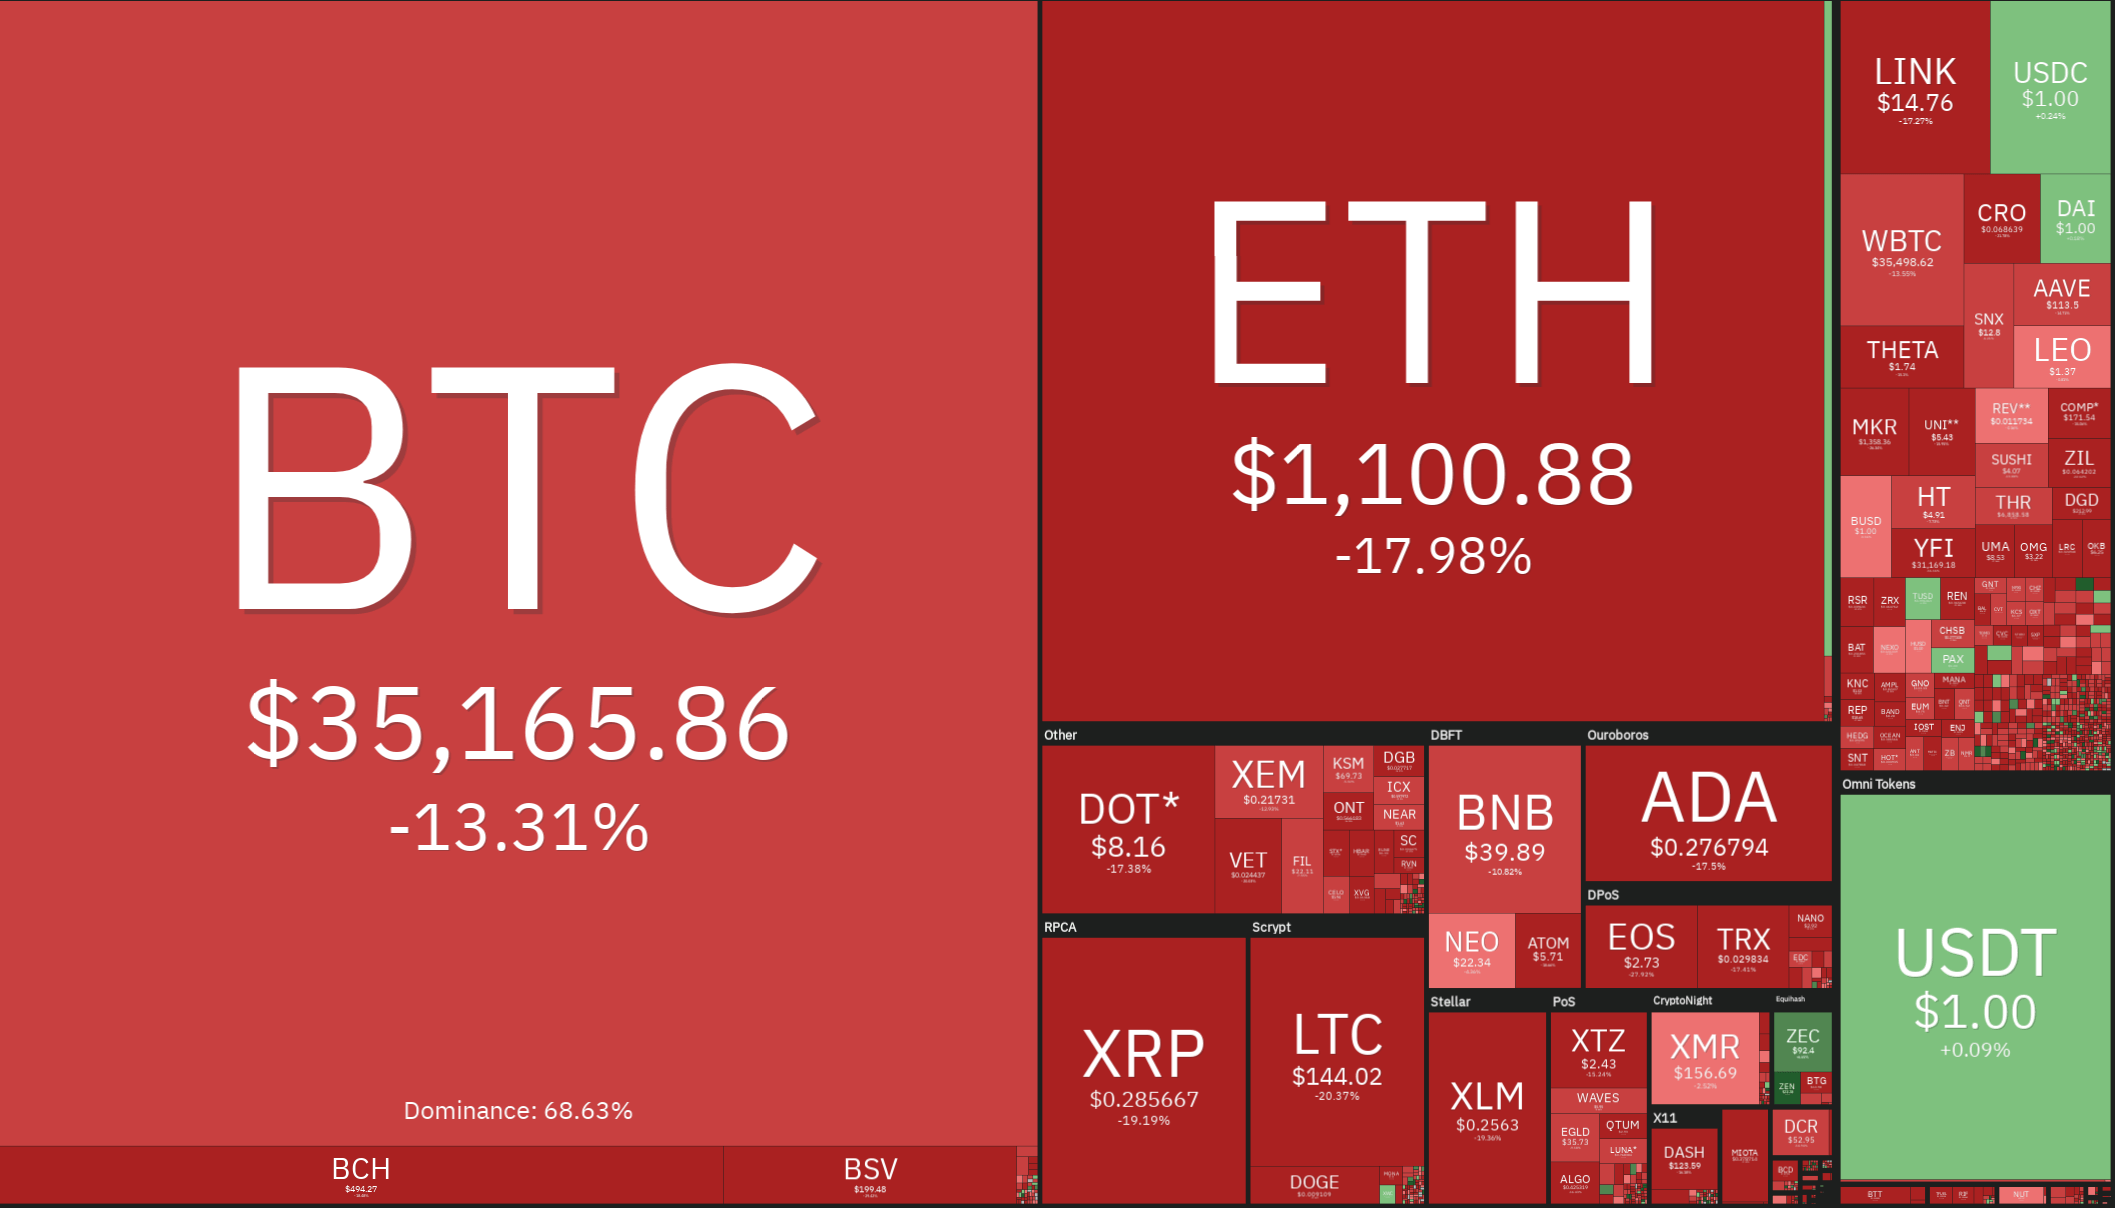
Daily Crypto Sector Heat Map
Foglory Coin gained 589.61% in the past 24 hours, making it the most prominent daily crypto gainer by far. It is followed by NewsToken’s 175.33% and BELIEVER’s 166.3% gain. On the other hand, True Seigniorage Dollar lost 78.35%, making it the most prominent daily loser. It is followed by the 3x Long Bitcoin SV Token’s loss of 76.74% and 3x long EOS Token’s loss of 69.18%.

Top 10 24-hour Performers (Click to enlarge)
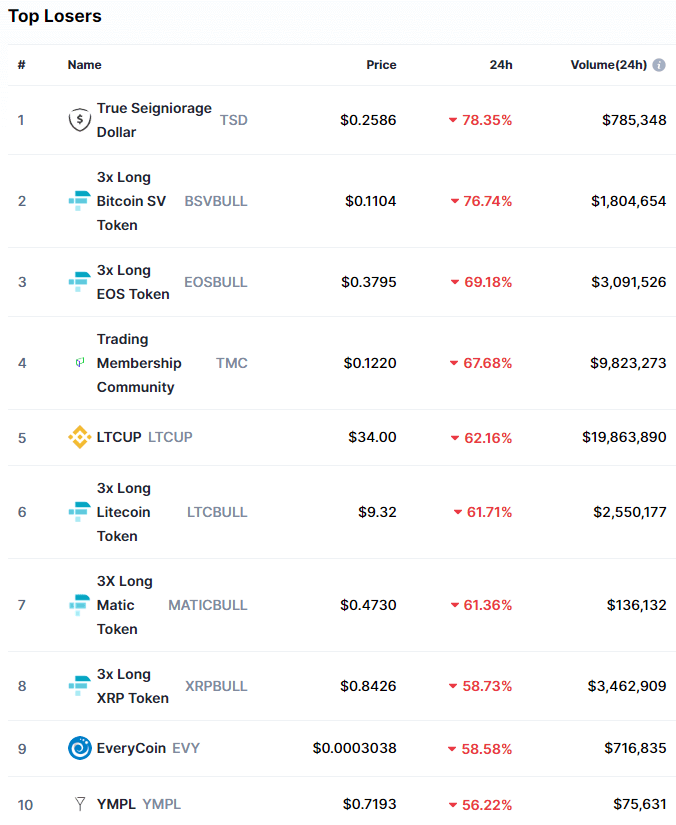
Bottom 10 24-hour Performers (Click to enlarge)
Bitcoin’s market dominance has moved down over a percent since our last report, with its value currently being 68.6%. This value represents a 1.2% difference to the upside than the value it had when we last reported.
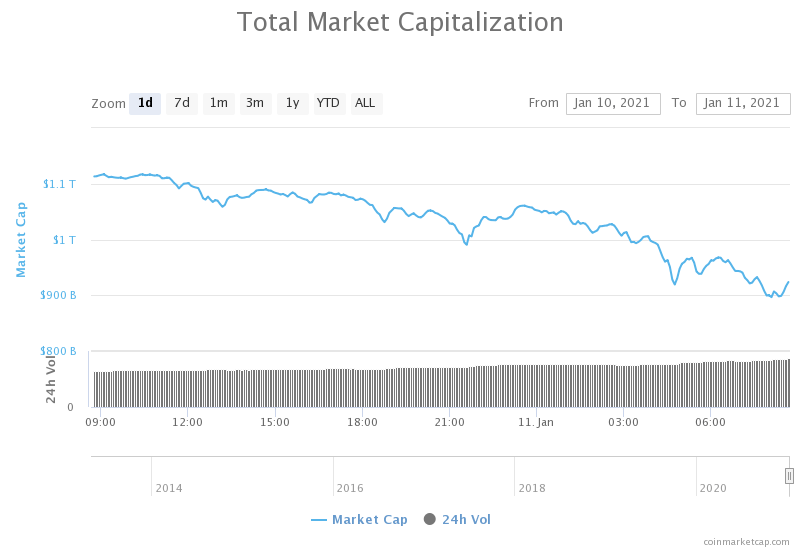
Daily Crypto Market Cap Chart
The cryptocurrency sector capitalization has decreased slightly since we last reported, with its current value being $906.07 1,03 trillion. This represents a $2 billion decrease when compared to our previous report.
_______________________________________________________________________
What happened in the past 24 hours?
_______________________________________________________________________
- DeFi project offers new way to trade the entire $1 trillion crypto market (The Block)
- December trading volumes for Bitcoin futures and options surpassed the previous month’s all time highs (The Block)
- Litecoin Will Get Smart Contracts via Flare Networks (Cryptobriefing)
- Morgan Stanley’s $500 Million Microstrategy Bet a “No-Brainer,” According to Expert (Cryptobriefing)
- EOS Plummets After Block.one CTO Dan Larimer Resigns (Cryptobriefing)
- Polkadot becomes first blockchain platform to rebrand through a bounty program (Cryptoslate)
- Yearn.finance founder hints at collaboration with top DeFi protocol Curve (Cryptoslate)
- Cardano becomes the most decentralized network on the market with majority of ADA supply staked (Cryptoslate)
- Long-Desired Bitcoin ETF Could Actually Hurt Price in Short Term: JPMorgan (Coindesk)
- Crypto user recovers long-lost private keys to access $4M in Bitcoin (Cointelegraph)
_______________________________________________________________________
Technical analysis
_______________________________________________________________________
Bitcoin
Bitcoin has had an interesting weekend, with its price plummeting in recent hours. Its price dipped to the lows of $32,330 just a few hours ago as major buy positions got liquidated. The largest cryptocurrency by market cap slowly fell below the 21 and 50 moving averages, confirmed its position below then, and then headed straight to the downside with almost no pushback.
However, bulls picked up the pace and are currently fighting for the $35,000 level. Investors used this as a buying/accumulation opportunity, while most traders got liquidated (both short and long positions due to the sudden volatility).
BTC/USD 1-hour chart
Bitcoin’s technicals on the daily, weekly, and monthly time-frame show a tilt towards the buy-side with no or slight signs of neutrality, while its 4-hour overview shows a slight tilt towards the sell-side.
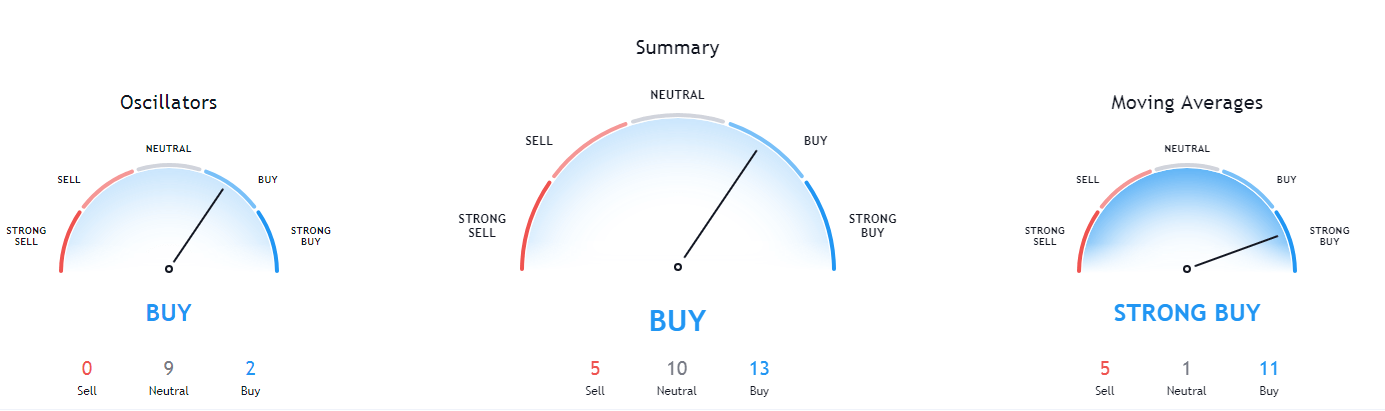
BTC/USD 1-day Technicals
Technical factors (1-hour Chart):
- Price is below both its 50-period EMA and its 21-period EMA
- Price is near its bottom Bollinger band
- RSI is near the oversold territory (37.28)
- Volume is above average
Key levels to the upside: Key levels to the downside:
1: $36,640 1: $33,200
2: $40,000 2: $30,640
3: $42,000 3: $27,960
Ethereum
Ethereum matched Bitcoin in direction, but did so with increased intensity. The second-largest cryptocurrency by market cap dipped over 20% on the day as its price fell to just above $1,000. This level seems to have held quite nicely, creating space for Ether to recover.
Ethereum is now trading above the $1,060.5 support level and shows no signs of falling again. However, Bitcoin’s movement will greatly affect the future price direction of ETH.
ETH/USD 1-hour Chart
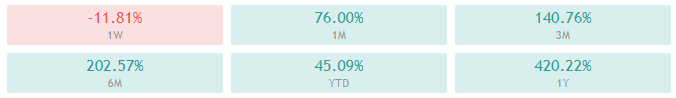
Ethereum’s technicals on the daily, weekly, and monthly time-frame show a tilt towards the buy-side with no or slight signs of neutrality, while its 4-hour overview shows a slight tilt towards the sell-side.
ETH/USD 1-day Technicals
Technical Factors (1-hour Chart):
- Price is below both its 50-period and its 21-period EMA
- Price is near its bottom Bollinger band
- RSI is near the oversold (31.12)
- Volume is significantly above-average
Key levels to the upside: Key levels to the downside:
1: $1,129 1: $1,060.5
2: $1,211 2: $1,047.5
3: $1,226.5 3: $992
Litecoin

Litecoin was one of the major gainers today as well, with its price dropping from $172 all the way down to $124. While bulls did pick up the pace and returned its price to the ~$140 zone, Litecoin is still fighting to maintain its position and tackle the $142.1 level.
Litecoin seemingly got hit the hardest out of the three cryptocurrencies, with its price position still being fairly uncertain. This could prove to be a trading opportunity as the cryptocurrency might make a move independent of Bitcoin’s move in the short future (if Bitcoin itself doesn’t move first).
LTC/USD 1-hour Chart
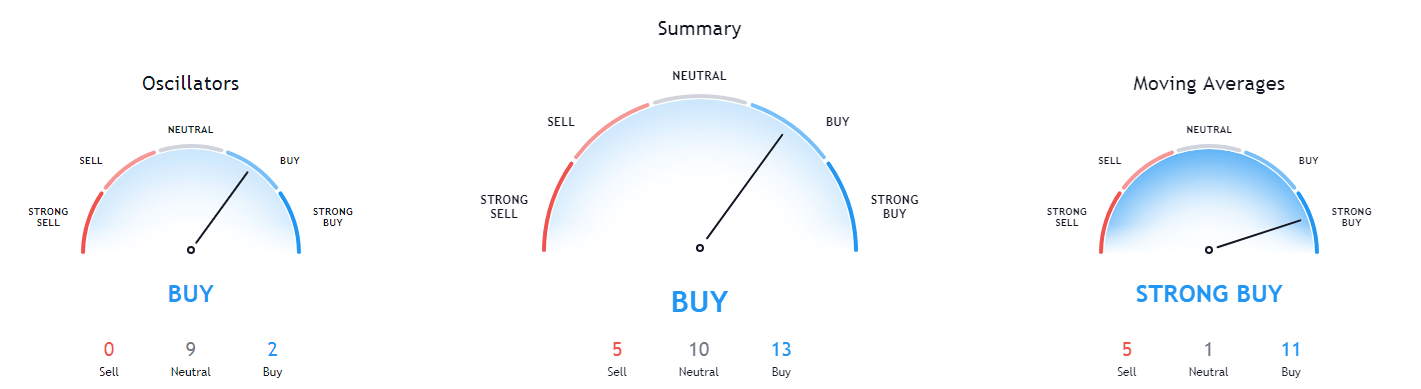
Litecoin’s technicals on the daily, weekly, and monthly time-frame show a tilt towards the buy-side with slight signs of neutrality, while its 4-hour overview shows a strong tilt towards the sell-side.
LTC/USD 1-day Technicals
Technical factors (1-hour Chart):
- Its price is currently below both its 50-period EMA and its 21-period EMA
- Price near its bottom Bollinger band
- RSI is in the oversold territory (29.68)
- Volume is on above-average levels
Key levels to the upside: Key levels to the downside:
1: $161.5 1: $142.1
2: $181.3 2: $128.42
3: $186.3 3: $114.75
Related posts
 Daily Crypto Review, Jan 15 – Bitcoin Retraces After Hitting $40k; Ethereum Contests $1.2k
 Daily Crypto Review, Jan 21 – BTC in a Triangle Formation – What do the Analysts Say?
 Daily Crypto Review, Jan 28 – Bitcoin Strong Bounce off the 30K level, Altcoins Reversals Followed
 Daily Crypto Review, Jan 29 – Dogecoin Skyrockets as r/Wallstreetbets Enters on Crypto; Bitcoin Jumps on Elon Musk’s Twitter Profile