Categories
Crypto Cryptocurrencies

Top 20 Fun & Interesting Facts About Bitcoin: Part 4

Last time, we got really deep with the transformative power Bitcoin has and what it realistically takes for everyone to live in a better world. Today, we keep on going, heading steadily towards our 20th fact.

Still, if you want to know why Bitcoin is the most credible and trustworthy currency in the world and where this transparency stems from, we advise you to go back and read the previous parts of this series. Now, let’s see why….

16: How Bitcoin is inherently different from central banks

While we did talk about different terms Ray Dalio used to describe free markets in the previous articles, now is the time to bring them all together and see how they can help us contrast Bitcoin and the central banks.

So, last time we introduced the idea of meritocracy, which Dalio defines as a combination of radical truth, radical transparency, and believability-weighted decision-making that essentially comprise free markets. What this entails is truthful price signals, a transparent and reliable rule of law, private property rights, and hard money, which we all defined in detail in previous parts of this series.

Now, how do these terms stand in comparison to central banking? 

First of all, central banks broke many of the principles that define free markets because central planning goes against free-market dynamics. Untruthful price signals, obscurity, lack of consensus and unreliability in terms of rules and related criteria, marginalized private property rights, confiscation of people’s wealth through inflation, poor decision-making and massive society structural issues are main descriptors and issues pertaining to central banks. 

Bitcoin, on the other hand, is reflected through absolutely truthful price signals. Moreover, Bitcoin is even more scarce than gold and we’ve learned before that scarcity is a crucial factor for any medium to move price signals. Bitcoin is also defined by transparency and reliability in terms of rule of law. Private property rights are equally honored in the case of each Bitcoin market participant. As we discussed before, Bitcoin is unlimited, meaning that wealth can’t be violently taken away from anyone. What is more, Bitcoin is absolutely hard money as well as incentives to keep each participant as invested as ever in maintaining the system functioning properly. 

17: Bitcoin cannot be affected by central planning

Unlike the macro system that governs fiat currencies, Bitcoin is unencumbered by central planning and thus central banks have no power over Bitcoin. It is a free market that is, hence, impervious to the inconsistencies inherent in central banks, predictions, and monetary policies.

Even when digital currencies are launched in all parts of the world, Bitcoin will remain the one true vehicle through which people across the globe will be able to carry out free trade without the scrutiny of political agendas and manipulation.

18: Bitcoin should be a long-term plan

Central banks are heavily buying gold, creating a hedge against other currencies. Last time we described how this works in detail, but today we want to stress the fact that you should really be following what the big banks are doing. 

Why?

— because if central banks are unaffected by their own bad decision-making and are drowning the people deeper and deeper into unemployment, homelessness, and poor living conditions, Bitcoin should serve as a means to escape the future of all those people whose entire wealth is their monthly paycheck. 

Bitcoin is still not widely penetrated and you could too hold one of the most valuable assets that can provide you with stability and relieve you of volatility.

It is a wise investment for the sake of your own future and the future of anyone you know because it is not just a lucrative investment but also a culture that should be spread globally. 

19: Bitcoin equals healthy culture

Last time when we talked about how Bitcoin participants are all incentivized to keep their game up we wanted to give you room to think about this principle.

Interestingly enough, ancient Roman architects had to abide by the law when providing their services. They were required to be joined by their family members in an act of proving that their work is of good quality by standing under the arches together. 

When we think of a central bank, we can’t think of any incentives or disincentives that would control their work quality. However, when we look at Roman architecture, we can still see intact 2000-year-old arches that stood the test of time.

This is what Bitcoin has to offer as well.

20: Bitcoin‘s track record is pristine

Bitcoin’s performance so far has been nothing but impeccable. For more than 10 years now since its inception, we have tracked over 99.99% uptime. What is more, the Bitcoin system has never been hacked nor endangered, and it now stands as one of the most secure and reliable computing networks in the world. Its market value is soaring and owing to its scarcity, it can do nothing but skyrocket even farther in the future. 

Now, this may be the end of our series on Bitcoin, but this is surely not the end for Bitcoin. We may have shared with you some of the most amazing facts on Bitcoin but the story of Bitcoin will surely generate more stories in the future that will have lasting effects on the world.

The potential of Bitcoin becoming the next global reserve currency is real and we may see Bitcoin one day become a unit of account. Its history has taught us to trust it and its path of creation is so unique that there is currently nothing we can compare it to.

As Victor Hugo said, Nothing is more powerful than an idea whose time has come. Bitcoin’s time has come and the reasons not to join the Bitcoin community is becoming fewer and fewer by the day.

The power of Bitcoin does not lie just in the prospective monetary gains but in what it has to offer to the world in terms of living conditions as well. The economy is not there to hold your hand and help you grow but Bitcoin is and Bitcoin can.

As we’ve shared earlier, it just takes a couple of hundreds of hours to your lasting financial freedom. Start learning about Bitcoin today for a better tomorrow and always consider assets that have similar properties as the ultimate hedge against wealth deterioration.

Categories
Crypto Cryptocurrencies

Top 20 Fun & Interesting Facts About Bitcoin: Part 3

We are heading confidently to the 20th fun fact on Bitcoin but the facts should not be taken lightly. These factors we’ve discussed in this series of articles impact us all. And, hopefully, they will help you decide for yourself what kind of future you want to be part of.

11. Bitcoin is not flawed

Having examined the nature of fractional reserve and of central banking, and having seen how the questionable blessings of Central Banking were fastened upon America, it is time to see precisely how the Fed, as presently constituted, carries out its systemic inflation and its control of the American monetary system. (Murray Rothbard, American writer, economist, and a major contributor to economics, history, political philosophy, and legal theory)

Last time, we offered a real insight into how results help people make their judgment, which is again an important perspective in understanding the value of Bitcoin. Now, we intend to present you with real numbers that go in favor of opting and keep investing in Bitcoin. 

Did you know that the central banks acquired 668 tons in gold purchases, which has continued to increase over the past few years? 

What do you think where did this demand came from? 

  • the central banks alone.

In fact, the first two quarters of 2019 on their own surpassed the previous year’s 50-year high. So, now, there is more gold than there ever was before in emerging countries’ treasuries. Now, this is a trend many countries, including Russia, China, India have started to follow in the recent past to hedge from the dollar as a reserve currency, but what conclusion does this leave us with?

So, while there has never been more gold, there has also never been more money printing as well. What central banks are doing is hedging on against the other and holding gold is a wise thing to do from their perspective. And, the question of why they need to do all this gets us back to the statement from the previous article – the system is flawed, which is why Bitcoin is a much-needed relief. Gold hoarding is not so evident in the US for now, however, this topic requires a special article.

12. Bitcoin is fair

Bitcoin is an escape from moral hazards that central planning entails. This is practically reflected in inflation because important facts are rarely discussed. Inflation is the cause of wealth inequality that we touched upon in one of the previous articles of this series. 

Wealth inequality occurs as a result of excessive money printing, which further devaluates the currency. Still, approximately 25 to 50% of people at the top don’t even keep their wealth in one currency.

And as these selected few protect themselves with their capital in real assets, they are free from the dangers of their country’s official currency devaluations. How does this happen? Well, when the value of the currency goes down, the price of real assets goes up. So, not only do we have a major disproportion in people in terms of how safe they are in the face of inflation but also in terms of wealth they possess.

A minimum of 50% of US citizens can’t afford a several-hundred-dollar-worth emergency payment, which further means that their paycheck is the only wealth in cash they possess. 

So, why do the rich get richer as the poor get poorer?

The answer is simple. The lucky ones will invest a portion of their cash in stocks or real estate for example, whereas everyday people will suffer the consequences of bad planning. What is more, the ones in the top tier will enjoy the benefit of not having to go through the same along with being protected from inflation.

What Bitcoin, conversely, offers is a world free of these games and inequalities. As an inflation-proof system, Bitcoin allows for a much fairer and more equal world. 

13: Bitcoin is protection from financial crises

Apart from the issues we described above, we cannot ignore the toll inflation has on the economy. When the financial crisis hit the world in 2008, we know what had preceded it – a beautiful bubble that skyrocketed the number of homeless people. Now that we’ve mentioned numbers… homelessness gradually increased since 2008 along with more money printing the US central bank relied on to fight inflation.

Still, what is even more interesting is that this picture correlates with the S&P 500’s chart. And, this is where we can go back to the transparency and truth Bitcoin entail that you will never find in the system that manages fiat currencies now. 

14: There are reasons why Bitcoin is to stay pure

We can all agree that central banks remain unaffected by their decision-making. However, all market participants also benefit from maintaining things in the Bitcoin world as they are. Node operators are incentivized to maintain the rules; miners are incentivized to keep doing their share of work efficiently with regard to Bitcoin ledger; developers invest time in supporting an open-source project; and, Bitcoin holders also expand their resources to acquire more Bitcoin. All participants are equally invested in maintaining Bitcoin at the current level because they are also rewarded and affected by it. 

15: Bitcoin is a meritocracy

Firstly, let us introduce the term meritocracy, which Ray Dalio used to describe a specific culture that he explained in detail in his book Principles. The meritocratic culture is the one where candid reviews of colleagues are welcome and encouraged. For example, at his company, Bridgewater, Dalio supported this idea that everyone can review anyone else, CEO included.

Still, meritocracy does not solely fall down to company culture and promotion of honesty, as the idea is much more complex than that. Dalio managed to present a world that surpasses the traditionalist autocratic or democratic systems because meritocracy is a paradigm that denotes a free market. Thus, the meritocratic world is the one where natural selection takes precedence, which is also true for Bitcoin.  

Unlike central banks, Bitcoin, as we could see from the past few articles, is not centrally controlled. Bitcoin is hence a system that is innately aligned with reason and is impervious to politics. Moreover, Bitcoin is marked by transparency and everything is out there for the world to see. Bitcoin is also ruled by supply and demand, just like gold, which is also a free market to this day. And, for all these reasons and against Ray Dalio’s personal beliefs, Bitcoin is, like many successful companies nowadays, an authentic example of the meritocratic world. 

See you soon in Part 4 to talk about new exciting, nerdy, eye-opening Bitcoin facts.

Categories
Crypto Cryptocurrencies

Top 20 Fun & Interesting Facts About Bitcoin: Part 2

Last time we learned what makes Bitcoin inherently different from everything you’ve ever seen before and, today, we are starting with the opposite, looking at some prominent similarities.

6. Bitcoin as a free market

We ended Part 2 of the series explaining how money is a vehicle, a tool people use to obtain the things they need most. Thus, as with any other tool, money serves the purpose of saving us time. We will naturally type more words on our computer than we will write words in the same period. 

Money is just a tool that helps us negotiate and execute trades more quickly. Still, the money we know now, the fiat currencies, are essentially created to fit a pyramid structure where top tiers derive value from the lower ones. And, the people at the very bottom are the everyday citizens using a particular fiat currency. That means the system we follow, wherever we are on this planet, is leverage-based. It cannot function without the accumulation of debt.

When governments took over the money market, they created a centrally planned design thus making it unfree. The main difference between the planned and the free market is that the latter is based on natural organizing principles. This further means that, in free markets, people strive to discover better ways of doing things by making bets among themselves. 

All regulations and limitations on free-market dynamics, which essentially entail monopoly, only reduce their efficacy. And, Economics teaches us that any monopoly increases prices decrease innovation, and reduces trade. Free markets, on the contrary, operate to economic benefit through increasing productivity.

If we look at Bitcoin, we see an open environment that is, in its essence, impervious to politics and free from artificial impediments and hierarchy. Technology has helped us take an important step in differentiation between how measurement should be carried out. What is more organic and necessary in this world – payment as per the number of hits an athlete makes in a game or payment based on a politician’s charisma?

Some large companies, such as Facebook, have long adopted this mentality where results come before ego. We do not need to debate things or fight who is right when we can see the results of people’s actions and, therefore, know what is to be done next. 

What we are seeing nowadays is this great divide between those who recognize the call for further embracing what Bitcoin is offering and the ones who are doing everything in their power to protect against the impending changes that are already taking place in the world.

This division essentially entails the rift between dominance and competence. People are no longer looking at who has more horses but who can guide and handle them more virtuously and skillfully. Domination is simply unsustainable, as the dominated will always find a way to get back at their subjugators. On the other hand, competence hierarchies entail ingenuity and innovation that rest on an entirely different idea, which is what Bitcoin exudes as well. 

The top-down approach is a thing of the past in so many ways. As Steve Jobs said, “Do you know how many committees we have at Apple? Zero. We are organized like a startup. We all meet for three hours once a week and we talk about everything we’re doing […] You have to be run by ideas, not by hierarchy.” And, the same applies to larger systems – politics, and money.

When we look at markets, we understand their important role in disseminating knowledge. Still, knowledge has a localized quality to it, meaning that people living in one area would naturally be more informed about economic circumstances specific to their space-time reality. Free markets, however, are exceptionally good at both assimilating and spreading the localized pools of data. As a nexus, free markets merge many minds into one through the mechanism of price.

The omnipotence of digital technology rests in its power to allow fluid exchange that dissolves these dominance hierarchies and rewards competence, which precisely what Bitcoin is about.

7. Bitcoin’s price as the ultimate truth

In the words of Ray Dalio, truth or more precisely an accurate understanding of reality is the essential foundation for any good outcome. This means that we need what he termed radical truth to create a world free of centralized dominance. In other words, free markets equal truthful price signals, which we will further explain down below. 

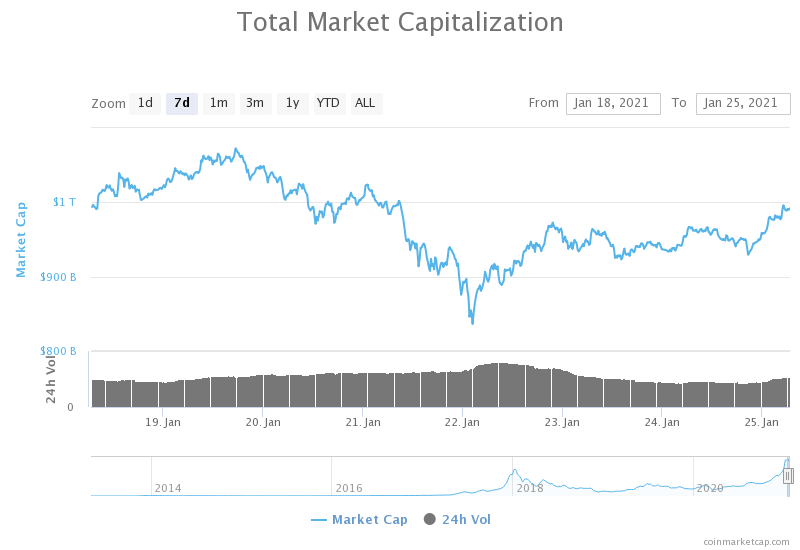
When we think of markets, we think of the price as truth that connects supply and demand. That way, prices are like data packets that convey information about scarcity and value. Therefore, each decision to buy or sell is based on prevailing prices that affect other market participants and thus continues the market exchange.

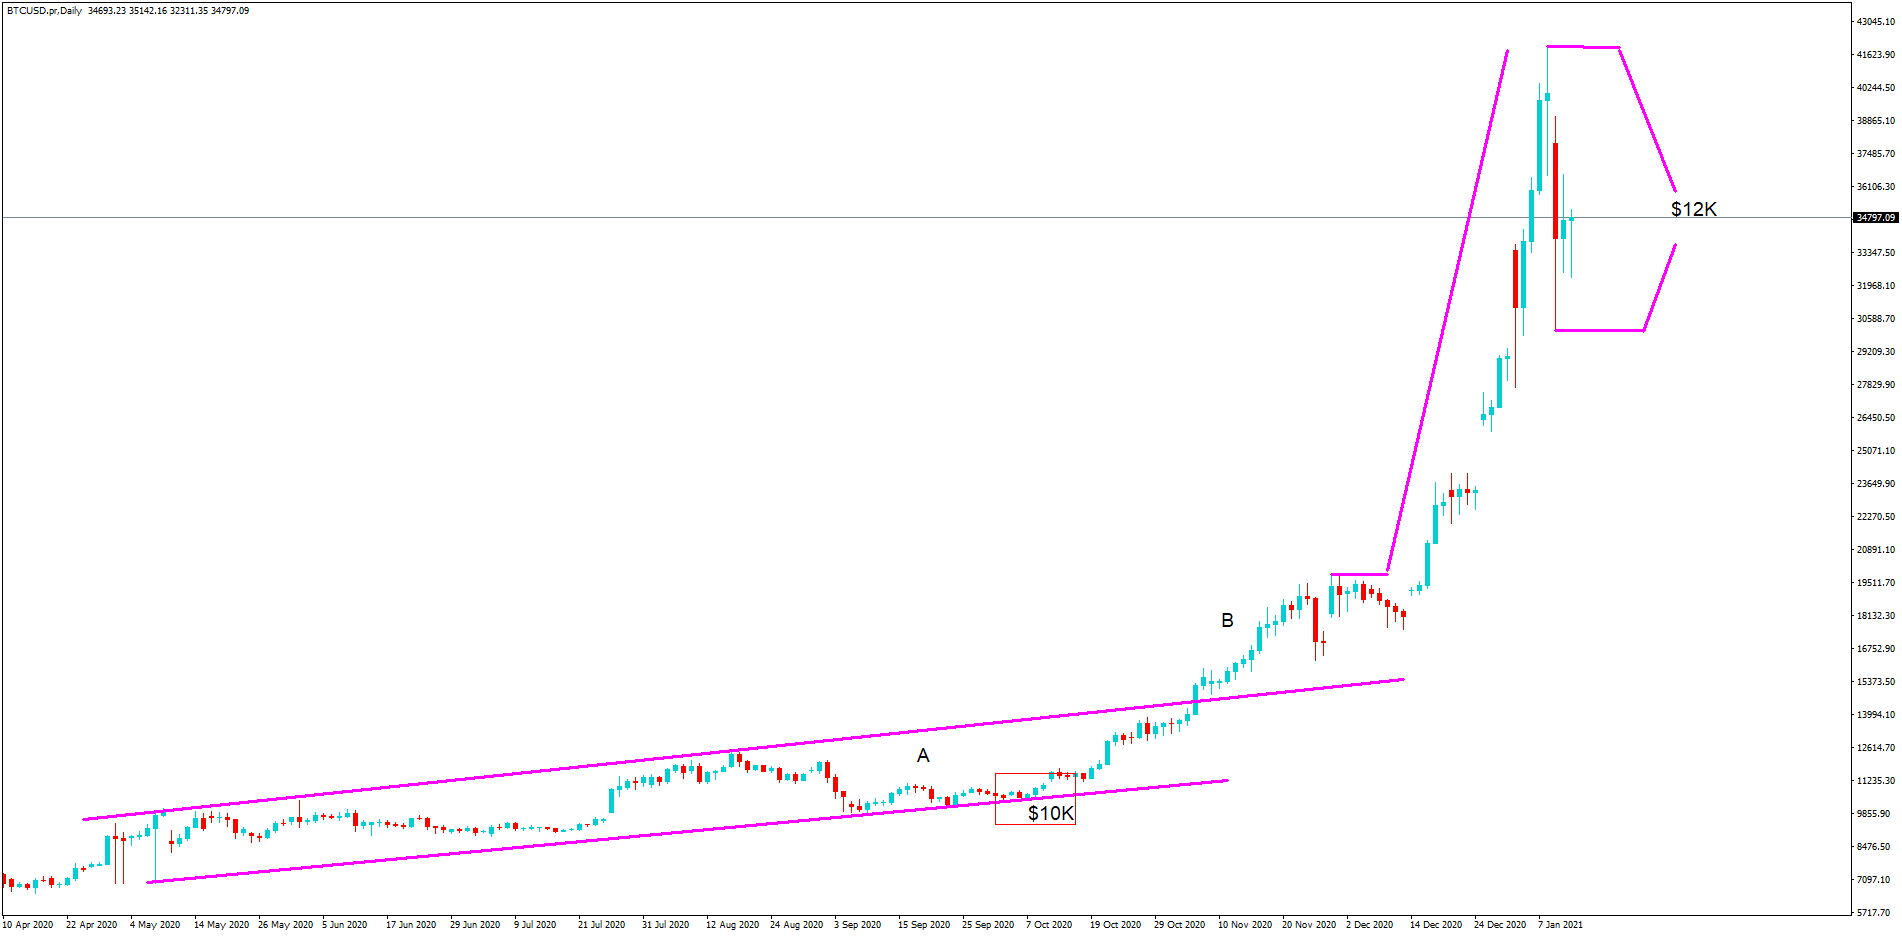
The supply and demand comprise the foundation of Bitcoin and the price rests on the juncture between subjectivity and objectivity. For example, we know that 1800 out of the total 21 million coins that will ever be created are being created as you are reading this. However, how many people will actually want the 21 million falls in the field of subjectivity. This is the point between truth and perceived truth.

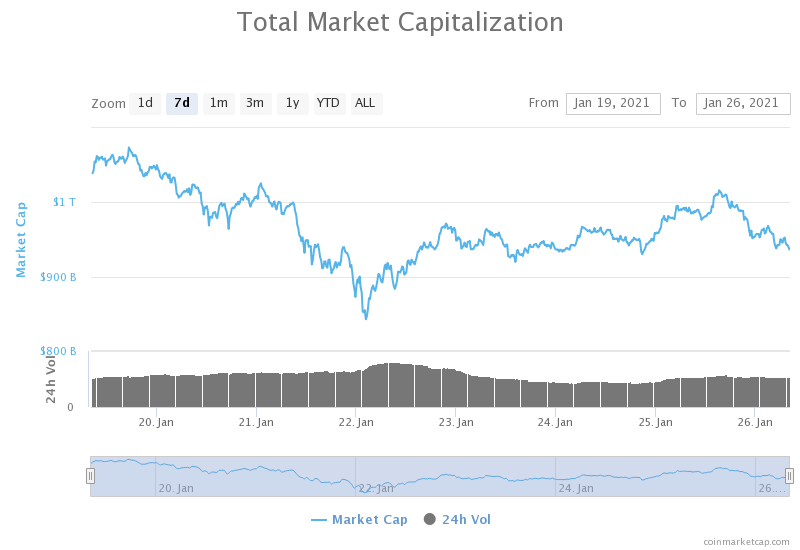
Large companies accepted Bitcoin as a treasury reserve and the resulting Bitcoin feedback loop essentially proves how scarcity drives the demand for money. Price signals are the basic truth in the marketplace. 

When central banks centralized gold, they broke the truthfulness of money and corrupted the money issuance system. Today, we are witnessing excessive money printing which is slowly turning value into worthlessness. This is an example of a decision that pushed people towards free markets (and hence Bitcoin) and hard money.  

From the perspective of history, every currency ever created failed due to their debasement or devaluing. The very first currency and the more recent ones were wiped off the map due to hyperinflation, which central banks hope to fight against through more printing. Still, every fiat currency losses value with time. Look at the GBP, one of the eight major world currencies, which lost 99% of its original value. 

As Charles Holt Carroll said, Inflation is the surest way to fertilize the rich man’s field with the sweat of the poor man’s brow. Inflation also twists fiat currencies’ price signals, causing entrepreneurs to overborrow, poorly manage their capital, and overleverage.

Inflation corrupts the data packets on value and scarcity that we call price signals. When millions starved to death in Soviet Russia, they were merely casualties of economic decisions and price-fixing. These are the consequences of centrally planned money.

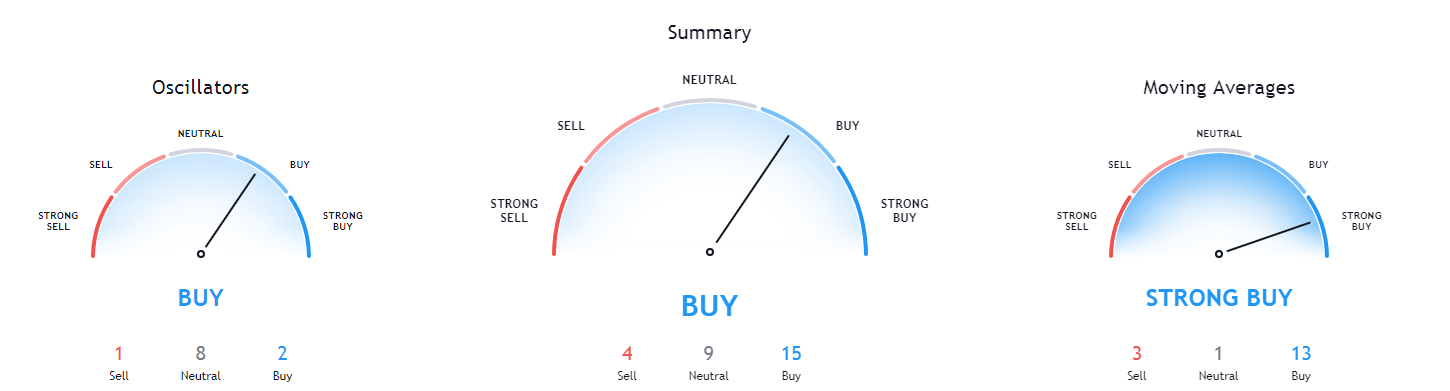
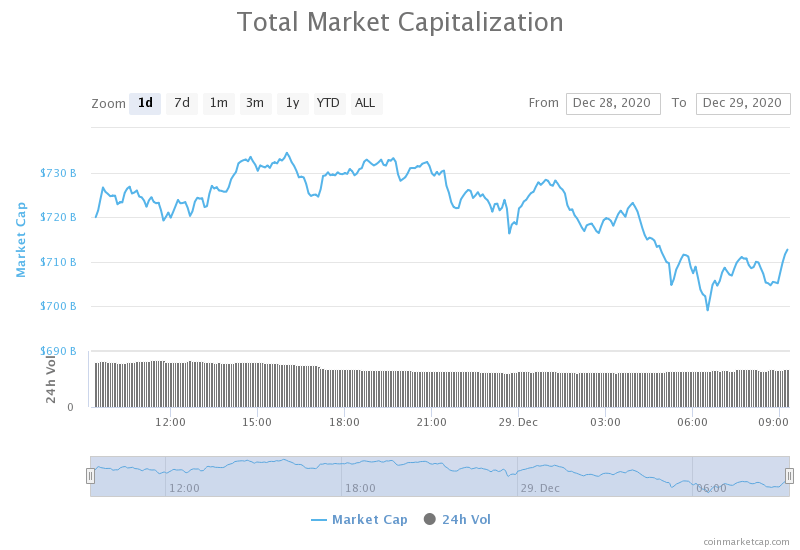
The FED forecasts have been publicly shamed for inaccuracy while we already know how much Bitcoin is produced today and every day forever. When we look at price signals, fiat currencies are vague, as we don’t know if a price is true or affected by inflation. Bitcoin, however, is a pure signal and has zero unexpected inflation forever.

With a fixed supply, Bitcoin will restore the trust in price signals that crucial for capital, risk, and business management across space and time. Like gold was, Bitcoin is free-market money and an uncorrupted, universal system of measurement.

So now, everyone in the lower tiers of the pyramid structure is opening towards really understating how the rich get richer while the poor get poorer. We are finally seeing the light at the end of the tunnel, a way to complete this cycle and finish this rat race once and for all.

Will centralized planning disappear? Probably never entirely. Nonetheless, at least we have the option that we haven’t had in a very long time. The only thing it takes is education, which may last between 1 and 3 hundred hours. No centralized power will ever invest in teaching their subjects about the way out. 

So, it is on you to free yourself from the matrix. The resources are available. 

8. Bitcoin is transparent

During Donald Trump’s presidency, we could see his tweets directed at the Federal Reserve. While nobody wants the president to openly criticize the central bank, this event did reflect even more the divide that exists in the US. The reasons for publicly displaying his thoughts may be diverse, but some things stated in this written exchange are still true.

Who makes decisions regarding money? How many dollars are there in circulation? How many more will be printed in the future? What criteria support these actions? And, who profits from the production of money? Much information is still hidden under the veil.

Last time, we discussed how fiat currencies are vague, but where does this opacity stem from? We know that central banks’ responsibilities include managing economies, and managing money is one side of it, not a sole function per se. Additionally, it seems that everything is politicized nowadays (hence the Twitter correspondence) although even the Federal Reserve, that is central banking in general, isn’t meant to be politically involved.

There is much that is simply out of alignment at the moment and this rift is the wound Bitcoin is designed to heal.

Earlier in this series, we explained why Bitcoin is a free market. We are leveling up now.

Free markets are essentially based on three pillars:

  1. Rule of law
  2. Private property rights
  3. Hard money

The rule of law allows us to resolve disputes in a non-violent manner; private property rights establish clear boundaries between people and assets; and, the last pillar represents free-market money and true price signals.

This three-layered system leaves room for enterers to take part in the market, obtain capital, and invest with their knowledge and experience back into the society through trading. 

When we mentioned central banks’ role above, we intended to highlight the need for giving clear instructions for processes. No sportsperson would keep competing in a game where rules are hidden or constantly changed to the liking of the club board or organizers. 

We are facing similar challenges at present because centrally planned money is safe only on the surface. The problem with today’s currencies, including the world reserve USD, is that the rules governing them are so opaque, which is why the questions we asked earlier remain unanswered. 

While the US movies keep glorifying the American dream, the Americans are still unaware that the USD is just an SQL database kept confidential at the FED without them showing intention to disclose any of the records to audit.

At the same time, more and more market commentators and financial analysts scrutinize central bankers each time a statement is issued, assessing everything from the way they dressed to what they said. The current state of affairs only shows that we are all missing the point. 

Central banks should not be in charge of setting the prices in the first place, just like any semi-governmental institution doesn’t dictate a universal price of cars. The market is the only one that should be entrusted with determining prices. How? Prices are generated at the point where supply and demand meet.

Why has the central bank then assumed this responsibility? Well, in the case of the United States, when the FED sets the prices, it essentially sets the interest rate, and the interest rate is their most lucrative export market.

All this is “naturally” carried out in complete secrecy, behind closed doors and away from the public eye, making it the exact opposite of what free market is. In the previous article of this series, we talked about the consequences of any interference with prices that Soviet Russia already experienced. Whenever central banks play with price-fixing, they meddle with free-market dynamics, thus creating surpluses/shortages and further damaging the economy. 

The only solution for having a healthy, sustainable, and functioning economy is to establish a system in which everyone will be able to see and understand any pertaining criteria and processes. This approach people will trust, which has long been lost in societies across the world. 

So, how is Bitcoin different?

Bitcoin’s algorithm is entirely transparent. While it does set the money supply, people can collectively agree that the system is fair and unbiased.

When Ray Dalio talked about radical transparency as the essence of a healthy free market, he may not have thought about Bitcoin, but this is still one of Bitcoin’s key features.

Not only does Bitcoin exude transparency but it also achieves so perpetually. This is the reason why baking institutions aren’t in favor of Bitcoin.

What Bitcoin manages to do flawlessly is automatize what central banks are supposed to do, such as managing monetary policy for example. Central banks’ primary tasks are to maintain money supply, prevent inflation, and facilitate international value flows. 

This is where Bitcoin outperforms central banks and the reason why it is the means to restore people’s trust, along with property rights and capital. 

We’ve read and heard about inflation so many times that we’ve become accustomed to the word. However, did you know that monetary inflation is a direct violation of property rights? What makes this worse is that it is legally enforced, which takes us to another related topic.

When governments print more money, they are making changes in terms of ownership or who owns what. Money can be used to get anything in the market, which makes this system downright exploitation of property rights.

Now, Bitcoin, on the other hand, is the answer we have all been looking for. Some of us may not still know much about it, but it is the path to freedom from fiat currencies as an uninflated, confiscation-resistant free market-based money.

As a vividly transparent alternative to the current system, Bitcoin is a means to overcome the opacity of central banking and to return the power into the hands of everyday people like you. 

The more people allow themselves to learn about Bitcoin, the more Bitcoin is going to be believable. The reason why this is so is that there is nothing obscure or misguiding about it, but it does require time and effort to be properly understood. 

Last time, we disclosed the average number of hours it takes for a person to learn about Bitcoin, which may be a reason why a percentage of the world population is going to be unwilling to adopt the new system. People generally dislike change because they fear it, but as Bitcoin is an immutable set of rules, it is currently the only true way to escape political agendas and banking institutions’ manipulation.

Bitcoin can endure and fight off the challenges inherent in the current system that dictates how and where things are going to play out. In this sense, Bitcoin is not just a beacon of hope but an effective tool to combat the pressures of the entitled. 

Once you acknowledge how powerful this transparency is and how far it can reach, it cannot be unseen. As Ray Dalio said, having nothing to hide relieves stress and builds trust. And, we think the time for trust is long overdue and that we are all looking forward to a different system.

Luckily, it is no longer some distant future that we need to pray or hope for the children of our children to experience. Transparency and reliability are at the core of Bitcoin. 

The question is…

Are you willing to accept the transformation towards the most credible, trustworthy monetary policy in the entire human existence?

9: Bitcoin is a winning option

In the previous articles, we explained why Bitcoin is never happening again. We showed how its path of creation entirely closed off options for making Bitcoin 2.0 and the possible scenarios that await anyone who ever attempts to do this. Looking at the technological perspective, we know that everything is getting digitized. There are no reinvented wheels here. Digital currencies are slowly, but surely, becoming part of our everyday lives as we are seeing more and more news on this topic.

Still, as people need confirmation or a reason to place their trust in something, especially something new, we need to compare Bitcoin and other currencies, both digital and fiat, without any unnecessary descriptors. For example, before we never minded about the internet and now everything is happening there, in the virtual world. Even if we take a look at fiat currencies, only 6% of the entire USD has been printed on bills. Everything else is digital numbers, such as the money in individual bank accounts. That’s why the word digital should not be used here to weigh things in any currency’s favor. 

The only playfield where any relevant comparison should be made is monetary policy. Bitcoin is undeniably winning in terms of transparency, predictability, and believability as well. From the perspective of history, these three factors have always been important and people will always look for ways to hold on to their capital across time. That is why gold was the number one currency for such a long time. And, now, Bitcoin is taking over the precedence, as it’s gaining an impressive track record over the same dimensions. 

Compared to central banks, Bitcoin’s indisputable reliability, auditability, cost-effectiveness, and predictability, along with its manipulation-proof nature, are helping bring down the wall of censorship and secretiveness created by central bankers. Bitcoin is winning because it is a symbol and harbinger of the new world order we have all been looking for. 

10: Bitcoin is believable

The tarnished image of the banking systems across the world did not start with Bitcoin. With massive printing into worthlessness, we discussed in previous parts of this series and everything we’ve already talked about here is sufficient for anyone to feel frustrated with the status quo. Including financially literate or otherwise less interested in the topic. 

There is no trust any longer – no trust in the system, no trust in the decision-making, and certainly no trust in the future promised by the central banks.

How is Bitcoin then more believable than what we already have?

When we look at fiat currencies, we‘ve already mentioned that the GBP which, in a little over 300 years, lost 99.5% of its value. Gold, however, never depreciated with time in terms of purchasing power. We know what happened the moment the value of currencies got detached from the value of gold.

Fiat currencies are not only challenging to believe because of their depreciating value but also because of everything we’ve already said about central bankers. Even the predictions we follow are a cause of concern with regards to the percentage of what actually happened compared to what had officially been presented as a formal document to the people. In Part 3, we mentioned the FED’s reports which disappointingly carry less than 5% prediction power. And, naturally, this affected the degree to which people are open and capable of carrying forward as they used to before.

Political agendas, secrecy, manipulation, and varying criteria involving price and supply of fiat currencies have done it. When decision-making becomes compromised and humanity is presented with multiple waves of currency devaluation and unemployment, these are expected results. Reputation and trust are earned, and the results go both ways.

What central banks, along with their monetary policies, managed to do is raise more questions regarding deception because they strive so hard to conceal any misdeeds, wrongdoings, and mistakes. In one of the previous articles, we talked about the level of scrutiny people involve when assessing any financial reporting, so when the words mismatch results, the outcome is mistrust. 

What is also interesting is that the world always seeks someone to blame, even if outcomes were predetermined by some other factors they had no control over. Predicting a country’s GDP is not an easy job, especially if we add to that politically determined ends. An even when someone losses their job due to not satisfying people’s criteria, we still “don’t see” the bad guy in the back. We need to acknowledge that it is the system that is faulty, not individual employees working for an organization. 

Where Bitcoin surpasses central banks most prominently is that we have the data on Bitcoin and we can precisely measure how many coins are going to be produced in the time coming. With governmental institutions, no measurement can be done properly because of their impact on free-market dynamics, which we previously talked about in detail. 

Soviet Russia failed because everything was micromanaged, as we mentioned before. A truly free economy cannot be planned like that. We are missing key components that comprise this naturally organized system. Centralized control dilutes facts. With gold, however, there are scientific, physical features (e.g. rarity) that can’t be left out of the picture, and the same is true for Bitcoin. 

Don’t tell me what you think just show me what’s in your portfolio, said Nassim Nicholas Taleb. Results can speak volumes on the gap between the controlled systems the central banks impose and the free market Bitcoin offers. 

It is not central banks that have to live with the consequences of trading but real people trading live every day. Living at the expense of the selected few freely exercising power to their own benefit is not the future anyone would want to succumb himself/herself to. 

We don’t need to watch for people’s words. The pattern will suffice. 

Next time, we are going to talk about some real numbers, some facts that we need to take into consideration when weighing the decision whether or not to invest in Bitcoin. Also, you will learn exactly why Bitcoin is never going to mess things up. Of course, Take all this information and process it in your way but try to stay with the facts. While these facts may look biased towards Bitcoin, as with everything, there are risks to contemplate about. 

New interesting facts await in Part 3.

Categories
Crypto Cryptocurrencies

Top 20 Fun & Interesting Facts About Bitcoin: Part 1

If you just started learning about Bitcoin or are trying to understand why it is different from everything else, this is the place to be.

1. Bigger Picture of Bitcoin vs. Blockchain 

Satoshi, the Japanese inventor of Bitcoin, is praised for overcoming the massive challenge of moving value online. Bitcoin certainly paved the way for the creation of new coins; but, more importantly, it opened our eyes to the new world of possibilities.

As a breakthrough invention, we can compare it to the first phone or aircraft. Still, as many Bitcoin connoisseurs like to point out, it is of vital importance that we don’t mix up the precursors and their more modern replacements. Who would like to use the brick phone nowadays anyway?

Therefore, when Bitcoin first appeared, it naturally shifted things quite a bit. We were presented with this new technology and decentralized digital currencies, which is one of its greatest benefits to this day. 

What we now know as a decentralized distributed ledger allowed transactions to be made without any intermediary. This meant that banks finally no longer had to give their blessing for things to work, making Blockchain technology as important as the first car. 

Now, the planes we use today differ greatly from the craft first designed by the Wayne brothers. We still appreciate the power of invention, but like with the software industry, we are inclined to use the newer versions which accommodate our current needs. 

Some experts tend to stress these differences because they understand that new inventions may not always work out in the long term in their initial form. Sometimes we need to debug and fix issues before we can be fully satisfied with anything. 

Bitcoin, which is essentially the first technology of its kind, definitely drew the attention of both people and institutions. Nonetheless, certain experts in the field still call for understanding what Blockchain entails and brings to the table in the long term aside from Bitcoin.

Ray Dalio, one of the most successful hedge fund managers in history, stated that he doesn’t really believe in Bitcoin, but he did say that he believes in the technology behind it. Although he received major backlash for his statements on Bitcoin, we cannot but notice similarities between the comments made by different individuals.

As Bitcoin remains the only market-proven use for Blockchain, those in favor of Bitcoin fervently disapprove of any separation between the cryptocurrency and the technology it is backed by. Some even say that favoring one over the other is the same as preferring the internet to HTTP. Still, it is crucial that we differentiate between Bitcoin cryptocurrency and Blockchain technology. 

Blockchain, the first version of a decentralized distributed ledger, is a historically significant invention that introduced unprecedented changes in the world. As a first of its kind, Blockchain is sometimes criticized for the algorithm upon which it is built – proof of work (PoW). Twelve years after its creation, Blockchain’s performance is believed to be a far cry from what we should be having. 

All critics aim to point out a need for a more sophisticated version of a decentralized distributed ledger that compensates for Blockchain’s limitations. While we still need the basic function of Blockchain, we also need much faster and efficient performance, thus calling for a replacement of the current PoW design.

Whereas traders certainly enjoy the option of earning a few extra tokens through staking (i.e. mining), the fact that the system requires this mechanism to function highlights its imperfections. Why do we need this feature in the first place? Why should any system’s security depend on this? 

Luckily, we have seen some successful attempts to break this barrier in the recent past. A new distributed ledger, a permissioned distributed ledger, is able to process 10 times more transactions per second than any blockchain-based cryptocurrency. While Bitcoin still resides on Blockchain, XRP (previously called Ripple) cryptocurrency successfully uses the new system, which makes it surpass the limitations traders faced before.

Some people believe that the only reason we all rely on Blockchain is that no superior replacement has been found. So, are we still looking for a more efficient solution that can satisfy the basic requirements and speed up the process at the same time? Well, different companies have advertised their products in the past few years, claiming to have overcome challenges inherent to Blockchain.

Some financial professionals go as far as to say that this new distributed ledger finally leaves room for engineering scalable digital currency systems with the real potential to become, or even replace, major currencies in the global financial system.  

The Blockchain-based cryptocurrency system may never be apt at achieving this, but we finally have the stage ready for digital currencies to compete with conventional currencies on the global level. Interestingly enough, some like to think that these new possibilities pose a threat to both Bitcoin and Blockchain.

2. New coins to potentially harm Bitcoin

Ray Dalio believes how another cryptocurrency could disrupt Bitcoin, offering the impact iPhone had on Blackberry as an example. While changes are happening in the world of cryptocurrencies, avid Bitcoin enthusiasts believe that this scenario is highly unlikely.

The power of Bitcoin lies in its path dependence. This one-time invention is not just any product we will toss away after it serves its purpose. Now, why is that so?

The invention of Bitcoin was a critical breakthrough that can only happen once in a lifetime. Many argue how it was the way in which events unfolded that rendered Bitcoin the uniqueness it has. 

For example, if this new cryptocurrency was launched today, its chain security would be extremely weak at first, as it would require everything to be done afresh. As everyone is nowadays already familiar with Bitcoin, it is likely that the new cryptocurrency (which we will call Bitcoin 2.0) with weaker chain security would probably have to fight opposition in the form of banks and governments, among others. 

Therefore, Bitcoin’s importance does not only lie in what it brought to humankind but the organic sequence of events that led to its release. The order of events can hardly be replicated, which leaves little room for Bitcoin 2.0 ever being created.

What is more, Bitcoin’s money supply is scarce, which makes people want to hold it. Traders would always go for more liquidity, greater network effects, and stronger chain security, making Bitcoin 2.0 look rather pale in comparison. 

Even if Bitcoin 2.0 was devised in a way to feature negative scarcity (i.e. a deflationary monetary policy), it would be practically impossible to determine its rate, not to mention the mechanism of money supply decay.

Fighting for the best market position, impending and unavoidable chain forks would reduce Bitcoin 2.0’s liquidity and chain security, essentially making traders opt for the original Bitcoin.

3. Bitcoin’s Expiration Date

As we mentioned above, Bitcoin’s money supply is scarce. When Bitcoin was invented, it was issued on a predictable supply curve. We know that after the mid-22nd century, there would be no more Bitcoin made.

We additionally know that there is a point after which you literally can’t split the coin in half anymore and it also goes to zero (i.e. exponential decay that approaches zero). This means that, while in 2020 we had approximately 1800 coins produced per day, the production is going to fall below 1 by 2100. This is one of the things that make Bitcoin exceptionally unique.

4. Bitcoin similar to gold

As the scarcest monetary metal, gold came to dominate the world. Owing to it being the most inflation-resistant, governments across the world built their monetary systems on this metal. Gold has several determining qualities that allowed it to serve as a medium of exchange:

  • durability, allowing it to persist through time without deteriorating
  • visibility, reflected in gold’s changeability and transformative power that makes it more tradable
  • portability, making gold easily moved from one place to another
  • recognizability, making it easy for people to differentiate between gold and anything else
  • scarcity or limited supply creating its value

Gold essentially became money because its supply was both scarce and predictable. People’s efforts to increase the production of gold could barely affect its supply. Because of this, gold turned into a preferred means of pricing and payment. 

Now, how can Bitcoin compare to that?

The absolute scarcity of Bitcoin, which we discussed in Part 1 of this series, makes it the ultimate pricing mechanism. This trait allows people to easily express their needs through trade, safely hold their capital, and compete at scale.

There are two main characteristics of gold that are essentially comparative to Bitcoin:

  1. production difficulty
  2. new supply predictability

History taught us how these played out with gold. However, Bitcoin may be even harder to obtain than this precious metal. Even if everyone focused on the production, we could still hardly generate more Bitcoin.

Bitcoin is based on a mechanism called difficulty adjustment, which makes it increasingly hard to forcefully obtain greater quantities of this cryptocurrency. While we can calculate with mathematical precision how many coins will be issued by the mid-22nd century (see the previous article for more information), it is unlike any asset or commodity we’ve heard of. 

It is important to understand that this mechanism functions in both directions – if more resources are directed at mining, other market participants will face difficulty in getting their share; similarly, if a percentage of production is stopped, others will enjoy easier access.

Scarcity of money affects its utility, which is why a zero growth terminal money supply represents perfect scarcity and makes Bitcoin a perfect monetary technology. We can say that there has only been one analog gold and Bitcoin, due to its uniqueness, is probably going to remain the only digital gold. Similarly, as gold’s value is undeniable, the market recognized Bitcoin’s worth. The more liquidity there is in the market, the more network effects and value it has as well.

It is also interesting to note how Bitcoin followed the same monetization path as gold did. No one used gold at first until they slowly started to recognize its value and importance. People started to barter gold and it slowly turned into an invaluable asset. Because of its stable value, gold penetrated all spheres of life over time, and we are already seeing how cryptocurrencies are taking over the world in a similar fashion. 

When people finally understood what gold was worth, it turned into a currency. Not only did people exchange gold for goods but gold also turned into money. That is how we had the gold standard and gold paper money as well. When people thought they were using banknotes, they were actually trading the value of gold. Now, currencies are no longer pegged to gold but think about Bitcoin here. Bitcoin serves the same purpose today. 

Bitcoin is slowly but surely gaining a track record in reliability, predictability, cost-effectiveness, and manipulation resistance, which puts it in the same position as gold. More and more individuals and public personas predict that Bitcoin will be the next reserve currency, which after this comparison with gold is far from surprising. 

5. Bitcoin supreme to CBDCs

Ray Dalio, who we first mentioned in the first article of this series, saw Bitcoin as inferior to central bank digital currencies (CBDCs) or cryptocurrencies such as Libra (i.e. Diem). Bitcoin is viewed as a less stable and more unpredictable medium of exchange. Naturally, this is a predictable statement because any currency in hands of large corporations such as banking institutions is prone to manipulation and external control. 

Monetary policies serve to enrich those whom these policies favor, and, as Bitcoin opened new doors that were previously unimaginable, we’ve seen more and more announcements on the issuance of new cryptocurrencies lately. There are many terms in which we can define this decision, but certainly, it is a wise move for those who recognized the movement Bitcoin set forth.

Still, as Bitcoin is undeniably a scarce money supply, it can only further appreciate in terms of exchange ratio against fiat currencies. It is a well-known fact that today’s currencies are printed freely, without any real value backing up these decisions. Over time, these activities can cause fiat currencies to become entirely worthless, as many have noticed already. 

Now, comparison with fiat currencies is a standard approach for determining the value of any emerging asset such as Bitcoin is. This price discovery is based on volatility assessment, which we have seen many times before. However, this mechanism in which we assign value may not be as functional as one may think.

In 1999, when Amazon crashed 94% from 85 USD to only 5 USD, no one expected a massive comeback. However, when Amazon started conquering the digital sphere, its value impressively grew by over 33,000%. This is an excellent example of how gaining control over the digital world entails gaining space driven by scarcity. Like with gold, Amazon ascended to market dominance owing to finite distribution channels and winner-take-all dynamics previously seen with gold.

Now, many would say that this is a highly volatile stock and they would be correct. However, volatility goes both ways or, more precisely, its function is two-fold. We need volatility to go both up and down. There can be no superiority in performance without undergoing volatility. And, the same is true for Bitcoin despite it not being a stock. There needs to be some volatility between zero and the top. What we have been seeing in the cryptocurrency market lately is demonstrative of this mechanism. So, we only need to power through. 

Now, contrary to popular belief, money is not a government creation although governments evidently want their piece of cake. Any trading society will require a medium, which money serves since it is simply the most tradable thing. People will always conduct trading to get to the things they need. Before they exchanged goods and now we exchange other things. So, as this dynamic unfolds, something necessarily becomes more tradable than anything else does. We mentioned at the beginning of this article which traits propelled gold to its globally recognized position, so you can compare for yourself where Bitcoin stands in terms of durability, visibility, portability, recognizability, and most importantly scarcity in comparison to emerging cryptocurrencies. All based on the information we provided in the first and the second article of this series. 

Would you bet on Bitcoin’s superior monetary traits?

Categories
Cryptocurrencies

3 Assets that Will Keep Your Investment Inflation Resistant

Inarguably, the value of the dollar today is not the same as it was a decade or two ago. You use more currency to buy less, and that is what inflation is all about.

Inflation can be defined as the measure of the average price level, in an economy, of a unit of goods and services. It is the increase in the price over a particular period, where you cannot use the same amount of currency to purchase a specific item. 

No doubt, the pandemic and the rushed measures to control it were devastating to the world economy. Governments worldwide scrambled to shut down their economies and started printing money to control the spread while also trying to keep the local market functional.

The main issue with printing excess money is that it eventually decimates the host government’s currency and pushes the economy into an inflationary spiral. 

Nonetheless, inflation is a natural event, and only the most disciplined investor benefits from it or reduces its effect on their investments. 

How to Safeguard Against Inflation

In response to the COVID-19-inspired economic fallout, the Fed was forced to pull out all the stops in a bid to control it. These measures have pushed the Federal Reserve balance sheet to over the $7 trillion mark from $4 trillion, and further contractions are expected.

But what should you do as an investor? 

Ideally, there are two factors to look out for when searching for an inflation-resistant asset; real yield and store of value.

An asset with a large store of value such as gold does not lose its purchasing power over a particular period. If the asset can also create income, the better, as it fulfills the two requirements.

There are a couple of other benchmarks that measure potential hedges against inflation, and they include how the asset holds its value over time. Other essential factors include how people perceive the assets as a store of value across borders and how quickly it can be monetized.

Lastly, the ideal inflation-resistant asset should be easily movable across geographical borders in case of unforeseen hurdles.

The perspective of bitcoin as a viable store of value that can be monetized quickly is gaining traction, at least in recent months. Bitcoin is also beyond the control of any government and is, therefore, borderless.

Understanding the Top Three Assets That Will Keep Your Investment Inflation-free

While changes in the inflation level depend on various factors, such as the rapid increases in raw materials prices and rising wages, the coronavirus pandemic is the most significant.

In the last century, the US dollar buying power has been on a free fall, mostly because of the monetary, fiscal policy adopted. The Federal Reserve’s primary response has been to print money and purchase securities on the open market to plug an economic crisis like it is happening now. Although it adds more liquidity to the market, this policy diminishes the value of the dollar, which sometimes aggravates an already dire situation. 

Consumer Price Index (CPI) is the primary method of tracking US Dollar inflation. As far back as 1948, the inflation rate has been at an average of around 2%. This translates to a loss in value of up to 2% every year. That means the money in your savings account is losing its value.

Although inflation is a significant characteristic of market economies, it is possible to plan for it by focusing your investment in asset classes that outperform the market during such challenging times.

Gold 

Traditionally, gold has been the perfect inflation hedge based on its stability. Not long ago, gold went above the $2,000 an ounce ceiling to record a 27% raise last year, 2020, which is quite enormous. 

In fact, many people have previously viewed gold as a possible alternative currency, especially in countries whose money is losing value fast. This precious metal is tangible and real and tends to hold its value in the long term, like no other asset.

Typically, it is common practice for gold or other strong currency to replace a weakened local currency to keep the economy sane. Central banks around the world hoard gold as they start to print money. They spend more of the bad money, which loses value and hold on to the good money, which is gold.

Unfortunately, gold is not always the perfect hedge in tough economic times. When inflation is in an upward trajectory, central banks move in to enforce a monetary policy that includes increasing interest rates. Assets such as gold, with no yields or any other accumulating rewards, are not always the best investment vehicle.

Other better assets will protect your wealth from inflation and still give you good yields. However, diversification is vital for a strong portfolio.

Bitcoin

Last year, bitcoin was up by 66%, and the rise continued into the new year to post a high of $40,519.45, an all-time high. With its exceptional value, bitcoin is hedging against inflation and chaos.


The borderless and decentralized cryptocurrency is beyond any government control, and they cannot print more of it like they do with the standard currency. The maximum bitcoin supply is 21 million, which serves to limit the supply and prevent eventual dilution.

Bitcoin supply remains constant, regardless of what the local governments do.

Interestingly, the current government shutdowns are playing in the hands of digital assets such as cryptocurrency, thereby increasing its value as an inflation hedge asset. But how is that so?

Clearly, the current shutdowns have directed the focus to digital currencies. This may be one of the reasons that propelled bitcoin to an all-time high. It is one of the few assets posting excellent results, which is good for crypto investors. 

Stocks

Thanks to coronavirus, the S&P 500 index surged 55% from the lows observed in March last year despite all the groom. Similar to bitcoin and gold, the lockdowns and the resulting money printing has caused a rally to the stocks. But how can this happen? 

According to economists, the stocks’ value is not appreciating, but rather the dollar is depreciating against the stocks. The surge in equities is a significant indication of diminishing trust in the local currencies, which forces the wise investor to add more stocks to their portfolio to safeguard against losses.

Apparently, investors have lined up to take up stocks at the expense of fiat currencies.

Final Word

Ostensibly, most investors do not give a hoot about inflation and its effect on day-to-day trading and investment. Well, indeed, what you can’t see can’t hurt you, but inflation is the exception. It will hit where it hurts the most; your financial well-being.

The common practice is to hoard local currency in the form of savings to safeguard against tough times. Putting away something for the rainy day is alright, but the strategy has a significant flaw. You lose a bit of the savings to inflation. Saving in a bank is not a viable option, especially when the global central banks do everything to devalue the local currency.

The looming economic crisis, driven by the continued printing of money, calls for wise investment decisions. Ideally, invest in inflation hedge assets such as gold, bitcoin, and stocks to weather the current storm. Don’t be on the losing side by putting so much faith in the dollar and other global currency.

Categories
Crypto Market Analysis

Daily Crypto Review, Jan 29 – Dogecoin Skyrockets as r/Wallstreetbets Enters on Crypto; Bitcoin Jumps on Elon Musk’s Twitter Profile

The cryptocurrency space had a wild week, first because of the r/WallStreetBets community entering the market (and pumping Dogecoin’s price by over 1000%) and then because of Tesla’s CEO Elon Musk tweeting about Bitcoin and promoting it. This has, in turn, caused Bitcoin to spike from $31,000 all the way to $38,200 in a matter of one hour. An interesting fact is that Musk’s Twitter bio now has #bitcoin displayed for everyone to see.

The crypto sector ended the day with most of the top cryptocurrencies in the green. Most analysts speculate that the recent wave of buyers came as a result of Dogecoin’s incredible pump, which was caused by the notorious r/WallStreetBets subreddit. Bitcoin is currently trading for $32,964, representing an increase of 5.26% compared to yesterday’s value. Meanwhile, Ethereum’s price has increased by 1.41% on the day, while Litecoin gained 5.11% of its value.

Daily Crypto Sector Heat Map

3X Long Dogecoin Token gained 905.02% in the past 24 hours, making it the most prominent daily crypto gainer by far. It is followed by Dogecoin’s 513.17% and DOGEFI’s 369.90% gain. On the other hand, 3X Short Dogecoin Token lost 99.85%, making it the most prominent daily loser. It is followed by Panda Yield’s loss of 83.13% and Psychic’s loss of 72.46%.

Top 10 24-hour Performers (Click to enlarge)

Bottom 10 24-hour Performers (Click to enlarge)

Bitcoin’s market dominance decreased slightly from when we last reported, currently 62.8%. This represents a 0.1% decrease from our previous report.

Weekly Crypto Market Cap Chart

The cryptocurrency sector’s market capitalization has increased greatly since we last reported, with its current value being $979.02 billion. This represents a $54.27billion increase when compared to our previous report.

_______________________________________________________________________

What happened in the past 24 hours?

_______________________________________________________________________

_______________________________________________________________________

Technical analysis

_______________________________________________________________________

Bitcoin

Bitcoin has spent the day attempting to push its price up as the market turned to green. Its price conquered the $32,350 level and pushed higher without hesitation. The move ended as bulls reached exhaustion near the $34,627 level. BTC’s inability to push past its immediate resistance has triggered a pullback, and the cryptocurrency is now most likely to retest the $32,350 level.

The overall change in market direction today came as a result of (as most speculate) Dogecoin’s insane upswing triggered by r/WallStreetBets.

BTC/USD 1-hour chart

Bitcoin’s technicals on all time-frames are either neutral with a slight hint of bullishness or bullish with a slight hint of neutrality.

BTC/USD 1-day Technicals

Technical factors (1-hour Chart):

  • Price is above its 50-period EMA and at its 21-period EMA
  • Price is at its middle Bollinger band
  • RSI is neutral (51.01)
  • Volume is above average

Key levels to the upside:          Key levels to the downside:

1: $34,627                             1: $32,350

2: $37,445                             2: $30,072

3: $38,000                             3: $27,960

Ethereum

After yesterday’s failed break of the top downtrend line, the second-largest cryptocurrency by market cap pushed past and broke its descending pattern. Its price (at one point) went past the $1,350 level, but as bulls couldn’t confidently hold this level, bears initiated a pullback.

Ethereum’s short-term price direction will be dictated by how the cryptocurrency handles the top downtrend line (which is now a support rather than a resistance line) as well as by Bitcoin’s price direction.

ETH/USD 1-hour Chart

Ethereum’s technicals on all time-frames are bullish but also show a hint of bearishness.

ETH/USD 1-day Technicals

Technical Factors (1-hour Chart):

  • Price is slightly below both its 50-period and its 21-period EMA
  • Price slightly below its middle Bollinger band
  • RSI is neutral (45.66)
  • Volume is average

Key levels to the upside:          Key levels to the downside:

1: $1,350                               1: $1,211

2: $1,420                               2: $1,183.85

3: $1,440                               3: $1047.6

Litecoin

Litecoin has confirmed its position above the $128.4 level after pushing its price above it yesterday. LTC is now in consolidation mode and is currently testing the 21-hour EMA. Its recent moves seem slightly unenthusiastic, meaning that its short-term price direction will most likely be determined by other cryptocurrencies’ movements.

LTC/USD 1-hour Chart

Litecoin’s 4-hour and daily overviews are neutral/bearish, while its weekly and monthly overviews are completely bullish.

LTC/USD 1-day Technicals

Technical factors (1-hour Chart):

  • Its price is slightly above both its 50-period EMA and its 21-period EMA
  • Price slightly above its middle Bollinger band
  • RSI is neutral (55.45)
  • Volume is average

Key levels to the upside:          Key levels to the downside:

1: $142.1                               1: $128.42

2: $161.5                               2: $120

3: $181.3                               3: $114.75

Categories
Cryptocurrencies

5 Exchanges that Don’t Need KYC Verifications

The KYC (Know Your Customer) regulations are standard with financial institutions around the world. These laws were enacted to prevent money laundering activities in the financial industry, and every one of us has been subject to them, in one way or another. 

The regulations require institutions or platforms to verify individuals’ identities before using their money transmission services, and most recently, virtual currencies. 

Cryptocurrency and blockchain technology is the new kid in the financial block, and already disrupting the market with lower transaction fees, confidentiality of transactions, and improved security against fraud.

Surprisingly, the KYC verifications are gradually creeping to cryptocurrency exchange platforms. This means that getting your money from the cryptocurrency exchange is a bit more complicated than sending money. But you don’t need to use “surveillance exchanges,” as critics call them, to trade.

If you prefer to withhold personal information with your cryptocurrency investment, you can use anonymous cryptocurrency exchanges. We list five of the best exchanges that don’t require KYC verifications.

Are KYC Exchanges Safer than non-KYC Exchanges?

No doubt, the exchanges that mandate KYC verifications may sometimes offer better security. The platforms are fully regulated and may provide better redress in case of a hack or when something goes wrong. 

On the other hand, regulators may not be able to track culprits in a fully anonymous platform. It can also sometimes be difficult to access important information such as inflation rate, currency generation, and other blockchain transactions. Regardless, the benefits of anonymity in cryptocurrency outweigh its downsides. 

BitMEX is a cryptocurrency derivatives exchange that is the latest to join the club of cryptocurrency platforms aligning themselves with the traditional financial institutions’ regulations. Since August 28 of 2020, the exchange has been rolling out KYC. All traders are required to submit photographic ID and other identifying information by February 12, 2021.

But this does not imply non-KYC Exchanges are not safe. In contrast, many cryptocurrency investors prefer non-KYC platforms. This is because they believe KYC is a powerful magnet for hackers, making everyone unsafe. Every time you make a transaction, you give out your crypto address that can be used in blackmail, social engineering, hacking, or by law enforcement.

At the Web3 Summit, Edward Snowden was given a headline spot, and this goes to show that privacy hardliners are not going to relent anytime soon. The action by BitMEX could see migrations to non-KYC exchanges such as ByBit, but still, that is a wait-and-see situation. 

The main goal of high-value crypto traders is to be in cryptocurrency exchanges that blend anonymity and security to a satisfying level. If any one of the two fails, the investors move to better alternatives, and there will always be crypto exchanges such as ByBit ready to receive them with open arms.

As a crypto trader, you can choose to keep your personal information and protect your identity from the reach of criminals by choosing secure, anonymous crypto exchanges.

Binance

The Hong Kong-based cryptocurrency exchange is currently the most popular and the world’s largest, with up to 10 million active users, ahead of Bittrex. With Changpeng Zhao as its head, Binance has been one of the most innovative with creating the Binance Coin (BNB) token. Binance supports over 150 cryptocurrencies.

Users can access a 2 BTC worth of cryptocurrency trading limit without KYC verifications, with additional benefits of up to 50% reduction in fees. You do not need verification for spot trading.

However, transactions involving large amounts of BTC will involve completing KYC procedures to use the Binance platform. Binance US, which the US traders must use, requires KYC verification during registration.

You can deposit funds on Binance through credit cards, bank transfers, and crypto deposits. Holders of its native token, BNB, enjoy a discounted rate. The exchange has a referral program for BNB tokens, among other rewards.

There are some signs that Binance could go the way of BitMEX and transition to full KYC sometime in the future. This is mainly because it is compelled to align with numerous jurisdictions’ requirements where the platform operates. They choose to avoid the push and shove involved with the regulators of different countries and regions. 

Block DX

The exchange operates on blockchain interoperability protocol or the Blocknet, allowing communication between private and public blockchains. Blocknet also makes it easier to interact and exchange crypto among the platform users. 

The Blocknet Protocol-powered decentralized exchange allows users to transact without an intermediary. It has no withdrawal and trade limits, thus allowing greater flexibility. The exchange provides trading pair freedom, where all you need is a small amount of its native coin, BLOCK, to take an existing order. You do not need BLOCK tokens to create an order.

According to the non-custodial exchange developers, Block DX does not have any pause button, kill switch or email notifications. There are no interruptions in scheduled or unscheduled maintenance, and it does not have any offshore company. It claims to be the best definition of a decentralized and anonymous cryptocurrency exchange.

What separates Block DX from its other decentralized peers is that it decentralizes all its platform components. You enjoy more flexibility and freedom.

Changelly

The anonymous cryptocurrency exchange has been around since 2013 and has considerable experience in the crypto space. 

The platform allows instant transfers across various cryptocurrencies to cryptocurrency wallets. The exchange has a reasonable fee of 0.5% and is very committed to protecting your privacy. Changelly only requires an email address.

Changelly is integrated into the Stratis app, and you can conveniently trade the $STRAT tokens right on your mobile device. But still, the exchange supports up to 150 cryptocurrencies. $STRAT is among the leading cryptographic tokens that you can freely trade in open exchanges. 

However, you need supporting cryptos such as dash and Ethereum to exchange for BTC. Changelly is a centralized exchange, but it does not require id verification to access the swapping services. The only instance where KYC verification is necessary is when Changelly detects suspicious activities.

The platform has a vast array of acceptable payment services apart from the crypto deposits. You can deposit through credit card payments, bank transfers, and even ApplePay. Besides, its trading algo is one of the most impressive yet, which scans other platforms to find the best trading prices.

ByBit

This platform matches the ability to leverage trades by up to 100 times by BitMEX without requests for any personally identifying information. This strategy helped ByBit accrue more than a million users worldwide since its launch in 2018.

ByBit may seem too lax with security for a casual observer, but nothing could be further from the truth. ByBit is only part of a handful of cryptocurrency exchanges that can genuinely be said to have never been breached since its establishment.

ByBit leverages two-factor authentication sign-ins compatible with authenticator apps, SMS, and email. Funds are usually in multi-signature wallets stored in offline cold storage.

The Singaporean crypto exchange has a wide variety of features for margins trading. The perpetual swap product, BTC-USD, is the most popular with ByBit, and you can trade ETH, EOS, and XRP. 

ByBit’s crypto margin trading guides have a wealth of tips and tricks on swapping derivatives. Anyone around the globe can use ByBit without the need for KYC verification. The platform has both Android and iOS compatibility and is available in different languages. 

Unfortunately, ByBit bars users from the US. 

IDEX

The hybrid cryptocurrency exchange, which has centralized and decentralized features, is a favorite for Ethereum holders. In an operating environment where owners can be liable for illegal activity in their exchanges, IDEX has pursued pragmatic decentralization to influence legal treatment by the regulators.

IDEX is mainly designed for Ethereum and Ethereum-based tokens (ERC-20) trading. 

The platform employs blockchain technology security and privacy to allow anonymous trading by using only the wallet addresses. You only need to deposit tokens to unlock the wallets and start trading. The IDEX native token holders receive a percentage of the transaction fees generated on the platform.

As of August 23, 2020, all users in the IDEX platform require partial verification to trade. You will also need passport scans and selfies for withdrawals of $5,000 or more. US customers are restricted from trading particular assets on the platform.

Final Word

The world of digital currency was propelled by, among other factors, anonymity. The increasing need for KYC verification to improve security also acts as a barrier. In some way, KYC is a potential threat, as well, in case of a data breach on public ledgers. 

Well, bitcoin mixers are an excellent option for anonymity and security. Nonetheless, a well-established crypto exchange platform that doesn’t require KYC verification is usually sufficient in most cases. Do a little digging before signing up for a cryptocurrency exchange. Check its policies, read the reviews, and weigh the quality of its customer support.

The above exchanges are only a few of the well-established and reliable crypto platforms you can start with. There are many others, as well. Happy trading!

Categories
Crypto Market Analysis

Daily Crypto Review, Jan 28 – Bitcoin Strong Bounce off the 30K level, Altcoins Reversals Followed

The crypto sector ended up almost completely in the red, though most cryptos barely lost any value. Bitcoin is currently trading for $31,200, representing a decrease of 1.13% compared to yesterday’s value. Meanwhile, Ethereum’s price has decreased by 0.95% on the day, while LTC lost 2.06% of its value.

Daily Crypto Sector Heat Map

Zero Collateral Dai gained 828.50% in the past 24 hours, making it the most prominent daily crypto gainer by far. It is followed by QuadrantProtocol’s 327.68% and 3x Long Dogecoin Token’s 137.80% gain. On the other hand, EveryCoin lost 89.97%, making it the most prominent daily loser. It is followed by Zugacoin’s loss of 79.94% and TokenPay’s loss of 50.46%.

Top 10 24-hour Performers (Click to enlarge)

Bottom 10 24-hour Performers (Click to enlarge)

Bitcoin’s market dominance decreased slightly from when we last reported, currently 62.9%. This represents a 0.2% decrease from our previous report.

Weekly Crypto Market Cap Chart

The cryptocurrency sector’s market capitalization has decreased very slightly since we last reported, with its current value being $924.75 billion. This represents a $10.78 billion decrease when compared to our previous report.

_______________________________________________________________________

What happened in the past 24 hours?

_______________________________________________________________________

_______________________________________________________________________

Technical analysis

_______________________________________________________________________

Bitcoin


After another day of its price moving towards the downside, Bitcoin attempted a rally towards the $32,350 mark. After its price establishing strong support at the $30,000 level, the largest cryptocurrency by market cap started surging. There is a strong chance that BTC will pass the $32,350 level if the hourly candle ends up above the 21-hour EMA.

Scott Minerd, the CIO of investment services firm Guggenheim, said that the institutional demand is insufficient to keep BTC above $30,000. Many analysts agree with this short-term assessment, while almost all of them are bullish in the long-term.

BTC/USD 1-hour chart

Bitcoin’s daily overview is mostly neutral (with some hints of bearishness), while its weekly and monthly overviews are tilted towards the buy-side. On the other hand, its 4-hour time-frame is completely bearish.

BTC/USD 1-day Technicals

Technical factors (1-hour Chart):

  • Price is above its 50-period EMA and its 21-period EMA
  • Price is slightly above its middle Bollinger band
  • RSI is neutral (56.39)
  • Volume is above average

Key levels to the upside:          Key levels to the downside:

1: $32,350                             1: $30,072

2: $34,627                             2: $30,000

3: $37,445                             3: $27,960

Ethereum

The second-largest cryptocurrency by market cap spent the day testing the $1,211 level multiple times. After the support level held up on various occasions, ETH bulls entered the market and started pushing its price up. However, it is still uncertain whether this push towards the upside will end as another lower high and a continuation of the downtrend, or a break from the trend.

Ethereum’s immediate downside is guarded by the 21-hour and 50-hour EMAs, while its first major resistance level is the $1,350 mark, as well as the descending line that connects ETH’s recent lower highs.

ETH/USD 1-hour Chart

Ethereum’s technicals on the daily, weekly, and monthly time-frames are tilted towards the buy-side but also show some neutrality. Its 4-hour overview, however, is slightly bearish.

ETH/USD 1-day Technicals

Technical Factors (1-hour Chart):

  • Price is above both its 50-period and its 21-period EMA
  • Price at its top Bollinger band
  • RSI is neutral (57.04)
  • Volume is average

Key levels to the upside:          Key levels to the downside:

1: $1,350                               1: $1,211

2: $1,420                               2: $1,183.85

3: $1,440                               3: $1047.6

Litecoin

Litecoin managed to break out from its downtrend after breaking the $128.4 mark. What’s surprising is that such a strong trend was broken by just average volume. LTC found support in the 21-hour EMA, which currently stands right below the price level.

Litecoin has a zone of heavy resistance straight above it (above $130). It is very unlikely that it can “survive” without a major boost in volume, especially in these market conditions.

LTC/USD 1-hour Chart

Litecoin’s daily overview is mostly neutral (with some hints of bearishness), while its weekly and monthly overviews are tilted towards the buy-side. On the other hand, its 4-hour time-frame is completely bearish.

LTC/USD 1-day Technicals

Technical factors (1-hour Chart):

  • Its price is above both its 50-period EMA and its 21-period EMA
  • Price at its top Bollinger band
  • RSI is neutral (58.51)
  • Volume is average

Key levels to the upside:          Key levels to the downside:

1: $142.1                               1: $128.42

2: $161.5                               2: $120

3: $181.3                               3: $114.75

Categories
Crypto Videos

Craig Wright (Claims To Be Satoshi Nakamoto) Threatens Legal Action Take my Bitcoin Whitepaper Down!


Craig Wright Threatens Legal Action: “Take my Bitcoin Whitepaper Down!”

Craig Wright, the self-proclaimed Bitcoin inventor Satoshi Nakamoto, has threatened legal action against the owners of two Bitcoin websites he accused of stealing his whitepaper and his other intellectual property.

As announced on Jan 21, Bitcoin.org and Bitcoincore.org had received allegations of copyright infringement coming from none other than Craig Wright and his lawyers. The counsel reportedly claimed that Wright, as the inventor of Bitcoin, was the legal copyright holder of the official Bitcoin whitepaper, owned the Bitcoin name and trademark, and the two aforementioned websites.

While the owner of Bitcoin.org, a developer known only as Cobra, has stated that he refuses to be intimidated by the threat of “false allegations,” the owner of Bitcoincore.org has already adhered to the request.

Cobra then stated: “Unfortunately, without consulting with us, Bitcoin Core developers removed the Bitcoin whitepaper from bitcoincore.org, in response to the allegations of copyright infringement, lending credence to these completely false claims.”

He then added: “The Bitcoin Core website was modified to remove all references to the whitepaper, the local copy of the whitepaper PDF was deleted, and with under 2 hours of public review, the change was merged.”

Things got heated when the owner of Bitcoincore.org, as well as the current maintainer of Bitcoin’s code, Wladimir J. van der Laan, responded quickly, telling his Twitter followers that this issue was not something he cares deeply about. 

He stated: “So let this be clear: I’m happy to maintain Bitcoin core’s code, but I will not personally be a martyr for BTC. It’s completely up to you as Bitcoiners to protect it.”


Van der Laan added: “This thing is all about decentralization and distributed systems, rather than personal macho posturing. I have no interest in it and am definitely not paid enough to take a stance.”

As the two Bitcoin core websites decided to take vastly different approaches, we will see which one was better and why. In the meantime, the Bitcoin whitepaper will continue to be hosted on Bitcoin.org, which hopes that other websites would follow them in resisting Craig Wright’s attempts at intimidation.

Categories
Crypto

Holding Bitcoin Now Is As Safe As Gold & Bonds!


Holding Bitcoin is as Safe as Owning Gold and Bonds – Anthony Scaramucci

Anthony Scaramucci, the head of SkyBridge Capital as well as former White House communications director, believes that Bitcoin’s value proposition has strengthened ever since governments have addressed many of the risks that are associated with the digital asset. 

In an opinion article published by CNN, Scaramucci and his fellow SkyBridge executive Brett Messing argued that Bitcoin had become a viable option for long-term investors seeking refuge from inflation. The authors also stated that holding Bitcoin is far less risky today than it was just a couple of years ago when regulations and infrastructure were underdeveloped.

Bitcoin’s growth has “caused government, as well as institutions, to step in and address many of the risks that are often associated with the digital currency,” the authors wrote, pointing to the Office of the Comptroller of Currency’s decision to enable all banks to provide cryptocurrency services.

They added: “Increased regulations, improved infrastructure, as well as access to financial institutions such as Fidelity, have made Bitcoin investments just as safe as owning bonds and commodities such as gold, which are used to balance portfolios.”

SkyBridge Capital made a big splash in the news last month when it applied with the US SEC to launch a Bitcoin hedge fund. Its SkyBridge Bitcoin Fund LP launched just a few weeks later, with Fidelity serving as custodian, while Ernst & Young were chosen to handle the auditing.

SkyBridge reportedly invested in Bitcoin during Nov and Dec 2020, allowing it to accumulate a substantial position in the cryptocurrency prior to its parabolic spike. By the time the fund was launched, on Jan 4 of this year, SkyBridge had claimed its BTC exposure was worth around $310 million.

Institutional capital is considered a major catalyst behind Bitcoin’s 300% rally in 2020, which brought its price to a new all-time high of $42,000 on Jan 8. Smart money investors are beginning to view Bitcoin as digital gold rather than just a speculative asset. 


Categories
Crypto Market Analysis

Daily Crypto Review, Jan 27 – Bitcoin (BTC), Ethereum (ETH), Litecoin (LTC) Price Analysis

The crypto sector ended up either slightly red or slightly green, with only rare exceptions making significant moves to either side. Bitcoin is currently trading for $31,679, representing an increase of 0.51% compared to yesterday’s value. Meanwhile, Ethereum’s price has decreased by 1.61% on the day, while LTC lost 3.33% of its value.

Daily Crypto Sector Heat Map

Coupon Chain gained 74575.19% in the past 24 hours, making it the most prominent daily crypto gainer by far. It is followed by YVS.Finance’s 683.5% and Chonk’s 198.23% gain. On the other hand, Narwhale.finance lost 72.98%, making it the most prominent daily loser. It is followed by 3X Short Matic Token’s loss of 67.68% and MangoChain’s loss of 66.24%.

Top 10 24-hour Performers (Click to enlarge)

Bottom 10 24-hour Performers (Click to enlarge)

Bitcoin’s market dominance increased slightly from when we last reported, currently 63.1%. This represents a 0.2% increase from our previous report.

Weekly Crypto Market Cap Chart

The cryptocurrency sector’s market capitalization has decreased very slightly since we last reported, with its current value being $935.58 billion. This represents a $0.96 billion decrease when compared to our previous report.

_______________________________________________________________________

What happened in the past 24 hours?

_______________________________________________________________________

_______________________________________________________________________

Technical analysis

_______________________________________________________________________

Bitcoin

After a day of attempting to break out of its slightly descending channel, Bitcoin has returned to the downtrend. The largest cryptocurrency by market cap tried to regain the $32,350 level but failed in doing so. This created a strong sell-wall above its current price of just below $32,000.

Bitcoin’s immediate upside is guarded by the 21-hour and 50-hour EMAs, as well as the 32,350 level. Its downside, however, is a free-fall until the zone above $30,000.

BTC/USD 1-hour chart

Bitcoin’s daily overview is mostly neutral (with some hints of bearishness), while its weekly and monthly overviews are slightly bullish. On the other hand, its 4-hour time-frame is completely bearish.

BTC/USD 1-day Technicals

Technical factors (1-hour Chart):

  • Price is slightly below its 50-period EMA and its 21-period EMA
  • Price is slightly under its middle Bollinger band
  • RSI is neutral (46.41)
  • Volume is average

Key levels to the upside:          Key levels to the downside:

1: $32,350                             1: $30,072

2: $34,627                             2: $30,000

3: $37,445                             3: $27,960

Ethereum

The second-largest cryptocurrency by market cap returned to mirroring Bitcoin’s movement after entering its consolidation phase. Ethereum has, after failing to break the $1,350 level, returned to its slightly-downwards movement. The zone just above the $1,300 level mentioned yesterday was also broken, meaning that ETH is now trading between $1,211 to the downside and $1,350 to the upside.

Ethereum’s immediate upside is guarded by the 21-hour and 50-hour EMAs, as well as the $1,350 level. Its first major support level is sitting at $1,211.

ETH/USD 1-hour Chart

Ethereum’s technicals on the daily, weekly, and monthly time-frames are tilted towards the buy-side, but all have neutral oscillators. Its 4-hour overview, however, is completely neutral.

ETH/USD 1-day Technicals

Technical Factors (1-hour Chart):

  • Price is slightly below both its 50-period and its 21-period EMA
  • Price slightly below its middle Bollinger band
  • RSI is neutral (46.02)
  • Volume is average

Key levels to the upside:          Key levels to the downside:

1: $1,350                               1: $1,211

2: $1,420                               2: $1,183.85

3: $1,440                               3: $1047.6

Litecoin

Litecoin has seemingly created a double bottom formation after hitting and staying above the $128.4 level twice. This may be a bullish signal for LTC traders, but the move needs to be accompanied by at least a slight increase in volume.

Despite creating a double bottom, LTC will have a hard time moving past the 21-hour and 50-hour EMAs, as they seem to be its immediate resistance levels. On the other hand, its $128.4 support level is holding up well for now, making it very uncertain where LTC will go in the short-term.

LTC/USD 1-hour Chart

Litecoin’s daily overview is mostly neutral (with some hints of bearishness), while its weekly and monthly overviews are slightly bullish. On the other hand, its 4-hour time-frame is completely bearish.

LTC/USD 1-day Technicals

Technical factors (1-hour Chart):

  • Its price is below both its 50-period EMA and its 21-period EMA
  • Price slightly below its middle Bollinger band
  • RSI is neutral (41.89)
  • Volume is slightly below average

Key levels to the upside:          Key levels to the downside:

1: $142.1                               1: $128.42

2: $161.5                               2: $120

3: $181.3                               3: $114.75

Categories
Crypto Market Analysis

Daily Crypto Review, Jan 26 – Blood on the Streets: Crypto Market in the Red

The crypto sector ended up almost completely in the red as most cryptocurrencies pulled back to lower levels. Bitcoin is currently trading for $31,575, representing a decrease of 5.26% compared to yesterday’s value. Meanwhile, Ethereum’s price has decreased by 7.24% on the day, while LTC lost 6.79% of its value.

Daily Crypto Sector Heat Map

EveryCoin gained 501.69% in the past 24 hours, making it the most prominent daily crypto gainer by far. It is followed by BBYS’s 280.04% and X Infinity’s 255.24% gain. On the other hand, ARTH lost 61.58%, making it the most prominent daily loser. It is followed by Typhoon Cash’s loss of 44.07% and Aventus’s loss of 40.31%.

Top 10 24-hour Performers (Click to enlarge)

Bottom 10 24-hour Performers (Click to enlarge)

Bitcoin’s market dominance increased slightly from when we last reported, with its value currently being 62.9%. This represents a 0.2% increase from our previous report.

Weekly Crypto Market Cap Chart

The cryptocurrency sector’s market capitalization has decreased greatly since we last reported, with its current value being $936.54 billion. This represents a $54.92billion decrease when compared to our previous report.

_______________________________________________________________________

What happened in the past 24 hours?

_______________________________________________________________________

_______________________________________________________________________

Technical analysis

_______________________________________________________________________

Bitcoin

Bitcoin’s gains in the past two days were taken away when bears took over the market after BTC failed to break the $34,627 mark. The cryptocurrency declined to the $32,350 level but quickly lost hold of it as well. BTC is currently hovering right above the $31,000 mark.

Bitcoin’s 1-hour RSI is getting dangerously close to the oversold territory, while its volume is descending, indicating a possible price stagnation or a direction reversal.

BTC/USD 1-hour chart

Bitcoin’s daily overview is completely neutral, while its weekly and monthly overviews are completely bullish. On the other hand, the 4-hour time-frame is completely bearish.

BTC/USD 1-day Technicals

Technical factors (1-hour Chart):

  • Price is below its 50-period EMA and its 21-period EMA
  • Price is close to its bottom Bollinger band
  • RSI is near the oversold area (31.21)
  • Volume is average

Key levels to the upside:          Key levels to the downside:

1: $32,350                             1: $30,072

2: $34,627                             2: $30,000

3: $37,445                             3: $27,960

Ethereum

The second-largest cryptocurrency by market cap spent the day retracing after posting a new all-time high at $1,477.30. ETH tested many levels but ultimately fell below the previous all-time high, and then the $1,420 and $1,350 levels as well. It is currently consolidating just above $1,300.

Ethereum seemingly created a zone of support just above the $1,300 level, which is holding up for 10 hours now. If this support holds long enough for BTC to change its price direction (or at least enter a sideways trading period), we may see ETH bulls reentering the market once again.

ETH/USD 1-hour Chart

Ethereum’s technicals on all time-frames are slightly tilted towards the buy-side, with its oscillators taking a more neutral stance.

ETH/USD 1-day Technicals

Technical Factors (1-hour Chart):

  • Price is below both its 50-period and its 21-period EMA
  • Price near its bottom Bollinger band
  • RSI is very close to being oversold (39.73)
  • Volume is average

Key levels to the upside:          Key levels to the downside:

1: $1,350                               1: $1,211

2: $1,420                               2: $1,183.85

3: $1,440                               3: $1047.6

Litecoin

Litecoin has lost all of the gains it made yesterday, and then some. The eighth-largest cryptocurrency by market cap failed to pass the zone just under $150, which triggered a pullback and a dip below the $142.1 support (now resistance) level. On top of that, LTC also fell below the trading range it was in for the previous four days (excluding yesterday’s push).

LTC/USD 1-hour Chart

Litecoin’s short-term and long-term overviews have opposing stances: while its 4-hour and overviews show a slight tilt towards the sell-side, its weekly and monthly overviews are slightly bullish.

LTC/USD 1-day Technicals

Technical factors (1-hour Chart):

  • Its price is below its 50-period EMA and its 21-period EMA
  • Price slightly above its bottom Bollinger band
  • RSI is close to being in the oversold territory (33.05)
  • Volume is average

Key levels to the upside:          Key levels to the downside:

1: $142.1                               1: $128.42

2: $161.5                               2: $120

3: $181.3                               3: $114.75

Categories
Crypto Market Analysis

Daily Crypto Review, Jan 25 – Ethereum Reaches a new All-Time High: What’s Next?

The crypto sector ended up mostly in the green as altcoins pushed up (while Bitcoin remained mostly stable). Several cryptocurrencies reached new all-time highs, including Ethereum and Aave. Bitcoin is currently trading for $33,335, representing an increase of 1/59% compared to yesterday’s value. Meanwhile, Ethereum’s price has increased by 7.93% on the day, while LTC gained 2.12% of its value.

Daily Crypto Sector Heat Map

Foglory Coin gained 389.19% in the past 24 hours, making it the most prominent daily crypto gainer by far. It is followed by Unifty’s 187.19% and MileVerse’s 160.11% gain. On the other hand, EveryCoin lost 76.45%, making it the most prominent daily loser. It is followed by Zloadr’s loss of 62.48% and FUTUREXCRYPTO’s loss of 54.1%.

Top 10 24-hour Performers (Click to enlarge)

Bottom 10 24-hour Performers (Click to enlarge)

Bitcoin’s market dominance dropped further from when we last reported, with its value currently being 62.7%. This represents a 2.1% decrease from our previous report.

Weekly Crypto Market Cap Chart

The cryptocurrency sector’s market capitalization has increased greatly since we last reported, with its current value being $991.66 14.56 billion. This represents a $77.10 billion increase when compared to our previous report.

_______________________________________________________________________

What happened in the past 24 hours?

_______________________________________________________________________

_______________________________________________________________________

Technical analysis

_______________________________________________________________________

Bitcoin

Bitcoin has spent the weekend with its price slowly descending towards the $30,000 mark until a new surge of buyers changed the price direction. BTC has bounced from the $30,900 level and pushed up past the $33,250 level. Its price is currently consolidating in the $33,400 zone.

Bitcoin’s upside is guarded not only by the $34,627 level but the recent high of $33,865. Traders will have to be careful when taking long positions on BTC and will have to devote most of the time checking the order flow to properly gauge the resistance levels.

BTC/USD 1-hour chart

Bitcoin’s 4-hour and weekly overviews are bullish and show some signs of neutrality or bearishness, while its monthly overview is completely bullish. On the other hand, its daily time-frame is pretty neutral.

BTC/USD 1-day Technicals

Technical factors (1-hour Chart):

  • Price is slightly above its 50-period EMA and its 21-period EMA
  • Price is close to its top Bollinger band
  • RSI is near the overbought area (64.47)
  • Volume is slightly below average

Key levels to the upside:          Key levels to the downside:

1: $34,627                             1: $32,350

2: $37,445                             2: $30,072

3: $38,000                             3: $27,960

Ethereum

The second-largest cryptocurrency by market cap “decoupled” from Bitcoin and pushed up, surging to its all-time highs and briefly creating a new one at $1,477.3. Ether is currently fighting to stay above $140 and enter the price discovery mode yet again.

Ethereum has quite a lot of support levels right beneath its current price, most notably the $1,440, $1,420, and $1,350 levels. Its upside levels past the all-time high will, however, have to be determined by drawing Fib retracement levels.

ETH/USD 1-hour Chart

Ethereum’s technicals on the 4-hour, daily, and weekly time-frames are bullish and show some signs of neutrality or bearishness, while its monthly overview is completely bullish.

ETH/USD 1-day Technicals

Technical Factors (1-hour Chart):

  • Price is above both its 50-period and its 21-period EMA
  • Price near its top Bollinger band
  • RSI is very close to being overbought (68.27)
  • Volume is above average

Key levels to the upside:          Key levels to the downside:

1: $1,440                               1: $1,420

2: $1,477.3                            2: $1,350

3: $1,500                               3: $1,211

Litecoin

Litecoin’s weekend went without much price fluctuation, with LTC moving between $133 and $143.5. However, LTC bulls managed to push past the $142.1 level and bring its price to $145, where it is now consolidating. Litecoin’s volume also surged during the price increase.

Litecoin traders will have to pay attention to several factors, including LTC technicals, Bitcoin price movement as well as Ethereum price movement.

LTC/USD 1-hour Chart

Litecoin’s overviews on all time-frames are bullish, with its 4-hour, daily, and weekly time-frames having some signs of neutrality, while its monthly overview is completely bullish.

LTC/USD 1-day Technicals

Technical factors (1-hour Chart):

  • Its price is slightly above its 50-period EMA and its 21-period EMA
  • Price slightly above its middle Bollinger band
  • RSI is neutral (63.36)
  • Volume is slightly above average

Key levels to the upside:          Key levels to the downside:

1: $161.5                               1: $142.1

2: $181.3                               2: $128.42

3: $186.3                               3: $120

Categories
Crypto Videos

Crypto Ban Petition Attempt! Is He Just Serving His Own Interests?


British Financial Advisor Creates a Crypto Ban Petition


Neil Liversidge, a veteran financial advisor and the owner of the independent financial advisory firm West Liversidge, has called on the government of the United Kingdom to fully ban transactions in cryptocurrencies like Bitcoin.

Liversidge’s strong opinion on the topic goes as far as him starting a petition urging the local financial authorities to stop cryptocurrency transactions in the UK. The petition has the goal to:

“Legislate to prohibit the payment by or any form of acceptance of cryptocurrencies by UK resident businesses or individuals, and to require UK regulators (the FCA and PRA) to prohibit any transactions by UK financial institutions in cryptocurrencies.”

Liversidge cited an anti-crypto narrative common amongst crypto disbelievers, arguing that cryptos such as Bitcoin have no intrinsic value and that they “can be a destabilizing influence on society, and mostly used for criminal activity.” The financial advisor also thinks that cryptocurrency proof-of-work mining is “harmful to the environment.”

The aforementioned petition’s deadline is July 7, 2021, according to the UK Government and Parliament website. At the moment, the petition has collected 108 signatures.

In an interview with finance-focused publication Professional Adviser on Jan 13, Liversidge noted that a blanket ban on cryptocurrency transactions in the UK would help the enforcement reduce the power of criminals using cryptocurrencies like Bitcoin for illicit activity. “Law enforcement will never catch all of the people that use crypto for illicit activities; it won’t even catch most of them. However, destroying their financial base reduces their power.”

Liversidge acknowledged that a crypto ban would immediately trigger a market crash: “If the UK government takes the lead and bans transactions on cryptos as my petition requests, that will surely set off a chain reaction, crashing cryptocurrencies overnight,” he said.

The IFA’s verdict is that all cryptocurrency investors should immediately sell their holdings: “If you’re holding cryptos now, my advice to you would be to find a bigger fool than you and dump it all quickly.” Liversidge also stated that he has “never owned any and never would own any” cryptocurrency, even if he knew it would net him hundreds of percent of returns.

Categories
Crypto Daily Topic Cryptocurrencies

How to Come Up With a Good Bitcoin Investment Strategy

Surprisingly, many people just buy Bitcoin and fumble with the investment until they make some profit. Investing in Bitcoin is actually a serious venture, and contrary to widespread practice, it needs a strategy! But what is an investment strategy anyway? What constitutes a good strategy? And, does it apply to all forms of Bitcoin investment?

These are the hard questions we seek to answer in this article. 

Is There a Right Way to Invest?

When investing in crypto or any other asset, you can gain or lose. The most successful investors are those who combine tactic, experience, and of course, luck. Since we cannot do anything about experience and luck, we are usually left with the tactic in the playground, and that’s where planning comes in. We’re not saying that there is a right or wrong way to invest. But, if you are really keen on maximizing your profits and keeping risks at bay, then planning for that journey is indispensable.

What is an Investment Strategy?

An investment strategy is a calculated approach that helps an investor make decisions to achieve specific goals. The investor could be seeking to multiply wealth. They could be seeking to protect whatever they already have. Regardless of the circumstances, an investment strategy must consider the investor’s goals, risk tolerance, and future capital needs. 

What Constitutes a Good Strategy?

Keeping in mind the above picture of what an investment strategy is, it is easy to figure out what a good one should be made of. Generally, you can consult the following checklist if you want to come up with a sound Bitcoin investment strategy.

  1. It contains your definition of risk tolerance – Risk is a central component of any investment strategy. Defining your risk tolerance helps you apply brakes when the train is accelerating in the wrong direction. It might sound trivial, but desperate decisions are never far from the mind when things get thick. 
  2. It identifies your goals – An investment strategy is nothing without goals. It should be clear from the start what you want to achieve from such an engagement. 
  3. It should be realistic – If it were that easy to make money, everyone would be rich. The excitement one gets when approaching an investment may mislead them to overshoot.
  4. It should aim at maximizing profits and minimizing risks – well, that’s the whole point of investing. 

This is by no means an exhaustive definition of a good investment. However, it is a fair guide on how to approach planning for your Bitcoin investment. With this background in mind, let us look at how you can develop an award-winning Bitcoin investment strategy.

Step #1 Identify the opportunity and the risk

If there is no opportunity, abort the mission. Diving straight into an investment without identifying whether there is a suitable opportunity sounds like gambling. After all, the whole purpose of venturing into investment is taking advantage of some opportunity. 

Spotting opportunities is not always easy, but sometimes it is. An example of opportunity in Bitcoin investment is the crypto’s rising value. This could be a short term opportunity or something that will outlive this generation (no one knows how long Bitcoin will sustain the uptrend). However you look at it, we must agree that identifying the opportunity is the basis of everything.

With opportunity comes risks. As mentioned earlier, risk is a core part of any investment strategy. The opportunity might be huge, but so could be the risk. If there is reason to believe that the current Bitcoin boom is a fad, the risk associated with investing all your savings would be catastrophic. The bottom line is, you should identify how much risk the opportunity presents and how much of it are you willing to tolerate.

Step #2 Decide how much and for how long

The amount of money you should invest and for how long are crucial parameters. Of course, you’re not planning to hold Bitcoin until you die. But if that is your intention, it should be clear from the onset. Holding assets indefinitely and without a plan defies the purpose of accumulating wealth.

However, this is not a rule cast in stone. For instance, if you plan to protect your wealth, you might want to convert a huge chunk of your dollar savings to Bitcoin, and short time fluctuations will not be a bother because profits will average out over time. 

Step #3 Invest – a plan without action is pointless.

Now that you have a clear goal and an understanding of the opportunities and risks, it is time to invest. Depending on your goals, you may find one investment approach more suitable than others. Typical options for investing in Bitcoin include:

  • Trading – With trading, you can either go for spot trading or derivatives trading. With spot trading, you simply buy Bitcoin when you think it is trading at a low price and sell when you believe the price has gone high enough. Without concrete investment goals, it is difficult to remain disciplined when spot trading as periods of explosive uptrends and epic falls might send you into euphoric buying/ panic selling episodes, respectively.
  • HODLing – This is where you buy Bitcoin and keep it with no intention of using the asset in the short run. This approach may be more suitable if you plan to protect your wealth or diversify your investment portfolio. Wealth stored in Bitcoin can be readily liquidated and converted to fiat money. You can also use such investments to acquire crypto loans. 

Step #4 Monitor your investment

An investment is like a seed – once sowed, the growth journey has only begun. Keeping an eye on your investment helps you to determine whether your strategy needs editing. If you believe you made mistakes in your original plan, there is no shame in revising it until you feel you have gotten it right. It is important to practice emotional control while observing how events unfold during the course of the growth of your wealth. You should also stay updated and keep learning, as that’s the only way to align your strategy with the reality of the market. 

Final Thoughts

Investing in Bitcoin is not complicated, but without planning for it, the chances of going nowhere with your investment are high. A good investment strategy, we have seen, needs to define your goals, your risk tolerance, be realistic, and focus on maximizing profits while keeping risks under control. There is no right or wrong way to invest, but that does not mean a planless investment is also acceptable. Similarly, the four-step approach described above is not the only sound methodology. However, it captures most of the crucial elements that will help your Bitcoin strategy stand out. Feel free to play around with it!

Categories
Crypto Market Analysis

Daily Crypto Review, Jan 22 – Bitcoin Briefly Drops Below $30K; Market Sees Blood on the Streets

The crypto sector ended up almost completely in the red as Bitcoin’s drop below $30,000 (at one point) led the market down. Bitcoin is currently trading for $31,730, representing a decrease of 8.41% compared to yesterday’s value. Meanwhile, Ethereum’s price has decreased by 11.29% on the day, while LTC lost 4.76% of its value.

Daily Crypto Sector Heat Map

EveryCoin gained 734.83% in the past 24 hours, making it the most prominent daily crypto gainer by far. It is followed by Vox.Finance’s 132.94% and DACC’s 129.86% gain. On the other hand, PegsShares lost 99.20%, making it the most prominent daily loser. It is followed by Mithril Share’s loss of 75.17% and Chimpion’s loss of 59.53%.

Top 10 24-hour Performers (Click to enlarge)

Bottom 10 24-hour Performers (Click to enlarge)

Bitcoin’s market dominance stayed at the same spot as when we last reported, with its value currently being 64.8%.

Weekly Crypto Market Cap Chart

The cryptocurrency sector’s market capitalization has decreased greatly since we last reported, with its current value being $914.56 billion. This represents a $10.97 billion decrease when compared to our previous report.

_______________________________________________________________________

What happened in the past 24 hours?

_______________________________________________________________________

_______________________________________________________________________

Technical analysis

_______________________________________________________________________

Bitcoin

Bitcoin has had a horrible day as bears took over the market. Its price dropped to as low as $28,800, but found support in its 50-day EMA. The downturn, however, means that the largest-cryptocurrency by market cap fell out of its triangle formation, most likely spelling a start of a short-term downtrend or sideways trading phase.

Bitcoin is very unpredictable at the moment, but traders could find an opportunity in looking for drastic volume increases and “catch the wave” of buyers or sellers (while taking into account all the support and resistance levels).

BTC/USD 1-hour chart

Bitcoin’s weekly and monthly time-frames are bullish but show some signs of neutrality or bearishness. On the other hand, its 4-hour and daily time-frames are completely bearish.

BTC/USD 1-day Technicals

Technical factors (1-hour Chart):

  • Price is slightly below its 50-period EMA and at its 21-period EMA
  • Price is at its middle Bollinger band
  • RSI is neutral after returning from being oversold (48.04)
  • Volume is above average

Key levels to the upside:          Key levels to the downside:

1: $32,350                             1: $30,072

2: $34,627                             2: $30,000

3: $37,445                             3: $27,960

Ethereum

The second-largest cryptocurrency by market cap followed Bitcoin’s direction, but with slightly less intensity. Ether’s price dropped below the $1,211 and $1,183.85 levels and found support in the $1,047.6 level. However, the bounce that came after the bulls came into the market was insufficient to break the $1,183.85 level, and Ethereum’s price is now trading just below it.

The $1,183.85 level could be considered a pivot point, and ETH’s short-term price direction will greatly depend on whether bulls manage to break this resistance.

ETH/USD 1-hour Chart

Ethereum’s technicals are still mostly tilted towards the buy-side, with its longer time-frames (weekly and monthly) being completely bullish, while its daily time frame’s oscillators are pointing to the sell-side. On the other hand, its 4-hour time-frame is completely bearish.

ETH/USD 1-day Technicals

Technical Factors (1-hour Chart):

  • Price is below its 50-period and at its 21-period EMA
  • Price is at its middle Bollinger band
  • RSI is neutral (45.02)
  • Volume is above average

Key levels to the upside:          Key levels to the downside:

1: $1,183.85                          1: $1047.5

2: $1,211                              2: $960.5

3: $1,350                             3: $932.5

Litecoin

Litecoin’s movement in the past 24 hours much resembled Ethereum, with its price dropping below the $142.1 level and finding support slightly below the $128.4 level. While its push up did not reach the now-resistance level of $142.1, Litcoin did find support in the 21-hour EMA.

Litecoin’s volume increase in recent hours is negligible compared to the increase that Bitcoin and Ethereum saw. This may indicate less intensity in the moves to come, regardless of the price direction.

LTC/USD 1-hour Chart

Litecoin’s weekly and monthly time-frames are completely bullish and but show no signs of neutrality or bearishness. On the other hand, its 4-hour and daily time-frames are completely bearish.

LTC/USD 1-day Technicals

Technical factors (1-hour Chart):

  • Its price is slightly below its 50-period EMA and slightly above its 21-period EMA
  • Price slightly above its middle Bollinger band
  • RSI is neutral (51.31)
  • Volume is slightly above average

Key levels to the upside:          Key levels to the downside:

1: $142.1                               1: $128.42

2: $161.5                               2: $120

3: $181.3                               3: $114.75

Categories
Crypto Videos

Bitcoin is a Possible Reserve Currency – Former Canadian Prime Minister Says!


Bitcoin is a Possible Reserve Currency – Former Canadian Prime Minister 

Stephen Harper, a former prime minister of Canada, says there may be a place for Bitcoin as well as central bank digital currencies as part of a basket of reserve currencies that may replace the dollar.

In an interview with the investment service, Cambridge House’s Jay Martin Harper stated the possibility of the US dollar being completely replaced could only come from a large currency such as the Euro or Chinese Yuan. He expressed his doubts when it comes to either of them being a viable alternative currency given the uncertainty over the value of the Euro in the long term and the “arbitrary measures” that the Chinese government would take when it comes to guiding the value of the Yuan:

“It’s very hard to see what the alternative is to the US dollar as the world’s major reserve currency. Other than possible candidates such as gold, Bitcoin, a whole basket of things… I think you’ll see the sheer number of things that people use as reserves will certainly expand, but the US dollar will still be the bulk of it.”

The former prime minister then added that he thought central bank digital currencies were to some degree “inevitable,” but that they would likely be subject to monetary policy around the world. Harper stated his concern about central banks becoming “some kind of a general banker” rather than just a financial monitor that they currently are:

“Ultimately, if you have a digital currency that will be used by the central bank to control inflation and create a stable currency as well as priceability, then this digital currency is just a straightforward evolution of the marketplace,” Harper stated. “But if it is part of a series of what I consider as wild experiments as to the role of central banking… Well, then it worries me a lot.”

Stephen Harper served as the prime minister of Canada for nine years, from 2006 until 2015. Cryptocurrency and blockchain adoption in Canada has started expanding significantly since his departure, with the country getting its first regulated crypto exchange in Sept. 

Categories
Crypto Videos

Canada’s First Public BTC Fund Grows 900% Passing 1 Billion Dollars!


Canada’s first public BTC fund grows 900% as it passes the $1 billion milestone

Canadian regulated digital asset manager 3iQ has passed another massive milestone of its public Bitcoin fund. 

On Jan 14, 3iQ’s Bitcoin Fund hit the $1 billion mark, as the company announced the news on Twitter. The new milestone shows QBTC’s parabolic growth after 3iQ originally launched the fund in April 2020. QBTC is up 900% from its previous milestone of $100 million recorded in Oct 2020.

As previously reported, 3iQ’s BTC fund is the first public Bitcoin fund in Canada that got listed on a major stock exchange, the Toronto Stock Exchange. Gemini, a firm owned by the Winklevoss brothers, provides custody services for 3iQ’s QBTC fund.

QBTC.U is currently trading at $48.63, up 330% from the $11 price it was trading for when it got listed in April.

3iQ is one of the largest cryptocurrency firms in Canada. In Jan 2018, 3iQ reportedly became the first cryptocurrency fund regulated by the Ontario Securities Commission as well as the Canadian Securities Administrators. Two years after that, in Feb 2020, 3iQ partnered with the blockchain startup Mavennet to launch a stablecoin that would be pegged to the Canadian dollar. This stablecoin would be regulated by the Financial Transactions and Reports Analysis Centre of Canada (FINTRAC).

3iQ’s former senior executive Shaun Cumby is currently the CEO of Arxnovum, a company that filed an application with OSC for a Bitcoin exchange-traded fund on Jan 11, 2021. Winklevoss’ Gemini will also provide its custody for the Arxnovum’s Bitcoin ETF.

Categories
Crypto Market Analysis

Daily Crypto Review, Jan 21 – BTC in a Triangle Formation – What do the Analysts Say?

The crypto sector was split between slight gainers and slight losers, but overall lost some value as the market cap dropped below $1 trillion. Bitcoin is currently trading for $34,644, representing a decrease of 2.39% compared to yesterday’s value. Meanwhile, Ethereum’s price has decreased by 4.12% on the day, while LTC lost 5.41% of its value.

Daily Crypto Sector Heat Map

Cocos-BCX gained 107983.76% in the past 24 hours, making it the most prominent daily crypto gainer by far. It is followed by HAPY Coin’s 383.49% and Vox.Finance’s 371.42% gain. On the other hand, PegsShares lost 59.35%, making it the most prominent daily loser. It is followed by KIMCHI.finance’s loss of 44.21% and EveryCoin’s loss of 34.88%.

Top 10 24-hour Performers (Click to enlarge)

Bottom 10 24-hour Performers (Click to enlarge)

Bitcoin’s market dominance has moved down slightly since our last report as altcoins started to outperform, with its value currently being 64.8%. This value represents a 0.1% difference to the downside when compared to the previously reported value.

Weekly Crypto Market Cap Chart

The cryptocurrency sector’s market capitalization has decreased slightly since we last reported, with its current value being $955.53 billion. This represents a $69 billion decrease when compared to our previous report.

_______________________________________________________________________

What happened in the past 24 hours?

_______________________________________________________________________

_______________________________________________________________________

Technical analysis

_______________________________________________________________________

Bitcoin

Bitcoin’s daily time-frame shows that the cryptocurrency is still contained within the triangle formation, which will be a major determinant in BTC’s future price movement. If we zoom in to the hourly time-frame, we can see that BTC moved down, broke the $34,627, and pushed towards the downside, but got instantly stopped by the triangle formation’s bottom line.

While Bitcoin’s short-term overview seems slightly bearish, many analysts call for a push towards $60,000 before any major pullback. However, judging by the current trading session, BTC has a higher chance of breaking the triangle formation to the downside at the moment.

BTC/USD 1-hour chart

Bitcoin’s weekly and monthly time-frames are completely bullish and show no signs of bearishness. On the other hand, its daily time-frame oscillators point to “sell” while the rest of the overview is still bullish, and its 4-hour time-frame is completely bearish.

BTC/USD 1-day Technicals

Technical factors (1-hour Chart):

  • Price is slightly below both its 50-period EMA and its 21-period EMA
  • Price is slightly below its middle Bollinger band
  • RSI is neutral (44.21)
  • Volume is average (low)

Key levels to the upside:          Key levels to the downside:

1: $37,445                             1: $34,627

2: $40,000                             2: $32,350

3: $42,000                             3: $27,960

Ethereum

The second-largest cryptocurrency by market cap went into retracement mode after creating a new all-time high of $1,440 two days ago. Ether’s price moved in a straight descending pattern at first but then bounced back up and tried to retest the $1,350 level. As time passed, it was more and more evident that ETH failed to break $1,350 to the upside and that its price is now contained between $1,350 to the upside and $1,211 to the downside.

Ether’s current upside is heavily guarded, not only by the $1,350 level but also by the 21-hour and 50-hour EMAs.

ETH/USD 1-hour Chart

Ethereum’s technicals on all time-frames are bullish, but only its daily time-frame shows no signs of neutrality or bearishness. The rest of the time-frames (4-hour, weekly, and monthly) have their oscillators pointing to a neutral or bearish stance.

ETH/USD 1-day Technicals

Technical Factors (1-hour Chart):

  • Price is slightly below its 50-period and its 21-period EMA
  • Price is slightly below its middle Bollinger band
  • RSI is neutral (44.30)
  • Volume is average

Key levels to the upside:          Key levels to the downside:

1: $1,350                               1: $1,211

2: $1,420                               2: $1,183.85

3: $1,440                              3: $1047.5

Litecoin

Litecoin spent the day trading on very low volume compared to the previous days, with its price contesting the $142.1 level twice. At the moment, LTC traders can face two scenarios, one being LTC falling below $142.1 level and pushing towards $128.4, and the second one being that LTC acts on the double bottom it created and pushes up to regain some of the lost value.

LTC/USD 1-hour Chart

Litecoin’s technicals are pretty split, with its 4-hour and daily indicators showing almost complete bearish sentiment and its weekly and monthly overviews showing complete bullishness.

LTC/USD 1-day Technicals

Technical factors (1-hour Chart):

  • Its price is slightly below both its 50-period EMA and its 21-period EMA
  • Price between its middle and bottom Bollinger band
  • RSI is neutral (41.78)
  • Volume is below average

Key levels to the upside:          Key levels to the downside:

1: $161.5                               1: $142.1

2: $181.3                               2: $128.42

3: $186.3                               3: $114.75

Categories
Crypto Daily Topic Cryptocurrencies

Now You can Earn Interest on Your Idle Crypto Assets with Nexo

Apart from HODLing and spending, many crypto users have no idea what to do with their crypto assets. Nexo, a leading financial institution for digital assets, provides crypto users with the opportunity to earn interest on their idle crypto assets. Overall, the concept is simple – you entrust your assets with Nexo, they invest them primarily through lending, and you share the returns. It works almost like a traditional investment bank; only that crypto is the main asset here.

Naturally, many questions will emerge regarding the profitability of Nexo’s offerings, its security, usability, and much more – investors are an inquisitive lot. This article will answer some of the most pertinent ones if only that will give you the confidence to join the league of passive investors. 

What Is Nexo?

Before we rush into how to invest with Nexo, let us first understand what it is. Simply put, Nexo is (arguably) the world’s leader in the provision of digital banking services. The company has strived to bring traditional banking to the world of crypto by merging fintech with blockchain. Nexo specializes in providing lending facilities in the DeFi space. According to the company, $5 billion worth of digital loans have been processed on the platform since its establishment in 2018. The company enjoys a user base of over 1 million and is available in nearly every corner of the planet. 

How Do You Earn?

Nexo offers a variety of crypto financial services, with lending at the top of the list. To earn, you need to deposit supported digital assets (both fiat and crypto) to your Nexo account. The following steps should help with the process:

  1. Register for an account on platform.nexo.io 
  2. Enable 2-factor authentication (this is mandatory)
  3. Scroll down until you find a list of supported crypto assets and select ‘Top Up’ on the one you wish to invest in. Besides the token, you will see how much interest you can earn from each one and what options there are for maximizing your interest.
  4. Nexo will generate a deposit address and a QR code. You can either copy the address or scan the code. It is extremely important to double-check this address before depositing since Nexo puts a disclaimer for funds sent to the wrong address. You can also top up your Nexo account directly from an exchange. If you are depositing BTC, your transaction will appear after 6 nodes have confirmed the transfer. For ETH and other ERC-20 tokens, 50 is the required number of confirmations. 
  5. You can follow the progress of your deposits on the transactions page/ tab.
  6. Interest is earned when you withdraw from your available credit line. The withdraw button is conveniently placed next to the deposit button. 

The steps may look numerous, but really, the entire process can be summarized as ‘top up supported assets and start earning automatically.’ In other words, once you deposit, no other effort is required from you – that’s the true spirit of passive earning. 

Which Digital Assets Can You Invest?

Nexo supports the following digital assets:

  • Bitcoin
  • Ether
  • Litecoin
  • Bitcoin Cash
  • Nexo Token
  • XRP (Ripple)
  • Tether
  • USD Coin
  • Dai
  • Euro
  • GBP
  • Several others

Is Nexo a Good Investment?

As an investor, you have the choice to bid your assets in a portfolio of your choice. So, what would make you choose Nexo first? The following factors might:

  • You can earn up to 12% interest on stablecoins. Interest earned depends on the asset you have deposited and the method you choose for payout. Earning in Nexo for selected stablecoins attracts the full 12% interest.
  • While interest is calculated on an annual percentage rate (APR), payouts are made daily. So you don’t have to wait for end-year dividends like most investments.
  • You can deposit or withdraw funds at any time of your liking.
  • Your deposited assets are backed by a $100 million insurance secured with BitGo.
  • There are no minimum contribution thresholds and no fees charged for funding or withdrawing from your wallet.

Are There Any Risks?

Any keen investor would be worried about the safety of their investment, especially if their assets will be used to extend credit to others. With Nexo, this is not a matter of great concern as your assets and those of others are backed by a $100 million insurance at BitGo. Deposits are also stored in multisig cold storage wallets so you can rest easy as your money works for you. 

Additionally, borrowers have a limit based on their deposited crypto assets. Nexo uses a complex formula to dynamically calculate credit limits based on the dynamic value of digital assets. So, Nexo is unlikely to run out of cash due to overborrowing. 

Lastly, while this is not a risk per se, it is worth noting that first time users may find the platform a little cumbersome to use. The website has only scanty information about what you need to do to get started, and you are likely to fumble around looking for where to click next. Clearly, the platform has not been customised for the crypto investor who’s just starting out. 

Reputation and Regulation 

Nexo boasts of a good reputation among users of crypto financial services. On TrustPilot, a leading consumer review website, 90% of users have ranked it ‘excellent,’ with a score of 4.8/5. The company is also licenced and regulated by the European Central Bank, besides being certified as ISO/IEC 27001:2013 compliant. With such credentials, you can be assured that you will be dealing with a legitimate and tried, and trusted platform. 

But What’s The Catch?

For those who are still not convinced about the viability of Nexo’s business model, questions on where’s the catch will linger. The way this financial institution operates is quite similar to traditional banks – users deposit their assets (usually dollars, euro, etc.), which gives the banks the capital to finance credit and other investments. The only difference is that Nexo cannot rely on traditional loan recovery techniques in case a borrower defaults. Therefore, the company depends on a user’s deposited assets as collateral. You can deposit multiple assets to maintain a positive loan-to-value ratio. This ratio is an indicator of your ability to settle the debt. If you default, Nexo will automatically initiate a sale of your deposited assets until the desired balance is achieved. 

Final Thoughts

‘Earn passively from your idle crypto assets’ sounds just as cool as it is, especially when using Nexo. The platform allows you to deposit a variety of crypto assets and earn up to 12% interest. Interestingly, all you need to do is deposit funds to your Nexo wallet, just as you would do with a crypto exchange. Nexo’s investment terms are quite friendly. For instance, there are no minimum deposits, you can deposit or withdraw at any time, payouts are done daily, and so on. Additionally, the platform ensures the security of your funds is guaranteed by implementing 2-factor authentication for deposits and withdrawals, insuring depositors’ funds, and storing them in multisig cold storage wallets. The only downside with Nexo is the limited information on the website, which might leave new investors struggling to get started. 

Categories
Crypto Videos

Grayscale GBTC Faces Competition!


GBTC Faces Competition in the OTC Bitcoin Trust Market

Osprey Funds has just entered the crypto sector and is trying to become Grayscale’s competitor. The firm is offering an over-the-counter Bitcoin trust under the ticker symbol OBTC. The trust Osprey offer is similar to Grayscale’s Bitcoin Trust, also known as GBTC.

“The Osprey Bitcoin Trust provides an easy access to Bitcoin,” the firm’s website says. They charge a 0.49% management fee, which is the lowest cost solution currently on the market. As they stated, Osprey is an entity that “builds digital asset solutions for intelligent investors,” with the OBTC trust considered its “flagship offering.”

“OBTC began operating and being quoted in the OTC market on Friday, Jan 15,” Osprey Funds’ CEO, Greg King, said, adding:

“As of Jan 14, the product met all the requirements to become quoted under the OBTC ticker in the OTC market. In the next 30 days, the fund will attempt to become DTC eligible, and after Feb 14, all additional market makers will be allowed to quote it. 

Osprey’s launch in the BTC trust market is a direct poke at the largest Bitcoin trust, Grayscale. Grayscale has become one of the largest BTC holders in the world, currently possessing over 500,000 BTC.

GBTC stepped into the market with the idea to provide the public with easier access to Bitcoin through more traditional avenues, all while not even requiring them to custody their own funds. GBTC comes with a yearly 2% management fee, which is where Osprey wants to step in and beat the competition. Osprey’s recently unveiled BTC trust announced a management fee of only 0.49%. 

“We are always happy to see cryptocurrency access products enter the market, especially here in the US,” CEO of Grayscale Michael Sonnenshein told Bloomberg.

Accredited investors will require a $25,000 minimum to buy directly into the trust. Additionally, OBTC shares have a lock-up period of one year before they can be sold in the secondary market. As a comparison, Grayscale’s Bitcoin Trust requires a six-month lock-up. However, based on King’s comments to Bloomberg, the public may expect Osprey’s lock-up period to be cut in half in the near future.

Categories
Crypto Videos

JPMorgan Chase Executives Talk About Stablecoins!


JPMorgan Chase Executives Talk About Stablecoins

During a JP Morgan Chase’s Q4 2020 earnings call, the firm’s CEO Jamie Dimon and CFO Jennifer Piepszak discussed the OCC’s recent approval of banks being able to use stablecoins for payments, as well as whether or not this approval will have any significant impact on the development of JPM Coin, the company’s private digital currency. 

During the Q&A portion of the call, Portales Partners analyst Charles Peabody asked the executives about the OCC approval for banks to use various public blockchain networks for payments.

“That guidance enables an offering of stablecoins going on a public blockchain. That doesn’t impact the JPM coin. You should think about JPM coin as the tokenization of our customer deposits,” stated JP Morgan CFO Jennifer Piepszak, according to the call transcript.

However, she did not completely rule out the possibility of a stablecoin backed by JPM if customers showed interest.

“It’s obviously very early. We will assess the use cases and customers’ demands. But, it is still too early to see where everything goes for us.”

JPM CEO Jamie Dimon was quick to jump in and mention that the bank is currently “using blockchain for sharing data with banks,” and adding that their bank is at the forefront of development.

Debuted in Oct 2020, JPM Coin is used on the backend of JPM’s payments systems, helping the firm settle nearly $6 trillion in payments on a daily basis. 

Ultimately, Dimon seemingly implied that crypto payments settlement wouldn’t greatly change how JP Morgan operates.

“I do expect that stuff is coming soon, and it may not change our world all that much.”

However, Dimon may be underestimating the impact that crypto will have on the payments landscape. Paypal is one of the Fintech giants that Dimon mentioned by name as a direct competitor, confirmed that crypto payments would be available in 2021. The CEO — a former skeptic of cryptocurrencies — made it very clear that payments will become an increasingly crowded field over the next decade:

“I expect it to be a very, very tough competition in the next ten years. However, I expect to win. So help me, God.”

Categories
Crypto Market Analysis

Daily Crypto Review, Jan 20 – ETH Reaches a New All-Time High; Crypto Sector in the Red

The crypto sector ended up mostly in the red as altcoins started retracing after their moves to the upside. Bitcoin is currently trading for $35,776, representing a decrease of 2.1% compared to yesterday’s value. Meanwhile, Ethereum’s price has increased by 3.28% on the day, while LTC lost 3.44% of its value.

Daily Crypto Sector Heat Map

Folder Protocol gained 813.46% in the past 24 hours, making it the most prominent daily crypto gainer by far. It is followed by Global Gaming’s 198.29% and Benchmark Protocol’s 159.89% gain. On the other hand, 3XT TOKEN lost 85.20%, making it the most prominent daily loser. It is followed by Ether Kingdoms Token’s loss of 61.70% and Matrix AI Network’s loss of 52.48%.

Top 10 24-hour Performers (Click to enlarge)

Bottom 10 24-hour Performers (Click to enlarge)

Bitcoin’s market dominance has moved down since our last report as altcoins started to outperform, with its value currently being 64.9%. This value represents a 0.7% difference to the downside when compared to the previously reported value.

Weekly Crypto Market Cap Chart

The cryptocurrency sector’s market capitalization has decreased slightly since we last reported, with its current value being $1.024 trillion. This represents a $10 billion decrease when compared to our previous report.

_______________________________________________________________________

What happened in the past 24 hours?

_______________________________________________________________________

_______________________________________________________________________

Technical analysis

_______________________________________________________________________

Bitcoin

Bitcoin’s daily time-frame shows us that the largest cryptocurrency by market cap is still contained within the triangle formation (purple). Any break of the current sideways movement may contest the triangle as well. On the other hand, BTC on the 1-hour time-frame is bouncing between the $34,627 support and the $37,445 resistance level for the past five days.

Bitcoin’s price will soon have to break the sideways trading pattern and contest the triangle formation. If BTC bulls or bears manage to break the triangle formation, we could see a large move in the same direction.

BTC/USD 1-hour chart

Bitcoin’s short-term (4-hour and daily) technicals are slightly tilted towards the sell-side but still show a hint of neutrality or bullishness. Its weekly and monthly technicals are exactly the opposite, as they are slightly bullish but show some bearishness alongside it.

BTC/USD 1-day Technicals

Technical factors (1-hour Chart):

  • Price is slightly below both its 50-period EMA and its 21-period EMA
  • Price is slightly below its middle Bollinger band
  • RSI is neutral (44.32)
  • Volume is average (low)

Key levels to the upside:          Key levels to the downside:

1: $37,445                             1: $34,627

2: $40,000                             2: $32,350

3: $42,000                             3: $27,960

Ethereum

The second-largest cryptocurrency by market cap took advantage of the “altcoin season” as money moved from Bitcoin and onto other altcoins. Ever since Ether’s price bounced from the $1,211 level on Jan 18, we could see bulls coming to the market in larger numbers. This made the $1,350 level fall, and ETH finally set a new all-time high of $1,440. While the new ATH is just $20 away from its previous one, this is considered a testament to Ethereum’s upside potential.

Ether couldn’t position itself above the $1,420 (previous ATH) and fell below as it started retracing. Its price is now testing the $1,350 level but will most likely stay above it.


ETH/USD 1-hour Chart

Ethereum’s technicals on all time-frames are tilted towards the buy-side, but all show a hint of bearishness in the oscillator department.

ETH/USD 1-day Technicals

Technical Factors (1-hour Chart):

  • Price is above its 50-period and at its 21-period EMA
  • Price is slightly below its middle Bollinger band
  • RSI is neutral (50.69)
  • Volume is above average

Key levels to the upside:          Key levels to the downside:

1: $1,420                               1: $1,350

2: $1,440                               2: $1,211

3: $1,450                               3: $1,183.85

Litecoin

Litecoin spent the day retracing from the recent $166.2 high after bulls reached exhaustion. LTC was trying to push towards the $180 levels and contest the 2021 highs but failed to do so as bulls spent too much strength in the $160 area, where the cryptocurrency faced heavy resistance.

Litecoin is now having a downward trajectory and has failed to break the 50-hour moving average in an attempt to break it. LTC traders may look for a trade after the cryptocurrency finishes testing the $142.1 level.

LTC/USD 1-hour Chart

Litecoin’s technicals on the 4-hour and monthly time-frames are completely bullish and show no neutrality or bearishness. On the other hand, its daily and weekly overviews show some form of bearishness.

LTC/USD 1-day Technicals

Technical factors (1-hour Chart):

  • Its price is below both its 50-period EMA and its 21-period EMA
  • Price sightly below its middle Bollinger band
  • RSI is neutral (44.85)
  • Volume is average

Key levels to the upside:          Key levels to the downside:

1: $161.5                               1: $142.1

2: $181.3                               2: $128.42

3: $186.3                               3: $114.75

Categories
Crypto Market Analysis

Daily Crypto Review, Jan 19 – Ether Breaks $1,300; Litecoin Skyrockets

The crypto sector was mostly green, with altcoins attempting to push up and reduce Bitcoin’s market dominance. Bitcoin is currently trading for $36,423, representing an increase of 3.85% compared to yesterday’s value. Meanwhile, Ethereum’s price has increased by 9.89% on the day, while LTC gained 13.38% of its value.

Daily Crypto Sector Heat Map

4THPILLAR TECHNOLOGIES gained 441.52% in the past 24 hours, making it the most prominent daily crypto gainer by far. It is followed by CryptoAds Marketplace’s 221.1% and YAMv2’s 181.43% gain. On the other hand, CY Finance lost 66.83%, making it the most prominent daily loser. It is followed by Basiscoin Share’s loss of 39.38% and Trading Membership Community’s loss of 37.1%.

Top 10 24-hour Performers (Click to enlarge)

Bottom 10 24-hour Performers (Click to enlarge)

Bitcoin’s market dominance has moved down since our last report, with its value currently being 65.6%. This value represents a 0.5% difference to the downside when compared to the previously reported value.

Weekly Crypto Market Cap Chart

The cryptocurrency sector’s market capitalization has returned above the $1 trillion mark since we last reported, with its current value being $1.034 trillion. This represents a $41.3 billion increase when compared to our previous report.

_______________________________________________________________________

What happened in the past 24 hours?

_______________________________________________________________________

_______________________________________________________________________

Technical analysis

_______________________________________________________________________

Bitcoin

Bitcoin spent the day mostly trading sideways, bound by the $34,627 to the downside and $37,445 to the upside. The price hopped between these levels and created a higher high higher low pattern, which later on broke after BTC couldn’t pass its immediate resistance level.

Bitcoin’s price has created a triangle pattern on the daily chart, and breaking this triangle to the upside or downside will determine the short-term price direction.

BTC/USD 1-hour chart

Bitcoin’s technicals on all time-frames show a slight bullish tilt, with its oscillators pointing towards the sell-side.

BTC/USD 1-day Technicals

Technical factors (1-hour Chart):

  • Price is at both its 50-period EMA and its 21-period EMA
  • Price is at its middle Bollinger band
  • RSI is neutral (49.56)
  • Volume is average (low)

Key levels to the upside:          Key levels to the downside:

1: $37,445                             1: $34,627

2: $40,000                             2: $32,350

3: $42,000                             3: $27,960

Ethereum

Unlike Bitcoin, Ethereum has spent the day first slowly preparing for a move and then explosively pushing to the upside. The second-largest cryptocurrency by market cap has, after confirming its position above the $1,211 level, shot up towards the $1,350 level, which it was not able to break. With the volume descending after that move, ETH will most likely not be able to break $1,350 unless a new wave of bulls comes into the market.

ETH/USD 1-hour Chart

Ethereum’s 4-hour, daily, and monthly technicals are completely bullish and show no signs of neutrality or bearishness. On the other hand, its weekly overview shows some neutrality.

ETH/USD 1-day Technicals

Technical Factors (1-hour Chart):

  • Price is above both its 50-period and its 21-period EMA
  • Price is at its top Bollinger band
  • RSI has just left the overbought area (67.24)
  • Volume has spiked up in the recent hours

Key levels to the upside:          Key levels to the downside:

1: $1,350                               1: $1,211

2: $1,420                               2: $1,183.85

3: $1,450                               3: $1,060.5

Litecoin

Litecoin was one of the largest daily gainers after its price suddenly shot up from $141 all the way up to $160 in just one hourly candle. While it seemed at first like the retracement will eat away the gains LTC made, the cryptocurrency made another push towards the upside and stopped just below the $161.55 resistance level.

Litcoin’s descending volume and price movement, as well as the number of sell orders near the $161.55 level, will most likely be enough to keep LTC below the resistance level for now.

LTC/USD 1-hour Chart

Litecoin’s technicals on the 4-hour, daily, and weekly time-frame are completely bullish, while its monthly technicals are slightly more neutral.

LTC/USD 1-day Technicals

Technical factors (1-hour Chart):

  • Its price is above both its 50-period EMA and its 21-period EMA
  • Price close to its top Bollinger band
  • RSI is neutral (66.70)
  • Volume is above average

Key levels to the upside:          Key levels to the downside:

1: $161.5                               1: $142.1

2: $181.3                               2: $128.42

3: $186.3                               3: $114.75

Categories
Crypto Market Analysis

Daily Crypto Review, Jan 18 – Bitcoin Drops During the Weekend, ETH Remains Strong

The crypto sector spent the weekend in a mostly descending fashion, with BTC continuing its short-term downtrend. Bitcoin is currently trading for $35,258, representing an increase of 0.14% compared to yesterday’s value. Meanwhile, Ethereum’s price has decreased by 0.39% on the day, while LTC lost 0.46% of its value.

Daily Crypto Sector Heat Map

Astosch gained 285.95% in the past 24 hours, making it the most prominent daily crypto gainer by far. It is followed by ALL BEST ICO’s 273.67% and Yeld Finance’s 264.65% gain. On the other hand, Bestay lost 87%, making it the most prominent daily loser. It is followed by Zugacoin’s loss of 85.51% and VKF Platform’s loss of 77.77%.

Top 10 24-hour Performers (Click to enlarge)

Bottom 10 24-hour Performers (Click to enlarge)

Bitcoin’s market dominance has moved down since our last report, with its value currently being 66.1%. This value represents a 2.3% difference to the downside when compared to the previously reported value.

Weekly Crypto Market Cap Chart

The cryptocurrency sector’s market capitalization has dropped below the $1 trillion mark since we last reported, with its current value being $993.33 billion. This represents a $43.67 billion decrease when compared to our previous report.

_______________________________________________________________________

What happened in the past 24 hours?

_______________________________________________________________________

_______________________________________________________________________

Technical analysis

_______________________________________________________________________

Bitcoin

Bitcoin spent the weekend following the downtrend it started on Jan 14, with its price slowly declining from a high of $39,600 to a low of $33,833. During the downtrend, the price has contested and broken the $36,640 level to the downside and looks like it will contest the $33,200 level in the near future. BTC is currently trading at a little above $35,000, representing a weekly loss of 6.09% and a monthly gain of 29.87%.

Bitcoin’s price has responded well to the 21-day moving average and found very strong support there. Staying above this level will be crucial if BTC wants to turn to the upside.

BTC/USD 1-hour chart

Bitcoin’s technicals on the daily, weekly, and monthly time-frame are completely bullish and show no neutral or bearish signs. On the other hand, its 4-hour overview is completely bearish.

BTC/USD 1-day Technicals

Technical factors (1-hour Chart):

  • Price is slightly below its 50-period EMA and its 21-period EMA
  • Price is slightly below its middle Bollinger band
  • RSI is neutral (43.00)
  • Volume is descending

Key levels to the upside:          Key levels to the downside:

1: $36,640                             1: $33,200

2: $40,000                             2: $30,640

3: $42,000                             3: $27,960

Ethereum

Unlike Bitcoin, Ethereum’s weekend was not spent in a downfall. The second-largest cryptocurrency by market cap headed towards the $1,300 level but failed to break it, which prompted a weekend of sideways trading. While ETH did break the $1,211 level to the downside, the $1,183.85 level held up. Ether is currently trading in a very narrow range, bound by the aforementioned levels.

ETH’s short-term movement will greatly depend on two factors: Bitcoin’s volatility and Ether itself, breaking its immediate support or resistance levels.

ETH/USD 1-hour Chart

Ethereum’s technicals all time-frames are tilted towards the buy-side, with the 4-hour, daily, and weekly overviews fully pointing towards the buy-side. Its monthly overview, however, has oscillators pointing towards neutrality.

ETH/USD 1-day Technicals

Technical Factors (1-hour Chart):

  • Price is slightly below its 50-period and its 21-period EMA
  • Price is between its middle and bottom Bollinger band
  • RSI is neutral (43.72)
  • Volume is slightly below average

Key levels to the upside:          Key levels to the downside:

1: $1,211                               1: $1,183.85

2: $1,255                               2: $1,060.5

3: $1,350                               3: $1,047.5

Litecoin

Litecoin mirrored Bitcoin’s movements over the weekend, stepping into a downtrend that started on Jan 14, after Litecoin couldn’t push its price to $160. The price is currently fighting for the $142.1 level, which it has recently broken to the downside.

While Litecoin’s movements seem to mirror Bitcoin’s, its volume remains stable despite Bitcoin’s volume dropping. At the moment, LTC might be a better choice for people that want to be less affected by Bitcoin’s volatility.

LTC/USD 1-hour Chart

Litecoin’s technicals on the daily, weekly, and monthly time-frame are completely bullish and show no neutral or bearish signs (though they are slightly less bullish than Bitcoin’s overviews). On the other hand, its 4-hour overview is completely bearish.

LTC/USD 1-day Technicals

Technical factors (1-hour Chart):

  • Its price is slightly below its 50-period EMA and its 21-period EMA
  • Price close to its bottom Bollinger band
  • RSI is neutral (42.47)
  • Volume is average

Key levels to the upside:          Key levels to the downside:

1: $142.1                               1: $128.42

2: $161.5                               2: $114.75

3: $181.3                               3: $97.8

Categories
Crypto Market Analysis

Daily Crypto Review, Jan 15 – Bitcoin Retraces After Hitting $40k; Ethereum Contests $1.2k

The crypto sector was mostly stable in the past 24 hours, as most cryptocurrencies were trying to find their top or retraced slightly. Bitcoin is currently trading for $37,766, representing a decrease of 0.42% compared to yesterday’s value. Meanwhile, Ethereum’s price has increased by 5.98% on the day, while LTC gained 0.33% of its value.

Daily Crypto Sector Heat Map

FastSwap gained 244.13% in the past 24 hours, making it the most prominent daily crypto gainer by far. It is followed by HedgeTrade’s 225.26% and Capital.Finance’s 145.48% gain. On the other hand, Zugacoin lost 87.51%, making it the most prominent daily loser. It is followed by Roti Bank Coin’s loss of 77.52% and BitiPro Exchange Token’s loss of 74.35%.

Top 10 24-hour Performers (Click to enlarge)

Bottom 10 24-hour Performers (Click to enlarge)

Bitcoin’s market dominance has moved down slightly since our last report, with its value currently being 68.4%. This value represents a 0.6% difference to the downside when compared to the previously reported value.

Weekly Crypto Market Cap Chart

The cryptocurrency sector’s market capitalization has made negligible gains since we last reported, with its current value being $1.037 trillion. This represents a $5 billion increase when compared to our previous report.

_______________________________________________________________________

What happened in the past 24 hours?

_______________________________________________________________________

_______________________________________________________________________

Technical analysis

_______________________________________________________________________

Bitcoin

Bitcoin has ended its uptrend by hitting a high of $40,112 yesterday, prompting a slight pullback. The pullback was, just like the price increase, happening on low volume and had the same intensity as well. The only differentiating factor was its direction. The move to the downside ended with BTC’s price hitting the 50-hour moving average and pushing up.

Bitcoin has a couple of strong resistance lines to the upside, one being the immediate 21-hour EMA, and then the $40,000 and ultimately $42,000 levels. On the other hand, its support is guarded by the 50-hour EMA and the $36,640 level.

BTC/USD 1-hour chart

Bitcoin’s technicals on the daily and monthly time-frame are overall bullish but have oscillators pointing to the sell-side. On the other hand, its 4-hour and weekly overviews are completely bullish.

BTC/USD 1-day Technicals

Technical factors (1-hour Chart):

  • Price is between its 50-period EMA and its 21-period EMA
  • Price is slightly below its middle Bollinger band
  • RSI is neutral (50.19)
  • Volume is average

Key levels to the upside:          Key levels to the downside:

1: $40,000                             1: $36,640

2: $42,000                             2: $33,200

3: $43,600                             3: $30,640

Ethereum

Ethereum’s push to the upside has, just like with Bitcoin, seemingly ended. However, its pullback hasn’t started at all, as its price kept fluctuating between the recently $1,183.85 support level and the recent high. Trading in such a narrow range is not sustainable, and ETH will break either to the upside or downside very soon.

ETH traders can finally catch a nice trade as the cryptocurrency has (at least a bit) moved in a different manner than Bitcoin. Ether’s upside is guarded by the heavy resistance zone slightly below $1,300 as well as the $1,350 level. Its downside has smaller support levels, some of them being $1,211, $1,183.85, as well as the 21-hour and 50-hour EMAs.

ETH/USD 1-hour Chart

Ethereum’s technicals on the 4-hour and daily time-frames are overall bullish but have oscillators pointing to the sell-side. On the other hand, its weekly and monthly overviews are completely bullish.

ETH/USD 1-day Technicals

Technical Factors (1-hour Chart):

  • Price is above its 50-period and at its 21-period EMA
  • Price is near its top Bollinger band
  • RSI is neutral (61.37)
  • Volume is slightly below average

Key levels to the upside:          Key levels to the downside:

1: $1,255                               1: $1,211

2: $1,350                               2: $1,183.85

3: $1,419                               3: $1,060.5

Litecoin

Litecoin continued trading within its range, bound by $142.1 to the downside and $161.5 to the upside. Its price is now also between the 21-hour and the 50-hour EMAs, which have proven to be strong support and resistance levels, especially when paired with low trading volume.

Litecoin is currently mirroring the direction of Bitcoin’s moves, but with much less intensity. This makes it a very unattractive trading pair at the moment.

LTC/USD 1-hour Chart

Litecoin’s technicals on all time-frames are completely bullish and without any signs of neutrality.

LTC/USD 1-day Technicals

Technical factors (1-hour Chart):

  • Its price is slightly above its 50-period EMA and at its 21-period EMA
  • Price at its middle Bollinger band
  • RSI is neutral (53.10)
  • Volume is descending

Key levels to the upside:          Key levels to the downside:

1: $161.5                               1: $142.1

2: $181.3                               2: $128.42

3: $186.3                               3: $114.75

Categories
Cryptocurrencies

Bitcoin: 10 Things I Wish I’d Known Earlier

Bitcoin is a crazy beast! It’s had some huge ups and downs over the past few years for those that are trading it as well as those that are simply holding it. Much like many things in life, we know a lot more now than we did a few years back, and there are things that we know now that we absolutely wished that we knew back then. That is what we are going to be looking at today, 10 things that we wish we had known about Bitcoin all those years ago.

It Will Hit $30,000+

Many people said it, yet a lot of the people that stated that Bitcoin would hit those prices did not put their money where their mouth is. Unfortunately, I was one of those people. I told others that it would go that high, others bought in because of what I said, yet I did not. I simply said it but did not do it. That was a huge mistake, especially as I had some bitcoin from back when they were worth about $10, I also had some when they were worth $6,000. Now that they are worth over $30,000, I have none. So I wish I had taken my own advice and bought in. A really tough lesson, but a good one.

There Are No Bull or Bear Markets (Technically)

This may sound strange, but if you look at bitcoin as a whole, there is only a bullish market with pretty much no bears. The problem is that most people look at the short term, what is happening now, and I have done the same thing. I have seen drops and I have sold, rather than looking at the big picture. When we look at long term trading, then the markets have only moved up, meaning that if we buy at any point in bitcoins history, we would now be making money. Even if we bought at the previous all-time highs, which people said was a stupid thing to do, at the time yes, but overall no. the markets are bullish, and probably will be for years to come.

Don’t Believe Everything You Hear

People say a lot of things. Some may turn out to be true, while others can be completely made up. The crypto and Bitcoin world is full of people saying things. If you believe it all you will be buying and selling every minute. Instead, you need to find sources that give good and accurate information. Easier said than done, but it is possible, do not listen to social media, which is simply full of people shouting about anything they want without any real evidence behind it.

Idiots Make Money Too

We often see things about people selling their homes to buy bitcoin. We all called them an idiot, but now, they are pretty darn rich…but they are still idiots. People risk all sorts of things on hopes and dreams, some work out others don’t. Just because someone made a lot of money with bitcoin does not mean that they aren’t idiots.

Volatility Is Great

A lot of people are scared of volatility and there is a lot of it when it comes to Bitcoin, but it is also the volatility that makes it so profitable. I was a little scared of the volatility, the fact that I could very easily lose my money, but instead I should have been looking at the opportunities that it was presenting me. I should have used that volatility to help increase my accounts and to look at it as a good thing rather than the bad that I did.

Learn From the Mistakes

Mistakes are there as a brilliant learning tool, one that should always be used. Unfortunately, it is not something that I used. Instead, I committed the same mistake multiple times, to the horror of my account balance. Of course, eventually, I did learn from them and no longer make them, but I should have known that I needed to learn straight away. If you make a mistake, be sure that you learn from it and don’t commit the same mistakes over and over.

You Can’t Trade It Like Forex

While it looks very similar and uses the same brokers and charts, the way that you trade bitcoin varies a lot when you compare it to forex trading. Again, this is something that I did not realise straight away. When I began trading it, I traded it with the same strategies and this led to a lot of losses. Bitcoin simply does not follow the same fundamentals or systems that forex trading does, so you need to adapt, and need to create your own strategy that better suits the way that bitcoin moves.

People Control the Markets

Something that I learned a little down the line was that the Bitcoin markets are not entirely their own thing. They can be massively influenced by a number of large traders, they can freeze the price or help to push it up, so when you see huge movements from different wallets. This can give you an idea of what may be about to happen. I never took any notice back then of huge sell-offs or huge buys, but if I had I would have made a lot more and prevented some of the losses that I had.

It’s Easy to Access Bitcoin

A few years back it was not quite as easy to get access to bitcoin, to buy it, or to trade it. However, it wasn’t anywhere near as hard to get than I thought it was. There were many more brokers offering it. I was simply sticking to the major brokers, ones that offered it with pretty high spreads. Instead, I should have been looking for more specialist brokers, the ones that are focusing on cryptocurrencies. There were quite a few of them around and they offered much better trading conditions.

There Is A Lot of Dead Hype

Hype is all around when it comes to cryptocurrencies, especially Bitcoin. Everywhere you look you will see people hyping up the price or what will happen. The problem is that a lot of this hype has come from nothing. There is nothing fueling it. The next big bull run is tomorrow, next week, the month after, there will be hype and rumours about it pretty much all the time. You need to be careful what you listen to and which bits of hype you listen to. Certainly don’t believe everything that you hear.

Those are 10 things that I wish I knew earlier about Bitcoin, some when I look back are pretty obvious and I should have known, but we often get caught up in the moment and I certainly did. There are probably other things that I should have known or done, but that is the past, it is now time to look to the future and what can be achieved from here, using what I have learned.


Categories
Crypto Videos

Bitcoin Price Dump Shakes Investors!

Bitcoin price dump! was the writing on the wall?

Thank you for joining this Forex Academy educational video.

In this session, we will be looking at the recent bitcoin US dollar price dump and what might have been the possible contributing factors.

In this daily chart of bitcoin to the US dollar, we can see a steady bull run, as highlighted in section A, with a critical area of support on the $10 k line, which lends itself nicely for a price action move up to the resistance line, which was breached in section B, which coincides with the all-time high of around $19.5K from 2017, and where eventually price reaches the key $20K figure, and from there on over the Christmas period and into the new year, we see exponential growth, where bitcoin skyrockets to $42k.
With market analysts and investors talking up the value of bitcoin from anywhere in the region of $30 to 40K and even 140k, it’s hardly surprising that euphoria crept in and where everybody was buying, especially in the CFDs market.
This was a gold rush in all but name. And one has to ask oneself a question; when assets are being talked up by investors, or even talked down, what are the real motives behind this? Are they simply looking for a market reaction in favour of their own investment strategy, for example? This is a question for another day.
Getting back to the issue, was the writing on the wall all for a price collapse? Yes, it was, and for a number of reasons:
Firstly, when a market is moving steadily as in a trend, it is less likely to see extreme volatility unless there are fundamental reasons behind it. And because bitcoin is essentially a speculative instrument, fundamentals can be set aside in favour of a trending market.

The problem with this, as highlighted here, is that this is unchartered territory. We are looking at a $20,000 price increase in just a few days, which is almost unheard of. Technical analysis becomes difficult to gauge, and professional traders don’t know where to get in on the trend or place stops. Many are forced into buying for fear of missing out, and this is extremely dangerous.

Certainly, the writing was on the wall when on the 4th of January, we see a $6K price range move on this bearish daily candlestick. However, volatility continued with the bulls regaining control taking bitcoin to a record high of around $42,000.
Professional traders will know from history that a correction was on the cards, and with the UK FCA warning retail traders about the potential of losing all of their money trading bitcoin assets, it very likely contributed to price action hitting a brick wall all and to the collapsed….

Of around $12K in 24 hours. Many investors and retail traders were still buying well above $40,000, while the price was tanking, causing billions of dollars to be wiped off of the price, and where billions were lost in margin calls, with accounts being liquidated, because of the massive move lower.
Bitcoin should have a health warning on it, buyer beware, and with more and more weekend traders getting involved in this market, which operates 7 days a week, and where these part-time traders in there are spare rooms have a punt, with many losing their cash deposits, it is not a surprise that the FCA have banned retail traders from trading cryptocurrencies in the UK from the 6th of January this year, and where the EU are now calling for tighter regulation in this space.
Weekend bitcoin traders will be licking their wounds. But let’s not forget that a lot of people are still in the money and sitting back waiting to see if the price steadies itself and then continues to move higher, or if it will continue to slide.
Advice on this one would be too to look at trends on lower time frames…..

Such as this one-hour chart, while looking for support and resistance lines, and pick out trends that are set by big money investors, such as institutional traders, where they typically operate Monday to Friday. Be ultra-cautious when going long during aggressive rallies and around huge candlesticks, especially the bearish ones, as highlighted, which represents an overall move of $4000 dollars. They spell out danger. And set tight stop losses.

Categories
Crypto Daily Topic Crypto Videos

Pension Funds Are Investing In Bitcoin!


“Pension Funds are Investing in Bitcoin” – Grayscale


Grayscale’s newly-appointed CEO, Michael Sonnenshein, told Bloomberg that pension funds and endowments are actively investing in the Grayscale family of funds. Sonnenshein’s interview with Bloomberg came on Jan 7.

He further explained the statement: “We have started to see participation not just from the hedge funds, which we’ve seen participation from for a long time now, but now it’s recently coming from other institutions, pensions, and endowments. The sizes of allocations that they are making are also growing rapidly.”

Grayscale has been at the forefront of the recent Bitcoin buying spree, and its holdings now account for roughly 3% of the circulating Bitcoin. The fund manager continues to increase its position by buying even more cryptocurrencies as more institutional investors seek exposure to Bitcoin and other digital assets. 

Grayscale’s total assets under management, or AUM for short, have eclipsed $27 billion across ten different investment products. The Grayscale Bitcoin Trust remains its most popular product by far, with over $23 billion in AUM. Its Ethereum trust is the second most popular product, and it is currently valued at around $3.7 billion, while its Digital Large Cap Fund holds somewhere in the ballpark of $340 million.

Pension funds are starting to follow a hoard of institutional buyers that started to enter the Bitcoin and crypto market in 2020. A survey conducted by Fidelity Investments in late 2020 found that 36% of financial institutions across both the United States and Europe said they own cryptocurrencies or derivatives. Over 25% of the respondents reported holding Bitcoin, while 11% said they own Ether.

According to Grayscale Investments, the institutional interest for cryptocurrency and Bitcoin is intensifying at an alarming rate, with pension funds and endowments being the most recent entrants into the space.

The company’s aggressive Bitcoin buying is likely contributing to the digital currency’s rapid price increase. With more Bitcoin taken out of circulation and miners not being able to produce as much Bitcoin as it is requested, the already scarce asset is becoming even more difficult to get at current prices. Sonnenshein stated:

“This is a verifiable scarce asset, so when there are mechanisms that are removing Bitcoin from circulation, that’s inherently making it an even more scarce asset.”

Categories
Crypto Market Analysis

Daily Crypto Review, Jan 14 – Bitcoin Records Double-Digit Gains as it Passes $38K; Crypto Market in the Green

The crypto sector ended up almost completely in the green as Bitcoin recorded double-digit gains and pulled the rest of the market up. Bitcoin is currently trading for $38,222, representing an increase of 11.05% compared to yesterday’s value. Meanwhile, Ethereum’s price has increased by 9.00% on the day, while LTC gained 6.48% of its value.

Daily Crypto Sector Heat Map

Simbcoin gained 366.72% in the past 24 hours, making it the most prominent daily crypto gainer by far. It is followed by Penta’s 229.88% and DEX’s 187.13% gain. On the other hand, Daiquilibrium lost 88.91%, making it the most prominent daily loser. It is followed by Dynamic Supply Tracker’s loss of 80.15% and Dynamic Supply’s loss of 63.83%.

Top 10 24-hour Performers (Click to enlarge)

Bottom 10 24-hour Performers (Click to enlarge)

Bitcoin’s market dominance has moved up slightly since our last report, with its value currently being 69%. This value represents a 0.4% difference to the upside when compared to the previously reported value.

Daily Crypto Market Cap Chart

The cryptocurrency sector’s market capitalization has made significant gains since we last reported, with its current value being $1.032 trillion. This represents an $88.3 billion increase when compared to our previous report.

_______________________________________________________________________

What happened in the past 24 hours?

_______________________________________________________________________

_______________________________________________________________________

Technical analysis

_______________________________________________________________________

Bitcoin

Bitcoin had started changing its price direction on Jan 13, when it started to slowly push towards the upside. The largest cryptocurrency by market cap managed to pass the $36,640 level and reach as high as $38,789 before pulling back slightly. This steady price increase was followed by average (or even slightly descending) volume.

The pullback BTC went into after hitting the recent high was quickly stopped by the 21-hour and 50-hour EMAs, changing the overall stance from an expected downturn to uncertainty.

BTC/USD 1-hour chart

Bitcoin’s technicals on the 4-hour, daily and monthly time-frame are overall bullish, with oscillators pointing to the sell-side. On the other hand, its weekly overview is completely bullish.

BTC/USD 1-day Technicals

Technical factors (1-hour Chart):

  • Price is above both its 50-period EMA and its 21-period EMA
  • Price is between its middle and top Bollinger band
  • RSI is neutral (62.38)
  • Volume is average

Key levels to the upside:          Key levels to the downside:

1: $40,000                             1: $36,640

2: $42,000                             2: $33,200

3: $43,600                             3: $30,640

Ethereum

Ethereum’s period of heavy correlation with Bitcoin has continued as its price slowly gained momentum towards the upside. Ether managed to push its price to the $1,183.85 level but couldn’t quite break it. This caused a minor pullback, which ended very quickly.

Ethereum’s 21-hour and 50-hour EMAs play a significant role in determining its price direction and should be considered by the traders at all times. On top of that, any ETH trader should pay attention to BTC’s movements, as those ultimately determine the price direction of most cryptocurrencies.

ETH/USD 1-hour Chart

Ethereum’s technicals on the daily and weekly time-frame are currently completely bullish, while its 4-hour and monthly overviews show some signs of neutrality.

ETH/USD 1-day Technicals

Technical Factors (1-hour Chart):

  • Price is above both its 50-period and its 21-period EMA
  • Price is near its top Bollinger band
  • RSI is neutral (64.19)
  • Volume is slightly below average

Key levels to the upside:          Key levels to the downside:

1: $1,183.85                          1: $1,060.5

2: $1,211                               2: $1,047.5

3: $1,226.5                            3: $992

Litecoin

While Litecoin did follow Bitcoin’s price direction, it did so with much less conviction and intensity. Its price managed to pass the $142.1 level to the upside and establish its price above it but failed to move into the upper half of the trading range bound by $142.1 to the downside and $161.5 to the upside.

Litecoin currently has a very nicely-built support zone, while its upside is quite open. If Bitcoin’s price remains the same, traders can expect LTC to try to push towards or even contest the $161.5 level.

LTC/USD 1-hour Chart

Litecoin’s technicals on the shorter time-frames (4-hour, daily, and weekly) show overall tilt to the buy-side with hints of neutrality. Its monthly time-frame, however, is completely bullish.

LTC/USD 1-day Technicals

Technical factors (1-hour Chart):

  • Its price is slightly above its 50-period EMA and its 21-period EMA
  • Price slightly above its middle Bollinger band
  • RSI is neutral (57.08)
  • Volume is descending

Key levels to the upside:          Key levels to the downside:

1: $161.5                               1: $142.1

2: $181.3                               2: $128.42

3: $186.3                               3: $114.75

Categories
Crypto Videos

Crypto User Recovers Lost Private Keys to Over $4M in Bitcoin! $$$


Crypto User Recovers Lost Private Keys to Over $4M in Bitcoin

A student has claimed to have found their long-lost private keys that accidentally HODLed Bitcoin starting as early as 2011. By finding the keys, he will be able to unlock more than $4 million in Bitcoin.

According to a Reddit throwaway account from BitcoinHolderThankU, they were able to cash out roughly $4.2 million in Bitcoin after finding the lost keys to 127 BTC on Dec 22, 2020. At that time, the price of the crypto asset was in the $23,000s. The user stated that they later liquidated the coins somewhere in the bull run.

“I spent the next week just trying to figure out how to safely and securely liquidate such a large Bitcoin position for the lowest price possible,” stated the Redditor. “I went back and forth between different OTC principal desks and ultimately ended up selling every single one of my 127 Bitcoin for a price of $33,439.02 per coin. The net was roughly $4.24 million.”

They claim to have earned the aforementioned Bitcoin in 2011 or 2012 through various “surveys, watching videos, as well as completing random tasks” to ultimately use the Bitcoin for purchasing in-game currency for the online game DarkOrbit. The lost private keys were reportedly never really missing, but rather forgotten on an older model Dell computer.

Unfortunately, if the Redditor’s story is true, they missed out on $1 million in additional profit by not just holding for a few more weeks. Since December 2020, the price of Bitcoin has experienced a lot of volatility and even hit $42,000 to reach new all-time highs. BitcoinHolderThankU stated that they “would not have sold all 127 Bitcoin” if the same situation presented again.

“To give myself credit, I did hold it for 8-9 years, which is more than the vast majority of cryptocurrency users,” they said. “I definitely would’ve done things a bit differently if I were given a second chance.”

Despite their sudden fortune, they said that they would avoid “expensive luxuries,” as well as that they intend to put the bulk of the funds into the S&P 500 index, adding:

“I don’t want to end up like one of those people who happen to win the lottery and then blow it all in a matter of months or years. I’m going to continue living my life the same way I was living it on Dec 21 and every day before that.”

Categories
Crypto Videos

Morgan Stanley Bought 10% Stake in Michael Saylor’s MicroStrategy!


Morgan Stanley Bought 10% Stake in Michael Saylor’s MicroStrategy

MicroStrategy has been in the crypto news for months now – this time regarding a major player joining in on their venture to become a major Bitcoin HODLer. Per a filing with the US Securities and Exchange Commission released on Jan 8, an investment bank mogul Morgan Stanley had acquired 792,627 shares in the business intelligence firm MicroStrategy. This massive investment represents a 10.9% stake in the company that has recently made astonishing investments in Bitcoin. 

While the purchase itself mostly likely happened on Dec 31, the news was released to the public nine days after that. The Morgan Stanley investment into MicroStrategy came after Michael Saylor’s company performing incredibly and its shares moving from $289 on Dec 8 to a whopping $545 as of Jan 8.

In August 2020, MicroStrategy took some very bold steps by investing crypto, making Bitcoin its primary reserve asset. At the time of investing, CEO Michael Saylor talked about why his company decided to invest so much into Bitcoin:

“This is not a speculation, nor just a hedge. It is a deliberate strategy to adopt the Bitcoin Standard.”

Just a couple of weeks ago, MicroStrategy announced a whopping $400 million securities offering, stating that the purpose of raising funds is to buy even more Bitcoin. As of Dec 21, 2020, the firm had managed to stockpile 70,470 Bitcoin. 

At current prices, MicroStrategy’s Bitcoin holdings came up to a worth of over $2.8 billion. 


Institutional investors such as Morgan Stanley have warmed up to cryptocurrencies considerably over the past year. Many analysts have attributed Bitcoin’s recent bull market to this institutional uptick, compared to the FOMO coming almost strictly from the retail market that was so critical to Bitcoin’s 2017 highs, which subsequently fell apart. 


Categories
Crypto Market Analysis

Daily Crypto Review, Jan 13 – Polkadot Outperforms the Market as it Heads Towards $10; Crypto Sector in the Red

The crypto sector ended up mostly trading in the red as cryptocurrencies such as Ether, Litcoin, and Bitcoin Cash dropped over 5% on the day. Polkadot was one of the few cryptocurrencies that managed to score double-digit gains and outperform the market by a large margin. However, this is purely due to fundamental reasons (immense support coming from the Binance exchange) rather than technicals.

Bitcoin is currently trading for $34,223, representing a decrease of 3.03% compared to yesterday’s value. Meanwhile, Ethereum’s price has decreased by 4.09% on the day, while LTC lost 3.07% of its value.

Daily Crypto Sector Heat Map

Metacoin gained 103.61% in the past 24 hours, making it the most prominent daily crypto gainer by far. It is followed by OVR’s 98.72% and Latamcash’s 92.88% gain. On the other hand, Amun Bitcoin 3x Daily Short lost 75.44%, making it the most prominent daily loser. It is followed by Zugacoin’s loss of 73.82% and KIMCHI.finance’s loss of 66.82%.

Top 10 24-hour Performers (Click to enlarge)

Bottom 10 24-hour Performers (Click to enlarge)

Bitcoin’s market dominance has moved down very slightly since our last report, with its value currently being 68.6%. This value represents a 0.1% difference to the downside than the value it had when we last reported.

Daily Crypto Market Cap Chart

The cryptocurrency sector’s capitalization has decreased since we last reported, with its current value being $948.23 trillion. This represents a $17.92 billion decrease when compared to our previous report.

_______________________________________________________________________

What happened in the past 24 hours?

_______________________________________________________________________

_______________________________________________________________________

Technical analysis

_______________________________________________________________________

Bitcoin

Bitcoin spent the day hovering between the $33,320 support level and the $36,640 resistance level, with its price mostly being in the bottom part of the range. The price even breached the support level and went past it on several occasions, but it always returned back up. While it currently seems stable and on decreasing volume, Bitcoin might experience a stronger pullback and an attempt to retest $30,000 once again.

BTC/USD 1-hour chart

Bitcoin’s technicals on the daily and monthly time-frame bullish, but contain some neutrality alongside the bullishness. However, its weekly overview is completely bullish, while its 4-hour chart is completely bearish.

BTC/USD 1-day Technicals

Technical factors (1-hour Chart):

  • Price is between its 50-period EMA and its 21-period EMA
  • Price is near its middle Bollinger band
  • RSI is neutral (50.24)
  • Volume is descending

Key levels to the upside:          Key levels to the downside:

1: $36,640                             1: $33,200

2: $40,000                             2: $30,640

3: $42,000                             3: $27,960

Ethereum

Ethereum has traded almost exactly like Bitcoin in the past 24 hours, both in terms of price direction and intensity. The second-largest cryptocurrency by market cap is currently in an extremely narrow and unsustainable range, bound by the Fib retracement level of $1,060 to the upside and a 2017 Fib retracement sitting at $1,047.

Ethereum’s 21-hour and 50-hour moving averages play a significant role in determining price direction and should be considered by the traders at all times.

ETH/USD 1-hour Chart

Ethereum’s technicals on the daily and monthly time-frame bullish, but contain some neutrality alongside the bullishness. However, its weekly overview is completely bullish, while its 4-hour chart is completely bearish.

ETH/USD 1-day Technicals

Technical Factors (1-hour Chart):

  • Price is between its 50-period and its 21-period EMA
  • Price is at its middle Bollinger band
  • RSI is neutral (48.60)
  • Volume is descending

Key levels to the upside:          Key levels to the downside:

1: $1,129                               1: $1,060.5

2: $1,211                               2: $1,047.5

3: $1,226.5                             3: $992

Litecoin

Litecoin has been pretty stable in the past 24 hours, with its price trading within a range bound by $128.4 to the downside and $142.1 to the upside. These support/resistance levels, alongside the 21-hour and 50-hour EMAs, will determine Litecoin’s future price intensity, while Bitcoin’s next move will most likely determine its price direction.

LTC/USD 1-hour Chart

Litecoin’s technicals on the daily and monthly time-frame are completely bullish. However, its weekly overview shows slightly less bullishness, while its 4-hour chart is almost completely bearish.

LTC/USD 1-day Technicals

Technical factors (1-hour Chart):

  • Its price is between its 50-period EMA and its 21-period EMA
  • Price slightly below its middle Bollinger band
  • RSI is neutral (51.37)
  • Volume is descending

Key levels to the upside:          Key levels to the downside:

1: $142.1                               1: $128.42

2: $161.5                               2: $114.75

3: $181.3                               3: $98

Categories
Crypto Market Analysis

Daily Crypto Review, Jan 12 – XLM Back in the top10 Cryptos by Market Cap; Crypto Sector in the Green

The crypto sector has experienced a rally that brought the market to its feed after yesterday’s dip. One of the best daily performers was Stellar Lumens (XLM), which shot up in the past week on great fundamentals (and once again today), gaining over 30% just a couple of hours, reentering the top10 cryptocurrencies by market cap.

Bitcoin is currently trading for $35,887, representing an increase of 1.28% compared to yesterday’s value. Meanwhile, Ethereum’s price has increased by 1.89% on the day, while LTC lost 1.85% of its value.

Daily Crypto Sector Heat Map

Amun Bitcoin 3x Daily Short gained 1186.87% in the past 24 hours, making it the most prominent daily crypto gainer by far. It is followed by PengolinCoin’s 366.58% and Firdaos’s 330.42% gain. On the other hand, Zugacoin lost 94.92%, making it the most prominent daily loser. It is followed by the True Segniorage Dollar’s loss of 85.08% and Zero Collateral Dai’s loss of 62.33%.

Top 10 24-hour Performers (Click to enlarge)

Bottom 10 24-hour Performers (Click to enlarge)

Bitcoin’s market dominance has moved up very slightly since our last report, with its value currently being 68.7%. This value represents a 0.1% difference to the upside than the value it had when we last reported.

Daily Crypto Market Cap Chart

The cryptocurrency sector’s capitalization has increased since we last reported, with its current value being $964.21 trillion. This represents a $58.14 billion increase when compared to our previous report.

_______________________________________________________________________

What happened in the past 24 hours?

_______________________________________________________________________

_______________________________________________________________________

Technical analysis

_______________________________________________________________________

Bitcoin

Bitcoin managed to stop its descending move and push up slightly after pulling back to the $30,000 mark. The largest cryptocurrency by market cap has (on decreasing volume) seen a price increase to just below the $36,640 level. Many speculate that, while the drop was considered very healthy overall, the institutions bought even more BTC, which brought its price up without affecting the volume as much.

However, BTC/USD doesn’t seem like it currently has the strength to pass the $36,640 level, which may cause another downturn.

BTC/USD 1-hour chart

Bitcoin’s technicals on the daily and weekly time-frame are completely bullish. However, its monthly overview shows slightly less bullishness, while its 4-hour chart is completely bearish.

BTC/USD 1-day Technicals

Technical factors (1-hour Chart):

  • Price is between its 50-period EMA and its 21-period EMA
  • Price is near its middle Bollinger band
  • RSI is neutral (54.63)
  • Volume is descending to average

Key levels to the upside:          Key levels to the downside:

1: $36,640                             1: $33,200

2: $40,000                             2: $30,640

3: $42,000                             3: $27,960

Ethereum

Ethereum has once again matched Bitcoin in direction after hitting the $907 support level, and changed its price direction by pushing to the upside. The second-largest cryptocurrency by market cap is back at its peak from yesterday and seems like it cannot pass $1,129 with conviction at the moment.

Ethereum’s 21-hour and 50-hour moving averages play a major role and should be taken into account when looking for support or resistance levels.

ETH/USD 1-hour Chart

Ethereum’s technicals on the daily and weekly time-frame are completely bullish. However, its monthly overview shows slightly less bullishness, while its 4-hour chart is completely bearish.

ETH/USD 1-day Technicals

Technical Factors (1-hour Chart):

  • Price is between its 50-period and its 21-period EMA
  • Price is between its middle and top Bollinger band
  • RSI is neutral (53.69)
  • Volume is descending to average

Key levels to the upside:          Key levels to the downside:

1: $1,129                               1: $1,060.5

2: $1,211                               2: $1,047.5

3: $1,226.5                             3: $992

Litecoin

Even though Litecoin did follow Bitcoin’s price direction, it did so with less intensity, causing it to ultimately be in the red for the day. Its price is now at a major crossroads, as it is fighting for the $142.1 level. This pivot point will decide whether the price will immediately push towards the upside or downside.

Litecoin has created a strong resistance level near the $150 mark, and traders should pay great attention to it when trading.


LTC/USD 1-hour Chart

Litecoin’s technicals on the daily and monthly time-frame are completely bullish. However, its weekly overview shows slightly less bullishness, while its 4-hour chart is completely bearish.

LTC/USD 1-day Technicals

Technical factors (1-hour Chart):

  • Its price is between its 50-period EMA and its 21-period EMA
  • Price between its middle and bottom Bollinger band
  • RSI is neutral (50.33)
  • Volume is descending to average levels

Key levels to the upside:          Key levels to the downside:

1: $161.5                               1: $142.1

2: $181.3                               2: $128.42

3: $186.3                               3: $114.75

Categories
Crypto Market Analysis

Daily Crypto Review, Jan 11 – Crypto Sector Plummets as BTC Drops to $32k

The crypto sector experienced dipped over $100 billion in market cap as Bitcoin, and the rest of the market plummeted. Bitcoin is currently trading for $35,165, representing a decrease of 13.31% compared to yesterday’s value. Meanwhile, Ethereum’s price has dropped up to 20.64% on the day, while LTC lost 23.04% of its value.

Daily Crypto Sector Heat Map

Foglory Coin gained 589.61% in the past 24 hours, making it the most prominent daily crypto gainer by far. It is followed by NewsToken’s 175.33% and BELIEVER’s 166.3% gain. On the other hand, True Seigniorage Dollar lost 78.35%, making it the most prominent daily loser. It is followed by the 3x Long Bitcoin SV Token’s loss of 76.74% and 3x long EOS Token’s loss of 69.18%.

Top 10 24-hour Performers (Click to enlarge)

Bottom 10 24-hour Performers (Click to enlarge)

Bitcoin’s market dominance has moved down over a percent since our last report, with its value currently being 68.6%. This value represents a 1.2% difference to the upside than the value it had when we last reported.

Daily Crypto Market Cap Chart

The cryptocurrency sector capitalization has decreased slightly since we last reported, with its current value being $906.07 1,03 trillion. This represents a $2 billion decrease when compared to our previous report.

_______________________________________________________________________

What happened in the past 24 hours?

_______________________________________________________________________

_______________________________________________________________________

Technical analysis

_______________________________________________________________________

Bitcoin

Bitcoin has had an interesting weekend, with its price plummeting in recent hours. Its price dipped to the lows of $32,330 just a few hours ago as major buy positions got liquidated. The largest cryptocurrency by market cap slowly fell below the 21 and 50 moving averages, confirmed its position below then, and then headed straight to the downside with almost no pushback.

However, bulls picked up the pace and are currently fighting for the $35,000 level. Investors used this as a buying/accumulation opportunity, while most traders got liquidated (both short and long positions due to the sudden volatility).

BTC/USD 1-hour chart

Bitcoin’s technicals on the daily, weekly, and monthly time-frame show a tilt towards the buy-side with no or slight signs of neutrality, while its 4-hour overview shows a slight tilt towards the sell-side.

BTC/USD 1-day Technicals

Technical factors (1-hour Chart):

  • Price is below both its 50-period EMA and its 21-period EMA
  • Price is near its bottom Bollinger band
  • RSI is near the oversold territory (37.28)
  • Volume is above average

Key levels to the upside:          Key levels to the downside:

1: $36,640                             1: $33,200

2: $40,000                             2: $30,640

3: $42,000                             3: $27,960

Ethereum

Ethereum matched Bitcoin in direction, but did so with increased intensity. The second-largest cryptocurrency by market cap dipped over 20% on the day as its price fell to just above $1,000. This level seems to have held quite nicely, creating space for Ether to recover.

Ethereum is now trading above the $1,060.5 support level and shows no signs of falling again. However, Bitcoin’s movement will greatly affect the future price direction of ETH.


ETH/USD 1-hour Chart

Ethereum’s technicals on the daily, weekly, and monthly time-frame show a tilt towards the buy-side with no or slight signs of neutrality, while its 4-hour overview shows a slight tilt towards the sell-side.

ETH/USD 1-day Technicals

Technical Factors (1-hour Chart):

  • Price is below both its 50-period and its 21-period EMA
  • Price is near its bottom Bollinger band
  • RSI is near the oversold (31.12)
  • Volume is significantly above-average

Key levels to the upside:          Key levels to the downside:

1: $1,129                               1: $1,060.5

2: $1,211                               2: $1,047.5

3: $1,226.5                             3: $992

Litecoin

Litecoin was one of the major gainers today as well, with its price dropping from $172 all the way down to $124. While bulls did pick up the pace and returned its price to the ~$140 zone, Litecoin is still fighting to maintain its position and tackle the $142.1 level.

Litecoin seemingly got hit the hardest out of the three cryptocurrencies, with its price position still being fairly uncertain. This could prove to be a trading opportunity as the cryptocurrency might make a move independent of Bitcoin’s move in the short future (if Bitcoin itself doesn’t move first).


LTC/USD 1-hour Chart

Litecoin’s technicals on the daily, weekly, and monthly time-frame show a tilt towards the buy-side with slight signs of neutrality, while its 4-hour overview shows a strong tilt towards the sell-side.

LTC/USD 1-day Technicals

Technical factors (1-hour Chart):

  • Its price is currently below both its 50-period EMA and its 21-period EMA
  • Price near its bottom Bollinger band
  • RSI is in the oversold territory (29.68)
  • Volume is on above-average levels

Key levels to the upside:          Key levels to the downside:

1: $161.5                               1: $142.1

2: $181.3                               2: $128.42

3: $186.3                               3: $114.75

Categories
Cryptocurrencies

5 Ways Investors Lost Cryptos in 2020

Without a doubt, 2020 is the year that the crypto community experienced significant growth. Cryptocurrencies regained much of their lost value and reached new heights, thanks to their growing adoption. 

The crypto industry continues to grow, and investors are laughing all the way to the bank. Along with all this good, there were a host of crypto scams that left investors with a bad taste in their mouths. But how did these crypto scams occur? 

Cryptocurrency losses due to hacks on the DeFi platforms, theft, and fraud amounted to $1.8 billion within the first ten months of 2020, up from $4.52 billion in the entire previous year. The 2019 DeFi volume figure was negligible, but it now appears the DeFi platforms are lucrative for bitcoin thieves. With up to $98 million in losses, DeFi hacks made up 21% of the total crypto fraud in 2020, which is quite significant. But why so many crypto scams?

The USD value in DeFi cryptos and other cryptocurrencies has grown exponentially, attracting the attention of scammers, money launderers, and DeFi protocol hackers. Everyone, including those that don’t want to put in the hard work, wants a piece of the Bitcoin profits.

Scammers use different methods to get a piece of the crypto cake, but according to a report by CipherTrace, Ponzi schemes and investment scams are two of the main ways that investors lost cryptos in 2020. 

Let’s have a detailed look at how crypto investors made losses in 2020, shall we?

1. Ponzi Schemes 

Ponzi schemes have emerged as one of the favorite vehicles for crypto frauds, and it seems they are not going anywhere. Usually, the schemes promise investors quick significant returns with little or no risk. 

The first few returns are made from recruits’ funds, serving as bait for more investment into the scheme. Most of the time, there is little or no business development in the background to support the pyramid of promised returns. Eventually, the schemes come tumbling down, and founders vanish into thin air with the investors’ money. 

The classic crypto giveaway scam moved to YouTube from Twitter in 2020. In one instance, a hacker hijacked tens of YouTube accounts to broadcast a crypto giveaway falsely promising to double your earnings within a short period. The Ponzi scheme was broadcast live on YouTube, posing as a message from Bill Gates, the Microsoft CEO. 

2. Exchange Hacks 

Centralized exchanges provide a platform for the buying and selling of cryptocurrency. They act as middlemen, with various currencies for trading in a partially regulated environment, and are a favorite of newcomers in the bitcoin industry.

Unfortunately, centralized bitcoin exchanges come with a variety of risks. For starters, the funds deposited are entirely on the platform owners’ hands, which is somewhat risky.

In September 2020, hackers made away with a large haul of cryptocurrency worth $275 million from KuCoin, a popular platform, becoming one of the largest hacks. The cybercriminals used various methods such as diversifying into multiple currencies and mixers to avoid leaving a trail. 

But the decentralized exchanges were not spared either.

Another high-profile bitcoin theft in 2020 involved the Cryptocurrency exchange Bisq where virtual currency worth $250,000 was lost. The hackers used a vulnerability introduced after a recent update to the network, allowing them to manipulate fallback addresses and send the funds to the wallets they controlled. 

Earlier in the year, IOTA Foundation had to temporarily suspend operations following a cyberattack targeting the IOTA wallet app. The organization took steps to freeze the entire system within 25 minutes of reports that cryptos were being stolen from users’ wallets. 

3. Social Media Crypto Scams

The #cryptocurrency tag on Twitter hosts who-is-who in the crypto industry, including tech engineers, investors, and programmers. But the social media platform is one of the several ways that crypto thieves used to scam people out of their hard-earned cash. 

Hackers took control of the social media giant back-end referred to as the “God Mode” by hacking Twitter employees to access high-value accounts. 

On July 15th, the verified accounts of famous personalities such as former President Barack Obama, Elon Musk, Bill Gates, and Kanye West were hacked and used in a fake crypto giveaway. The hackers promised $2000 worth of cryptocurrency for just $1000, hauling over $121k of stolen bitcoins in the process. 

4. Sim Swapping 

SIM swapping is a relatively new crypto scamming method which is also gaining a foothold. Scammers convince the mobile service provider to move a number to a new SIM card in a device they control to perpetrate crypto scams. 

The method has become too familiar, especially in the cryptocurrency and Bitcoin industry. Usually, the hackers hope to access the victims’ cryptocurrency wallet through SMS sent to their phone for two-factor authentication. 

If successful, scammers access your phone, cryptocurrency exchanges, bank accounts, and other sensitive personal information to wipe your crypto wallet dry. Recently, Harvard University Ph.D. students and professors highlighted the increased risk of SIM swaps in 2020 in a research paper. Incidentally, one of the authors fell victim to a SIM swap.

In one unfortunate incident, a man lost $24 million through SIM swapping as a part of the coordinated attack. It has emerged that the 2020 twitter hacker was part of the SIM swap syndicate. 

5. Trickery by the Phishing Websites and ICOs

2020 has had more than its fair share of phishing scams, and especially in the crypto industry. The main route is often through email, where the scammers guide people to particular websites to steal their credentials, which they use to access their wallets.

Just recently, scammers successfully tricked an astounding number of people into visiting a replicated version of the popular cryptocurrency Ripple (XRP) ledger to steal more than $280k

Meanwhile, fake ICOs or the initial coin offering occur frequently and are a significant risk for bitcoin investors. Like an initial public offering, the initial coin offering’s main objective is to raise funds for the startup. But how do fake ICOs work?

Usually, fraudsters hype the project with fake ICO details to convince the investors. They use their website to promise heaven and earth to the users and then instruct them to make deposits in provided wallets. Sometime after the deposit, it becomes more apparent to the Investor that they were scammed. 

One good example is Big Coin, which used a variety of masked campaigns. They hyped their fake cryptocurrency’s capabilities and technical progression to convince investors and steal $6 million. 

Conclusion 

With cryptocurrency, due diligence is of utmost importance before dipping headfirst into the industry. Bitcoin tends to attract attention, especially when transitioning into the bull market. Everybody wants a piece of it, and less experienced investors fail to spot the red flags, losing money in the process.

It is still a crypto jungle out there, with scammers and thieves using old tricks in the book such as Ponzi schemes, hacking, and phishing, as well as inventing new ways to shake you off of your hard-earned money. But if there’s anything that 2020 has taught us is that the internet space can be very profitable, but at the same time, very risky. Analysts are in consensus that only education can help reduce the risks of crypto scams. Take extra care when investing and accessing your cryptocurrency wallets, and the whole experience will be worth it. 

Categories
Crypto Market Analysis

Daily Crypto Review, Jan 8 – Bitcoin Continues Its Rise as it Breaks the $40k Mark Briefly

The crypto sector pushed even higher as Bitcoin passed the $40,000 mark and created a new all-time high. Bitcoin is currently trading for $39,094, representing an increase of 5.35% compared to yesterday’s value. Meanwhile, Ethereum’s price has decreased by 1% on the day, while XRP gained 23.53% of its value.

Daily Crypto Sector Heat Map

COVER Protocol gained 2124.46% in the past 24 hours, making it the most prominent daily crypto gainer by far. It is followed by KIMCHI.finance’s 1159.97% and TAI’s 265.52% gain. On the other hand, Stand Share lost 74.11%, making it the most prominent daily loser. It is followed by the Receive Access Ecosystem’s loss of 61.71% and CY Finance’s loss of 56.34%.

Top 10 24-hour Performers (Click to enlarge)

Bottom 10 24-hour Performers (Click to enlarge)

Bitcoin’s market dominance has moved up half a percent since our last report, with its value currently being 69.8%. This value represents a 0.5% difference to the upside than the value it had when we last reported.

Daily Crypto Market Cap Chart

The cryptocurrency sector capitalization has decreased slightly since we last reported, with its current value being $1,03 trillion. This represents a $2 billion decrease when compared to our previous report.

_______________________________________________________________________

What happened in the past 24 hours?

_______________________________________________________________________

_______________________________________________________________________

Technical analysis

_______________________________________________________________________

Bitcoin

Bitcoin has continued moving up, with its price surpassing the $38,000 and $39,000 mark without much problem. The largest cryptocurrency by market cap reached as high as $40,402.5 level before crashing down as bulls could not sustain the price. The price instantly dipped to $36,388 but quickly recovered to the $39,000 area, where it is consolidating at the moment.

Bitcoin has positioned itself for another push towards the upside as it quickly found support in the 50-hour moving average, proving that it doesn’t even need to dip to the horizontal support levels to stabilize itself.


BTC/USD 4-hour chart

Bitcoin’s technicals on the 4-hour, daily, and weekly chart show a tilt towards the buy-side with no signs of neutrality or bearishness. On the other hand, its monthly overview shows slight bearishness in the oscillator sector opposing the overall bullishness.

BTC/USD 1-day Technicals

Technical factors (4-hour Chart):

  • Price is above both its 50-period EMA and its 21-period EMA
  • Price is between its middle and top Bollinger band
  • RSI is in the overbought territory (70.36)
  • Volume is above average

Key levels to the upside:          Key levels to the downside:

1: $40,402                             1: $38,140

2: $43,000                             2: $36,740

3: $46,500                             3: $35,610

Ethereum

Ethereum followed Bitcoin to the upside, pushing its price above its previous resistance levels and up to as high as $1292. Just like Bitcoin, Ethereum instantly dipped to $1,140 but quickly recovered. However, this is where the high correlation with Bitcoin ends, as Ethereum didn’t recover its recent highs but rather lost quite a bit of its value.

While it has recovered since the price dip, Ethereum is now right below the $1,211 resistance level. The cryptocurrency has a high possibility of passing it even if Bitcoin remains stagnant. Still, any moves that would contest the next resistance level would have to be backed by the largest cryptocurrency by market cap.


ETH/USD 1-hour Chart

Ethereum’s technicals on the daily time-frame show an overall bullish tilt with no hints of neutrality. On the other hand, the monthly, weekly, and 4-hour time-frames show some signs of neutrality or even bearishness.

ETH/USD 1-day Technicals

Technical Factors (4-hour Chart):

  • Price is above its 50-period and at its 21-period EMA
  • Price is near its middle Bollinger band
  • RSI has left the overbought area (63.27)
  • Volume is significantly above-average

Key levels to the upside:          Key levels to the downside:

1: $1,292                               1: $1,211

2: $1,420                               2: $1,180

3: $1,500                               3: $1,092

Litecoin

Litecoin followed the market as well, pushing its price further up and breaking its previous resistance level of $174.5. However, while LTC did manage to break this level and post a new high of $181.25 for a moment, the price was unsustainable, resulting in a classic price drop, followed by a failed attempt of recovering (the moment when LTC hit the $174.5 level after dropping below it) acting as a confirmation of a price drop, and then a full-on retracement towards the downside.

Litecoin has bounced off of the $152.25 level beautifully and is now attempting to pass the 50-hour and 21-hour moving averages and continue its move up.


LTC/USD 1-hour Chart

Litecoin’s technicals on the 4-hour, daily, and weekly time-frame are bullish but show some neutrality or even bearishness. On the other hand, its monthly overview is completely bullish.

LTC/USD 1-day Technicals

Technical factors (4-hour Chart):

  • Its price is currently above its 50-period EMA and at its 21-period EMA
  • Price at its middle Bollinger band
  • RSI is neutral (54.95)
  • Volume is on above-average levels

Key levels to the upside:          Key levels to the downside:

1: $174.5                               1: $163.7

2: $181.3                               2: $155.25

3: $195.5                               3: $149.3


Categories
Crypto Market Analysis

Daily Crypto Review, Jan 7 – Crypto Sector Market Cap Over $1 Trillion as BTC Approaches the $40k Mark

Most of the cryptocurrency sector ended up in the green as Bitcoin passed $38,000. Another thing to mention is that the overall industry market cap has reached past $1 trillion for the first time in the history of cryptocurrencies. Bitcoin is currently trading for $38,400, representing an increase of 10.78% compared to yesterday’s value. Meanwhile, Ethereum’s price has increased by 7.78% on the day, while XRP skyrocketed, gaining 46.55% of its value.

Daily Crypto Sector Heat Map

X Infinity gained 896.37% in the past 24 hours, making it the most prominent daily crypto gainer by far. It is followed by 7up Finance’s 298.93% and EveryCoin’s 278.57% gain. On the other hand, COVER Protocol lost 99.48%, making it the most prominent daily loser. It is followed by UniMex’s loss of 97.1% and Team Heretics Fan Token’s loss of 91.66%.

Top 10 24-hour Performers (Click to enlarge)

Bottom 10 24-hour Performers (Click to enlarge)

Bitcoin’s market dominance has moved down slightly since our last report, with its value currently being 68.6%. This value represents a 0.7% difference to the downside than the value it had when we last reported.

Daily Crypto Market Cap Chart

The cryptocurrency sector capitalization skyrocketed and passed the one trillion mark since we last reported, with its current value being $1,005 trillion. This represents a $33.51 billion increase when compared to our previous report.

_______________________________________________________________________

What happened in the past 24 hours?

_______________________________________________________________________

_______________________________________________________________________

Technical analysis

_______________________________________________________________________

Bitcoin

Bitcoin continued the upward trajectory and pushed past the previous all-time high with confidence, reaching a new high of $38,510 at one point. While the price did retrace after hitting the 37,800 at one point, but the 50-hour moving average created strong support, and BTC pushed back up to contest the all-time high level once again.

As we have mentioned many times, shorting of any kind and trading against the overall trend is most likely not optimal, and traders might find a good opportunity to long BTC each time it breaks the all-time high, as this is when it gets a large influx of buyers.

BTC/USD 1-hour chart

Bitcoin’s short-term technicals (4-hour and daily) are completely bullish, while its long-term overview is a bit more tilted towards neutrality.

BTC/USD 1-day Technicals

Technical factors (4-hour Chart):

  • Price is above both its 50-period EMA and its 21-period EMA
  • Price is near its top Bollinger band
  • RSI is in the overbought territory (72.04)
  • Volume is above average

Key levels to the upside          Key levels to the downside

1: $37,800                                 1: $35,880

2: $40,000                                 2: $34,800

3: $43,220                                 3: $33,100

Ethereum

Ethereum’s chart looks pretty similar to Bitcoin’s, as they both moved to the upside in the same manner. The second-largest cryptocurrency by market cap pushed past many support levels and reached $1,225 before descending slightly. Alongside Bitcoin’s move to new all-time highs, this move contributed the most to the overall crypto sector market cap passing the $1 trillion mark.

Ethereum is currently trading within a narrow range, bound by $1,169 to the downside and $1,211 to the upside. If ETH decides to move up, the next most likely resistance level will be the $1,341.5 level. If, however, it breaks this range to the downside, it has many support levels.

ETH/USD 1-hour Chart

Ethereum’s technicals on the daily, weekly, and monthly time-frames are fully tilted towards the buy-side, while its 4-hour technicals are slightly more neutral.

ETH/USD 1-day Technicals

Technical Factors (4-hour Chart):

  • Price is above both its 50-period and its 21-period EMA
  • Price is at its top Bollinger band
  • RSI is in the overbought area (73.41)
  • Volume is significantly above-average

Key levels to the upside          Key levels to the downside

1: $1,211                                    1: $1,169

2: $1,341.5                                 2: $1,080

3: $1,425                                    3: $1,050

Litecoin

Litecoin increased in price as well, but while its chart looks similar to Bitcoin’s and Ethereum’s, it’s important to notice that it did not break the high it made on Jan 4. In fact, Litecoin almost got to the $174.5 level but quickly pulled back to $165.

Litecoin found strong support in its 50-hour moving average, which held it above $165 and kept it from possibly breaking $163.7 to the downside.

Litecoin’s next move will most likely be highly dependent on Bitcoin’s short-term movement.

LTC/USD 1-hour Chart

Litecoin’s technicals are fully bullish on every single time frame and vary from “buy” to “strong-buy” indicators.

LTC/USD 1-day Technicals

Technical factors (4-hour Chart):

  • Its price is currently above both its 50-period EMA and its 21-period EMA
  • Price between its middle and top Bollinger band
  • RSI is nearing the overbought area (63.82)
  • Volume is above-average but descending

Key levels to the upside          Key levels to the downside

1: $163.7                                      1: $155.25

2: $174.5                                      2: $149.3

3: $195.5                                      3: $143.5


Categories
Crypto Videos

Another Boom For BTC As Retail Interest Is Bitcoin on the Rise!


Retail Interest for Bitcoin on the Rise as the Cryptocurrency Reaches New All-Time Highs

Twitter analytics data indicates an increase in interest in Bitcoin. Social media interest in the largest digital currency by market cap sets new records across numerous key metrics as Bitcoin continues to post new all-time highs well into the $30,000s.

In a tweet that came out on Jan 2, the official handle for The TIE, a cryptocurrency data analytics firm, showed that the number of unique Twitter handles tweeting about Bitcoin has hit a new all-time high. The previous number was set during the peak of the 2017 bull run and counted around 64,000 daily tweets at that time. However, the current number eclipsed that.

Joshua Frank, CEO of The TIE, posted additional information indicating that the interest is just starting to grow. It is not limited to Bitcoin but rather extends to most cryptocurrencies.

According to Frank, since The TIE’s post on Twitter that showed the number of unique handles posting about Bitcoin rising above 70,000 in one day for the first time ever, the new total monthly tweet volume has eclipsed the December 2017 tweet count high of 135,000 and reached 140,000. In addition to this, the overall number of tweets about crypto has also hit a new high of nearly 250,000 in a 24-hour period.


The increased volume isn’t limited only to Twitter, however. Google search volume for the term “Bitcoin” is slowly climbing in stride with the cryptocurrency’s price. On top of that, phrases such as “how to buy bitcoin” are soaring as well.

On the other hand, searches for “how to buy Ethereum” remain rather low, despite a 24-hour gain of 20% to as high as $950.

Many have speculated that the increase in interest is due to “FOMO” coming from institutions, which, alongside with a large supply shortage, further pushed the price up. 


Categories
Crypto Market Analysis

Daily Crypto Review, Jan 6 – Bitcoin Retraces after Creating a New All-Time High; Sector in the Green

Most of the cryptocurrency sector ended up in the green as Bitcoin pushed towards the upside and created a brand new all-time high. Bitcoin is currently trading for $34,801, representing an increase of 12.63% compared to yesterday’s value. Meanwhile, Ethereum’s price has increased by 9.47% on the day, while LTC gained 6.53% of its value.

Daily Crypto Sector Heat Map

Foglory Coin gained 3809.54% in the past 24 hours, making it the most prominent daily crypto gainer by far. It is followed by COVER Protocol’s 2102.06% and Birdchain’s 683.22% gain. On the other hand, MINDOL lost 74.94%, making it the most prominent daily loser. It is followed by Scanetchain loss of 71.12% and XLMDOWN’s loss of 55.53%.

Top 10 24-hour Performers (Click to enlarge)

Bottom 10 24-hour Performers (Click to enlarge)

Bitcoin’s market dominance has moved up slightly since our last report, with its value currently being 69.3%. This value represents a 1.1% difference to the upside than the value it had when we last reported.

Daily Crypto Market Cap Chart

The cryptocurrency sector capitalization has increased over 100 billion since we last reported, with its current value being $967.49 billion. This represents a $122.12 billion decrease when compared to our previous report.

_______________________________________________________________________

What happened in the past 24 hours?

_______________________________________________________________________

_______________________________________________________________________

Technical analysis

_______________________________________________________________________

Bitcoin

Bitcoin has had another amazing bull run, with its price pushing from just below $30,000 all the way up to $35,879, setting a brand new all-time high. However, this is where the price hit a wall, and Bitcoin started retracing. The largest cryptocurrency by market cap is now trading right below the previous all-time high of $34,800 and is seemingly going further down.

With the volume being as high as it is, the most does not seem like it’s done yet. Traders should pay attention to how the price reacts to certain levels.

BTC/USD 4-hour chart

Bitcoin’s technicals show a strong tilt towards the buy-side with some neutral characteristics, with only the 4-hour time-frame showing full bullish tilt.

BTC/USD 1-day Technicals

Technical factors (4-hour Chart):

  • Price is slightly above both its 50-period EMA and its 21-period EMA
  • Price is near its top Bollinger band
  • RSI is near the overbought territory (65.11)
  • Volume is above average

Key levels to the upside          Key levels to the downside

1: $34,800                                 1: $30,807

2: $35,000                                 2: $28,337

3: $35,890                                 3: $26,340

Ethereum

Ethereum also moved to the upside, with its price slowly but surely going from $975 all the way up to $1,139 before retracing slightly. Its move, however, didn’t seem as forced as Bitcoin’s.

While the overall sentiment around Ethereum is bullish, the fact that it hit nearly the same high three times without passing it could indicate a possible short-term top and a retracement.

Traders should pay great attention to the area around above $1,125 and how ETH reacts to it.

ETH/USD 1-hour Chart

Ethereum’s technicals on the daily and weekly time-frames show an overall bullish tilt with no hints of neutrality coming from oscillators. On the other hand, the monthly and 4-hour time-frames show some signs of neutrality or even bearishness.

ETH/USD 1-day Technicals

Technical Factors (4-hour Chart):

  • Price is above both its 50-period and its 21-period EMA
  • Price is between its middle and top Bollinger band
  • RSI is in the overbought area (72.01)
  • Volume is significantly above-average

Key levels to the upside          Key levels to the downside

1: $1,047                                     1: $1,009

2: $1,080                                     2: $960

3: $1,169                                      3: $932

Litecoin

Litecoin moved in a much more narrow range than Bitcoin and Ethereum. Its price slowly moved towards the upside (with one hiccup that brought its price from $163 to $155) and reached as high as $165. However, this move didn’t create new highs or approach the recent ones either.

At the moment, Litecoin looks like a cryptocurrency that mirrors Bitcoin’s moves, but with less volatility. While this brings a bit of perceived safety, the truth is that the profit potential is also greatly diminished.

LTC/USD 1-hour Chart

Litecoin’s technicals on the 4-hour and monthly time-frame are completely bullish, while its daily and weekly overviews show some oscillators having bearish values.

LTC/USD 1-day Technicals

Technical factors (4-hour Chart):

  • Its price is currently above both its 50-period EMA and its 21-period EMA
  • Price between its middle and top Bollinger band
  • RSI is nearing the overbought area (65.96)
  • Volume is above-average but descending

Key levels to the upside          Key levels to the downside

1: $163.7                                      1: $155.25

2: $174.5                                      2: $149.3

3: $195.5                                   3: $143.5

Categories
Crypto Daily Topic Cryptocurrencies

5 Best Websites to Buy Bitcoins Directly from Your Device, Anonymously

Blockchains are secure and imitable, but these publicly-circulated ledgers aren’t anonymous. In contrast, crypto assets are designed for transparency. If you make crypto investments, analysts can dedicate sufficient resources to track down your identity.

The Bitcoin blockchain and other crypto networks qualify as financial services, and the law requires them to know the customers they serve. The Anti-Money Laundering legislation requires them to collect your ID at some point while serving you.

Most folks took an interest in these digital assets because they thought transactions would be untraceable. While cryptocurrency networks don’t offer anonymity by default, there are ways through which you can buy bitcoins anonymously.

The convenience of buying cryptos directly from your device is unbeatable, and if you can remain anonymous while at it, even better! 

In this article, we highlight some of the websites that make it easier for you to achieve this. These websites charge a bit extra than what bitcoins usually cost, but the kind of privacy you’re after does not come for free.

So, let’s dive into five of the best websites that are absolutely worth your time. 

1. LocalBitcoins

LocalBitcoins facilitates peer-to-peer crypto exchanges. It works pretty much like eBay, and it’s fueled by willing-buyer, willing-seller consensus. You can find numerous sellers offering their bitcoins for cash. P2P Bitcoin exchanges enable sellers to bypass costly taxation, and LocalBitcoins will empower you to buy bitcoins without any ID.

Through LocalBitcoins, you can directly communicate and make deals with potential sellers. The platform makes money from these exchanges by levying escrow services. These services are powered by Smart Contracts, making it hard for scammers to dupe diligent bitcoin buyers.

This website is reliable because it rates sellers by keeping reviews of their transaction history. Therefore, you can tell apart genuine sellers from scammers by just scrolling.

You’d be surprised by just how many sellers are out there. The great thing is that LocalBitcoins is available anywhere there are sellers, and you could buy bitcoins anonymously at your local coffee shop.

2. BitQuick

This website lets buyers purchase bitcoins via cash deposits. It empowers you to buy bitcoins fast and anonymously, but the cryptocurrencies cost a bit more.

BitQuick was launched in 2013 and is registered in Ohio, United States. This website only serves Americans, and it only accepts cash deposits. You can buy bitcoins anonymously from sellers by depositing cash to their bank accounts.

You can head over to the website and find suitable sellers. After agreeing on the pricing, the seller locks currencies into the BitQuick escrow, and the bitcoins are transferred to your crypto wallet when you deposit the agreed cash amount.

For verification, you must meet up with the seller, who should take a picture of the deposit receipt and upload it to the system. This service only charges 2% for buying bitcoins.

BitQuick only sells bitcoins. You can buy as little as bitcoins worth $10 and as much as $10,000 worth of bitcoins at a go.

3. Wall of Coins

Wall of Coins is yet another peer-to-peer marketplace for trading cryptocurrencies. This service is registered under Genitrust Inc., and it generates daily traffic of 25,000 unique visits.

Wall of Coins is famous because users can buy bitcoins anonymously via cash. It helps buyers and sellers to come together, serving the United States, the United Kingdom, and Germany.

Enjoy anonymity, buying bitcoins without an ID because Wall of Coins is unregulated. You can buy and sell various cryptocurrencies on this website, which accepts three methods of payment, including:

  • Bank of America’s Teller Assist.
  • MoneyGram Deposit.
  • Cash deposits at banks.

This website does not impose transaction limits. It is also a great option because it offers a live chat, allowing you to communicate with sellers directly. You can also access customer support via phone calls.

Wall of Coins holds sellers’ bitcoins in escrow, and it releases them to you when you complete the payment instructions.

4. Bisq (Formerly Bitsquare)

Bisq offers fully decentralized exchanges, and it does not require any personal information or ID verification. Therefore, this service does not hold users’ funds.

It is a peer-to-peer network, and users exploit it for anonymity. They visit it via secure browsers such as Tor. Users trust the platform because of its open-source structure.

Bitsquare launched in 2016, and it allows bitcoin sellers to create offers by locking agreed amounts in escrow. Both sellers and buyers make holding fees of 0.001BTC, and they also pay transaction fees for the service.

Since Bisq does not hold any money, crypto or fiat, it uses arbitrators as escrows. Bisq arbitrators are frequent users of the platform who perform escrow services on third-party terms.

Arbitrators deposit huge security fees to Bisq to finance trust. If arbitrators make away with seller’s bitcoins or buyer’s fiat money, their deposits can make up for the losses. They perform this role in the pursuit of earnings from the transaction fees.

5. LocalCryptos

This website serves over 100,000 users in over 100 nations. It is a non-custodial platform offering peer-to-peer, decentralized crypto trade.

LocalCryptos empowers you to buy bitcoins anonymously, most transactions only taking ten minutes. No third parties are involved, and your messages with the seller are encrypted. This website is secure and trustworthy thanks to its blockchain integrity. It offers escrow services for you to buy bitcoins online without the fear of loss.

This Australian crypto exchange lets you track ads of people selling various cryptocurrencies. It does not impose national restrictions, and it is welcoming to foreign investors. 

The ease of use is phenomenal. You have over 40 payment options available, and you can use non-custodial wallets to enhance control over your financial assets.

LocalCryptos will charge you 0.75% in trading fees when you buy on its platform.

Parting Shot

Bitcoins are pseudo-anonymous, but most supporting services such as emails, banks, and custodial wallets require ID verification. Analysts just need to pick up your number or email address to reveal your identity.

Your best shot of buying bitcoins anonymously is through peer-to-peer exchanges. Sellers on these platforms are probably just as motivated as you are in seeking anonymity. 

No matter how anonymous websites selling bitcoins get, it beats the point if you use custodial wallets. Non-custodial bitcoin wallets don’t require your ID verification, but custodial wallets report to financial regulators.

Don’t get anonymous money and take it straight to the scrutiny of third-parties. Use non-custodial digital wallets with the best websites to buy bitcoins directly from your device, anonymously.

Do you know of other ways to buy bitcoins anonymously? Be kind enough to share your proven tricks with us in the comments section. Also, feel free to share this piece with loved ones who want to buy bitcoins anonymously.

Categories
Crypto Videos

Miners Can’t Produce Enough BTC – The Reason BTC is Skyrocketing!


Miners Can’t Produce Enough BTC – The Reason BTC is Skyrocketing

Institutional crypto investment company Grayscale now has $20 billion under its control as its consistent Bitcoin buys heavily outstrip production. The ratio of Grayscale Bitcoin buys to BTC production is has now increased to almost three to one.


As noted by data analytics firm Coin98, Grayscale bought close to three times more Bitcoin than the amount miners added to the market in December 2020.

Miners can’t produce enough Bitcoin

In Dec, Grayscale added a total of 72,950 BTC to its assets under management (AUM). Over the same period, miners generated just 28,112 BTC, being only 38.5% of Grayscale’s buy-in.

These figures underscore what many currently describe as an ongoing liquidity squeeze in Bitcoin, where large, mostly institutional buyers, suck up any available supply and completely remove it from circulation, sending it to cold storage for long-term holding. This then creates a lack of supply while the retail demand remains constant of increases, causing the price of Bitcoin to rise exponentially, just like it did on Jan 3, where Bitcoin’s price skyrocketed and reached past $33,000.

The phenomenon of institutional investors sweeping the available supply was already visible in Nov 2020, but Dec 2020 saw a clear increase in demand from both Grayscale and other institutional entities.

Grayscale controls over $20 billion in crypto

Grayscale CEO Barry Silbert celebrated the end of 2020 by bringing the company’s total assets under management across its various crypto funds to over $20 billion. Looking back just one year ago, the figure stood at, compared to now, a mere $2 billion.


The company remains the single largest institutional player on the Bitcoin scene, far outstripping any other market participant. Its BTC holdings were coming out to $17.475 billion on the first day of 2021, with this number growing to an even higher dollar value as Bitcoin pumped to over $34,000. Newcomer MicroStrategy, while not an investment-focused company, now controls 70,470 BTC.

Going forward, analysts predict that the increasing demand for the fixed supply of newly mined Bitcoin will only create a bidding war and push the price further up. 


Categories
Crypto Market Analysis

Daily Crypto Review, Jan 5 – Ethereum Outpaces the Market; Most Cryptos in the Red

Daily Crypto Review, Jan 5 – Ethereum Outpaces the Market; Most Cryptos in the Red

The cryptocurrency sector experienced volatility amongst cryptos as Bitcoin continues its retracement and Ethereum outpaces the market. Bitcoin is currently trading for $31,479, representing a decrease of 4.15% compared to yesterday’s value. Meanwhile, Ethereum’s price has increased by a whopping 11.70% on the day, while XRP gained 1.27% of its value.

Daily Crypto Sector Heat Map

Birdchain gained 1498.92% in the past 24 hours, making it the most prominent daily crypto gainer by far. It is followed by Folgory Coin’s 837.8% and Rewardiqa’s 720.43% gain. On the other hand, Basiscoin Share lost 98.58%, making it the most prominent daily loser. It is followed by Basiscoin Cash’s loss of 90.24% and Mith Cash’s loss of 78.91%.

Top 10 24-hour Performers (Click to enlarge)

Bottom 10 24-hour Performers (Click to enlarge)

Bitcoin’s market dominance has moved down slightly since our last report, with its value currently being 68.2%. This value represents a 0.5% difference to the downside than the value it had when we last reported.

Daily Crypto Market Cap Chart

The cryptocurrency sector capitalization has decreased since we last reported, with its current value being $845.71 billion. This represents a $14.82 billion decrease when compared to our previous report.

_______________________________________________________________________

What happened in the past 24 hours?

_______________________________________________________________________

_______________________________________________________________________

Technical analysis

_______________________________________________________________________

Bitcoin

Bitcoin has possibly ended its retracement and entered sideways trading as its price created a double bottom at the $30,000 mark. However, there was one point where the largest cryptocurrency by market cap dropped as much as 20% and broke $28,000 to the downside, but recovered almost instantly.

BTC is currently right above the $30,807 Fib retracement level and is fighting to stay above it. If it posts a candle that shows it consolidated above this level, we could see another push towards the upside. However, if it breaks the Fib retracement, we could see BTC looking for support at the $30,000 or $29,300 levels.

BTC/USD 4-hour chart

Bitcoin’s technicals are showing a strong tilt towards the buy-side, with only the 4-hour time-frame showing bearish oscillator values.

BTC/USD 1-day Technicals

Technical factors (4-hour Chart):

  • Price is slightly above its 50-period EMA and at its 21-period EMA
  • Price is near its middle Bollinger band
  • RSI is neutral (48.20)
  • Volume is slightly above average

Key levels to the upside          Key levels to the downside

1: $34,800                                 1: $30,807

2: $35,000                                 2: $28,337

3: $36,000                                 3: $26,340

Ethereum

Ethereum is certainly one of the most interesting cryptocurrencies in the last couple of days, with its price going from stagnation to skyrocket mode in a matter of hours. While many thought that the initial push above $1,000 is over and that ETH is destined to retrace below it, the second-largest cryptocurrency by market cap managed to do it again – just one day later.

The cryptocurrency managed to bounce off of one of its numerous support levels and propel its price back above $1,000.

Ethereum is now fighting for the $1,000 level, with its price barely staying above it.

ETH/USD 1-hour Chart

Ethereum’s technicals on all time-frames show an overall bullish tilt with hints of neutrality coming from oscillators.

ETH/USD 1-day Technicals

Technical Factors (4-hour Chart):

  • Price is above both its 50-period and its 21-period EMA
  • Price is near its top Bollinger band
  • RSI has left the overbought area (68.56)
  • Volume is significantly above-average

Key levels to the upside          Key levels to the downside

1: $1,047                                     1: $1,009

2: $1,080                                     2: $960

3: $1,169                                      3: $932

Litecoin

Litecoin ended its 2-day bull run after reaching bull exhaustion at the $174.5 mark, after which it started to consolidate. However, the consolidation phase looks like less of a consolidation phase and more like a fight for the $152 Fib retracement level.

Litecoin is currently losing the battle for $152 –  but even in the case of bears pushing it to the downside, its price has many support anchor points, most notably the zone between $135 and $142.

LTC/USD 1-hour Chart

Litecoin’s technicals on the 4-hour and monthly time-frame are completely bullish, while its daily and weekly overviews show some oscillators having bearish values.

LTC/USD 1-day Technicals

Technical factors (4-hour Chart):

  • Its price is currently above both its 50-period EMA and its 21-period EMA
  • Price is at its middle Bollinger band
  • RSI is neutral (58.54)
  • Volume is above-average

Key levels to the upside          Key levels to the downside

1: $163.7                                      1: $155.25

2: $174.5                                      2: $149.3

3: $195.5                                   3: $143.5


Categories
Crypto Videos

Binance Enables SegWit Support for BTC Deposits as Adoption Skyrockets!

Binance Enables SegWit Support for BTC Deposits as Adoption Skyrockets

Binance, one of the largest cryptocurrency exchanges by volume in the world, has incorporated Segregated Witness, better-known as SegWit, support for Bitcoin deposits. 

The SegWit support was finally enabled for incoming deposits on Christmas Eve, Binance said in an official statement. Until this announcement, the protocol upgrade was enabled only for withdrawals. Effective immediately after the announcement, Binance users got the option to transfer funds to a SegWit address by selecting the BTC (SegWit) network. Binance further explained in the statement:

“Please note that SegWit should help reduce fees; however, if you incorrectly send incompatible assets to the desired address, your funds will not be recoverable, and therefore will result in permanent loss.”

SegWit

Implemented back in 2017, SegWit is a Bitcoin protocol upgrade designed to help with network scaling. Besides that, SegWit was implemented to help with fixing several associated bugs. This upgrade is known for the way it updates data on the blockchain, namely, by segregating signatures from transaction data. SegWit upgrade allows more transactions to be stored in a single block, thus doubling Bitcoin’s transaction capacity.

Data from transactionfee.info show that somewhere in the ballpark of two-thirds of Bitcoin payments currently use SegWit. However, even with SegWit implemented, Bitcoin continues to face scalability limitations, which many argue has impeded adoption for everyday use. Exactly those scalability limitations have transformed Bitcoin from a possible means of payment to a store of value. However, developers have not given up on BTC becoming a viable payment protocol.

Light Network

The Lightning Network has been proposed as a viable second-layer scaling solution for Bitcoin as a payment protocol. Unlike SegWit, which got implemented via a soft fork to the Bitcoin protocol, the Lightning Network is a layer that goes on top of Bitcoin, and that could enable instant and almost cost-free transactions.

Despite current limited transaction capacity, Bitcoin remains the uncontested leader of the digital currency market, with its dominance over other crypto assets recently hitting one-year highs and approaching dangerously close to 70% of the total cryptocurrency market cap. 

Categories
Crypto Daily Topic

Platforms You Should Join to Avoid Falling for Defi Scams

Scammers couldn’t have found a better place to thrive. What with decentralization, the anonymity of transactions, and a lack of regulation characterizing the space? 

Despite its positives, the Defi sector is a jungle that readily swallows the unknowing. Navigating it requires heart, but more than that, tact. Identifying the snares and how to avoid them is the key to profitable investments in the sector.

2020 has witnessed a burgeoning of Defi projects offering their services and products. A good number of these are dubious, itching for an opportunity to rob you of your funds. 

How then are these fraudulent schemes perpetrated? Is there a way of identifying them? What measures can one take to protect themselves from falling victim to them? Are there platforms to guide investors in determining the genuine from fake projects? 

This article hopes to build your capacity to make informed decisions within the space by answering these questions.

How Do Scammers Carry out their Activities on Defi platforms?

Scams are as varied as there are scammers. Here are a few of their favored methods of execution.

  • Exit Scams

An exit scam is a scheme hatched by unscrupulous crypto promoters to defraud the public of their funds. They dupe investors by setting up a project with an attractive concept. After collecting funds from the ICO, the perpetrators evaporate with the funds leaving the investors in limbo. In 2020, for instance, YFDEX.Finance conned investors of $20 million in just two days of operating.

  • Pump and Dump

Pump and dump schemes involve artificially pushing the demand for a given token. A small group of whales identifies and purchases a token with low value. Their action causes the token’s prices to appreciate. This price hike draws other investors to acquire the token hoping for gain. On the price reaching a certain level, the whales dispose of their holdings at a profit. Thus, the prices plunge, leaving investors with hefty losses.

  • Admin Imitator

Using a social media platform, for instance, Twitter, Telegram, or Discord, a scammer impersonates a Defi Platform’s support team member. The scammer used credentials similar to the platform’s admin. They then ask either for private keys to resolve specific issues. Alternatively, they may require members to send ETH to a given address to complete their scam.

  • Fake Airdrops and Rewards

Airdrops and giveaways help. Defi platforms raise awareness about their platforms. Also, they increase community participation. At times scammers may provide fake Airdrops and reward to access private keys and personal info. They then use these to defraud you of your funds.

  • Defi Rug Pulls

Defi rug-pulls are con games that involve minting new tokens and publicizing them, primarily via social media. After that, the project lists on Uniswap, and owners inject liquidity. The unsuspecting investors will swap their ETH for the new token. The instigators then drain the liquidity pool. This way, they make away with the funds leaving holders with worthless coins.

  • Hardware Wallet Theft

Another scam involves selling users compromised hardware wallets. Their setup creates backdoors allowing hackers to drain one’s funds.  

How do you Identify Scam on Defi?

As the Defi sector is replete with scams, knowing how to identify them becomes an essential skill. Here are a few pointers:

  • Their Offering- Genuine projects have unique products tailored towards specific pain points, doubtful projects, on the contrary, piggyback on successful projects’ products.
  • Development- Are the developers continuously updating the code? If not, it could be a scam.
  • The founders- Are they known? What’s their reputation within the crypto space? Shady projects will have shady frontmen too.
  • Tokenomics- How is the token distributed? Scams typically inflate the token price while holding a majority of the token.
  • Language Use- If they use complex Defi jargon, it’s possibly a scam; legit projects use simple language.
  • Promised Returns- If the deal is too good to be true, think twice before committing.

5 Best Platforms to Sign Up For to Avoid DeFi Scams

The security of your funds could be a sign up away. The rise of Defi Scams has resulted in the emergence of platforms to protect users in the ecosystem. These platforms take it upon themselves to detect scams so that you don’t have to. Here’s your must sign up to platforms to avoid Defi scams

LID Protocol’s LIFTOFF

LIFTOFF is a platform that uses LID Protocol’s Certified Presales service to protect investors and projects. The service facilitates projects to raise funds. When they meet their targets, a smart contract locks the raised funds and tokens on Uniswap or other lending protocols. 

Once the presale concludes, it mints the liquidity pool tokens and burns them. Thus, it permanently locks the liquidity on the lending protocol preventing the occurrence of rug-pull scams. 

SlowMist

This China-based company is a market leader in blockchain security. Besides serving over 70 DEXs, 110 wallet providers, and 40 blockchain firms, it supports more than 800 tokens. It audits these projects’ security systems and smart contracts. 

SlowMist made headlines when it raised the alarm over an impending $2.5 million DeFi exit scam by Emerald Mine (EMD). The platform had transferred to a private account a vast chunk of tokens that users had staked.

PeckShield

PeckShield is another Chinese blockchain security company that strives to enhance blockchain security and usability. It produces cutting edge products targeting large scale systems. It reports on hidden vulnerabilities within networks. 

Additionally, it creates products and services to counter these vulnerabilities. PeckShield also flagged the Emerald Mine exit scam.

Blockchain Audit

This New York-based firm does more than build secure decentralized systems. It also audits Blockchains and reports on different projects’ states of security. Blockchain helps identify counterfeits, bullwhip effects, and fake reviews, among others. 

Again, it is a good source of information on upcoming projects and their security.

KryptoGO

KryptoGO develops advanced blockchain solutions and offers consultancy services through linking projects with experts on various issues. It also undertakes audits besides reporting on different projects. 

Hence, it’s a valuable source of information for anyone researching a project of interest.

What to do to Protect Yourself from Scams?

To protect yourself against being scammed:

  • Do your research on the project before investing
  • Seek expert opinion on the project
  • Avoid sharing your private keys and personal information
  • Only get your hard wallets from legit outlets
  • Sign up to a platform that analyses Defi projects and trends

Final Thoughts

The Defi sector crawls with nefarious schemes. Consequently, it behooves every investor to be awake to this reality. Scammers have devised different ways of actualizing their goals. As such, knowing how to identify scam projects from the rest is critical. 

Simple actions like digging into the founder’s background, examining the project’s development history and its token structure can avert huge losses. Additionally, signing up to platforms like the ones identified here will guarantee you a safe investing experience.

Categories
Crypto Videos

Miami To Become The First Crypto-Centric City? Winklevoss Twins Backing The Mayor!


Will Miami Become the First Crypto-Centric City in the US?

Miami mayor Francis Suarez has joined the Bitcoin advocates “club” as he offered more evidence that mainstream adoption is accepting the largest cryptocurrency.  

In a tweet that came out on Dec 24, Suarez stated that Bitcoin is a “stable investment during an incredibly unstable year,” then adding that he has just started learning about the best-known digital asset through figures like the Winklevoss brothers and Anthony Pompliano.

Cameron Winklevoss, left, and his twin brother Tyler leave a federal appeals court in San Francisco, California, U.S., on Tuesday, Jan. 11, 2011. Facebook Inc.’s settlement of claims that its founder Mark Zuckerberg stole the idea for what became the world’s largest social-networking website should be undone, former college classmates of Zuckerberg told an appeals court. Photographer: Noah Berger/Bloomberg via Getty Images

Tyler Winklevoss and Pompliano responded to Suarez’s tweet, with Tyler saying he and his brother Cameron will bring the mayor of Miami a “signed copy of Bitcoin Billionaires,” a book written about the aforementioned twins, while Pompliano called Miami a future Bitcoin city.

Suarez also indicated that his administration is currently exploring the idea of Miami truly becoming the first crypto-centric government in the US. However, he provided no further details on the topic.

Francis Suarez was elected the mayor of Miami in Nov 2017 after running his campaign as a nonpartisan candidate. Before entering politics, he founded a real estate title company, but also worked as an attorney.

Miami has often been described as one of the US cities with the biggest potential of becoming crypto-centric by some news outlets, mostly due to its lax state oversight and a large influx of foreign capital. The North American Bitcoin Conference, which featured figures like Charles Hoskinson, Riccardo Sagni, and Roger Ver, was held in Miami at the start of 2020.

Bitcoin’s explosive rally and bull trend, which it is currently in, is certainly driving new conversations about the digital asset to the table. This is especially true as this rally, unlike the one in 2017, was fueled mostly by corporate and institutional adoption, rather than the retail sector. Bitcoin adoption is increasingly viewed not as a speculation, but as a competitive advantage in an economy riddled with financial instability, record central-bank intervention, and significant asset-price inflation. 

Categories
Crypto Market Analysis

Daily Crypto Review, Dec 31 – Bitcoin Hits a New All-Time High as it Pushes Past $29K

The cryptocurrency sector is stabilizing vastly in the green as Bitcoin pushed above $29,000, creating a new all-time high. Bitcoin is currently trading for $29,001, representing an increase of 4.40% compared to yesterday’s value. Meanwhile, Ethereum’s price has increased by 2.40% on the day, while XRP gained 6.74% of its value.

Daily Crypto Sector Heat Map

Yearn Finance Passive Income gained 759.27% in the past 24 hours, making it the most prominent daily crypto gainer by far. It is followed by DragonVein’s 268.8% and Gala’s 146.76% gain. On the other hand, BitBall lost 63.32%, making it the most prominent daily loser. It is followed by MITH Cash’s loss of 63.25% and Blue Whale Exchange’s loss of 53.96%.

Top 10 24-hour Performers (Click to enlarge)

Bottom 10 24-hour Performers (Click to enlarge)

Bitcoin’s market dominance has moved up half a percent since our last report, with its value currently being 70.6%. This value represents a 0.5% difference to the upside than the value it had when we last reported.

Daily Crypto Market Cap Chart

The cryptocurrency sector capitalization has increased since we last reported, with its current value being $762.78 billion. This represents a $25.47 billion increase when compared to our previous report.

_______________________________________________________________________

What happened in the past 24 hours?

_______________________________________________________________________

_______________________________________________________________________

Technical analysis

_______________________________________________________________________

Bitcoin

Bitcoin has continued its move up on slightly higher volume, breaking its $28,600 resistance level and entering unexplored territory. The push ended with bull exhaustion at the $29,300 mark, creating a new all-time high.

Bitcoin’s price has hit this level twice in a short span of time, creating a double top and propelling BTC slightly backward. Its price is currently trading below $29,000, in a range bound by $28,600 to the downside and $29,300 to the upside.

Even though a move towards $30,000 is quite possible, many analysts have pointed to enormous sell walls at and around this level, making it extremely hard to breakthrough.

 BTC/USD 1-hour chart

Bitcoin’s technicals are showing a strong tilt towards the buy-side. However, its oscillators are tilting towards bearishness due to the overextended move to the upside.

BTC/USD 1-day Technicals

Technical factors (4-hour Chart):

  • Price is above its 50-period EMA and at its 21-period EMA
  • Price is near its middle Bollinger band
  • RSI is neutral (56.57)
  • Volume is slightly above average

Key levels to the upside          Key levels to the downside

1: $28,600                                 1: $28,391

2: $29,000                                 2: $25,512

3: $30,000                                 3: $24,696

Ethereum

Ethereum has sparked by Bitcoin’s push up, tried to break its most immediate resistance level of $747. While the second-largest cryptocurrency by market cap did manage to push through and reach $759 at one point, the bulls were not able to hold this level, which triggered a pullback below $747.

Ethereum is currently trading right below $747, with the 50-hour and 21-period 4-hour moving averages providing it support.

Ethereum is most likely in for a short-term correction as its volume is descending quickly after a failed attempt to tackle the upside.

 ETH/USD 1-hour Chart

Ethereum’s technicals look very much like Bitcoin’s, with the overall tilt being towards the buy-side, with oscillators tilting towards bearishness.

ETH/USD 1-day Technicals

Technical Factors (4-hour Chart):

  • Price is above its 50-period and at its 21-period EMA
  • Price is near its middle Bollinger band
  • RSI is neutral (50.10)
  • Volume is descending from above-average levels

Key levels to the upside          Key levels to the downside

1: $747                                     1: $675

2: $800                                     2: $653

3: $900                                      3: $632

Ripple

XRP gained over 5% on the day due to Bitcoin’s upwards-facing move pulling the market as a whole up. When looking at it from a technical standpoint, XRP managed to win the fight for $0.214, which is certainly a positive thing.

However, more bad news came out to the public, with even more exchanges suspending trading for XRP. Even though many analysts say that XRP is not a security, the sheer pressure that the SEC lawsuit exerts on the project caused almost every exchange and fund to distance themselves from Ripple and XRP, causing its price to crash.

 XRP/USD 1-hour Chart

XRP’s technicals on all time-frames are tilted towards the sell-side, with only the daily overview being completely bearish.

XRP/USD 1-day Technicals

Technical factors (4-hour Chart):

  • Its price is currently at its 50-period EMA and below its 21-period EMA
  • Price is at its middle Bollinger band
  • RSI is in the oversold territory (50.22)
  • Volume is currently on below-average levels

Key levels to the upside          Key levels to the downside

1: $0.25                                    1: $0.214

2: $0.30                                     2: $0.14

3: $0.358


Categories
Crypto Market Analysis

Daily Crypto Review, Dec 30 – Bitcoin Creates a New All-Time High; XRP Recovers Slightly

The cryptocurrency sector is stabilizing after Bitcoin’s failed push towards the upside, which in fact created a new all-time high, but just for a moment. Bitcoin is currently trading for $27,848, representing an increase of 3.41% compared to yesterday’s value. Meanwhile, Ethereum’s price has decreased by 1.22% on the day, while XRP gained 5.71% of its value.

 Daily Crypto Sector Heat Map

EveryCoin gained 371.17% in the past 24 hours, making it the most prominent daily crypto gainer by far. It is followed by Wownero’s 223.09% and Gala’s 167.69% gain. On the other hand, PENTA lost 98.72%, making it the most prominent daily loser. It is followed by AS Roma Fan Token’s loss of 64.83% and Reef’s loss of 64.46%.

Top 10 24-hour Performers (Click to enlarge)

Bottom 10 24-hour Performers (Click to enlarge)

Bitcoin’s market dominance has moved up almost a whole percent since our last report, with its value currently being 70.1%. This value represents a 0.9% difference to the upside than the value it had when we last reported.

Daily Crypto Market Cap Chart

The cryptocurrency sector capitalization has increased since we last reported, with its current value being $737.31billion. This represents an $24.83 billion increase when compared to our previous report.

_______________________________________________________________________

What happened in the past 24 hours?

_______________________________________________________________________

_______________________________________________________________________


Technical analysis

_______________________________________________________________________


Bitcoin

Bitcoin has broken its slight descending consolidation phase by bouncing off of the $26,000 level and pushing towards its all-time high level. While the level got barely broken and Bitcoin set a new all-time high, the bulls were not able to push past the resistance zone with confidence due to the lack of volume and buying pressure.

As a consequence of this, Bitcoin dipped to $27,600 levels, where it is consolidating at the moment. Traders should pay attention to volume movements, as these are the best indication of whether the move will actually break a support/resistance level at the moment.

If Bitcoin fails to break the all-time high level in the short future, we can expect a retracement that could reach the $23,000 zone.


BTC/USD 1-hour chart

Bitcoin’s technicals on the 4-hour and weekly time-frames are completely bullish, while the daily and monthly ones still contain some form of neutrality or bearishness.

BTC/USD 1-day Technicals

Technical factors (4-hour Chart):

  • Price is above its 50-period EMA and at its 21-period EMA
  • Price is near its top Bollinger band
  • RSI is neutral (61.24)
  • Volume is slightly above average

Key levels to the upside          Key levels to the downside

1: $28,391                                 1: $25,512

2: $29,000                                 2: $24,696

3: $30,000                                  3: $24,315

Ethereum

Ethereum has spent the whole day trading right below its immediate resistance level of $747. The second-largest cryptocurrency by market cap tried to break above it twice, but failed both times. Ether is currently descending in price as a consequence of the failed bull attempts which created a double top.

Ethereum traders have to pay attention to Bitcoin’s movements, as its movement (either up or down) will most likely cause Ether’s next move.

ETH/USD 1-hour Chart

Ethereum’s technicals on every time-frame are tilted towards the bull-side. However, they all contain slight neutrality or bearishness alongside the overall tilt towards the buy-side.

ETH/USD 1-day Technicals

Technical Factors (4-hour Chart):

  • Price is above both its 50-period and its 21-period EMA
  • Price is near its middle Bollinger band
  • RSI is neutral (58.07)
  • Volume is trading on above-average levels

Key levels to the upside          Key levels to the downside

1: $747                                     1: $675

2: $800                                     2: $653

3: $900                                      3: $632

Ripple

XRP has spent the day trying to stabilize its price after days of constant price dips. The fourth-largest cryptocurrency by market cap bounced off of the $0.173 level, and propelled itself towards the next zone, sitting at $0.214.

XRP is currently fighting for the $0.214 level, and if no new news (positive or negative) pop out, its short-term price will most likely depend on whether it manages to stay above the $0.214 level or fall below it.

XRP/USD 1-hour Chart

XRP’s technicals on all time-frames are tilted towards the sell-side, with only the 4-hour and monthly overviews showing some form of neutrality.

XRP/USD 1-day Technicals

Technical factors (4-hour Chart):

  • Its price is currently far below both its 50-period EMA and its 21-period EMA
  • Price is between its bottom and middle Bollinger band
  • RSI is in the oversold territory (37.52)
  • Volume has spiked to above-average levels

Key levels to the upside          Key levels to the downside

1: $0.25                                    1: $0.214

2: $0.30                                     2: $0.14

3: $0.358


Categories
Crypto Market Analysis

Daily Crypto Review, Dec 29 – XRP Trading Suspended by Coinbase and OKEx, Causing a 22% Price Dip

The cryptocurrency sector had is currently in a consolidation phase as Bitcoin fell below $27,000. Bitcoin is currently trading for $26,624, representing a decrease of 1.13% compared to yesterday’s value. Meanwhile, Ethereum’s price has decreased by 2.56% on the day, while XRP had another major dip, losing 19.42% of its value.

 Daily Crypto Sector Heat Map

Ethereum Lightning gained 1097.36% in the past 24 hours, making it the most prominent daily crypto gainer by far. It is followed by N3RD Finance’s 94.18% and Matrix AI Network’s 86.08% gain. On the other hand, COVER Protocol lost 97.97%, making it the most prominent daily loser. It is followed by Encryptgen’s loss of 91.18% and Mining Core Coin’s loss of 69.41%.

Top 10 24-hour Performers (Click to enlarge)

Bottom 10 24-hour Performers (Click to enlarge)

Bitcoin’s market dominance has moved up slightly since our last report, with its value currently being 69.2%. This value represents a 0.1% difference to the upside than the value it had when we last reported.

Daily Crypto Market Cap Chart

The cryptocurrency sector capitalization has decreased slightly since we last reported, with its current value being $712.73 billion. This represents an $8.45 billion decrease when compared to our previous report.

_______________________________________________________________________

What happened in the past 24 hours?

_______________________________________________________________________

_______________________________________________________________________

Technical analysis

_______________________________________________________________________

Bitcoin

Ever since it hit the $28,391 all-time high, Bitcoin has been trading in a sideways manner. Its price is currently within a large channel, bound by $25,512 to the downside and the aforementioned all-time high to the upside.

The descending volume alongside sideways trading was never a long-term occurrence with Bitcoin, but rather good indicators of a new explosive move ahead.

Bitcoin traders should be mindful of any volume spikes when trading, and should look for smaller time-frame Fib retracements if they want to be more precise with setting their support and resistance levels.

BTC/USD 1-hour chart

Bitcoin’s technicals on both short-term and long-term time-frames are completely bullish and show close to no signs of neutrality or bearishness.

BTC/USD 1-day Technicals

Technical factors (4-hour Chart):
  • Price is above its 50-period EMA and at its 21-period EMA
  • Price is at its middle Bollinger band
  • RSI is neutral (55.72)
  • Volume is slightly above average, but descending
Key levels to the upside          Key levels to the downside

1: $28,391                                 1: $25,512

2: $29,000                                 2: $24,696

3: $30,000                                  3: $24,315

Ethereum

Ethereum’s move towards the upside ended at $747, prompting a pullback. However, while many analysts believed that Ether would not keep its price above $700, that’s exactly what happened.

Ethereum’s signature trading move has occurred once again, with that move being: pushing up, then pulling back, and breaking the 21-hour moving average to the downside, only to find support at the 50-hour moving average and push back up. Knowing how Ethereum moves alongside watching Bitcoin’s moves is one of the safest ways to trade cryptocurrencies at the moment, as the moves have pre-determined stop-losses and targets.


ETH/USD 1-hour Chart

Ethereum’s shorter time-frames are completely bullish and show no signs of neutrality or bearishness, while its longer-time frames have some neutrality present alongside the overall bullishness.

ETH/USD 1-day Technicals

Technical Factors (4-hour Chart):
  • Price is above both its 50-period and its 21-period EMA
  • Price is above its middle Bollinger band
  • RSI is neutral (59.39)
  • Volume is trading on above-average levels
Key levels to the upside          Key levels to the downside

1: $747                                     1: $675

2: $800                                     2: $653 

3: $900                                      3: $632

Ripple

XRP has experienced another extremely bad day, as its price dropped more than 22% on the day. The move came as a result of two major exchanges, OKEx and Coinbase, dropping support for XRP due to the pending lawsuit against its company, Ripple, as well as Ripple’s executives.

Trading XRP is extremely risky at the moment due to price fluctuations that are a result of news rather than technical formations.

XRP/USD 1-hour Chart

XRP’s technicals on all time-frames are tilted towards the sell-side, with all of them showing slight signs of neutrality.

XRP/USD 1-day Technicals

Technical factors (4-hour Chart):
  • Its price is currently far below both its 50-period EMA and its 21-period EMA
  • Price is at its bottom Bollinger band
  • RSI is in the oversold territory (28.88)
  • Volume has spiked to above-average levels
Key levels to the upside          Key levels to the downside

1: $0.25                                    1: $0.214

2: $0.30                                     2: $0.14

3: $0.358 

Categories
Crypto Market Analysis

Daily Crypto Review, Dec 28 – Ethereum Breaks $700; Bitcoin at $30k?

The cryptocurrency sector had an incredible weekend as Bitcoin skyrocketed towards $28,000. Bitcoin is currently trading for $27,031, representing a decrease of 2.91% compared to yesterday’s value, but a massive increase compared to its value on Friday. Meanwhile, Ethereum’s price has increased by 12.79% on the day, while XRP managed to lose 4.05%.

 Daily Crypto Sector Heat Map

EncrypGen gained 2787.56% in the past 24 hours, making it the most prominent daily crypto gainer by far. It is followed by Bankacoin’s 212.44% and Trabzonspor Fan Token’s 178.8% gain. On the other hand, CEZO lost 89.89%, making it the most prominent daily loser. It is followed by JD Coin’s loss of 64.79% and Triumph X’s loss of 57.74%.

Top 10 24-hour Performers (Click to enlarge)

Bottom 10 24-hour Performers (Click to enlarge)

Bitcoin’s market dominance has moved down slightly since our last report, with its value currently being 69.1%. This value represents a 0.25% difference to the downside than the value it had when we last reported.

Daily Crypto Market Cap Chart

The cryptocurrency sector capitalization has increased over $100 billion since we last reported, with its current value being $721.10 billion. This represents a $101.89 billion increase when compared to our previous report.

_______________________________________________________________________

What happened in the past 24 hours?

_______________________________________________________________________

_______________________________________________________________________

Technical analysis

_______________________________________________________________________

Bitcoin

Bitcoin did not sleep this weekend as it took its time to push towards new all-time highs. The best-known cryptocurrency pushed towards the upside, reaching as high as $28,391 at one point. It is now consolidating around the $27,000 level and preparing for the next move.

Our Fib extensions drawn on Friday worked exactly as expected, with Bitcoin respecting every single one of them. With all of them still being a valid choice, traders should either look for a bounce off the immediate support levels or increased volume followed by a sharp increase in price. Trading Bitcoin’s pullbacks is not exactly the best option at the moment.

BTC/USD 4-hour chart

While Bitcoin’s 4-hour and weekly technicals show a full tilt towards the buy-side, its daily and monthly technicals show some neutrality signs.

BTC/USD 1-day Technicals

Technical factors (4-hour Chart):
  • Price is above its 50-period EMA and slightly above its 21-period EMA
  • Price is slightly above its middle Bollinger band
  • RSI is neutral (62.10)
  • Volume is slightly above average
Key levels to the upside          Key levels to the downside

1: $28,391                                 1: $25,512

2: $29,000                                 2: $24,696

3: $30,000                                  3: $24,315

Ethereum

While Ethereum did manage to score some gains over the weekend, its upside got overshadowed by Bitcoin’s growth. However, the second-largest cryptocurrency by market cap has decided to make that up by suddenly pushing from $624 all the way up to $738. While the move seemingly ended here, it is not yet certain whether the price will break the level or go even higher, or start its consolidation at slightly lower levels.

Traders should utilize the volume indicator, order books, and well-established support/resistance levels to its fullest to catch these explosive trades while remaining safe.

ETH/USD 4-hour Chart

Ethereum’s shorter time-frames are completely bullish, while its longer-time frames show slight neutrality signs.

ETH/USD 1-day Technicals

Technical Factors (4-hour Chart):
  • Price is far above both its 50-period and its 21-period EMA
  • Price is at its top Bollinger band
  • RSI has stepped into the overbought territory (71.68)
  • Volume is trading on above-average levels
Key levels to the upside          Key levels to the downside

1: $738                                     1: $675

2: $800                                     2: $632 

3: $900                                      3: $600

Ripple

XRP has been trading on low volume and slowly descending after a brief rally to $0.385. The fourth-largest cryptocurrency keeps getting crushed by various companies dropping support or liquidating their XRP positions after Ripple and its executives got sued by the SEC.

XRP traders should (more than anything) pay attention to the news. However, there are many other cryptocurrencies with much safer and potentially more profitable trading setups at the moment.

XRP/USD 4-hour Chart

XRP’s technicals on all time-frames slightly tilted towards the sell-side, but they all show some signs of uncertainty.

XRP/USD 1-day Technicals

Technical factors (4-hour Chart):
  • Its price is currently far below its 50-period EMA and slightly below its 21-period EMA
  • Price slightly below its middle Bollinger band
  • RSI has left the oversold territory (37.46)
  • Volume is returning to average levels
Key levels to the upside          Key levels to the downside

1: $0.30                                    1: $0.25

2: $0.358                                   2: $0.214

3: $0.475