The cryptocurrency sector is stabilizing vastly in the green as Bitcoin pushed above $29,000, creating a new all-time high. Bitcoin is currently trading for $29,001, representing an increase of 4.40% compared to yesterday’s value. Meanwhile, Ethereum’s price has increased by 2.40% on the day, while XRP gained 6.74% of its value.

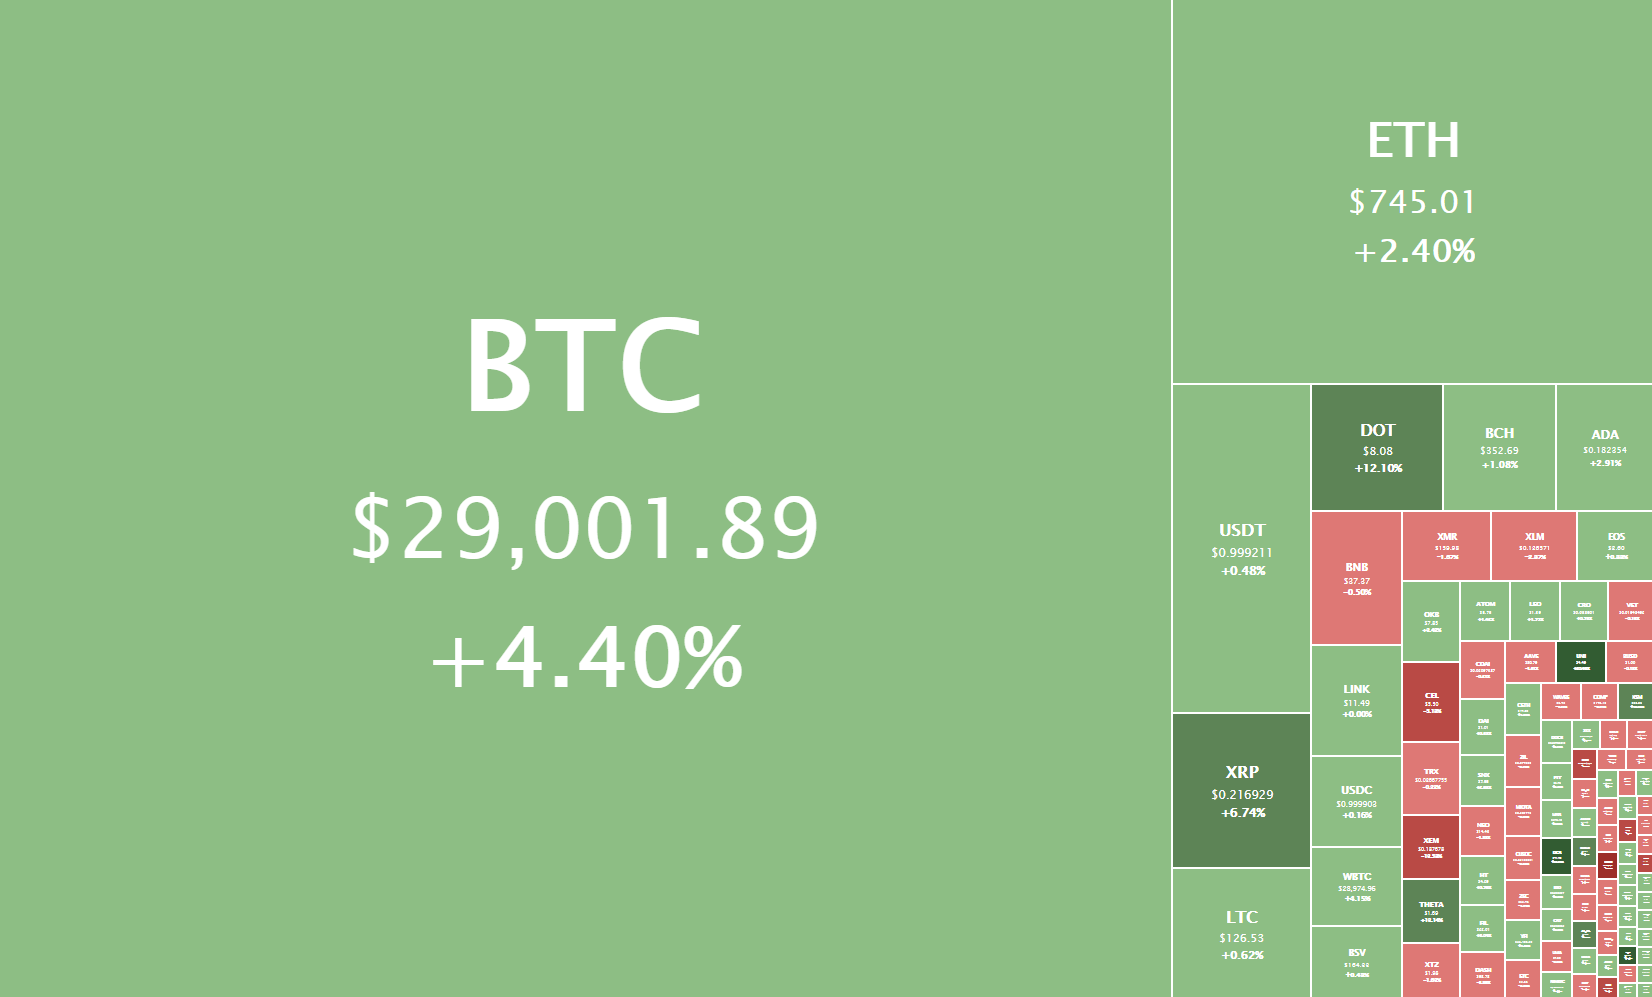
Daily Crypto Sector Heat Map
Yearn Finance Passive Income gained 759.27% in the past 24 hours, making it the most prominent daily crypto gainer by far. It is followed by DragonVein’s 268.8% and Gala’s 146.76% gain. On the other hand, BitBall lost 63.32%, making it the most prominent daily loser. It is followed by MITH Cash’s loss of 63.25% and Blue Whale Exchange’s loss of 53.96%.
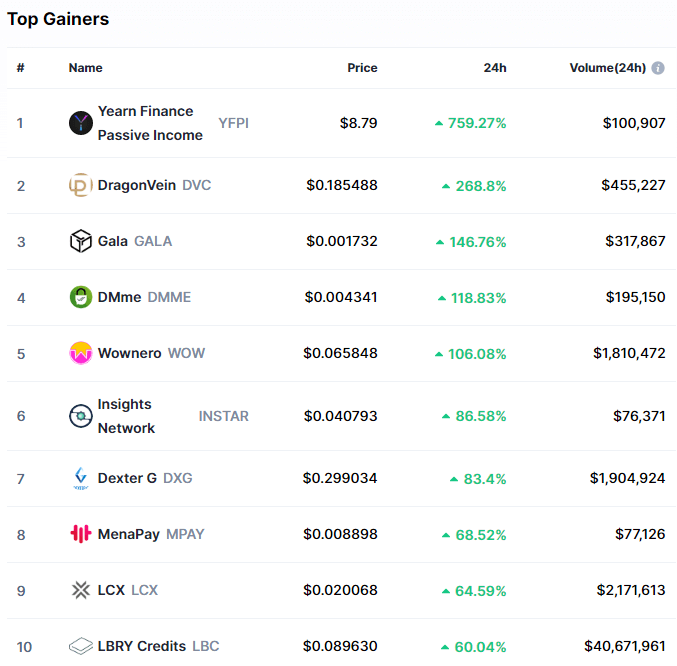
Top 10 24-hour Performers (Click to enlarge)
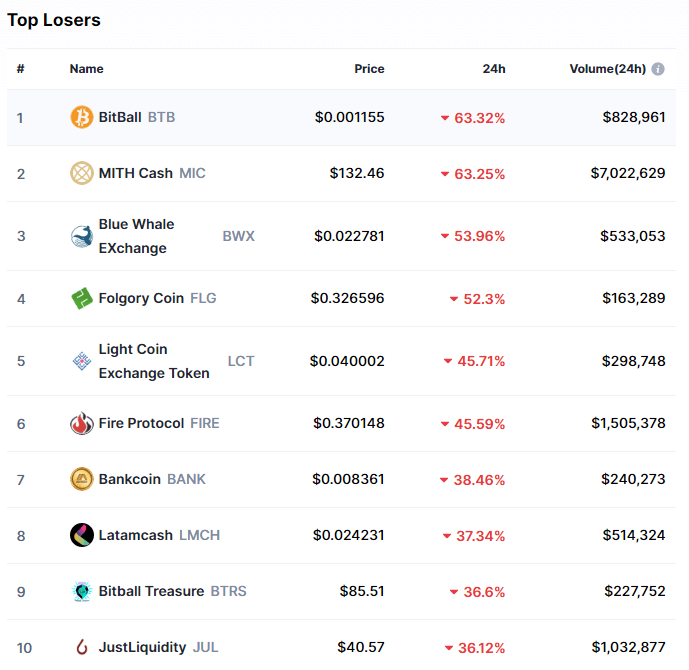
Bottom 10 24-hour Performers (Click to enlarge)
Bitcoin’s market dominance has moved up half a percent since our last report, with its value currently being 70.6%. This value represents a 0.5% difference to the upside than the value it had when we last reported.
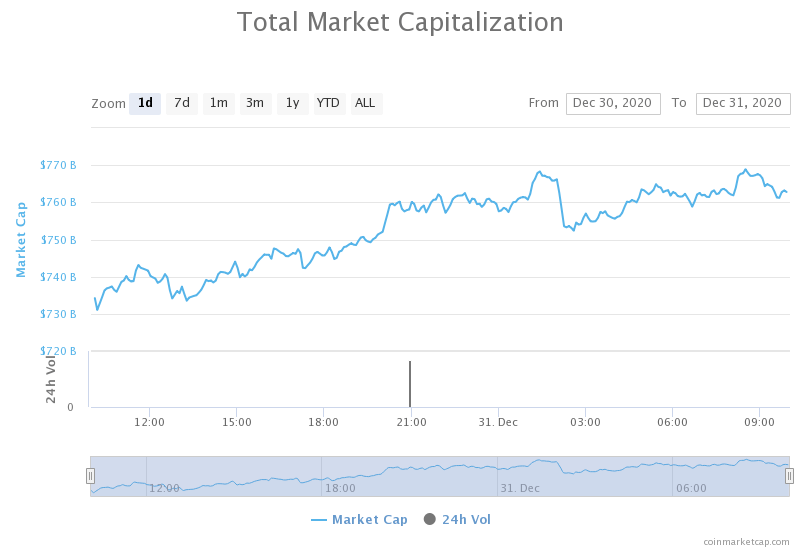
Daily Crypto Market Cap Chart
The cryptocurrency sector capitalization has increased since we last reported, with its current value being $762.78 billion. This represents a $25.47 billion increase when compared to our previous report.
_______________________________________________________________________
What happened in the past 24 hours?
_______________________________________________________________________
- December is already the second-biggest month ever for bitcoin on-chain volumes (The Block)
- Genesis tells customers it will suspend XRP trading and lending (The Block)
- VanEck refiles with SEC for bitcoin ETF (The Block)
- US announces that it will delist XRP in mid-January (The Block)
- Coinbase faces class action lawsuit in California over XRP sale (The Block)
- Ripple’s Regulatory Court Battle Will Begin In February (Cryptobriefing)
- Ripple Will Continue to Operate In U.S. Despite Lawsuit (Cryptobriefing)
- Cardano founder says XRP “not a security,” but there’s a catch (Cryptoslate)
- ‘Rat poison squared’ Bitcoin passes Warren Buffett’s Berkshire Hathaway by market cap (Cointelegraph)
- The US has already lost the 2020 crypto regulation race to Europe (Cointelegraph)
_______________________________________________________________________
Technical analysis
_______________________________________________________________________
Bitcoin
Bitcoin has continued its move up on slightly higher volume, breaking its $28,600 resistance level and entering unexplored territory. The push ended with bull exhaustion at the $29,300 mark, creating a new all-time high.
Bitcoin’s price has hit this level twice in a short span of time, creating a double top and propelling BTC slightly backward. Its price is currently trading below $29,000, in a range bound by $28,600 to the downside and $29,300 to the upside.
Even though a move towards $30,000 is quite possible, many analysts have pointed to enormous sell walls at and around this level, making it extremely hard to breakthrough.
BTC/USD 1-hour chart
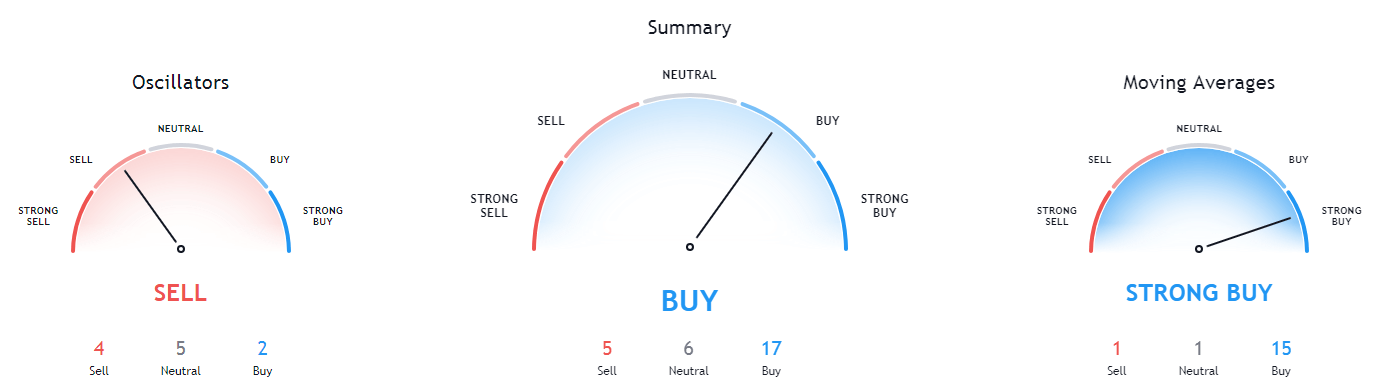
Bitcoin’s technicals are showing a strong tilt towards the buy-side. However, its oscillators are tilting towards bearishness due to the overextended move to the upside.
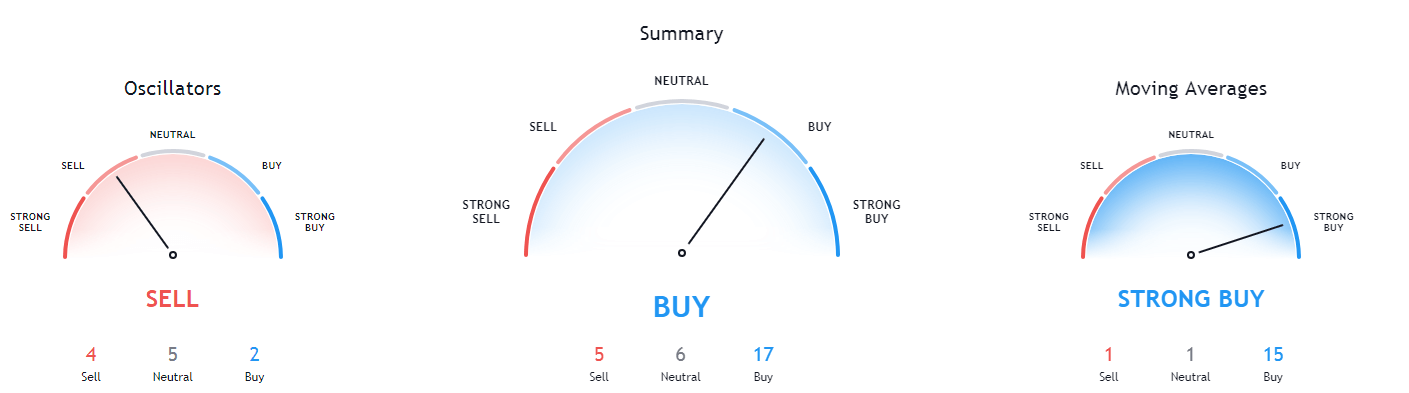
BTC/USD 1-day Technicals
Technical factors (4-hour Chart):
- Price is above its 50-period EMA and at its 21-period EMA
- Price is near its middle Bollinger band
- RSI is neutral (56.57)
- Volume is slightly above average
Key levels to the upside Key levels to the downside
1: $28,600 1: $28,391
2: $29,000 2: $25,512
3: $30,000 3: $24,696
Ethereum
Ethereum has sparked by Bitcoin’s push up, tried to break its most immediate resistance level of $747. While the second-largest cryptocurrency by market cap did manage to push through and reach $759 at one point, the bulls were not able to hold this level, which triggered a pullback below $747.
Ethereum is currently trading right below $747, with the 50-hour and 21-period 4-hour moving averages providing it support.
Ethereum is most likely in for a short-term correction as its volume is descending quickly after a failed attempt to tackle the upside.
ETH/USD 1-hour Chart
Ethereum’s technicals look very much like Bitcoin’s, with the overall tilt being towards the buy-side, with oscillators tilting towards bearishness.
ETH/USD 1-day Technicals
Technical Factors (4-hour Chart):
- Price is above its 50-period and at its 21-period EMA
- Price is near its middle Bollinger band
- RSI is neutral (50.10)
- Volume is descending from above-average levels
Key levels to the upside Key levels to the downside
1: $747 1: $675
2: $800 2: $653
3: $900 3: $632
Ripple
XRP gained over 5% on the day due to Bitcoin’s upwards-facing move pulling the market as a whole up. When looking at it from a technical standpoint, XRP managed to win the fight for $0.214, which is certainly a positive thing.
However, more bad news came out to the public, with even more exchanges suspending trading for XRP. Even though many analysts say that XRP is not a security, the sheer pressure that the SEC lawsuit exerts on the project caused almost every exchange and fund to distance themselves from Ripple and XRP, causing its price to crash.
XRP/USD 1-hour Chart
XRP’s technicals on all time-frames are tilted towards the sell-side, with only the daily overview being completely bearish.
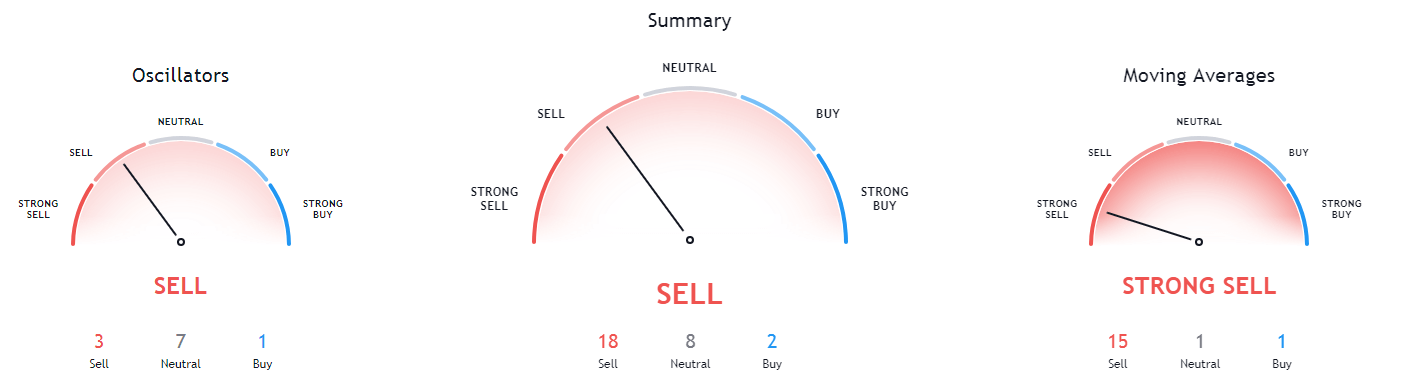
XRP/USD 1-day Technicals
Technical factors (4-hour Chart):
- Its price is currently at its 50-period EMA and below its 21-period EMA
- Price is at its middle Bollinger band
- RSI is in the oversold territory (50.22)
- Volume is currently on below-average levels
Key levels to the upside Key levels to the downside
1: $0.25 1: $0.214
2: $0.30 2: $0.14
3: $0.358
Related posts
 Daily Crypto Review, Oct 2 – Trump Tests Positive for COVID-19; Crypto and Stocks Negatively Affected
 Daily Crypto Review, Oct 6 – XRP Gains Over 10% As It Announces The Launch Of A New Crypto Exchange
 Daily Crypto Review, Oct 28 – Bitcoin Rushing Towards $14,000; Over 50% of US Investors Interested in Crypto
 Daily Crypto Review, Nov 13 – Bitcoin Above $16,000: What’s Next?